assessment ofsources and utilization … publications/fpb/zbb-2014...utilization offunding of state...
TRANSCRIPT
ASSESSMENT OF SOURCES ANDUTILIZATION OF FUNDING OF
STATE UNIVERSITIES AND COLLEGES
Rosario G. ManasanMa. Laarni D. Revilla
Philippine Institute for Development StudiesDepartment of Budget and Management
April 2015

Table of Contents
Pages
List of Figures ii
List of Tables 11
List of Box 111
List of Appendices iii
List of Acron)'lIls .iv
Executive Summary , v
1. INTRODUCTION 1
2. OVERVIEW OF NATIONAL GOVERNMENT SPENDING ON HIGHEREDUCATION ~ 3
3. SOURCES OF FUNDS 5
3.1. Major Sources of SUCs Receipts 6
3.2. Internally Generated Income of SUCs 7
4. USES OF FUNDS , 14
4.1. Uses ofNG Subsidy 14
4.2. Uses ofInternally Generated Income of SUCs 16
4.3. SUC Spending by Function 19
5. FISCAL SURPLUS OF SUCs 20
6. CONCLUSION AND RECOMMENDATIONS 24
6.1. Summary of Major Findings 24
6.2. Recommendations 26
Bibliography 29
APPENDICES 30

List of Figures
Figure 1. NG spending on SUCs, 2003-2012 3
Figure 2. Total SUCs higher education enrollment, 2003-2012 .4
Figure 3. Per student NG spending on SUCs, in current prices, 2003-2012 .4
Figure 4. Per student NG spending on sues, in 2000 prices, 2003-2012 5
List of Tables
Table 1. SUCs receipts, by major source, 2003-2012 5
Table 2. SUCs receipts per student, in current and in 2000 prices, by source 6
Table 3. Composition of internally generated income ofSUCs, 2003-2012 8
Table 4. Composition ofSUCs income from students. 2003-2012 8
Table 5. Internally generated income of SUCs, 2003-2012 9
Table 6. SUCs income from students vis-a-vis total SUCs expenditures, 2003-2012 10
Table 7. Per student SUCs receipts, by source, in current and in 2000 prices, 2003-2012 .... 11
Table 8. Tuition fees per unit in SUCs, undergraduate level, 2007-2012 11
Table 9. Per student SUCs receipts, by source and region, 2012 12
Table 10. Total SUCs spending, by economic category, 2003-2012 15
Table 11. SUCs spending per student, by economic category, in current and 2000 prices,2003-2012 ; 15
Table 12. Uses ofNG subsidy to SUCs, 2003-2012 16
Table 13. Proportion of SUCs spending funded from NG subsidy, 2003-2012 16
Table 14. Use of internally generated income of SUCs, 2003-2012 17
Table 15. Distribution ofSUC spending, by function, 2009 and 2012 20
Table 16. Fiscal surplus of all SUCs as a group, by source of funding, 2009-2012 21
Table 17. Fiscal surplus of average SUC, by size and source of funding, 2009 and 2012 22
Table 18. Number of SUCs with fiscal surplus, by size of SUC, 2012 22
11

List of Box
Box 1. COA: "Despite P168-M trust fund, state university fails to modemize" 22
List of Appendices
Appendix A. List of SUCs invited for FGD 31
Appendix B. Questionnaire 32
Appendix C. Sample of SIB for STF and RF 34
111
AGDBsBOR/TBSUCHEDCMOCNACOCOACSUDBMDBPDepEdDOSTFGDGAAGASHEDFHYSAIGIsIGPsJOLGUsMOOENBCNGNGOsPDAFPHEIsPSPUPRFSIBSTFSUCsTUPUP
List of Acronyms
- Authorized Government Depository Banks- Board of Regents/Trustees- Benguet State University- Commission on Higher Education- CHED Memorandum Order- Collective Negotiation Agreement- Capital Outlay- Commission on Audit- Cagayan State University- Department of Budget and Management- Development Bank of the Philippines- Department of Education- Department of Science and Technology- Focus Group Discussion- General Appropriations Act- General Administrative Services- Higher Education Development Fund- High-yield Savings Account- Internally Generated Income- Income Generating Projects- Job Orders- Local Government Units- Maintenance and Other Operating Expenditures- National Budget Circular- National Government- Non-government Organizations- Priority Development Assistance Fund- Private Higher Education Institutions- Personal Services- Polytechnic University of the Philippines- Revolving Fund- Statement of Income and Expenses- Special Trust Fund- State Universities and Colleges- Technological University of the Philippines- University of the Philippines
IV

Executive Summary
The implementation of the "Higher Education Modernization Act of 1997," CHEDMemorandum Order No. 20, and "Public Higher Education Reform Framework" granted stateuniversities and colleges (SUCs) the right to corporatize and manage their own incomes. Thus,given these laws and rules, an assessment/review on the income collection and utilization ofSUCs has become mandatory. This study aims to review the specific sources of internallygenerated incomes (IGI) of SUCs and analyze how these incomes are allocated and utilized. Italso evaluates the shares of the national government (NG) subsidy and internally generatedincome in terms of collection and usage.
Data revealed that total SUCs receipts grew by 8% yearly on the average from PhP 21.8 billionin 2003 to PhP 42.5 billion in 2012. However, the growth in total SUCs receipts was not enoughto compensate for inflation and the growth in number of students combined. Thus, total SUCsreceipts per student in 2000 prices in 2012 (PhP 20,600) is lower than its 2003 level (PhP25,800) and its peak level in 2007 (PhP 27,500).
SUCs in the aggregate have made some progress towards greater fiscal self-reliance in 2003-2012. A shift in the composition of SUCs' receipts in favor of internally generated income isevident during the period as SUCs' receipts from their internally generated income grew morethan thrice as fast as NG subsidy during the period. However, the nominal growth in SUCsinternally generated income, which indicates SUCs self-reliance, decelerated after the initialsurge in 2003-2006.
Moreover, the share of income from students, which accounts for the major part of SUCs totalinternally generated income, has increased from 63% in 2003 to 70% in 2012. This wasachieved largely by raising other school charges rather than increasing tuition fees per se asSUCs have tried to deflect the students' protests that are associated with tuition fee increases.
On the other hand, contrary to expectations that IGPs will make a significant contributiontowards making SUCs more self-reliant financially, the contribution of IGPs in total SUCsreceipts has remained modest and has, in fact, dwindled in 2003-2012. Also, several practiceshampers the monitoring and analysis of the results of operations of each individual IGPs which isimportant in evaluating whether said IGPs are actually making a net contribution to the SUCscoffers.
In terms of uses of funds, the growth in total SUCs spending in 2003-2012 was not enough tokeep pace with both inflation and the growth in SUCs enrollment. As a result, total SUCsexpenditures per student in 2000 prices went down from PhP 24,300 in 2003 to PhP 19,300 in2012. Spending on personal services (PS) captured the lion's share (68%) in total SUCs spendingduring the period. On the other hand, MOOE and CO accounted for 24% and 8%, respectively.However, the share ofPS in total SUCs expenditure declined from 76% in 2003 to 68% in 2012.This contraction in the relative share of PS in total SUC spending is indicative of theunderfunding of PS among SUCs.
v

On the average, 90% of total PS spending of all SUCs in the aggregate was funded from the NGsubsidy in 2003-2012 compared to 40% for MOOE and 34% for CO. The share of SUCsspending that is funded from NG subsidy contracted for all economic categories between 2003and 2012. To wit, the share of NG subsidy in total PS spending of all SUCs went down from93% in 2003 to 88% in 2012 while that of MOOE shrank from 54% to 33% and that of COspending decreased from 40% to 2%. MOOE received higher priority in the allocation of SUCsinternally generated income compared to CO and PS, with PS receiving the lowest priority.
The FGDs conducted for this study reveal that SUCs use their internally generated income thatare lodged in their STFsl RFs for the salaries of part-time and contractual faculty and lecturersbecause the PS budget from GAA is not enough to cover all their PS requirements. However, theuse of the SUCs' internally generated income for PS appears to be stymied by inconsistencybetween the provisions of COA Circular No. 2000-002 and that of the GAA for various yearswith regards to the use of SUCs IGI for PS. This results in some unevenness in the way COAauditors treat SUCs in this respect and in the lower allocation for PS from the IGI despite someevidence of PS underfunding.
The non-uniform treatment of SUCs' use of their IGI to pay for PRAISE incentives, CNAbenefits and other allowances by COA auditors has also been observed. SUC officials argue thatCOA Circular 2000-002 provides that SUCs may use their internally generated income for thepayment of allowances to teachers. On the other hand, the concerned COA auditors point outthat, as per the Civil Service Commission, PRAISE incentives should be sourced from the SUCs'savings while the CNA benefits are meant to be paid out of the SUCs GAA appropriations.
Function-wise, while the majority (74%) of SUCs' total spending is allocated to instruction!education in 2012 the shares of GAS (18%) and auxiliary services (3%) in total SUC spendingappear to be disproportionately large relative to research and extension (which each received 2%of the total SUC spending) considering that research and extension are two of the three coremandates of SUCs.
Furthermore, there have been issues and concerns relating to the fiscal surplus of SUCs. Notethat while the fiscal surplus of all SUCs in the aggregate appears to be large, the fiscal surplusnumbers. do not appear to be quite as significant if one looks at the fiscal surplus of individualSUCs. Also, the fiscal surplus numbers of SUCs do not look as alarming if one compares theSUCs' fiscal surplus with their total receipts. On the average, the fiscal surplus of all SUCs inthe aggregate is equal to 7% of their total receipts (or equivalent to a month's worth of receipts)in 2006-2012.
Given these findings, the study recommends the following:
(i) Adopt a socialized tuition fee scheme by SUCs and allocate increased funding tostudent financial assistance programs by the national government coupled withimproved targeting of the financial assistance to poor students in order to help SUCsachieve some balance between the need to improve resource generation and the needto ensure the poor's access to higher education;
VI

(ii) Enjoin SUCs to offer programs which are not part of their core mandates providedthey operate the delivery. of said programs on a self-sustaining basis by chargingtuition fees that approximate the amount need for full cost recovery;
(iii) Strengthen the financial management ofIGPs to ensure that SUCs' IGPs are making apositive net contribution to the coffers of SUCs;
(iv) Focus the use of the internally generated income of SUCs on their core mandates byrevisiting the allocation for production in CMO 20-s20l1 and rationalizing theallowances and other benefits that may be charged against the internally generatedincome of SUCs;
(v) Resolve the inconsistency between the provisions of COA Circular No. 2000-002 andthose of the General Appropriations Act with respect to the use of SUCs' internallygenerated income for the creation of new positions and the payment of salaries andallowances of regular/ permanent, contractual, and part-time faculty;
(vi) Improve expenditure programming and procurement planning. so as to minimizedelays in project implementation to ensure that the benefits are realized sooner ratherthan later;
(vii) Explore greater flexibility in the use of some of the fiduciary fees (e.g., library fees,athletic fees) that SUCs collect;
(viii) Offer the Grades 11 and 12 in SUCs, at least in the interim, to enable SUCs to recover(fully or partially) the income they are likely to lose when the Senior High Programstarts in school year 2016.
Keywords: state universities and colleges (SUes), income utilization, national governmentsubsidies, internally generated income, receipts, expenditures, income generatingprojects (IGPs), special trust fund, revolvingfund
VB

ASSESSMENT OF SOURCES AND UTILIZATION OF FUNDING OFSTATE UNIVERSITIES AND COLLEGES
Rosario G. ManasanMa. Laarni D. Revilla
1. INTRODUCTION
Funding support for the different state universItIes and colleges (SUCs) come from thefollowing: (1) government subsidies allocated in the General Appropriations Act (GAA); (2)incomes generated from various sources such as fees and charges, among others; (3) HigherEducation Development Fund (HEDF) being managed by the Commission on Higher Education(CHED); (4) grants provided by both international and local institutions/entities; and (5) thePriority Development Assistance Fund (PDAF) prior to its abolition.
Republic Act 8292 or the "Higher Education Modernization Act of 1997" granted corporatepowers to the Governing Boards of SUCs. RA 8292 not only effectively broadened the resourcebase of the SUC sector but also gave individual SUCs greater discretion in the utilization of theincome they generate. Specifically, RA 8292 allow SUCs (i) to retain any income that theygenerate from tuition fees and other charges, the operation of auxiliary services and incomegenerating projects and to utilize said income for instruction, research, extension and other SUCsprograms in accordance with a budget approved by their Board of Regents/ Trustees (BOR/T),(ii) to enter into joint ventures with business and industry for the profitable development andmanagement of their economic assets, the proceeds of which can be used for the SUCs'development, and (iii) to privatize, when advantageous to the SUC, management and non-academic services such as. health, building! grounds maintenance and the like. In effect, thesepowers will allow SUCs to be more fiscally self-reliant by mobilizing increased funding supportfrom all stakeholders (government, students, and the private sector) to augment budgetarysupport coming from national government appropriations. Moreover, it is envisioned that thedelegation of resource allocation authority to the respective BOR/T of SUCs will result inimprovements in the delivery of their core mandates: instruction, research and extension.
RA 8292 provides that tuition fees, other school charges and other income generated by SUCsshall be deposited in authorized government depository banks (AGDBs) and shall be constitutedas a special trust fund (STF). In tum, Commission on Audit (COA) Circular No. 2000-002,which establishes the accounting guidelines and procedures that governs the use of SUCs incomepursuant to RA 8292, provides, inter alia, that (i) "in no case shall the STF be used for thepayment of salaries and creation of new positions," and (ii) "the STF shall be used to augmentMOOE and capital outlays of the university (college) and to pay authorized allowances andfringe benefits to teachers and students who render services to the school." The issuance ofCHED Memorandum Order (CMO) No. 20 dated August 4, 2011, further enhanced the policiesand guidelines governing the use of income, special trust fund and programs of receipts andexpenditures of SUCs. In particular, it provides indicative percentages of act]lal tuition feescollected that shall be allocated for instruction (including the payment of permanent facultyoverload and faculty development, curriculum development, student development and of
1

facilities development), research, extension, production, administrative services, and mandatoryreserves. On the other hand, the General Appropriations Act (GAA) from 2012 onwards alsoauthorizes SUCs to use their income for the creation of additional positions, subject to theDepartment of Budget and Management (DBM) rules and regulations. In addition, the GAA ofvarious years make reference to the adoption of measures implementing cost recovery andsocialized scheme in the setting of tuition fees and other school fees. Likewise, the "PublicHigher Education Reform Roadmap," formulated in 2012, aims to improve SUCs' efficiencythrough the maximization of resource generation and the rationalization of resource utilization inthe SUC sector. Specifically, the said roadmap identifies the following strategies in support ofthe aforementioned thrust: (i) assets inventory and preparation and implementation of necessarybusiness plans that will make use of idle lands and assets including engaging in incomegenerating projects (IGPs) in partnership with the private sector, (ii) application of normativefinancing in the allocation of GAA resources, (iii) adoption of socialized tuition fee schemes,and (iv) improvements in public financial management.
Sixteen (16) years since the grant of corporate powers to SUCs, a comprehensive assessment ofresource generation and utilization in the SUC sector is but timely. In line with this, the presentstudy will review and assess sources and uses of funds by SUCS and relate the use of SUCs'incomes vis-a-vis the regular subsidy provided by the national government (NG).
As part of this assessment, this study reviewed and analyzed the financial statements thatindividual SUCs have submitted to the DBM and COA in 2006-2012. It also conducted focusgroup discussions (FGDs) with SUCs officials in in various locations around the country: (i)Manila, (ii) La Union, (iii) Davao, and (iv) Bacolod. The FGDs included representatives fromSUCs within and near each area. There was a total of 25 invited SUCs (see Appendix A), whichwere chosen based on their total enrollment. Further, online questionnaires (see Appendix B)were sent to those SUCs that were invited but could not send a representative to the FGDs.
The discussions during the FGDs revolved around the processes and issues involved in allocatingand utilizing SUCs' internally generated income (IGI). Through these FGDs, the SUCs were ableto voice out their own experiences and issues in generating income and utilizing the same. Thesummary of responses made by SUCs respondents are available upon request from the authors.Insights from the FGDs were further enriched by a reading of COA Audit Reports.
The succeeding sections of the paper are as follows. Section 2 gives an overview of the state ofNG spending on higher education. Section 3 analyzes the sources of SUCs receipts while Section4 analyzes the utilization of SUCs funds based on their Consolidated Statement of Receipts andExpenditures as submitted to the DBM. Section 4 also includes a discussion of the issues relatedto the processes involved in allocating and utilizing SUCs' own income that emerged from theFGDs and a reading of COA Audit Reports. On the other hand, Section 5 tackles issues of SUCsfiscal surpluses. Finally, Section 6 concludes the paper and provides policy recommendations.
2

2. OVERVIEW OF NATIONAL GOVERNMENT SPENDING ON HIGHEREDUCATION
The government's spending on public higher education exhibited a well-defined upward trend in2003-2012 (Figure 1). However, a slowdown in the growth in NO spending on higher educationis evident in more recent years (i.e., 2009-2012) relative to earlier years (i.e., 2003-2009). Saiddeceleration in the growth of NO spending on SUCs is consistent with the government's thrustfor SUCs to be more self-reliant in terms of generating income.
The impact of this movement on per student NO spending on SUCs is magnified given that thegrowth in total SUCs enrollment accelerated quite dramatically during the period, from 3%yearly on the average in 2003-2009 to 12% yearly on the average in 2009-2012 (Figure 2). Suchrapid expansion in SUCs enrollment without a corresponding increase in NO subsidy to SUCsmeans thatSUCs have to find ways to be more financially ready to meet the needs of theirstudents for additional faculty, equipment, and other facilities.
Figure 1. NG spending on SUCs, 2003-2012
3C,OOC
Q.. 25,000..cCL
cQ 2.0,000
E15:000
.::f2OJ~ 10,000~
5,000
2003 2005 2005 2007 2008 2009 2010 2011 2012
Year
Source of basic data: DBM
While per student NO spending in current prices appears to be fairly stable in 2003-2012 (Figure3), per student NO spending in 2000 prices exhibited a sharp downward trajectory during thesame period (Figure 4). As discussed earlier, this trend may be explained by the anemic growthNO spending on SUCs even as the enrollment in SUCs grew upwards of 10% in 2006-2012(Manasan,2012).
3

Figure 2. Total SUCs higher education enrollment, 2003-2012
1,400,000
1,200,000
1,000,000
.•..• 800,000cQJ
E"0 600,000'-C
L.W
400,000
200,000
2003 2004 2005 2006 2007 2008 2009 2010 2011 2012
Year
Source: CHED MIS
Figure 3. Per student NG spending on SUCs, in current rices, 2003-2012
35,000
30,000
25,0000-..ca- 20,000c
Vl 15,000())
>Cl!-' 10,000
5,000
2003 2006 2007 2008
Year2.009 201.0 2011 2012
Source of basic data: DBM and CHED MIS
4

Figure 4. Per student NG s endin on SUCs, in 2000 prices, 2003-2012
25,000
20,000
a:--=-0... 15,000c
.!:!:!<lJ
10,000>(l)
-'5,000
2003 2006 2007 2008
Year
2009 2010 201.1 2012
Source of basic data: DBM and CHED MIS
3. SOURCES OF FUNDS
Total SUCs receipts grew from PhP 21.8 billion in 2003 to PhP 42.5 billion in 2012 (Table 1).While the 8% average yearly increase in SUCs receipts in 2003-2012 is higher than the averageyearly growth in higher education enrollment in SUCs during the same period, it is not enough tocompensate for inflation and the growth in number of students combined. Thus, total SUCsreceipts per student in 2000 prices in 2012 (PhP 20,600) is lower than its 2003 level (PhP25,800) and its peak level in 2007 (PhP 27,500) [Table 2].
Table 1. SUCs receipts, by major source, 2003-2012Internally Internally
NO.ofSUCshigherNG subsidy generated Total receipts NG subsidy generated Total receipts
educationincome income
studentsLevels (in million pesos) Distribution (0/0)
2003 17,906 3,903 21,809 82.1 17.9 100.0 7363662006 18,857 6,625 25,482 74.0 26.0 100.0 6919512007 20,372 7,995 28,367 71.8 28.2 100.0 7339612008 22,769 9,650 32,419 70.2 29.8 100.0 8080282009 25,363 10,771 36,135 70.2 29.8 100.0 8841222010 26,710 11,124 37,834 70.6 29.4 100.0 10408592011 29,067 12,740 41,807 69.5 30.5 100.0 1045940j2012 27,845 14,668 42,513 65.5 34.5 100.0 1234125'
1Growth rate (0/0)
I2003-2006 1.7 19.3 5.3 -0.1!2006-2009 10.4 17.6 12.3 8.5!2009-2012 3.2 10.8 5.6 11.8
1
!
2006-2012 6.7 14.2 8.9 10.11
2003-2012I
I 5.0 15.8 7.71 I . 5.91Source of basic data: DBM and CHED MIS
5

3.1. Major Sources of SUCs Receipts
In addition to the allocation that SUCs receive from the national government under the GeneralAppropriations Act of various years, the "Higher Education Modernization Act of 1997,"authorized SUCs to retain and utilize their internally generated income. Thus, SUCs receiptscome from two major sources: (i) NG subsidy, and (ii) internally generated income.
SUCs in the aggregate have exhibited some gains towards improving the financial sustainabilityof their operations in 2003-2012. While the subsidy from the national government continues toaccount for the bulk of total receipts of SUCs in 2003-2012, a shift in the composition of SUCs'receipts is evident during the period. Table 1 shows that the share ofNG subsidy in total SUCs'receipts contracted from 82% in 2003 to 66% in 2012. Conversely, the share of internallygenerated income expanded from 18% in 2003 to 35% in 2012. This came about as SUCs'receipts from their internally generated income grew more than thrice as fast as NG subsidybetween 2003 and 2012. To wit, SUCs' internally generated income increased by an average of16% per year in 2003-2012 while NG subsidy to SUCs rose by an average of 5% per year.
Table 2. SUCs receipts per student, in current and in 2000 prices, by sourcein current prices in 2000 prices
Internally InternallyNG subsidy generated Total NG subsidy generated Total
income incomeLevels (in pesos)
2003 24,317 5,300 29,617 21,163 4,613 25,7752006 27,252 9,574 36,827 19,973 7,017 26,9892007 27,739 10,886 38,625 19,749 7,750 27,4992008 28,179 11,942 40,121 18,674 7,914 26,5882009 28,687 12,183 40,871 18,542 7,875 26,4172010 25,661 10,688 36,349 16,250 6,768 23,0182011 27,790 12,181 39,971 16,918 7,415 24,3332012 22,563 11,885 34,448 13,479 7,100 20,580
average 18,094 7,057 25,150
Growth rate (%)2003-2007 3.3 19.7 6.9 -1.7 13.8 1.62006-2009 1.7 8.4 3.5 -2.4 3.9 -0.72009-2012 -7.7 -0.8 -5.5 -10.1 -3.4 -8.0
2006-2012 -3.1 3.7 -1.1 -6.3 0.2 -4.42003-2012 -0.8 9.4 1.7 -4.9 4.9 -2.5
Source of basic data: DBM and CHED MIS
However, the progress that SUCs have achieved in the earlier years of the period under study interms of greater self-reliance has faltered. The nominal growth in SUCs internally generatedincome decelerated after the initial surge in 2003-2006. As a result, the creditable nominalincrease in SUCs internally generated income in 2009-2012 (10% per year) has not been enoughto compensate for the combined effects of (i) inflation and (ii) the rapid increase in enrollmentduring the period. Thus, per student internally generated SUCs income in 2000 prices declined
6

from its peak level of PhP 7,900 in 2008-2009 to PhP 7,100 in 2012, roughly equal to its 2006level (Table 2).
In comparison, the growth of NO subsidy to SUCs (7% yearly) is not only considerably slowerthan that of their internally generated income (14%) in 2006-2012 but is also no match to thegrowth in enrollment (10%) during the period (Table 1). Thus, per student NO subsidy to SUCsin nominal prices went down by 3% yearly on the average from PhP 27,200 in 2006 to PhP22,500 in 2012. After adjusting for inflation, the decline in per student NO subsidy in 2000prices is necessarily even sharper - 6% yearly on the average from PhP 20,000 in 2006 to PhPPhP 13,500 in 2012 (Table 2).
3.2. Internally Generated Income of SUCs
SUCs' internally generated income may be categorized into two major sources: (i) income fromstudents, and (ii) income from the auxiliary services they provide (like dormitories, cafeterias/canteens and the like) and from the income generating projects they operate (like agriculturalproduction, commercial activities and the like). In tum, SUCs income from students consists of(i) tuition fees, and (ii) other school charges like miscellaneous fees, matriculation fees, andlaboratory fees.
It is typical for income from student-related fees such as tuition fees, affiliation fees, library fees,and other fiduciary fees to be constituted into a special trust fund (STF). On the other hand,income from their lOPs is constituted into revolving fund/s (RF). The RF is treated as a se1f-liquidating fund and the collections from this fund are used for the operating expenses of thelOPs. Appendix C shows examples of an STF and an RF from Benguet State University (BSU)for the year 2013. The examples exhibit the type of income collected under and the expensesdirectly charged against each kind of fund.
Income from students contributes the greater part of SUCs total internally generated income in2003-2012. Moreover, the share of income from students in total SUCs internally generatedincome has.increased during the period despite the numerous and stringent protests from studentsthat usually follow increases in tuition and other school fees. On the average, close to 67% oftotal internally generated SUCs income in 2003-2012 were collected from students while 23% oftotal internally generated SUCs income was contributed by income from their income generatingprojects and other self-sustaining activities. Also, the share of SUCs receipts from students intotal SUCs receipts expanded from 63% in 2003 to 70% in 2012 while that of SUCs incomefrom their income generating projects and other self-sustaining activities contracted from 24% to20% (Table 3).
7

Table 3. Composition of internally generated income of SUCs, 2003-2012Other Total IncomeIncome SUCs from IGPs
Tution Grants andFees Collected Receipts and Self- Donations
from from sustainingStudents Students Activities
2003 43.3 19.8 63.1 24.1 3.2 9.5 100.02005 47.3 19.0 66.3 22.0 1.3 10.4 100.02006 46.0 17.8 63.8 24.0 2.9 9.3 100.02007 47.2 17.8 65.0 25.9 2.4 6.6 100.02008 43.5 20.5 64.0 23.6 3.0 9.5 100.02009 41.4 22.0 63.4 24.3 3.0 9.2 100.02010 47.5 23.1 70.6 22.0 1.6 5.9 100.02011 46.5 25.6 72.1 17.8 2.0 8.1 100.0.2012 44.8 24.9 69.8 19.6 3.1 7.5 100.0
2006-2012 45.3 21.7 67.0 22.5 2.6 8.0 r100.0r,2003-2012 45.3 21.2 66.5 22.6 2.5 8.4 100.0,Source of basic data: DBM-
Income from Students
Tuition fees account for the bulk of total sUCs income from students all throughout 2003-2012.However, a shift in favor of "other income collected from other students" is evident during theperiod. Apparently, SUCs have tried to deflect the students' protests that are associated withtuition fee increases by raising other school fees instead of tuition fees per se.
On the average, 68% of total income from students came from tuition fees while the remaining32% was from "other income collected from students" in 2003-2012 (Table 4). While thegrowth in SUCs receipts from both tuition fees and "other income from students" were fairlysignificant in 2003-2012 (Table 5), receipts from the latter registered slightly better growth thanreceipts from the former. Thus, the share of tuition fees in totalSUCs income from studentscontracted from a peak of 73% in 2007 to a low of 64% in 2012 while the share of "other incomefrom students" expanded from 27% to 36% (Table 4).
Table 4. Composition of SUCs income from students, 2003-2012Other
TutionIncome
FeesCollected Total
fromStudents
-2003 68.6 31.4 100.02005 71.3 28.7 100.02006 72.1 27.9 100.02007 72.6 27.4 100.02008 68.0 32.0 100.02009 65.3 34.7 100.02010 67.2 32.8 100.02011 64.5 35.5 100.02012 64.3 35.7 100.0
2006-2012 67.7 32.3 100.02003-2012 68.2 31.8 100.0
Source of basic data: OEM
8

Table 5. Internally generated income of sues, 2003-2012Other IncomeIncome Total sues fromIGPs
Tution Fees CollectedReceipts and Self- Grants and Othersfrom Donations
from Studentssustaining
Students Activities
Levels (in million pesos)2003 1,692 774 2,466 940 125 373 3,904 i2005 2,683 1,079 3,762 1,245 73 589 5,669 I
2006 3,048 1,178 4,226 1,593 190 616 6,6252007 3,770 1,426 5,196 2,076 194 529 7,9952008 4,199 1,980 6,179 2,273 286 912 9,6502009 4,461 2,371 6,832 2,619 327 992 10,7702010 5,281 2,574 7,855 2,442 173 654 11,1242011 5,921 3,260 9,181 2,270 257 1,032 12,7402012 6,578 3,657 10,235 2,872 455 1,106 14,668
Growth rate (%)
2003-2006 21.7 15.0 19.7 19.2 15.0 18.2 19.32006-2009 13.5 26.3 17.4 18.0 19.8 17.2 17.62009-2012 13.8 15.5 14.4 3.1 11.7 3.7 10.8
2006-2012 13.7 20.8 15.9 10.3 15.7 10.2 14.22003-2012 16.3 18.8 17.1 13.2 15.4 12.8 15.8,
Source of basic data: DBM
Notwithstanding the increasing share of total SUCs income from students in 2003-2012, theirpotential to further increase the contribution of tuition fees and other school charges to totalSUCs income continuous to be significant. First, despite references in the GeneralAppropriations Act (of various years as early as 2005) to the setting of tuition fees and otherschool charges that implement a cost recovery program without sacrificing access of poorstudents, SUCs income from students accounts for only 26% of total SUCs expenditures at themaximum in 2003-2012 (Table 6). Second, although the nominal growth in receipts from tuitionfees and other SUCs income from students in 2006-2012 was creditable, it was whittled away byinflation and the growth in enrollment. Thus, per student receipts from tuition fees and otherschool charges in 2000 prices stood at PhP 3,184 in 2012, 13% lower than the peak level ofPhP3,655 in 2007 (Table 7). Third, school fees in SUCs are generally low when compared withthose of private higher education institutions (PHEIs). Per student total SUCs receipts fromstudents (i.e., sum of tuition fees and other income from students) in current prices is estimatedto be PhP 8,300 in 2012 or about PhP 4,150 per student per semester, substantially lower thantuition fees and other school fees charged by PHEIs (Table 7). This is not surprising given thatthe modal average tuition fee per unit in the undergraduate program in SUCs has remained atPhP 100 in 2007-2012 (Table 8). The Cagayan State University (CSU) charges no tuition fee perunit, while the Polytechnic University of the Philippines (PUP) offers the next lowest tuition fee(PhP 12) among all SUCs during the same year. In contrast, the University of the Philippines(UP) has the highest tuition fee per unit (PhP 1,000) among all SUCs in 2012.
9

There is also a wide variation in per student SUCs receipts from school fees. For instance, perstudent SUCs receipts from tuition fees and other school charges in Region I (Hocos) is 33%lower than the national average while that in Region IV-A (CALABARZON) is 38% higher thanthe national average (Table 9).
Table 6. SUCs income from students vis-a-vis total SUCs expenditures, 2003-2012Inc fro students Total sues expd (1)/(2)
(2) %2003 2,466 20,555 12.02006 4,226 24,241 17.42007 5,196 25,875 20.12008 6,179 29,428 21.02009 6,832 33,303 20.52010 7,855 36,106 21.82011 9,181 37,383 24.62012 10,235 39,772 25.7
Source of basic data: DBM
Issues related to tuition fees and other school charges
• SUCs officials invariably point to the difficulty of achieving a balance between the needto improve resource generation through some measure of cost recovery in the setting oftuition and other school fees and the need to ensure the poor's access to higher education(two of the objectives of the Higher Education Reform Agenda). There are several waysof addressing this. One is through the adoption of a socialized tuition fee scheme, similarto what the University of the Philippines (UP) implements, wherein the fees to be paid bythe student depend on the family's income with lower income families being entitled tolower tuition fees than their better-off counterparts. Alternatively, the allocation ofincreased funding to student financial assistance programs by the national governmentcoupled with improved targeting of the financial assistance to poor students will enhanceinclusive access even if the degree of cost recovery in SUCs is increased. In contrast, tohelp improve cost recovery, some SUCs collect higher tuition fees for programs that arenot part of their core mandate. One school, for example, collects higher tuition for threeprograms which are not part of their core mandate: Accountancy, Nursing, and Pharmacyprograms. As such, said programs are treated as self-sustaining programs.
• Non-payment of tuition fees is a persistent challenge for many SUCs. Not all students areable to pay their tuition on time and in full. To help students, many SUCs offer academicand research scholarships and grants that usmilly come from the GAA, CHED,Department of Science and Technology (DOST), non-government organizations (NGOs),and other private benefactors.
10
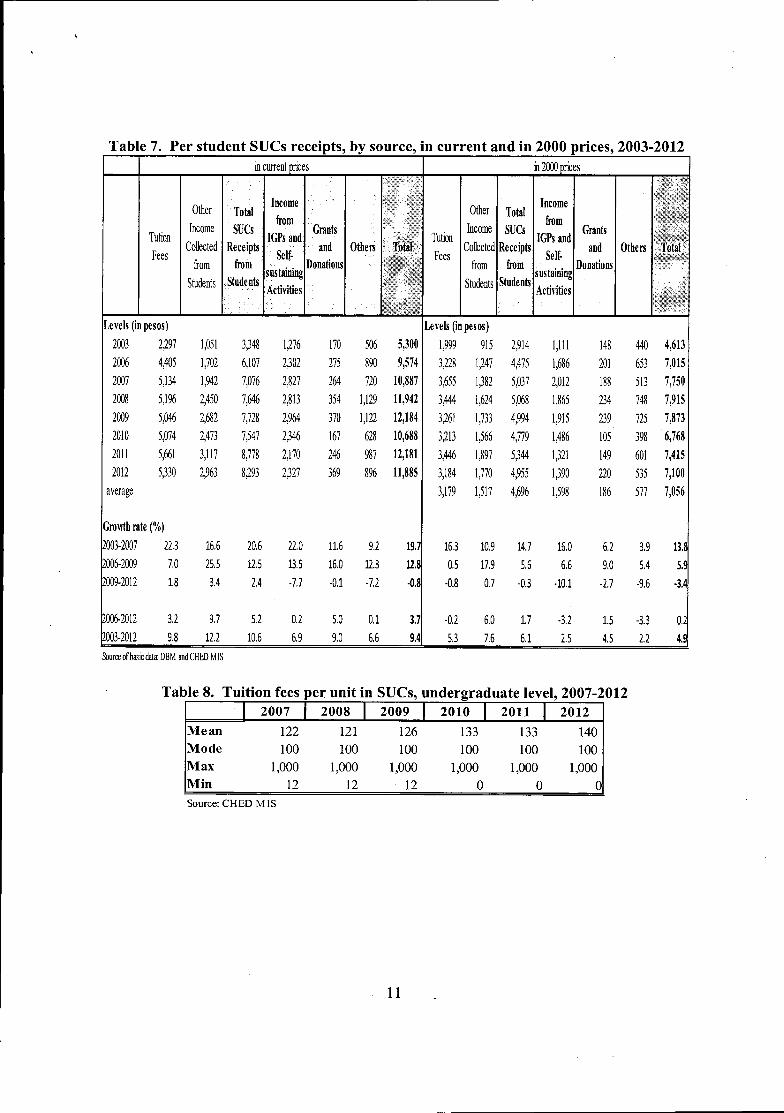
Table 7. Per student sues receipts, by source, in current and in 2000 prices, 2003-2012incurrent prices in2000 prices
Other Other TotalIncomeTotal
Income Income suesfrom
GrantsTurion Tution IGPs andCollectedFees
Collected Receipts Self. and OthersFeesfrom from from t . . Donationssus allling
Students Students Stude nts A . ..ctivllies
Levels (in pesos) Levels (in pesos)2003 2)97 1,051 3,348 1)76 170 506 5,300 1,999 915 2~14 I,m 148 440 4,6132006 4,405 1,702 6,107 2~02 275 890 9,574 3)28 1)47 4,475 1,686 201 653 7,0152007 5,134 1,942 7,076 2,827 264 720 10,887 3,655 1~82 5,037 2,012 188 513 7,7502008 5,196 2,450 7,646 2,813 354 1,129 1l,942 3,444 1,624 5,068 1,865 234 748 7,9152009 5,046 2,682 7,728 2~64 370 1,122 12,184 3)61 1,733 4~94 1,915 239 725 7,8732010 5,074 2,473 7,547 2~46 167 628 10,688 3)13 1,566 4,779 1,486 105 398 6,7682011 5,661 3,117 8,778 2,170 246 987 12,181 3,446 1,897 5~44 1~21 149 601 7,4152012 5,330 2,963 8)93 2~27 369 896 1l,885 3,184 1,770 4~55 1~90 220 535 7,100
average 3,179 1,517 4,696 1,598 186 577 7,056
Gro"th rate (%)003.2007 22.3 16.6 20.6 22.0 11.6 9.2 19.7 16.3 10.9 14.7 16.0 6.2 3.9 13.006-2009 7.0 25.5 12.5 13.5 16.0 12.3 U.8 0.5 17.9 5.6 6.6 9.0 5.4 5.009.2012 1.8 3.4 2.4 -7.7 -0.1 .7.2 -0.8 .0.8 0.7 -0.3 .10.1 -2.7 -9.6 -3.
3.2 9.7 5.2 0.2 5.0 0.1 3.7 .0.2 6.0 1.7 .3.2 1.5 -3.3 0.29.8 12.2 10.6 6.9 9.0 6.6 9.4 5.3 7.6 6.1 2.5 4.5 2.2 4.9
Sourre of basic data: DHM and CHED MIS
MeanModeMaxMinSource: CHED MIS
11

Table 9. Per student sues receipts, by source and region, 2012Other
TotalIncome
Income from IGPs GrantsTution Collected Income and Self- and Others TotalFees from from sustaining Donations
Students Students Activities(in 2012 pesos)
National Capital Region 4,973 2,913 7,887 4,218 312 2,351 14,768 1
Region I - Ilocos 3,768 1,780 5,547 1,614 469 1,352 8,983Cordillera Adnrinistrative Region 4,584 3,620 8,204 2,198 251 - 10,653Region 11- Cagayan Valley 5,650 1,459 7,110 704 163 10 7,986Region III - Central Luzon 6,924 3,054 9,979 1,614 177 637 12,406 ,
Region IV-A - CALABARZON 5,999 5,471 11,469 3,182 84 13 14,748 1
Region IV-B - MIMAROPA 5,195 3,691 8,885 1,212 444 1,915 12,457Region V - Bicol 5,737 2,286 8,022 1,275 212 101 9,610
!Region VI - Westem Visayas 5,198 3,502 8,700 3,968 574 153 13,395Region VII - Central Visayas 5,802 4,359 10,161 417 225 308 11,110
IRegion VIII - Eastem Visayas 5,189 1,857 7,046 2,634 1,283 1,644 12,606Region IX - Zamboanga Peninsula 2,303 3,700 6,003 450 17 307 6,777Region X - Northem Mindanao 6,272 2,668 8,940 3,313 926 882 14,061Region XI - Davao Region 4,584 2,952 7,537 2,912 961 258 11,667Region XII - Soccsksargen 8,936 1,253 10,189 1,762 - 0 11,951Region XIII - CARAGA 5,701 2,880 8,581 1,608 157 2,560 12,906ARMM 2,627 895 3,521 886 59 451 4,918 i
!
Philippines 5,330 2,963 8,293 2,327 369 896 11,885
Per student internally generated income; national average = 100
National Capital Region 93.3 98.3 95.1 181.2 84.7 262.4 124.3Region 1- Ilocos 70.7 60.1 66.9 69.4 127.2 151.0 75.6Cordillera Administrative Region 86.0 122.2 98.9 94.4 68.0 0.0 89.61
Region 11- Cagayan Valley 106.0 49.2 85.7 30.2 44.1 1.1 67.2Region III - Central Luzon 129.9 103.1 120.3 69.3 47.9 71.2 104.41Region IV-A - CALABARZON 112.5 184.6 138.3 136.7 22.8 1.4 124.1'Region IV-B - MIMAROPA 97.5 124.6 107.1 52.1 120.5 213.8 104.81
Region V - Bicol 107.6 77.1 96.7 54.8 57.5 11.3 80.9Region VI - Westem Visayas 97.5 118.2 104.9 170.5 155.6 17.0 112.7Region VII - Central Visayas 108.9 147.1 122.5 17.9 61.0 34.4 93.5Region VIII - Eastem Visayas 97.3 62.7 85.0 113.2 347.9 183.5 106.1Region IX - Zamboanga Peninsula 43.2 124.9 72.4 19.3 4.6 34.2 57.0Region X - Northem Mindanao 117.7 90.0 107.8 142.4 251.0 98.4 118.3Region XI - Davao Region 86.0 99.6 90.9 125.1 260.6 28.8 98.2Region XII - Soccsksargen 167.7 42.3 122.9 75.7 0.0 0.0 100.6:Region XIII - CARAGA 107.0 97.2 103.5 69.1 42.5 285.8 108.6'ARMM 49.3 30.2 42.5 38.1 16.1 50.3 41.4;
1
PhiliooinesI
100.0 100.0 100.0 100.0 100.0 100.0 100.01Sour= of basic data: DBM and CHED MIS
Income from Income Generating Projects (IGPs) and Other Self-Sustaining Activities
The IGPs of SUCs are dependent on their land area, location, mandate, and thrusts. Becausemany SUCs have land grants, the IGPs of these SUCs typically involve agri-based production(such as piggery, poultry, fishery, seed production, fruit farms, rice farms, food processing, etc.).However, non-agricultural based IGPs (such as rental of facilities; operation of hostels,cafeterias, catering services, review centers, printing shops, internet shops, souvenir shops,wellness and spa; and provision of trainings and seminars) are also common. Some IGPs are also
12

used for academic purposes (e.g., conduct of research, provIsIOn of training! seminars andlaboratory services). In terms of having joint ventures with business and industry, only UP,among all the SUCs surveyed in this study, has engaged in such projects. These include the UPAyala Technohub, UP Ayala Town Center, and licenses to use UP's logos.
Contrary to expectations thatIGPs will make a significant contribution towards making SUCsmore self-reliant financially, the contribution of IGPs in total SUCs receipts has remainedmodest and has, in fact, dwindled in 2003-2012. SUCs income from their income generatingprojects and other self-sustaining activities grew by 13% yearly on the average in nominal termsin 2006-2012, slower than the average growth in SUCs total income from students (17%) duringthe period (Table 5). Thus, the share of SUCs income IGPs and other self-sustaining activities intheir total internally generated income contracted slightly from 24% in 2003 to 20% in 2012(Table 3).
Moreover, the numbers presented above are even likely to overstate the true contribution ofSUCs' IGPs to their total receipts. The COA in a 2012 Audit Report pointed out that this is sobecause, at times, the amounts reported as IGP income in the financial statements that were usedin the conduct of this study refer to gross income rather than net income.
While the IGPs of some SUCs are not extensive and have no significant earnings, the IGPs arestill considered to be very important sources of income by many of the SUCs which participatedin the FGDs conducted as part of this study. One school emphasized that they receive asignificant income of around PhP 17 million from IGPs alone, while another school earns aboutPhP 5.6 million. In addition to this, IGPs constitute 1.5%-20% of SUCs total internally-generatedIncome per year.
As recently as 2012, the COA noted that the operation of IGPs in a number of SUCs sufferedfrom weak financial management. Several practices hampers the monitoring and analysis of theresults of operations of each individual IGPS which is important in evaluating whether said IGPsare actually making a positive net contribution to the SUCs coffers. First, not all SUCs maintainseparate book of accounts for each oftheirIGPs. Second, SUCs vary in terms of how they recordexpenses associated with the operation of their IGPs. For instance, the salaries of teachingpersonnel who are involved in the IGP are charged in full against the SUCs' General Fund insome SUCs while the opposite is true in others.l At the same time, some MOOE which aremeant to augment the SUCs' MOOE allocation from the GAA and which are not related to theoperation of the IGP are charged as part of project cost in some SUCs. On the other hand, thereare cases where some of the manpower and materials used in the operation of the IGP are fundedout of the General Fund of the SUCs. Several 2012 COA Audit Reports for SUCs have found,after closer examination of the financial reports, that the IGPs of a number of SUCs haveincurred net losses.
lOne of the SUCs which participated in the FGD conducted for this study, however, appear to do it just right. In thisSUC, only 30% of the salary of the faculty member who is designated as project manager of the IGP was charged aspart of the project's operating expense and the rest is charged against the SUCs' General Fund. In this SUC, theproject manager's teaching load was reduced by 6 units to allow him to have time for the IGP.
13
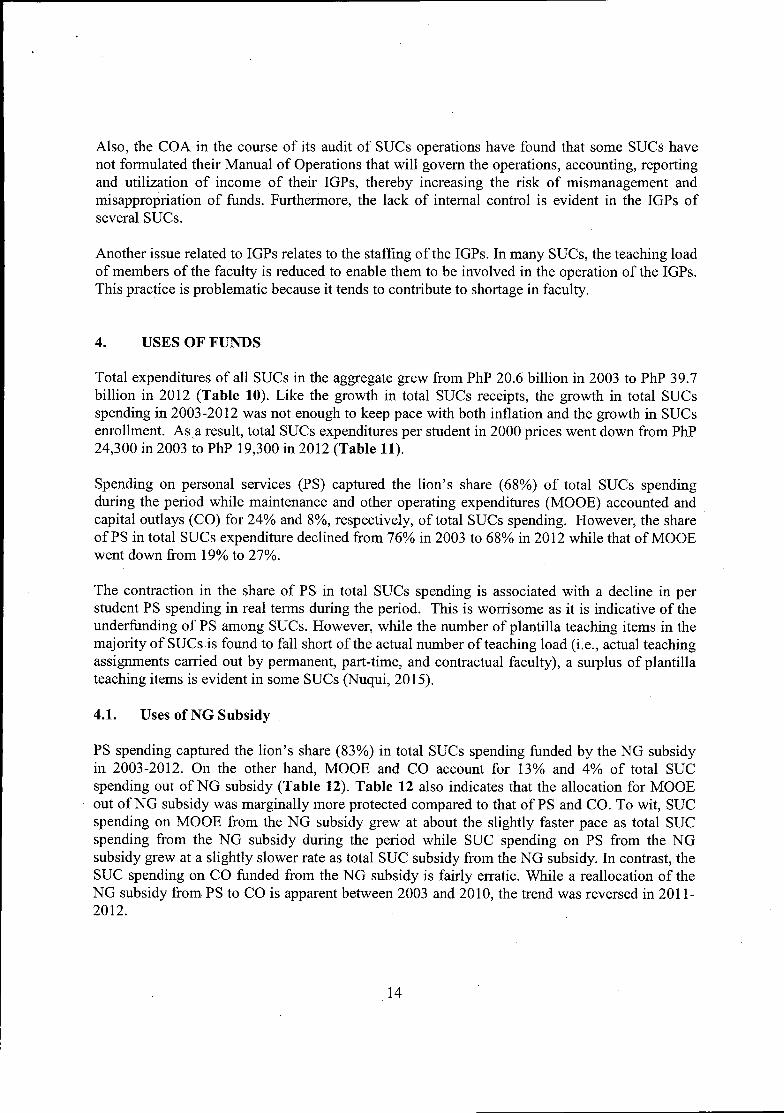
Also, the COA in the course of its audit of SUCs operations have found that some SUCs havenot formulated their Manual of Operations that will govern the operations, accounting, reportingand utilization of income of their IGPs, thereby increasing the risk of mismanagement andmisappropriation of funds. Furthermore, the lack of internal control is evident in the IGPs ofseveral SUCs.
Another issue related to IGPs relates to the staffing of the IGPs. In many SUCs, the teaching loadof members of the faculty is reduced to enable them to be involved in the operation of the IGPs.This practice is problematic because it tends to contribute to shortage in faculty.
4. USES OF FUNDS
Total expenditures of all SUCs in the aggregate grew from PhP 20.6 billion in 2003 to PhP 39.7billion in 2012 (Table 10). Like the growth in total SUCs receipts, the growth in total SUCsspending in 2003-2012 was not enough to keep pace with both inflation and the growth in SUCsenrollment. As,a result, total SUCsexpenditures per student in 2000 prices went down from PhP24,300 in 2003 to PhP 19,300 in 2012 (Table 11).
Spending on personal services (PS) captured the lion's share (68%) of total SUCs spendingduring the period while maintenance and other operating expenditures (MOOE) accounted andcapital outlays (CO) for 24% and 8%, respectively, of total SUCs spending. However, the shareofPS in total SUCs expenditure declined from 76% in 2003 to 68% in 2012 while that ofMOOEwent down from 19% to 27%.
The contraction in the share of PS in total SUCs spending is associated with a decline in perstudent PS spending in real terms during the period. This is worrisome as it is indicative of theunderfunding of PS among SUCs. However, while the number of plantilla teaching items in themajority of SUCsis found to fall short of the actual number of teaching load (i.e., actual teachingassignments carried out by permanent, part-time, and contractual faculty), a surplus of plantillateaching items is evident in some SUCs (Nuqui, 2015).
4.1. Uses of NG Subsidy
PS spending captured the lion's share (83%) in total SUCs spending funded by the NG subsidyin 2003-2012. On the other hand, MOOE and CO account for 13% and 4% of total SUCspending out of NG subsidy (Table 12). Table 12 also indicates that the allocation for MOOEout ofNG subsidy was marginally more protected compared to that ofPS and CO. To wit, SUCspending on MOOE from the NG subsidy grew at about the slightly faster pace as total SUCspending from the NG subsidy during the period while SUC spending on PS from the NGsubsidy grew at a slightly slower rate as total SUC subsidy from the NG subsidy. In contrast, theSUC spending on CO funded from the NG subsidy is fairly erratic. While a reallocation of theNG subsidy from PS to CO is apparent between 2003 and 2010, the trend was reversed in 2011-2012.
14

Table 10. Total SUCs spending, by economic category, 2003-2012I PS I MOOE I CO I Total PS I MOOEI CO I Total
Levels (in million pesos) Distribution (%)2003 15,603 3,939 1,013 20,555 75.9 19.2 4.9 100.02006 16,945 5,503 1,794 24,241 69.9 22.7 7.4 100.02007 17,772 6,175 1,928 25,875 68.7 23.9 7.5 100.02008 19,593 7,317 2,518 29,428 66.6 24.9 8.6 100.02009 21,599 7,879 3,825 33,303 64.9 23.7 11.5 100.02010 23,854 8,472 3,779 36,106 66.1 23.5 10.5 100.02011 25,015 10,027 2,341 37,383 66.9 26.8 6.3 100.02012 26,837 10,807 2,128 39,772 67.5 27.2 5.4 100.0
average 68.3 24.0 7.7 100.0
Growth rate (%)12003-2006 2.8 11.8 21.0 5.712006-2009 8.4 12.7 28.7 11.212009-2012 7.5 11.1 -17.8 6.1
2006-2012 8.0 11.9 2.9 8.6 67.2 24.6 8.1 100.02003-2012 6.2 11.9 8.6 7.6 68.3 24.0 7.7 100.0Source: DBM
Table 11. SUCs spending per student, by economic category, in current and 2000 prices,2003-2012
I in current prices in 2000 pricesI PS I MOOE I CO I Total PS I MOOE I CO I Total
Levels (in pesos) Levels (in pesos)2003 21,190 5,349 1,376 27,914 18,441 4,655 1,197 24,2932006 24,488 7,952 2,592 35,033 17,947 5,828 1,900 25,6752007 24,213 8,413 2,628 35,254 17,239 5,990 1,871 25,1002008 24,248 9,055 3,116 36,420 16,069 6,001 2,065 24,1352009 24,430 8,912 4,326 37,668 15,791 5,760 2,796 24,3472010 22,918 8,140 3,631 34,688 14,513 5,155 2,299 21,9672011 23,917 9,587 2,238 35,741 14,560 5,836 1,362 21,7592012 21,746 8,757 1,724 32,227 12,992 5,231 1,030 19,253
2003-2012 15,944 5,557 1,815 23,316
Growth rate (%)2003-2007 3.4 12.0 17.6 6.0 -1.7 6.5 11.8 0.82007-2009 0.4 2.9 28.3 3.4 -4.3 -1.9 22.2 -1.52009-2012 -3.8 -0.6 -26.4 -5.1 -6.3 -3.2 -28.3 -7.5
2006-2012 -1.3 1.1 -4.4 -0.9 -3.5 -1.2 -6.6 -3.12003-2012 0.3 5.6 2.5 1.6 -3.8 1.3 -1.7 -2.6
Source of basic data: OBM and CHEO MIS
On the other hand, about three-quarters (or 74%) of total SUCs spending in 2003-2012 is fundedfrom subsidy from the national government (Table 13). Consistent with the contraction in theshare ofNG subsidy in total SUCs receipts, the share of SUCs spending that is funded from NGsubsidy went down from 83% in 2003 to 69% in 2012, increasing self~reliance on the part of allSUCs as a group in terms of funding during this period.
15

On the average, 90% of total PS spending of all SUCs in the aggregate was funded from the NGsubsidy in 2003-2012 (Table 13). In contrast, SUCs tended to rely less on the NG subsidy infunding their MOOE and CO. In particular, only 34% of their CO and only 40% of their MOOEwere funded from the NG subsidy during the period.
While the share ofSUCs spending that is funded from the NG subsidy for all economiccategories contracted between 2003 and 2012, with the decline in the share of NG subsidy intotal SUCs spending most pronounced for CO (Table 13). In particular, the share ofNG subsidyin total PS spending of all SUCs went down from 93% in 2003 to 88% in 2012. In comparison,the share ofNG subsidy in total MOOE spending of SUCs contracted from 54% to 33% while itsshare in total CO spending decreased from 40% to 2%.
Table 12. Uses ofNG subsidy to SUCs, 2003-2012I PS I MOOEI co I Total PS I MOOEI co I Total
!Levels (in million pesos) Distribution (%.)2003 14,547 2,120 408 17,075 85.2 12.4 2.4 ~~~:~i2006 15,447 2,440 730 18,617 83.0 13.1 3.92007 16,155 2,545 645 19,345 83.5 13.2 3.3 100.0!2008 17,430 2,748 963 21,141 82.4 13.0 4.6 100.0
1
2009 19,104 2,729 2,093 23,926 79.8 11.4 8.7 100.02010 21,308 3,499 1,902 26,710 79.8 13.1 7.1 100.02011 22,211 3,704 236 26,151 84.9 14.2 0.9 100.02012 23,627 3,587 32 27,247 86.7 13.2 0.1 100.0
2003-2012 82.8 12.6 4.6 100.0
Growth rate (%.)2003-2006 2.0 4.8 21.4 2.9
1
2006-2009 7.3 3.8 42.1 8.72009-2012 7.3 9.5 -75.1 4.4
2006-2009 7.3 6.6 -40.6 6.6
I2003-2012 5.5 6.0 -24.6 5.3Source: DBM
Table 13. Proportion of SUCs spending funded from NG subsidy, 2003-2012I ps I MOOE I co ITOTAL I
2003 93.2 53.8 40.3 83.12006 91.2 44.3 40.7 76.8,2007 90.9 41.2 33.4 74.8;2008 89.0 38.0 38.2 72.0!2009 88.4 34.6 54.7 71.82010 89.3 41.3 50.3 74.012011 88.8 36.9 10.1 70.02012 88.0 33.2 1.5 68.5
2003-2012Source: DBM
89.9 40.4 33.7 73.9
4.2. Uses of Internally Generated Income of SUCs
MOOE received higher priority in the allocation of SUCs internally generated income comparedto CO and PS, with PS receiving the lowest priority. In 2003-2012, more than half (54%) oftotal SUCs spending that is funded from their internally generated income went to MOOE. Onthe other hand, PS and CO accounted for 27% and 19%, respectively, of total SUCs spending outof their internally generated income (Table 14). Also, SUC spending on MOOE funded out of
16

their internally generated income grew at a slightly faster pace than total SUC spending fromtheir internally generated income in 2003-2012 unlike SUC spending on PS and CO.
As indicated earlier, RA 8292 allows SUCs to retain any income that they generate from tuitionfees and other charges, the operation of auxiliary services and income generating projects and toutilize said income for instruction, research, extension and other SUCs programs in accordancewith a budget approved by their Board of Regents/ Trustees (BOR/T). In line with these powers,SUCs use their internally generated income (IGI) to augment the allocations for PS, MOOE, andCO that they receive from the GAA. According to the FGDs with SUCs officials, the allocationof their IGIs to instruction, research and extension (as well as PS, MOOE and CO) are based onthe urgent needs of the colleges (i.e., priority needs, quality assurance needs, and developmentneeds). SUCs vary with respect to process that they follow to allocate'their IGI, but it usuallyinvolves the estimation of income collection for the budget year, the preparation of budgetproposals from different departments/ colleges, the consolidation of the said budget proposals,the deliberation of the finance committee, and presentation of the budget to the Board ofRegents/ Trustees (BOR/T) for approval.
The use of internally generated income is subject to certain limitations and restrictions. SUCshave to be mindful of COA rules and regulations (COA Circular No. 2000-002, PresidentialDecree No. 1445 or the Government Auditing Code of Philippines, among others), DBMguidelines (particularly those related to compensation and benefits, creation of positions andGAA special provisions), CHED memoranda and circulars (most imp~rtantly, CMO No. 20-s2011), and other restrictions imposed by the SUCs' BOR/T.
Levels (in million pesos)2003 1,057 1,8192006 1,498 3,0622007 1,617 3,6302008 2,163 4,5332009 2,496 5,1502010 2,546 4,9732011 2,805 6,3232012 3,210 7,220
2003-2012
Growth rate (0/0)
2003-2006 12.3 19.02006-2009 18.6 18.92009-2012 8.7 11.9
6051,0631,2841,5551,7321,8772,1042,096
20.717.76.6
3,4815,6246,5318,2529,3779,396
11,23212,526
17.318.610.1
Distribution (0/0)
30,4 52.326.6 54,424.8 55.626.2 54.926.6 54.927.1 52.925.0 56.325.6 57.626.9 54,4
17,418.919.718.818.520.018.716.718.7
100.01100.0100.0100.0100.0100.0100.0100.0
1
'
100.0
!
II
006-20122003-2012Source: DBM
13.513.1
15.416.6
12.014.8
14.315.3
Use of IGI to Augment GAA Allocation for PS
Despite the presence of unfilled posts in their plantilla, many SUCs report a shortage of facultyon the ground. This is so because they cannot easily find new qualified employees that can fillsome of the vacant positions in their plantilla, especially those which carry a higher salary gradewhich have been vacated by retirees. Given the increase in enrollment, schools resort to "scrap
17

and build" (i.e., abolish high posts, then create lower posts). Some schools also adopt the "scrapand build" scheme to meet the faculty requirements when they offer new programs. The approvalprocess of scrapping and building faculty positions, however, takes time. Some SUCs are alsowary of the scrap and build scheme because it may lead to the loss of higher positions in theplantilla. Thus, many SUCs hire contractual or part-time faculty to meet their need for additionalteaching staff using the salary allocations that they would otherwise use to fill up unfilledpositions.
Nonetheless, the majority of the SUCs officials who attended the FGDs conducted for this studypoint out that SUCs have had to use the internally generated income that are lodged in theirSTFs/ RFs for the salaries of part-time, casual, and contractual faculty and lecturers because thePS budget from GAA is not enough to cover all their PS requirements. Payment of overload payof regular faculty, salaries of part-time and! or contractual faculty and job orders (10) are, thus,typically charged to the SUCs' STFs. Among the SUCs which participated in the FGDsconducted for this study, the share ofPS payments in total IGI range from a low of 10% to a highof 84%.
However, some COA auditors frown on this practice, pointing out that COA Circular No. 2000-002 provides that the STF may not be used for the payment of salaries and creation of newpositions. For the same reason, some COA auditors also have an unfavorable view of the SUCs'use of their IGI to pay the salary differentials related to the implementation of National BudgetCircular (NBC) 461. The COA's uneven treatment of SUCs with regards to their use of the IGIfor the payment of salaries and creation of new positions may be attributed to the inconsistencybetween the provisions of COA Circular No. 2000-002 and the special provision of the GeneralAppropriations Act for 2012 (as well as those for more recent years) which clearly states thatSUCs may use their internally generated income for the creation of additional positions. It mayalso explain why the allocation for PS from the IGI is not larger despite some evidence of PSunderfunding.
The non-uniform treatment of SUCs' use of their IGI to pay for PRAISE incentives, CollectiveNegotiation Agreement (CNA) benefits and other allowances by COA auditors has also beenobserved. SUC officials argue that COA Circular 2000-002 provides that SUCs may use theirinternally generated income for the payment of allowances to teachers. On the other hand, theconcerned COA auditors point out that, as per the Civil Service Commission, PRAISE incentivesshould be sourced from the SUCs' savings while the CNA benefits are meant to be paid out ofthe SUCs GAA appropriations.
In contrast, there are many other cases where COA auditors fault the SUCs' use of the IGI to payfor the personnel allowances/ benefits not because the IGI is an inappropriate source of paymentof said benefits but because the said personnel allowances/ benefits were deemed to have nolegal basis.
Use ofIGlfor MOOE
Some MOOE are also charged under STF, particularly repair and maintenance of buildings andother infrastructure, supplies and materials, communication expenses, training expenses, faculty
18

development, utility expenses, advertising, janitorial expenses, security services, professionalservices, representation expenses, and travel expenses. SUCs from far-flung provinces reportedthat they use the STF especially for travel expenses since most seminars and meetings are held inManila. Job orders are also charged under MOOE if the PS budget can no longer accommodatesuch expenses. For the SUCs which participated in the FGDs conducted for this study, the shareofMOOE in their total IGI range from a low of 13% to a high of73%.
Use of IGI for coSince the allocation for CO from the national government tends to be low, the STF of SUCsusually allot about 10%-30% of STF to co. The expenses go to the construction, rehabilitation,and conversion of buildings, classrooms, dormitories, and other facilities. Part of the co alsogoes to land development and the purchase of office and laboratory equipment, furniture, books,school vehicles. On the other hand, one school availed a loan of PhP 132 million from theDevelopment Bank of the Philippines (DBP) to augment CO and put up 3 buildings.
Use of Income from IGPs
Income from IGPs is typically used to augment MOOE and CO allocations from the GAA.However, some SUCs use some of their IGP income for the payment of profit sharing incentivesto IGP management and personnel. In one SUC, IGP profits are divided as follows: 55% for thepayment of profit sharing incentive to SUC officials and employees, 20% for school share and25% for capital build-up. In this particular case, the COA auditor opined that the IGP doesappear to serve the purpose for which it was created (i.e., to augment NG funding for instruction,research and extension).
Use of fiduciary fees
Fiduciary fees are non-tuition fees that are used exclusively for specific and pre-definedpurposes. They cannot be readily used because each fee has its own allocated expense (i.e. if theincome comes from athletic fees, then it's allocated only for sports). The SUCs, however, hopethat the DBM would give them more freedom in allotting the fiduciary fees so that they can alsobe used for other purposes. This will enable SUCs to stretch the utilization of their income.
4.3. sue Spending by Function
SUCs in the aggregate allocated the bulk (62% in 2009 and 74% in 2012) of their spending oninstruction! education (Table 15). On the other hand, the share of general administrative services(GAS) and that of auxiliary services (including IGPs) in total SUC spending appear to be on thehigh side at 30% and 6%, respectively, in 2009. These figures are even higher than the share ofresearch and extension (1.3% and 1.0%, respectively). This is surprising considering thatresearch and extension are two of the three core mandates of SUCs. On a positive note, the shareof GAS and auxiliary services in total SUCs spending have gone down to 18% and 3%,respectively, in 2012. Despite said reallocation, the spending shares of GAS and auxiliaryservices still appears to be disproportionately large compared to the share of research andextension.
19

Table 15. Distribution of SUC spending, by function, 2009 and 2012I 2012 2009!1----- ---
GASAuxiliaryEducationResearchExtensionTotal
18.33.474.02.51.8100.0
30.26.061.51.31.0100.0
Source of basic data: DBM and CHED MIS
5. FISCAL SURPLUS OF SUCs
In recent years, concerns have been raised that the SUCs sector has been generating andaccumulating fiscal surpluses instead of fully utilizing the NO subsidies they receive from theOAA and their internally generated income to hire enough faculty, increase MOOE and/ orupgrade facilities (Box 1). This narrative appears to have some weight if one simply looks at thedata of all SUC as a group. Based on the Statement of Receipts and Expenditures that SUCssubmit to the DBM, the SUCs sector (i.e., all SUCs as a group) posted fiscal surpluses in 2006-2012 that ranged from a low of PhP 1.2 billion in 2006 to a high of PhP 4.4 billion in 2011(Table 16). Fifty-eight percent of the cumulative fiscal surpluses during the period areattributable to fiscal surpluses from SUCs' internally generated income while the remaining 42%of the aggregate fiscal surplus is due to "underspending" of the NO subsidy. This developmentmay be explained by the lower utilization rate for SUCs' internally generated income (86%)compared to that for the NO subsidy (95%).
If one looks, however, at the fiscal surplus of individual SUCs, the fiscal surplus numbers do notappear to be quite as significant. The fiscal surplus of the average SUC was PhP 26 million in2009 and PhP 19 million in 2012 (Table 17). Table 17 also shows that the fiscal surplus ofSUCs appear to be positively associated with the size of the SUC (as measured by number ofstudents). For instance, in 2012 the average small-sized SUC had a fiscal surplus of PhP 5million, the average medium-sized SUC PhP 10 million and the average large-sized SUC PhP 41million. On the other hand, Table 18 also shows that a greater percentage of the relatively largerSUCs tend to pose fiscal surpluses compared to the smaller sized SUCs.
20

Table 16. Fiscal surplus of all sues as a group, by source of funding, 2009-2012RECEIPTS EXPENDITURES FISCALSURPLUS UTIUZA nON RA TE(EXP AS % OF RECEIPTS) DISTRIBUTION OF FISCAL SURPLUS (%) FISCAL SURPLUS AS % OF RECEIPTS
InternallyInternally Internally
Internally Internally InternallyNGsubsidy generated Total NGsubsidy
generatedTotal NGsubsidy
generatedTotal NGsubsidy generated Total NGsubsidy generated Total NGsubsidy generated Total
mcomeexpendrture expendrture
expenditures income incomes s
Levels (in million pesos) Distribution (%)
2006 18,857 6,625 25,482 18,617 5,624 24)41 240 1,001 1)41 98.7 84.9 95.1 19.3 80.7 100.0 1.3 15.1 4.92007 20,372 7,995 28,367 19,345 6,531 25,875 1,027 1,464 2,492 95.0 81.7 91.2 41.2 58.7 100.0 5.0 18.3 8.82008 22,769 9,650 32,419 21,141 8)52 29,428 1,628 1,398 2,991 92.8 85.5 90.8 54.4 46.7 100.0 7.2 14.5 9.22009 25,363 10,771 36,135 23,926 9,377 33,303 1,437 1,394 2,832 94.3 87.1 92.2 50.7 49.2 100.0 5.7 12.9 7.82010 26,710 11,124 37,834 26,710 9)96 36,106 1,729 1,729 100.0 84.5 95.4 0.0 100.0 100.0 0.0 15.5 4.62011 29,067 12,740 41,807 26,151 11)32 37,383 2,915 1,508 4,424 90.0 88.2 89.4 65.9 34.1 100.0 10.0 11.8 10.62012 27,845 14,668 42,513 27)47 12,526 39,772 599 2,142 2,741 97.9 85.4 93.6 21.8 78.2 100.0 2.1 14.6 6.
2006-2012 170,983 73,574 244,557 163,137 62937 226108 7,846 10,636 18,449 95.4 85.5 92.5 42.5 57.7 100.0 4.6 14.5 7.5Source of basic data: DBM
21

Table 17. Fiscal surplus of average SUC, by size and source of funding, 2009 and 20122012 2009
TotalInternally NG Total
Internally NGreceipts
generatedsubsidy receipts
generatesubsidy
mcome d income
Levels (in'million pesos)Small 5 2 2 7 3 4Medium 10 8 2 10 8 1Large 41 33 9 61 27 34All 19 15 4 26 13 13
Memo item:Aggregate fIscal surplus forall sues 2,741 2,142 599 2832 1394 1437Note: small SUCs are those with enrollment of 4,500 or less; medium-size SUCs are those with enrollment equal toor greater than 4,500 but less than 8,000 ad large SUCs are those with enrollment greater than or equal to 8,000
,",' 'W _~, ~,
Table 18. Number of SUCs with fiscal surplus, by size of SUC, 2012No. with Total no. offiscal
sues%
surnlusSmall 24 28 85,7Medium 23 28 82.1Large 53 56 94.6All 100 112 89.3Sourceof basic data:DBM
Box 1. COA: "Despite P168-M trust fund, state university fails to modernize"
In 2014, COA discovered that the Technological University of the Philippines (TUP) in Maniladid not use some Php 168 million or 57 percent of the budget for the STF. According to a COAreport, Php 168,782,900.73 of the total Php 297,798,620 approved 2013 budget for STF wasunused. Thus, the improvement of school facilities and equipment was not realized. In additionto this, only Php 133,056,093.36 was disbursed during the year thereby resulting in thecontinuous accumulation of the STF in the banks which amounted to Php 545,466,392.14 as ofDecember 31, 2013. Of this amount, a total of Php 230,722,652.44 was invested in high-yieldsavings account (HYSA) or time deposit. TUP argued that they aim for the fund to earn interestinstead of having it left idle in the current account. This transaction, however, is against theCHED Modernization Act. Given that TUP is a service-oriented and not an investing/corporateinstitution, it should utilize the STF for instruction, research, extension, and for other programsand projects of the university. TUP has agreed to prepare a more realistic and justifiable budgetplan that can ensure the improvement of infrastructure and school equipment (Tolentino, 2014).
Source: Tolentino, R. 2014, eGA: Despite P168-M trost fund, state university fails to modernize, The ManilaTimes [online]. http://www.manilatimes.net!coa-despite-p 168-1J1-trust-fundstatc-universitv- fails-1J1odernizeil31978![Accessed 26 January 2015].
22

At the same time, the fiscal surplus numbers of SUCs do not look as alarming if one comparesthe SUCs' fiscal surplus with their total receipts. On the average, the fiscal surplus of all SUCs inthe aggregate is equal to 8% of their total receipts (or equivalent to a month's worth of receipts)in 2006-2012 (Table 16). The comparative figures for the fiscal surplus from the NG subsidy is4% (or the equivalent of half-a-month's worth of receipts) while that from IGI is 14% (or theequivalent of two month's worth of receipts).
The reasons put forward by SUCs officials who attended the FGDs conducted for this study toexplain why SUCs incur fiscal surpluses (particularly the first two points below) appears to beconsistent with the fiscal surplus-to-total-receipts ratios that are observed above.
• Non-synchronization of the budget year with academic or school year. Tuition fees forthe second semester of the school year are collected in October-November of the currentbudget year but are actually spent on, say salaries of faculty, from November of thecurrent budget year to Marchi April of the next budget year. Necessarily, part of thecollection from tuition fees will not be spent in the current budget year and will thus formpart of the fiscal surplus for the current budget year. This story holds as well for funding(say from the GAA) which they receive late in the budget year.
• Timing issues related to budget preparation, spending authorization and fiscal reporting.Spending authorizations are based on the certification of availability of funds by the SUCAccountant. Because the financial reports are typically made on a quarterly basis, the netincome from IGPs that is realized as of the end of the fourth quarter of the current budgetyear (assuming that the BORIT approves spending authorization on a quarterly basis) willonly be available for appropriation in the first quarter of the next budget year. Again, saidamount will form part of the fiscal surplus of the current budget year.
• Many SUCs report that they intentionally do not program to spend all of their estimatedincome in the current budget year. Instead, they accumulate the fiscal surpluses theygenerate during several budget years so as to have sufficient funds for lumpy capitalinvestments.
• Some SUCs admit that, at times, they are not able to implement all their programmedprojects (particularly capital investments) on time, thereby resulting in realized fiscalsurpluses. Delays have been attributed by some SUC officials to (i) delays in BORIT'sapproval of spending authorizations and (ii) the tedious processes associated with therequirements of the procurement law.
How do SUCs manage fiscal deficits?
The strategies used by SUCs to manage their fiscal deficits include:• increase in tuition and other fees;• implement cost-cutting measures;• discontinue IGPs that are not viable and improve the management of IGPs which are
incurring losses but which are deemed to be inherently viable;
23

• solicit grants and donations; and• conduct fund-raising activities.
The SUCs clarified that prioritization of activities and proper monitoring and scheduling ofexpenditures are very important to avoid losses.
6. CONCLUSION AND RECOMMENDATIONS
6.1. Summary of Major Findings
Sources of Funds
Total SUCs receipts grew by 8% yearly on the average from PhP 21.8 billion in 2003 to PhP42.5 billion in 2012. However, the growth in total SUCs receipts was not enough to compensatefor inflation and the growth in number of students combined. Thus, total SUCs receipts perstudent in 2000 prices in 2012 (PhP 20,600) is lower than its 2003 level (PhP 25,800) and itspeak level in 2007 (PhP 27,500).
SUCs in the aggregate have made some progress towards greater fiscal self-reliance in 2003-2012. While the subsidy from the national government continues to account for the bulk of totalreceipts of SUCs, a shift in the composition of SUCs' receipts in favor of internally generatedincome is evident during the period as SUCs' receipts from their internally generated incomegrew more than thrice as fast as NG subsidy during the period. Thus, the share of internallygenerated income expanded from 18% in 2003 to 35% in 2012.
However, the progress that SUCs have achieved in the earlier years of the period under study interms of greater self-reliance has -faltered. The nominal growth in SUCs internally generatedincome decelerated after the initial surge in 2003-2006.
Income from students accounts for the major part (67%) of SUCs total internally generatedincome in 2003-2012. Moreover, the share of income from students in total SUCs internallygenerated income has increased from 63% in 2003 to 70% in 2012. This was achieved largelyby raising other school charges rather than increasing tuition fees per se as SUCs have tried todeflect the students' protests that are associated with tuition fee increases.
Notwithstanding the increasing share of total SUCs income from students in 2003-2012, theirpotential to further increase the contribution of tuition fees and other school charges to totalSUCs income remains substantial. Per student receipts from tuition fees and other schoolcharges in SUCs in 2012 are not only significantly lower than those charged by private highereducation institutions but also lower than peak level charged by SUCs themselves in 2007. Also,despite references to the implementation of cost recovery in the setting of tuition fees in SUCs,SUCs' income from students account for only 26% of total SUCs expenditures at best in 2003-2012.
24

On the other hand, contrary to expectations that lOPs will make a significant contributiontowards making SUCs more self-reliant financially, the contribution of lOPs in total SUCsreceipts has remained modest and has, in fact, dwindled in 2003-2012. In particular, SUCsincome from their income generating projects and other self-sustaining activities contracted from24% to 20% during the period. Moreover, several practices hampers the monitoring and analysisof the results of operations of each individual lOPs which is important in evaluating whether saidlOPs are actually making a net contribution to the SUCs coffers.
Uses of Funds
Like the growth in total SUCs receipts, the growth in total SUCs spending in 2003-2012 was notenough to keep pace with both inflation and the growth in SUCs enrollment. As a result, totalSUCs expenditures per student in 2000 prices went down from PhP 24,300 in 2003 to PhP19,300 in 2012.
Spending on personal services (PS) captured the lion's share (68%) in total SUCs spendingduring the period. On the other hand, MOOE and CO accounted for 24% and 8%, respectively.However, the share of PS in total SUCs expenditure declined from 76% in 2003 to 68% in 2012while that of MOOE went up from 19% to 27%. This contraction in the relative share of PS intotal SUC spending is assoCiated with a decline in per student PS spending in real terms and isindicative of the underfunding ofPS among SUCs.
On the average, 90% of total PS spending of all SUCs in the aggregate was funded from the NOsubsidy in 2003-2012 compared to 40% for MOOE and 34% for CO. The share of SUCsspending that is funded from NO subsidy contracted for all economic categories between 2003and 2012. To wit, the share of NO subsidy in total PS spending of all SUCs went down from93% in 2003 to 88% in 2012 while that of MOOE shrank from 54% to 33% and that of COspending decreased from 40% to 2%.
MOOE received higher priority in the allocation of SUCs internally generated income comparedto CO and PS, with PS receiving the lowest priority. In 2003-2012, more than half (54%) of totalSUCs spending that is funded from their internally generated income went to MOOE. Incontrast, PS and CO accounted for 27% and 19%, respectively, of total SUCs spending out oftheir internally generated income.
The majority of the SUCs officials who attended the FODs conducted for this study point outthat SUCs use their internally generated income that are lodged in their STFs/ RFs for thesalaries of part-time and contractual faculty and lecturers because the PS budget from OAA isnot enough to cover all their PS requirements. However, the use of the SUCs' internallygenerated income for PS appears to be stymied by inconsistency between the provisions of COACircular No. 2000-002 and that of the OAA for various years with regards to the use of SUCs101 for PS, thereby resulting in some unevenness in the way COA auditors treat SUCs in thisrespect. This may also explain why the allocation for PS from the 101 is not larger despite someevidence of PS underfunding.
25

The non-uniform treatment of SUCs' use of their IGI to pay for PRAISE incentives, CNAbenefits and other allowances by COA auditors has also been observed. SUC officials argue thatCOA Circular 2000-002 provides that SUCs may use their internally generated income for thepayment of allowances to teaching personnel. On the other hand, the concerned COA auditorspoint out that, as per the Civil Service Commission, PRAISE incentives should be sourced fromthe SUCs' savings while the CNA benefits are meant to be paid out of the SUCs GAAappropriations.
Function-wise, while the majority (74%) of SUCs' total spending is allocated to instruction!education in 2012 the shares of GAS (18%) and auxiliary services (3%) in total SUC spendingappear to be disproportionately large relative to research and extension (which each received 2%of the total SUC spending) considering that research and extension are two of the three coremandates of SUCs.
Concerns have been raised that the SUCs sector has been generating and accumulating fiscalsurpluses instead of fully utilizing the NG subsidies they receive from the GAA and theirinternally generated income to hire enough faculty, increase MOOE and/ or upgrade facilities soas to deliver on its core mandates. While the fiscal surplus of all SUCs in the aggregate appearsto be large, the fiscal surplus numbers do not appear to be quite as significant if one looks at thefiscal surplus of individual SUCs. For instance, the fiscal surplus of the average SUC was PhP26 million in 2009 and PhP 19 million in 2012. The fiscal surplus numbers of SUCs do not lookas alarming if one compares the SUCs' fiscal surplus with their total receipts. On the average,the fiscal surplus of all SUCs in the aggregate is equal to 7% of their total receipts (or equivalentto a month's worth of receipts) in 2006-2012.
6.2. Recommendations
The following recommendations flow directly from the major findings of this study. Theserecommendations are focused on helping SUCs improve their ability to generate more resourcesfor public higher education and also to assist them in allocating the funds they receive fromvarious sources in an effective manner.
1. To help SUCs achieve some balance between the need to improve resource generationthrough some measure of cost recovery in the setting of tuition and other school fees andthe need to ensure the poor's access to higher education (two of the objectives of theHigher Education Reform Agenda), two alternative courses of action are available:
o Adoption of a socialized tuition fee scheme (wherein the fees to be paid by thestudent depend on the family's income with lower income families being entitledto lower tuition fees than their better-off counterparts) by SUCs
o Allocation of increased funding to student financial assistance programs by thenational government coupled with improved targeting of the financial assistanceto poor students. In line with this, the government has launched two financialassistance programs for poor but deserving students, namely, the ExpandedStudents' Grants-in-Aid Program for Poverty Alleviation (ESGP-PA) and theTulong- Dunong.
26

2. Enjoin SUCs which offer programs which are not part of their core mandates to do so ona self-sustaining basis by charging tuition fees that approximate the amount need for fullcost recovery. This will help improve cost recovery in SUCs while rationalizing SUCprogram offerings.
3. As proposed in the Roadmap Higher Education Reform, encourage and assist SUCs toprepare and implement business development plans that would make use of their land andother assets and to engage in income generating projects (in partnership with the privatesector when feasible).
4. Strengthen the financial management of existing lOPs to ensure that SUCs' lOPs aremaking a positive net contribution to the coffers of SUCs:
o Strictly enforce the requirement that SUCs maintain separate books of account foreach individual lOP they operate so as to make it easier to monitor and analyzethe results of their operations
o DBM and CHED should improve the guidelines in the formulation of the Manualof Operations that will govern the operations, accounting, reporting and utilizationof lOPs so as to reduce the risk of mis-management:
• Treat lOPs in the same manner that one would treat economic enterprisesin terms of the recording and reporting of their financial operations. Onlydirect and indirect costs (salaries, materials, supplies and equipment)incurred in the actual operations of the lOP should be charged as projectcost against gross revenues of the lOP to arrive at the lOP's net income.
• Rationalize the amounts that SUCs may set aside for profit sharingincentives that SUCs may payout of the net income of their lOPs to lOPmanagement and personnel
• Strengthen internal control in lOPs
5. Focus the use of the internally generated income ofSUCs on their core mandates:o Revisit the allocation for production in CMO 20-s20 11o Rationalize the allowances and other benefits that may be charged against the
internally generated income of SUCs
6. Resolve the inconsistency between the provisions of COA Circular No. 2000-002 andthose of the Oeneral Appropriations Act with respect to the use of SUCs' internallygenerated income for the creation of new positions and the payment of salaries andallowances of regular/ permanent, contractual, and part-time faculty. This issue is partlyaddressed by the recent DBM policy, implemented starting January 1, 2015 that providesthat the salary differentials of faculty whose positions are upgraded pursuant to NBC 461are to be charged against the Miscellaneous Personnel Benefits Fund (MPBF) of theOeneral Appropriations Act (OAA), thus, freeing the income of SUCs for other purposes.However, to date, the DBM still has to issue guidelines regarding the creation of newpositions that can be charged against SUCs' income.
27

7. Improve expenditure programming and procurement planning so as to minimize delays inproject implementation to ensure that the benefits ensue to the higher education sectorfrom the larger internally generated income of SUCs are realized sooner rather than later.
8. Explore greater flexibility in the use of some of the fiduciary fees (e.g., library fees,atWetic fees) that SUCs collect.
9. Offer the Grades 11 and 12 in SUCs, at least in the interim. In this way, SUCs will beable to recover (partially, if not fully) the income they are likely to lose from theoperation of their higher education programs when the Senior High Program starts inschool year 2016 from the voucher payments that DepEd will make in favor of seniorhigh school students who will opt to enroll in non-DepED schools.
It should be emphasized that the present study's primary objective is to review and assesssources and uses of funds by SUCS so as to provide some guidance on how to increase SUCs'internally generated income and how to ensure that the utilization of the same are focused ontheir instruction, research and extension activities in a manner that is complementary with theregular subsidy provided to SUCs by the national government (NG). The study, however, doesnot cover an issue is just as important, if not more so: the accuracy and integrity of the SUCs'Financial Accountability Reports (as submitted to DBM). The CHED has previously created aTechnical Working Group to improve the financial reporting of SUCs' internally generatedincome which re-iterated the need for the full disclosure of the collection and utilization of thesame and which explored the use of sanctions and incentives to enforce this.
28

BIBLIOGRAPHY
Commission on Higher Education Memorandum Order No. 20, Series of 2011. Policies andGuidelines for the Use of Income, Special Trust Fund and Programs. of Receipts andExpenditures of the State Universities and Colleges (SUCs) [online].h!!P_:L{}y,>v\v.ched.gov.ph!wp-content/uploads/2013/07!CMO-No.?O-s2011.pdf [Accessed23 January 2015].
Commission on Higher Education, Philippine Association of State Universities and Colleges,Department of Budget and Management. Roadmap Public Higher Education Reform[online]. http://Yi\vw.ched.gov.ph/wp-content/uploads/2013/07/Roadmap-for-PublicHigher-Education-Reforml.pdf[Accessed 23 January 2015].
Manasan, R. 2012. Rationalizing National Government Subsidies for State Universities andColleges. Makati: Philippine Institute for Development Studies.
Nuqui, H. 2015. Brief Notes on SUC Faculty Workloads as Reported in Forms E2 and E1 AY2014-2015 [Powerpoint Presentation made to CHED Normative Financing Task Force].
Presidential Decree No. 1445. Government Auditing Code of the Philippines [online].http://ww.\v.coa.gov.ph/phocadovmloadJuserupload!Issuances!mles-and-regulations!PD1445.pdf[Accessed 23 January 2015].
Republic Act 8292. Higher Education Modernization Act of 1997 [online].http://wv•..\V.ched.gov.ph/wp-content/uploads/20 13!05/TRANSPARENCY -ABOUT-R/\8292.pdf [Accessed 23 January 2015].
Tolentino, R. 2014. CGA: Despite P168-M trust fund, state university fails to modernize. TheManila Times [online]. bttp://www.manilatimes.net/coa-despite-p 168-m-trust-fundstate-universitv-fails-modemize/131978/ [Accessed 26 January 2015].
29

APPENDICES
30

Appendix A. List of sues invited for FGD
1. Manila 2. La Union 3. Davao 4. BacolodLaguna State Isabela State Mindanao State Naval State UniversityPolytechnic University University University - !ligan
Institute of Technology
Bicol University Ramon Magsaysay Mindanao State University of theTechnological University - Marawi Philippines VisayasUniversity
Camarines Sur Benguet State University of Aldan State UniversityPolytechnic College University Southeastern
Philippines
Partido State Bulacan Agricultural University of Southern Western VisayasUniversity State College Mindanao College of Science and
Technology
University of the Don Mariano Marcos Davao del Norte State West Visayas StatePhilippines - Diliman State University College University
University of Northern Zamboanga City State Cebu NormalPhilippines Polytechnic College University
Bulacan StateUniversity
Cagayan StateUniversity
31

Appendix B. Questionnaire
STUDY ON THE UTILIZATION OF INCOMES GENERATED BY STATEUNIVERSITIES AND COLLEGES
1) What are the sources of your internally-generated income? Please give contribution (in
%) of various sources of internally generated income.
a. Tuition
b. Miscellaneous fees
c. Income generating projects
d. Others (please specify)
2) Does your school receive grants and donations? From where?
3) What are your school's specific income-generating projects?
4) Does your university have joint ventures with business and industry?
What are those ventures?
5) Are there specific restrictions (formal or informal) that your sue follow in using your
internally generated income? Please give examples.
6) What proportion of your internally generated income goes to personal services?;
MOOE?; capital outlay?
7) Do you use income from tuition for personal services? Please specify specific utilization.
8) Do you use income from tuition for MOOE? Please specify specific utilization.
9) Do you use income from tuition for capital outlays? Please specify specific utilization.
10)Do you use income from income generating projects for personal services? Please'specify
specific utilization.
11)Do you use income from income generating projects for MOOE? Please specify specific
utilization.
32

12)Do you use income from income generating projects for capital outlays?
Please specify specific utilization.
13)Do you use income from (please specify another important source) for personal services?
Please specify specific utilization.
14)Do you use income from (please specify another important source) for MOOE? Please
specify specific utilization.
15)Do you use income from (please specify another important source) for capital outlays?
Please specify specific utilization.
16)What is the basis for deciding how much should go to PS, MOOE, CO?
17) Please describe process of allocating use of your internally generated income (in terms of
how it is budgeted, who decides, who approves, etc).
18) The Statement of Income and Expenditures (SIB) of some SUCs exhibit losses. How are
SUCs managing these losses in income?
19) Some SUCs have been observed to have large surpluses, i.e., unspent internally generated
income. What are the possible reasons this occurs?
20) (Additional question) The Special Trust Fund (STF) is composed of income from
student-related fees. How do you utilize your income in the STF? What are the specific
issues on the collection and allocation of this income?
21) (Additional question) The Revolving Fund (RF) is composed of income from IGPs. How
do you utilize your income in the RF? What are the specific issues on the collection and
allocation of this income?
33

Appendix C. Sample of SIE for STF and RFBENGUET STATE UNIVERSITY
Statement of Income and Expenses
For the period ending December 31, 2013Detailed
Special Trust Fund164-Main
INCOME
General Income Accounts
Service Income
Affiliation Fees
Athletic and Cultural Fees
Clearance and Certification Fees
Comprehensive Examination Fees
Diploma and Graduation Fees
Library Fees
Medical, Dental, and Laboratory Fees
Transcript of Records Fees
Other Services Income
Business Income
Income from Dormitory Operations
Landing and Parking Fees
Rent Income
Tuition Fees
Other Business Income
Other Income
Interest Income
Miscellaneous Income
Other Fines and Penalties
GROSS INCOME
Less: Expenses
Personal Services
Salaries and Wages
Salaries and Wages - Part-time
Salaries and Wages - Contractual
Other Compensation
Representation Allowance (RAJ
Transportation Allowance (TAl
Clothing / Uniform Allowance
Honoraria
Overtime and Night Pay
Cash Gift
Year end Bonus
Personnel Benefits Contributions
PAG-IBIG Contributions
PHILHEALTH Contributions
Other Personnel Benefits
Other Personnel Benefits
5,047,622.114,282,656.00627,875.00
1,181,066.01809,800.00
4,052,853.005,099,315.00586,235.00
18,114,387.04
1,291,200.00500,213.00
16,428,236.1744,067,133.00
545,355.00
199,602.543,903,008.94
38,711.09
1,164,440.0012,257,805.40
307,220.67179,147.0175,000.00
10,733,612.49199,309.4472,500.0078,960.09
5,800.006,232.50
34
39,801,809.16
62,832,137.17
4,141,322.57
13,422,245.40
11,645,749.70
12,032.50
210,739.60
106,775,268.90
106,77S,268.90
25,290,767.20

Maintenance and Other Operating Expenses
Travelling Expenses
Travelling Expenses - Local
Travelling Expenses - Foreign
Training and Scholarship Expenses
Training Expenses
Scholarship Expenses
Supplies and Material Expenses
Office Supplies Expenses
Accountable Forms Expenses
Drugs and Medicines ExpensesMedical, Dental and Laboratory SuppliesExpenses
Gasoline, Oil and Lubricants Expenses
Agricultural Supplies ExpensesTextbooks and Instructional MaterialsExpenses
Other Supplies Expenses
Utility Expenses
Water Expenses
Electricity Expenses
Communication Expenses
Telephone Expenses - Landline
Telephone Expenses - Mobile
Internet ExpensesCable, Satellite, Telegraph, and RadioExpenses
Membership dues and Contributions toOrganizations
Membership dues and Contributions toOrganizations
Advertising Expenses
AdvertisingExpenses
Printing and Binding Expenses
Printing and Binding Expenses
Rent Expenses
Rent Expenses
3,786,499.441,089,346.05 4,875,845.49
1,229,884.04361,278.23 1,591,162.27
6,535,259.39130,586.00231,674.22
556,741.17580,618.36300,680.99
1,182,536.384,783,427.86 14,301,524.37
15,307.782,408,234.33 2,423,542.11,
258,574.1969,799.78
1,670,412.34
69,400.00 2,068,186.31
241,633.79
55,527.00
1,102,293.51
48,000.00
Professional Services
Auditing Services
General Services
Security Services
Repair and Maintenance
Land and ImprovementsRepairs and Maintenance-Land
Improvements
Buildings
Repairs and Maintenance-Office Buildings
Repairs and Maintenance-School BuildingsRepairs and Maintenance-Other
Structures
35
8,332.251,130,915.74
1,011,179.05
32,828.46476,994.23
2,406,700.00
40,000.00
2,150,427.04
2,916,522.69
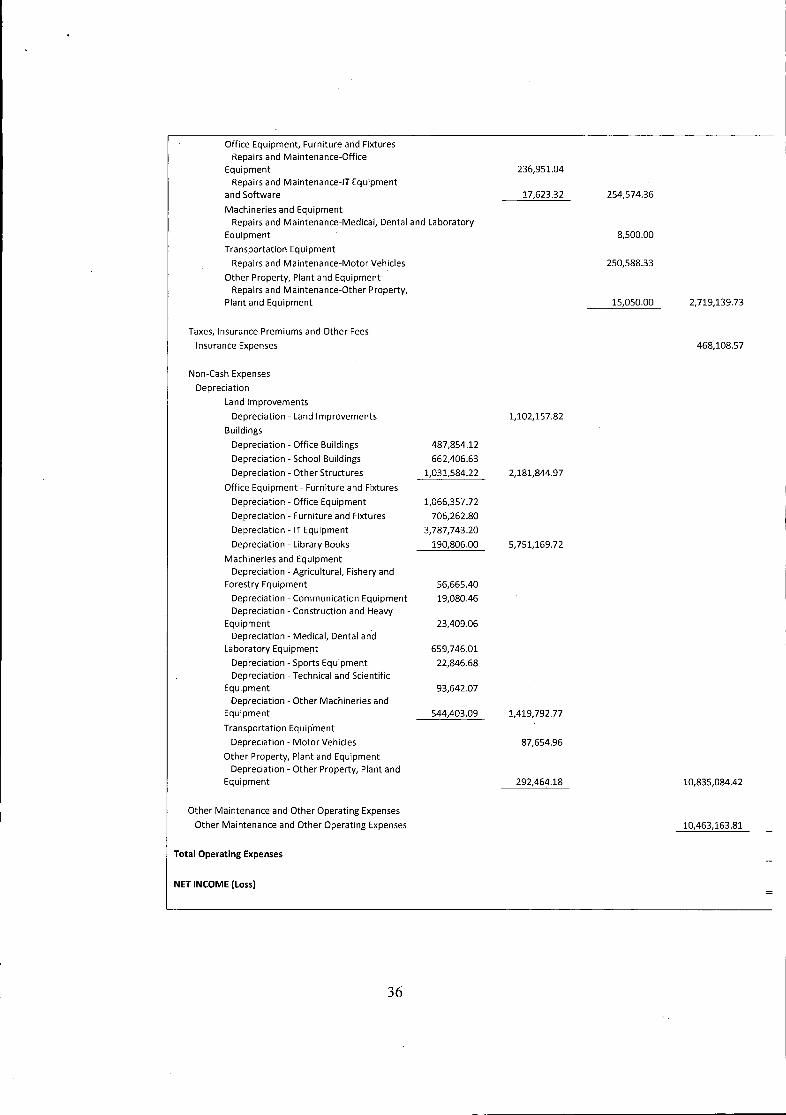
Office Equipment, Furniture and FixturesRepairs and Maintenance-Office
EquipmentRepairs and Maintenance-IT Equipment
and Software
Machineries and EquipmentRepairs and Maintenance-Medical, Dental and Laboratory
Equipment
Transportation Equipment
Repairs and Maintenance-Motor Vehicles
Other Property, Plant and EquipmentRepairs and Maintenance-Other Property,
Plant and Equipment
Taxes, Insurance Premiums and Other Fees
Insurance Expenses
236,951.04
17,623.32 254,574.36
8,500.00
250,588.33
15,050.00 2,719,139.73
468,108.57
Non-Cash Expenses
Depreciation
Land Improvements
Depreciation - Land Improvements
Buildings
Depreciation - Office Buildings
Depreciation - School Buildings
Depreciation - Other Structures
Office Equipment - Furniture and Fixtures
Depreciation - Office Equipment
Depreciation - Furniture and Fixtures
Depreciation - IT Equipment
Depreciation - Library Books
Machineries and EquipmentDepreciation - Agricultural, Fishery and
Forestry Equipment
Depreciation - Communication EquipmentDepreciation - Construction and Heavy
EquipmentDepreciation - Medical, Dental an'd
Laboratory Equipment
Depreciation - Sports EquipmentDepreciation - Technical and Scientific,
EquipmentDepreciation - Other Machineries and
Equipment
Transportation Equipment
Depreciation - Motor Vehicles
Other Property, Plant and EquipmentDepreciation - Other Property, Plant and
Equipment
Other Maintenance and Other Operating Expenses
Other Maintenance and Other Operating Expenses
Total Operating Expenses
NET INCOME (Loss)
36
487,8S4,12662,406.63
1,031,584.22
1,066,3S7.72706,262.80
3,787,743.20190,806.00
56,665.4019,080.46
23,409.06
659,746.0122,846.68
93,642.07
544,403.09
1,102,157.82
2,181,844.97
5,751,169.72
1,419,792.77
87,654.96
292,464.18 10,835,084.42
10,463,163.81

BENGUET STATE UNIVERSITY
Statement of Income and Expenses
For the period ending December 31, 2013
DetailedRevolving Fund
161-Main
INCOME
General Income Accounts
Business Income
Sales Revenue
Less: Cost of Goods Sold
Other Business Income
Other Income
Interest Income
GROSS INCOME
Less: Expenses
Personal Services
Salaries and Wages
Salaries and Wages - Regular
Salaries and Wages - Contractual
Other CompensationPersonnel Economic ReliefAllowance (PERA)
Overtime and Night Pay
Cash Gift
Year End Bonus
Personnel Benefits Contributions
PHILHEALTH Contributions
Other Personnel Benefits
Other Personnel Benefits
Maintenance and Other Operating Expenses
Travelling Expenses
Travelling Expenses - Local
Supplies and Material Expenses
Office Supplies Expenses
Accountable Forms ExpensesGasoline, Oil and LubricantsExpenses
Agricultural Supplies Expenses
Other Supplies Expenses
Utility Expenses
Water Expenses
Electricity Expenses
Communication Expenses
Telephone Expenses - Landline
Rent Expenses
Rent Expenses
Repair and MaintenanceBuildings
11,528,186.62
-7,896,509.52
37
3,631,677.10
7,699,805.50
402,028.80
168,240.00
82,800.00
122,630.22
118,222.92
114,417.91
10,581.40
11,361.00
13,808.79
4,981,792.11
305.00
37,554.00
184,231.98
11,331,482.60
28,238.47
570,268.80
438,071.05
15,787.50
96,369.00
13,304.00
5,017,848.30
221,785.98
11,584.74
134,820.00
11,359,721.07
11,359,721.07
1,120,496.35

Repairs and Maintenance-OtherStructures
Taxes, Insurance Premiums and Other Fees
Fidelity Bond Premiums
Non-Cash Expenses
Depreciation
Buildings
Depreciation- Office Buildings
Depreciation- Other StructuresOffice Equipment- Furniture andFixtures
Depreciation- Office EquipmentDepreciation- Furniture and
Fixtures
Depreciation- IT Equipment
Machineries and EquipmentDepreciation- Agricultural, Fishery
and Forestry EquipmentDepreciation- Communications
EquipmentDepreciation- Construction and
Heavy EquipmentDepreciation- Other Machineries
and Equipment
Other Property, Plant and EquipmentDepreciation- Other Property, Plant
and Equipment
Other Maintenance and Other OperatingExpenses
Loss of Assets
Other Maintenance and Other OperatingExpenses
Total Operating Expenses
Net Income (Loss)
27,812.8843,263.72
1,457.50
61,143.8923,617.92
6,474.09
12,571.80
11,250.00
13,530.63
71,076.60
86,219.31
43,826.52
18,468.15
38
60,060.00
27,990.00
3,193.00
1,500.00
219,590.58
88,050.00 5,711,676.60
6,832,172.95
4,527,548.12

BENGUET STATE UNIVERSITY
Statement of Income and Expenses
For the period ending December 31, 2013
DetailedRevolving Fund
163-Main
INCOME
General Income Accounts
Service Income
Other Services Income
Business Income
Income from Canteen Operations
Income from Dormitory Operations
Sales Revenue
Less: Cost of Goods Sold
Other Income
Interest Income
GROSS INCOME
Less: Expenses
Personal Services
Salaries and Wages
Salaries and Wages - Regular
Salaries and Wages - Part-Time
Salaries and Wages - Contractual
Other CompensationPersonnel Economic Relief Allowance(PERA)
Honoraria
Hazard Pay
Overtime and Night Pay
Cash Gift
Year End Bonus
Personnel Benefits Contributions
PHILHEALTH Contributions
Other Personnel Benefits
Other Personnel Benefits
Maintenance and Other Operating Expenses
Travelling Expenses
Travelling Expenses - Local
Travelling Expenses - Foreign
Training and Scholarship Expenses
Training Expenses
Supplies and Material Expenses
Office Supplies Expenses
Accountable Forms ExpensesMedical, Dental and Laboratory SuppliesExpenses
Gasoline, Oil and Lubricants Expenses
Other Supplies Expenses
Utility Expenses
Water Expenses
Electricity Expenses
15,216,926.97
-14,478,619.90
39
8,756,537.45
3,692,068.00
738,307.07
1,161,824.40
8,700.00
1,278,052.52
215,750.55
19,425.00
26,592.50
179,095.33
71,720.00
88,092.24
10,013.00
32,317.50
4,670.00
28,356.10
203,309.67
2,360.00
5,079,828.13
71,149.00
435,401.95
1,607,853.30
13,186,912.52
84,539.50
2,448,576.92
600,675.62
4,187.50
54,279.00
42,330.50
8,200.00
5,318,523.90
14,879,305.32
14,879,30S.32
3,107,719.04

Cooking Gas Expenses
Communication Expenses
Telephone Expenses - LandlineCable, Satellite, Telegraph, and RadioExpenses
Printing and Binding Expenses
Printing and Binding Expenses
Rent Expenses
Rent Expenses
Professional Services
Security Services
Repair and Maintenance
BuildingsRepairs and Maintenance-Other
Structures
Machineries and EquipmentRepairs and Maintenance-Other
Machineries and Equipment
Other Property, Plant and EquipmentRepairs and Maintenance-Other Property, Plant and
Equipment
Taxes, Insurance Premiums and Other Fees
Fidelity Bond Premiums
159,807.00
51,415.88
34,250.00
589,80950
4,700.00
14,200.00
666,357.95
85,665.88
37,200.00
161,780.00
325,320.00
608,70950
3,075.00
Non-Cash Expenses
Depreciation
Buildings
Depreciation- Other Structures
Office Equipment- Furniture and Fixtures
Depreciation- Furniture and Fixtures
Depreciation- IT Equipment
Machineries and EquipmentDepreciation- Medical, Dental and
Laboratory EquipmentDepreciation- Other Machineries and
Equipment
Other Property, Plant and EquipmentDepreciation- Other Property, Plant
and Equipment
Other Maintenance and Other OperatingExpenses
Other Maintenance and Other OperatingExpenses
Financial Expenses
Bank Charges
Total Operating Expenses
Net Income (Loss)
17,001.4231,89458
4,363.20
34,329.61
3,008.16
48,896.00
38,692.81
50,888.35
40
141,485.32
18,228.75 7,416,876.80
2,100.00
10,526,695.84
4,352,609.48