assessment report - european medicines agency€¦ · assessment report ema/chmp/22749/2020 page...
TRANSCRIPT

Official address Domenico Scarlattilaan 6 ● 1083 HS Amsterdam ● The Netherlands
An agency of the European Union Address for visits and deliveries Refer to www.ema.europa.eu/how-to-find-us Send us a question Go to www.ema.europa.eu/contact Telephone +31 (0)88 781 6000
© European Medicines Agency, 2020. Reproduction is authorised provided the source is acknowledged.
12 December 2019 EMA/CHMP/22749/2020 Committee for Medicinal Products for Human Use (CHMP)
Assessment report
Darzalex
International non-proprietary name: daratumumab
Procedure No. EMEA/H/C/004077/II/0030
Note Variation assessment report as adopted by the CHMP with all information of a commercially confidential nature deleted.

Assessment report EMA/CHMP/22749/2020 Page 2/76
Table of contents
1. Background information on the procedure .............................................. 5 1.1. Type II variation .................................................................................................. 5 1.2. Steps taken for the assessment of the product ......................................................... 5
2. Scientific discussion ................................................................................ 6 2.1. Problem statement ............................................................................................... 6 2.1.1. Disease or condition ........................................................................................... 6 2.1.2. Epidemiology and risk factors, screening tools/prevention ...................................... 6 2.1.3. Biologic features: Aetiology and pathogenesis ....................................................... 7 2.1.4. Clinical presentation, diagnosis and stage/prognosis .............................................. 7 2.1.5. Management ..................................................................................................... 8 2.2. Non-clinical aspects ............................................................................................ 10 2.3. Clinical aspects .................................................................................................. 11 2.3.1. Introduction .................................................................................................... 11 2.3.2. Pharmacokinetics............................................................................................. 12 2.3.3. Pharmacodynamics .......................................................................................... 13 2.3.4. PK/PD modelling .............................................................................................. 14 2.3.5. Discussion on clinical pharmacology ................................................................... 17 2.3.6. Conclusions on clinical pharmacology ................................................................. 18 2.4. Clinical efficacy .................................................................................................. 18 2.4.1. Dose response study(ies) ................................................................................. 18 2.4.2. Main study(ies) ............................................................................................... 19 2.4.3. Discussion on clinical efficacy ............................................................................ 47 2.4.4. Conclusions on the clinical efficacy ..................................................................... 49 2.5. Clinical safety .................................................................................................... 49 2.6. Discussion on clinical safety ................................................................................. 70 2.6.1. Conclusions on clinical safety ............................................................................ 70 2.6.2. PSUR cycle ..................................................................................................... 70 2.7. Risk management plan ........................................................................................ 70 2.8. Update of the Product information ........................................................................ 72 2.8.1. User consultation ............................................................................................. 72
3. Benefit-Risk Balance.............................................................................. 73 3.1. Therapeutic Context ........................................................................................... 73 3.2. Disease or condition ........................................................................................... 73 3.2.1. Available therapies and unmet medical need ....................................................... 73 3.2.2. Main clinical studies ......................................................................................... 73 3.3. Favourable effects .............................................................................................. 73 3.4. Uncertainties and limitations about favourable effects ............................................. 74 3.5. Unfavourable effects ........................................................................................... 74 3.6. Uncertainties and limitations about unfavourable effects ......................................... 74 3.7. Effects Table ...................................................................................................... 74 3.8. Benefit-risk assessment and discussion ................................................................. 75 3.8.1. Importance of favourable and unfavourable effects .............................................. 75 3.8.2. Balance of benefits and risks ............................................................................. 75 3.8.3. Additional considerations on the benefit-risk balance ........................................... 75

Assessment report EMA/CHMP/22749/2020 Page 3/76
3.9. Conclusions ....................................................................................................... 75
4. Recommendations ................................................................................. 75
5. EPAR changes ........................................................................................ 76

Assessment report EMA/CHMP/22749/2020 Page 4/76
List of abbreviations ADR adverse drug reaction AE adverse event ASCT autologous stem cell transplant CHMP Committee for Medicinal Products for Human Use CI confidence interval CMH Cochran-Mantel-Haenszel CR complete response DVMP daratumumab + bortezomib (VELCADE) + melphalan + prednisone DVTd daratumumab + bortezomib (VELCADE) + thalidomide + dexamethasone ECOG Eastern Cooperative Oncology Group EMN European Myeloma Network FDA Food and Drug Administration G-CSF granulocyte colony-stimulating factor HDT high-dose chemotherapy HOVON Dutch-Belgian Cooperative Trial Group for Hematology Oncology HR hazard ratio ICH International Conference on Harmonisation IFM Intergroupe Francophone Du Myelome IMiD immunomodulatory drug IMWG International Myeloma Working Group IPW Inverse Probability Weighting IRR infusion-related reaction ISS International Staging System ITT intent-to-treat IV intravenous MRD minimal residual disease NCCN National Comprehensive Cancer Network ORR overall response rate OS overall survival PAD bortezomib (VELCADE) + doxorubicin + dexamethasone PFS progression-free survival PI proteasome inhibitor Rd lenalidomide + dexamethasone SC subcutaneous sCR stringent complete response TEAE treatment emergent adverse event US United States VCd bortezomib (VELCADE) + cyclophosphamide + dexamethasone VMP bortezomib (VELCADE) + melphalan + prednisone VRd bortezomib (VELCADE) + lenalidomide + dexamethasone VTd bortezomib (VELCADE) + thalidomide + dexamethasone VGPR very good partial response

Assessment report EMA/CHMP/22749/2020 Page 5/76
1. Background information on the procedure
1.1. Type II variation
Pursuant to Article 16 of Commission Regulation (EC) No 1234/2008, Janssen-Cilag International NV submitted to the European Medicines Agency on 27 March 2019 an application for a variation.
The following variation was requested:
Variation requested Type Annexes affected
C.I.6.a C.I.6.a - Change(s) to therapeutic indication(s) - Addition of a new therapeutic indication or modification of an approved one
Type II I and IIIA
Extension of indication in combination with bortezomib, thalidomide and dexamethasone for the treatment of adult patients with newly diagnosed multiple myeloma who are eligible for autologous stem cell transplant (ASCT) for Darzalex; as a consequence, sections 4.1, 4.2, 4.5, 4.8 and 5.1 of the SmPC are updated. The Package Leaflet is updated in accordance. The RMP (Version 6.4) has also been submitted.
Darzalex was designated as an orphan medicinal product EU/3/13/1153 on 24 May 2016. Darzalex was designated as an orphan medicinal product in the following indication: treatment of plasma cell myeloma.
The new indication, which is the subject of this application, falls within the above mentioned orphan designation.
Information on paediatric requirements
Pursuant to Article 8 of Regulation (EC) No 1901/2006, the application included an EMA Decision P/0264/2017 on the granting of a (product-specific) waiver.
Information relating to orphan market exclusivity
Similarity
Pursuant to Article 8 of Regulation (EC) No. 141/2000 and Article 3 of Commission Regulation (EC) No 847/2000, the application included a critical report addressing the possible similarity with authorised orphan medicinal products.
Protocol assistance
The MAH received Protocol Assistance from the CHMP on 24 July 2014 (EMEA/H/SA/2456/4/2014/PA/II). The CHMP agreed to study design, treatment regimens and endpoints for the pivotal study MMY3006.
1.2. Steps taken for the assessment of the product
The Rapporteur and Co-Rapporteur appointed by the CHMP were:
Rapporteur: Sinan B. Sarac Co-Rapporteur: Jorge Camarero Jiménez

Assessment report EMA/CHMP/22749/2020 Page 6/76
Timetable Actual dates
Submission date 27 March 2019
Start of procedure: 27 April 2019
CHMP Co-Rapporteur Assessment Report 2 July 2019
CHMP Rapporteur Assessment Report 21 June 2019
PRAC Rapporteur Assessment Report 21 June 2019
PRAC members comments 3 July 2019
Updated PRAC Rapporteur Assessment Report 4 July 2019
PRAC Outcome 11 July 2019
CHMP members comments 15 July 2019
Updated CHMP Rapporteur(s) (Joint) Assessment Report 19 July 2019
Request for supplementary information (RSI) 25 July 2019
CHMP Rapporteur Assessment Report 30 September 2019
CHMP members comments 05 October 2019
Updated CHMP Rapporteur Assessment Report 11 October 2019
2nd Request for supplementary information (RSI) 17 October 2019
CHMP Rapporteur Assessment Report 28 November 2019
CHMP members comments 02 December 2019
Updated CHMP Rapporteur Assessment Report 05 December 2019
Opinion 12 December 2019
2. Scientific discussion
2.1. Problem statement
2.1.1. Disease or condition
Treatment of adult patients with newly diagnosed multiple myeloma (MM) who are eligible for autologous stem cell transplant.
2.1.2. Epidemiology and risk factors, screening tools/prevention
Multiple myeloma is estimated to represent 0.9% of all cancers worldwide (Bray 2018). The incidence of multiple myeloma increases steadily with age, with a median age at diagnosis of approximately 65 to 72 years (Howlader 2017; Merz 2017; Song 2016). The annual number of new cases of multiple myeloma diagnosed is estimated to be approximately 48,297 in Europe (IARC/WHO 2018). The estimated world-wide 5-year prevalence is approximately 230,000 patients (Ruzafa 2016). Major strides have been made in the treatment of multiple myeloma in the last decade. Despite the availability of new therapies, 106,105 deaths were estimated worldwide due to multiple myeloma in 2018 (Bray 2018), and annually, approximately 24,300 deaths are estimated in Europe (Ferlay 2015).

Assessment report EMA/CHMP/22749/2020 Page 7/76
2.1.3. Biologic features: Aetiology and pathogenesis
Multiple myeloma is a malignant disorder of the plasma cells, characterised by uncontrolled and progressive proliferation of a plasma cell clone. The proliferation of myeloma cells causes displacement of the normal bone marrow leading to dysfunction in normal hematopoietic tissue and destruction of the normal bone marrow architecture (Kyle 2003), resulting in progressive morbidity and eventual mortality.
The precise etiology of MM has not yet been fully established. Roles have been suggested for a variety of factors, including genetic causes, environmental or occupational causes, MGUS, radiation, chronic inflammation and infection. A variety of cytogenetic changes in oncogenes and tumor suppressors have been associated with MM. This genetic heterogeneity contributes to the rapid emergence of drug resistance in MM (Niels van Nieuwenhuijzen et al 2018). Increasing evidence also suggests that the bone marrow microenvironment of tumor cells plays a pivotal role in the pathogenesis of myelomas. Finally, the role of cytokines in the pathogenesis of MM is also considered as Interleukin (IL)-6 is also an important factor promoting the in vitro growth of myeloma cells. Other cytokines are tumor necrosis factor and IL-1b (Fairfield H et al., 2016).
Risk factors include the previous development of monoclonal gammopathy of undetermined significance (MGUS), being of male sex, older age, and African American racial background. Secondary risk factors include exposure to chronic, low-grade inflammation, pre-existing and/or chronic immunodeficiency, and, potentially, the presence of known inflammatory diseases or conditions (Fairfield H et al., 2016).
The pathophysiologic basis for the clinical sequelae of MM involves the skeletal (osteolytic lesions, anemia, and hypercalcemia), hematologic (neutropenia, anemia, and thrombocytopenia), renal (direct tubular injury, amyloidosis, or involvement by plasmacytoma), and nervous system (adiculopathy and/or cord compression).
2.1.4. Clinical presentation, diagnosis and stage/prognosis
Multiple myeloma is a heterogeneous and genetically complex disease with a course that varies depending on both disease- and host-related factors. Typically, a chronic phase lasting several years is followed by an aggressive terminal phase. The coexistence of different tumour subclones at baseline displaying different drug sensitivities ultimately contributes to the development of drug resistance and disease progression (Barlogie 2014). Multiple myeloma is fatal and incurable, as all patients eventually relapse after treatment.
MM can range from asymptomatic to severely symptomatic with complications requiring emergent treatment. Presenting signs and symptoms of multiple myeloma (MM) include bone pain, pathologic fractures, weakness, anaemia, infection (often pneumococcal), hypercalcemia, spinal cord compression, and renal failure.
MM begins as monoclonal gammopathy of undetermined significance (MGUS), progresses to smouldering (or indolent) MM (SMM) and finally becomes overt (symptomatic) myeloma, resulting in BM infiltration and osteolytic lesions. SMM progresses to myeloma at a rate of 10% per year over the first 5 years following diagnosis, 3% per year over the following 5 years, and 1.5% per year thereafter.
The criteria for diagnosis of MM were updated in 2014 by the International Myeloma Working Group (IMWG) (Rajkumar SV et al., 2014). The diagnosis requires ≥ 10% clonal BM plasma cells or biopsy-proven bony or extra-medullary plasmacytoma and any of the following myeloma-defining events. Myeloma-defining events include the following:
• Serum calcium level >0.25 mmol/L (>1 mg/dL) higher than the upper limit of normal or >2.75 mmol/L (>11 mg/dL)

Assessment report EMA/CHMP/22749/2020 Page 8/76
• Renal insufficiency (creatinine >2 mg/dL [>177 μmol/L] or creatinine clearance < 40 mL/min)
• Anaemia (hemoglobin < 10 g/dL or hemoglobin >2 g/dL below the lower limit of normal)
• One or more osteolytic bone lesions on skeletal radiography, CT, or PET-CT
• Clonal bone marrow plasma cells ≥60%
• Abnormal serum free light chain (FLC) ratio ≥100 (involved kappa) or < 0.01 (involved lambda)
• One or more focal >5 mm lesions on MRI scans
Active disease may also be indicated by repeated infections, amyloidosis, or hyperviscosity.
MM is a heterogeneous disease, with survival ranging from 1 year to more than 10 years. Median survival in unselected patients with MM is 3 years. The 5-year relative survival rate is 46.6% (SEER Stat
Fact Sheets et al., 2019). Survival is higher in younger people and lower in the elderly (Key Statistics About Multiple Myeloma. American Cancer Society 2019). Poor prognostic factors include the following: Tumor mass, Hypercalcemia, Bence Jones proteinemia, Renal impairment (i.e. stage B disease or creatinine level >2 mg/dL at diagnosis).
The International Staging System (PR Greipp et al., 2005) provides improved prognosis from readily available tests of serum concentrations of β2-microglobulin and albumin. It has been validated in several clinical trials and is undergoing assessment for prognostic value with additional biological factors.
Table 1. International Staging System
Concentration of components in serum Median survival
(months)
Stage I β2-microglobulin ≤3·5 mg/L and albumin ≥3·5 g/dL 62
Stage II β2-microglobulin <3·5 mg/L and albumin <3·5 g/dL, or β2-microglobulin 3·5–5·5 mg/L
44
Stage III β2-microglobulin >5·5 mg/L 29
2.1.5. Management
At diagnosis, newly diagnosed patients are categorised into 2 subpopulations defined by age, comorbidity and suitability for high-dose chemotherapy.
• Patients who are younger and considered fit and eligible for ASCT will receive induction therapy followed by high-dose chemotherapy (HDT) with ASCT (Kumar 2018; Gay 2018; Moreau 2017). This is the standard of care worldwide and in agreement with international guidelines: European Society for Medical Oncology (ESMO) and National Comprehensive Cancer Network (NCCN)).
• Patients considered ineligible to HDT and ASCT are usually older, more fragile with comorbidities and will usually receive less intensive and less toxic therapy.
Induction regimens are given with the intention of reducing the plasma cell disease burden before HDT, Triplets such as VTd, bortezomib + cyclophosphamide + dexamethasone (VCd), bortezomib + doxorubicin + dexamethasone (PAD) or VRd are the current standard of care for induction therapy. In Europe, VTd and VCd are the most used regimens with 4 to 6 courses typically given before transplant.

Assessment report EMA/CHMP/22749/2020 Page 9/76
Overall, bortezomib-based induction regimens have demonstrated significant improvements in response, PFS and OS in the induction setting, compared with non-bortezomib-based induction. Bortezomib-based induction regimens are generally well-tolerated with a higher rate of peripheral neuropathy but no apparent increase in risk of death (Sonneveld 2013). The occurrence of peripheral neuropathy can be decreased substantially with subcutaneous (SC) administration of bortezomib (Gay 2018).
Several trials have shown that consolidation, i.e. a further short intense period of treatment after HDT and ASCT, is improving the depth of response (Lee 2016) and PFS (Sonneveld 2016; Sonneveld 2018). VTd consolidation (2 cycles) improves response rates and PFS (Cavo 2012; Leleu 2013) and induces molecular remissions in up to 60% of patients (Ladetto 2010; Terragna 2010). Guidelines from the European Myeloma Network (EMN) and the National Comprehensive Cancer Network (NCCN) suggests different consolidation regimens, including VTd or VRd (Kumar 2018, Gay 2018).
Despite the availability of new therapies, multiple myeloma remains incurable, characterised by successive relapses, less and shorter duration of response until the disease becomes refractory. Hence there is a need for further treatment options that can lead to deeper responses pre- and post-transplant, ultimately resulting in improved long-term outcomes for patients, without adding substantially to the toxicity of the regimen.
About the product
Daratumumab is an IgG1κ human monoclonal antibody (mAb) that binds to the CD38 protein expressed at a high level on the surface of multiple myeloma tumour cells, as well as other cell types and tissues at various levels. CD38 protein has multiple functions such as receptor mediated adhesion, signalling and enzymatic activity. Daratumumab has been shown to potently inhibit the in vivo growth of CD38-expressing tumour cells. In vitro studies suggest that daratumumab can induce tumour cell lysis through complement-dependent cytotoxicity, antibody-dependent cell-mediated cytotoxicity and antibody-dependent cellular phagocytosis in malignancies expressing CD38. A subset of myeloid derived suppressor cells (CD38+MDSCs), regulatory T cells (CD38+Tregs) and B cells (CD38+Bregs) are decreased by daratumumab mediated cell lysis. T cells (CD3+, CD4+, and CD8+) are also known to express CD38 depending on the stage of development and the level of activation. Significant increases in CD4+ and CD8+ T cell absolute counts, and percentages of lymphocytes, were observed with daratumumab treatment in peripheral whole blood and bone marrow. In addition, T-cell receptor DNA sequencing verified that T-cell clonality was increased with daratumumab treatment, indicating immune modulatory effects that may contribute to clinical response.
Daratumumab induced apoptosis in vitro after Fc mediated cross-linking. In addition, daratumumab modulated CD38 enzymatic activity, inhibiting the cyclase enzyme activity and stimulating the hydrolase activity. The significance of these in vitro effects in a clinical setting, and the implications on tumour growth, are not well-understood.
The recommended dose is DARZALEX 16 mg/kg body weight administered as an intravenous infusion according to the following dosing schedule in Table 3.
Table 2: DARZALEX dosing schedule in combination with bortezomib, thalidomide and dexamethasone ([VTd]; 4-week cycle dosing regimen)
Treatment phase Weeks Schedule Induction Weeks 1 to 8 weekly (total of 8 doses)
Weeks 9 to 16a every two weeks (total of 4 doses) Stop for high dose chemotherapy and ASCT
Consolidation Weeks 1 to 8b every two weeks (total of 4 doses) a First dose of the every-2-week dosing schedule is given at Week 9 b First dose of the every-2-week dosing schedule is given at Week 1 upon re-initiation of
treatment following ASCT

Assessment report EMA/CHMP/22749/2020 Page 10/76
The dose and schedule of medicinal products administered with Darzalex are provided in section 5.1 of the SmPC.
Type of Application and aspects on development
Daratumumab is approved in the relapsed and refractory setting as monotherapy for the treatment of multiple myeloma patients whose prior therapy included a proteasome inhibitor and an immunomodulatory agent and who have demonstrated disease progression on the last therapy. It is also approved in combination with lenalidomide and dexamethasone, or bortezomib and dexamethasone in the relapse setting and in combination with lenalidomide and dexamethasone, or bortezomib, melphalan and prednisone in newly diagnosed multiple myeloma patients, ineligible for autologous stem cell transplant (ASCT).
This variation application is an extension of indication as follows:
DARZALEX is indicated in combination with bortezomib, thalidomide, and dexamethasone for the treatment of adult patients with newly diagnosed multiple myeloma who are eligible for autologous stem cell transplant.
The current submission is supported by the Phase 3 study MMY3006, where D-VTd (Daratumumab bortezomib, thalidomide and dexamethasone) was compared with VTd alone as induction and consolidation treatment of patients with newly diagnosed multiple myeloma who are eligible for ASCT. Study MMY3006 is being conducted in 2 parts: evaluation of induction/ASCT/consolidation in Part 1 and evaluation of maintenance or observation in Part 2. Only results from Part 1 are included in this submission. Part 2 of the Study is still ongoing and will be reported separately.
2.2. Non-clinical aspects
No new clinical data have been submitted in this application, which was considered acceptable by the CHMP.

Assessment report EMA/CHMP/22749/2020 Page 11/76
2.3. Clinical aspects
2.3.1. Introduction
GCP
The Clinical trials were performed in accordance with GCP as claimed by the applicant
• Tabular overview of clinical studies

Assessment report EMA/CHMP/22749/2020 Page 12/76
2.3.2. Pharmacokinetics
The clinical pharmacology supporting the present application is based on pharmacokinetic data from Study MMY3006, as well as clinical pharmacologic data from previous studies totally including more than 1,000 patients treated with daratumumab.
Absorption
Absorption studies have not been conducted considering that daratumumab is administered as an IV infusion.
Distribution
The mean±SD volume of distribution in subjects who received 16 mg/kg was 90.19±43.40 mL/kg after the first dose and 59.51±54.68 mL/kg following repeat dosing (Study GEN501); Japanese subjects receiving 16 mg/kg exhibited a similar volume of distribution of 57.97±3.29 mL/kg (Study MMY1002). As described by the monotherapy PPK model, the estimate for the central volume of distribution is 56.98±18.07 mL/kg. Overall, these data suggest that daratumumab is primarily localised to the vascular system with limited extravascular tissue distribution.
Elimination
As shown previously in the monotherapy studies, daratumumab clearance decreased with increasing dose and with multiple doses. After the first infusion, mean clearance decreased from 1.06 mL/h/kg in the 2 mg/kg group to 0.29 mL/h/kg in the 24 mg/kg group; after repeat dosing, clearance decreased from 0.59 mL/h/kg (n=1) in the 2 mg/kg group to 0.16 mL/h/kg in the 24 mg/kg group (Study GEN501). Following the first administration at the approved dose of 16 mg/kg, clearance was 0.42±0.42 mL/h/kg and the T½ was 216±104 hours (9.0±4.3 days). Following repeated administration of 16 mg/kg, daratumumab clearance decreased to 0.30±0.12 mL/h/kg and T½ increased to 255±216 hours (10.6±9.0 days) (Study GEN501).
Dose proportionality and time dependencies
Dose Proportionality
Following the first administration of daratumumab ranging from 0.005 to 24 mg/kg, Cmax increased in an approximately dose-proportional manner for doses ≥1 mg/kg. After repeat dosing, Cmax increased in a greater than dose-proportional manner. AUC also increased in a greater than dose-proportional manner after both the first and last dose. Consistent with the monotherapy data, in Study GEN503, Cmax following the first infusion increased in approximate proportion to the increasing daratumumab dose of 2 to 16 mg/kg daratumumab and AUClast increased in a greater than dose-proportional manner after the first dose. These findings are consistent with target-mediated clearance.
As reported for monotherapy, mean clearance following the first dose decreased with increasing dose, from 1.50±0.96 mL/h/kg in the 1 mg/kg cohort to 0.29±0.15 mL/h/kg in the 24 mg/kg cohort. This trend for decreasing clearance with increased dose was also evident following repeat dosing, from 6.72±6.18 mL/h/kg in the 0.5 mg/kg cohort to 0.16±0.08 mL/h/kg in the 24 mg/kg cohort. Following the first administration at the approved dose of 16 mg/kg, clearance was 0.32±0.13 mL/h/kg and 0.10 mL/h/kg in the 1 subject with the parameter estimated after repeat dosing. Due to the evident nonlinear PK, statistical assessment of dose proportionality was not performed.
Time Dependency
Clearance of daratumumab also decreased with multiple doses in the monotherapy studies: after the first infusion, mean clearance decreased from 1.06 mL/h/kg in the 2 mg/kg group to 0.29 mL/h/kg in the 24 mg/kg group; after the last infusion, mean clearance decreased from 0.59 mL/h/kg in the 2

Assessment report EMA/CHMP/22749/2020 Page 13/76
mg/kg group to 0.16 mL/h/kg in the 24 mg/kg group. Following the first administration at the approved dose of 16 mg/kg, clearance was 0.32±0.13 mL/h/kg (mean±SD) and 0.10 mL/h/kg in the 1 subject with the parameter estimated after repeat dosing. The trend of decreasing clearance with repeated dosing was also evident in Part 2 of Study GEN501 and Study MMY1002.
Comparison of DVTd Combination in MMY3006 and Previous Monotherapy and Combination Therapies
In Study MMY3006, daratumumab serum concentrations were evaluated pre-dose, on Cycle 1 Day 1 of Part 1 and at the end of induction/ASCT/consolidation treatment in Part 1, just before initiation of the maintenance phase at the time-points. A total of 302 subjects were included in the PK-evaluable population (subjects who received at least 1 dose of daratumumab and had at least 1 serum daratumumab concentration value after the first infusion).
When comparing results from the present combination study (Study MMY3006) with the results from the monotherapy studies, similar Ctrough values are observed. In the present study, the pre-dose daratumumab concentration (mean±standard deviation [SD]) at the end of treatment in Part 1, (thus following multiple doses of daratumumab) was 219±93.3 μg/mL. In the monotherapy studies, the observed values at a similar time-point (every 4-week dosing at Cycle 12, Day 1 preinfusion) was 224±169 μg/mL (Study GEN503), and in the combination studies following the first dose of 16 mg/kg of daratumumab in combination studies of D-VMP, mean end of infusion concentrations were 266.72 μg/mL (Study MMY3007) and 332.16 μg/mL (Study MMY1001), respectively. In Study MMY3003 where daratumumab was combined with lenalidomide and dexamethasone (DRd), Ctrough at Cycle 12, Day 1 was 255±124 μg/mL. Similar Ctrough values was also confirmed at the PK simulation, where the predicted Ctrough value was 227.54±178.57 μg/mL.
Special populations
No special population studies for hepatic or renal dysfunction with daratumumab have been presented in this application.
Pharmacokinetic interaction studies
No dedicated clinical drug-drug interaction studies were presented. Since there is no overlapping pathway of elimination, no interactions are expected between daratumumab and small-molecule drugs including bortezomib, thalidomide and dexamethasone.
2.3.3. Pharmacodynamics
Mechanism of action
No new data on the mechanism of action has been presented in this application.
Daratumumab is a human IgG mAb that binds with high affinity to CD38, a transmembrane glycoprotein expressed on tumor cells, and induces tumor cell death through multiple mechanisms of action. These mechanisms of action include several immune-mediated activities, including complement-dependent cytotoxicity, antibody-dependent cellular cytotoxicity, antibody-dependent cellular phagocytosis, and direct cytotoxicity by induction of apoptosis by Fc gamma receptor mediated crosslinking of tumor-bound mAbs (Overdijk 2016). Translational biomarker studies of samples from subjects treated with daratumumab in Phase 1 and Phase 2 studies (Studies GEN501 and MMY2002, respectively) have revealed previously unknown immunomodulatory effects of daratumumab (Krejcik 2016). Daratumumab leads to the rapid and sustained elimination of highly immunosuppressive subsets of CD38+ regulatory T cells, CD38+ myeloid-derived suppressor cells, and CD38+ regulatory B cells (Krejcik 2016). The elimination of these immunosuppressive cells, modulation of CD38 enzymatic activity, and destruction of the malignant myeloma cells are thought to lead to the clonal expansion of CD8+ and CD4+ T cells

Assessment report EMA/CHMP/22749/2020 Page 14/76
(Chiu 2016). Altogether, daratumumab’s converging mechanisms of actions are hypothesised to synergistically lead to the deep responses observed in patients.
Primary and secondary pharmacology
Immunogenicity
A summary of anti-daratumumab antibody status for Part 1 of Study MMY3006 is shown inTable 3. None (0%) of the 301 subjects who were treated with DVTd and had 1 or more samples obtained after their first daratumumab administration were positive for anti-daratumumab antibodies. The majority of immunogenicity-evaluable subjects (n=299) had PK concentrations (at all time-points) below the drug tolerance limit of the assay (630 μg/mL). One of 302 subjects in the PK-evaluable population was not evaluable for anti-daratumumab antibodies because this subject only had a baseline sample and no sample was obtained after the first daratumumab administration when the PK data cut-off occurred.
Table 3 Summary of Anti-daratumumab antibodies status
2.3.4. PK/PD modelling
Population Pharmacokinetic Analysis
The pharmacokinetics of daratumumab have been previously well characterised in monotherapy and various combination studies in subjects with multiple myeloma. The PK findings in previous monotherapy and combination studies following administration of multiple doses of daratumumab are consistent. Therefore, a sparse PK sampling scheme was utilised in Study MMY3006 and a population PK simulation was conducted using previous population PK model(s) to confirm that the observed daratumumab PK profile in MMY3006 population is similar to the predicted pharmacokinetic profile based on previous models.
Methods for Population Pharmacokinetic Analysis
A PPK model of daratumumab was developed to describe the PK characteristics of daratumumab in combination with VMP and to evaluate the influence of covariates on the disposition of daratumumab in subjects with newly diagnosed multiple myeloma who are ineligible for autologous stem cell transplant. In addition, PK of daratumumab combined with VMP was compared with that of daratumumab monotherapy studies and the previous combination therapy studies.
The PPK analysis included combined data from a Phase 3 study (MMY3007) and the D-VMP combination arm of a Phase 1b (MMY1001). Serum concentration-time data of daratumumab were used for nonlinear

Assessment report EMA/CHMP/22749/2020 Page 15/76
mixed effects modelling using NONMEM (ICON plc, Version 7.3). The first-order conditional estimation with the INTERACTION method was used. Due to the lack of overlapping clearance mechanism for daratumumab and co-administered small-molecule combination therapies, no direct impact of the combination therapies on the PK of daratumumab is expected. Therefore, the previously developed base and final PPK models were used to fit the concentration-time data of daratumumab. To compare the effects of covariates on exposure to daratumumab, subgroup analyses were conducted on predicted exposure metrics derived from simulation of daratumumab PK profiles based on empirical Bayesian estimates of individual PK parameters.
Furthermore, daratumumab serum concentrations were planned to be collected from all subjects treated with daratumumab in Study MMY3006 at the timepoints where immunogenicity (i.e. anti-daratumumab antibody) was assessed (i.e., pre-dose of Cycle 1, Day 1 at the end of treatment in Part 1 and when an infusion-related reaction [IRR] associated with daratumumab administration occurred) given that immunogenicity assessment was a secondary endpoint in the study. The daratumumab serum concentration determined from these samples were used for interpreting immunogenicity data and for evaluating the exposure to daratumumab.
Intrinsic and extrinsic Factors
Body weight, age, sex, race, renal impairment, baseline albumin, hepatic dysfunction categories using the National Cancer Institute (NCI) criteria (based on aspartate aminotransferase [AST] and total bilirubin [TB]), and type of myeloma at baseline (IgG versus non-IgG) were considered as intrinsic factors to be examined for their potential impact on PK of daratumumab. Region of subject enrolment was evaluated as an extrinsic factor in the PPK analysis and Exposure to daratumumab compared between subgroups for baseline disease status (i.e., ECOG status at baseline) was evaluated as ‘Other factors’.
Cox proportional hazard regression models, implemented in the “survival” package in R (Therneau 2000), were used to explore the relationship between exposure metrics and the relative hazard of progression or death using P-splines. The control group in Study MMY3007 was used as the reference level to calculate the relative hazard.
In addition, a matched case-control analysis was conducted to assess the influence of potential imbalances of risk factors among subjects with different exposure quantiles (Yang 2013). The potential of unbalanced distribution of identified covariates (risk factors) among different exposure quantile was examined.
Population Pharmacokinetic Analysis
The PPK analysis was based on 1,635 PK samples from 352 PPK-evaluable subjects with at least 1 evaluable (concentration above the lower limit of quantification) post-dose sample. The observed concentration time data of daratumumab were adequately described by a 2-compartment PPK model with parallel linear and nonlinear Michaelis-Menten eliminations. The model was parameterised in terms of non-specific linear clearance (CL), volume of distribution in the central compartment (V1), inter-compartmental clearance (Q), volume of distribution in the peripheral compartment (V2), maximum rate of the saturable target-mediated drug disposition clearance process (Vmax), and daratumumab concentration (Km) associated with half of Vmax. The estimated CL value was similar to the clearance of non-specific endogenous IgG reported in the literature, and the estimated V1 value approached plasma volume. The ratio of the steady-state peak concentration after every-4-week dosing and the peak concentration after the first dose was 2.06±0.61 (mean±SD).
Effects of Covariates
A forest plot was constructed to compare the exposure (maximal trough concentration) of daratumumab in subgroups defined by specific covariates (Figure 1). The preinfusion serum daratumumab

Assessment report EMA/CHMP/22749/2020 Page 16/76
concentration at the end of treatment in Part 1 indicates systemic exposure to daratumumab following multiple doses of daratumumab, and is generally consistent with observations from previous monotherapy and combination studies after accounting for periods when daratumumab was not administered during the MMY3006 study (including ASCT and the lag time prior to initiation of the maintenance phase).
Figure 1 Forest Plot of Subgroup Analyses on Percent Change relative to Reference Value predicted Maximal Trough (pre-infusion) concentrations
years ≤ age <75 years, n=214; and age ≥75 years, n=102).

Assessment report EMA/CHMP/22749/2020 Page 17/76
Sex: No clinically important influence of sex on the exposure to daratumumab was observed. The difference in exposure was approximately 9% between males (n=163) and females (n=189), although V1 of daratumumab in female subjects was approximately 13% lower than that of male subjects.
Race: Because 85% of subjects were white and there were only limited sample sizes in other race categories, the effect of race was evaluated as white (n=301) and non-white (n=51). No clinically important influence of race on the exposure to daratumumab was observed. The difference in exposure was approximately 9% between white and non-white subjects.
Region: The majority (83%) of subjects were from the European Union (EU). The effect of region was evaluated in EU (n=293) and Other (n=59). The difference in exposure was approximately 9% between EU and Other.
Renal Impairment: As only 2 subjects had severe renal impairment (creatinine clearance [CRCL] <30 mL/min), they were combined with subjects with moderate renal impairment (30≤ CRCL <60 mL/min) in this analysis. The effect of renal impairment was evaluated in categories of normal renal function (CRCL ≥90 mL/min, n=62), mild renal impairment (60≤ CRCL <90 mL/min, n=142), and moderate/severe renal impairment (n=147). No clinically important differences (≤18%) in the exposure to daratumumab were observed between subjects with renal impairment and those with normal renal function.
Hepatic Impairment: As only 2 subjects had moderate hepatic impairment (TB >1.5× to 3.0× upper limit of normal [ULN] as defined using the NCI criteria of hepatic dysfunction) and no subjects had severe hepatic impairment (TB >3× ULN and any AST), the 2 subjects with moderate hepatic impairment were combined with subjects with mild hepatic impairment (TB 1.0× to 1.5× ULN or AST >ULN) in this analysis. The effect of hepatic impairment was evaluated in categories of normal hepatic function (TB and AST ≤ULN, n=304) and mild/moderate hepatic impairment (n=45). The exposures in subjects with mild/moderate hepatic impairment were similar with subjects who had normal hepatic function and consistent with the findings based on previous studies. No clinically important differences in the exposure to daratumumab were observed between subjects with hepatic impairment and those with normal hepatic function as found in the monotherapy or the previous combination therapy study populations.
Baseline Albumin: No clinically important differences in the exposure to daratumumab were observed between subjects with abnormal albumin and those with normal albumin level. The exposure to daratumumab was 20% lower in subjects with abnormal albumin level (<35 g/L; n=143) compared with subjects who had normal albumin level (≥35 g/L; n=209). The difference in exposure had minimal impact on target saturation.
Type of Myeloma: No clinically important differences in the exposure to daratumumab were observed between subjects with IgG myeloma and non-IgG myeloma. The exposure to daratumumab was approximately 20% lower in the IgG multiple myeloma subjects (n=225) compared to the non-IgG subjects (n=127). The difference in exposure had minimal impact on target saturation.
2.3.5. Discussion on clinical pharmacology
The clinical pharmacology of daratumumab used as monotherapy is well established. Likewise, clinical pharmacology data for daratumumab when used in various combination treatments is also extensively described including more than 1,000 patients. Clinical pharmacology data of daratumumab in combination treatment with DVTd derive from a single clinical study (Study MMY3006) with PK data from a total of 302 patients. However, as daratumumab serum concentrations were only collected at the time points where immunogenicity was assessed (pre-dose on Cycle 1 Day 1 and at end of treatment in Part 1), only one post-daratumumab treatment PK sample at the end of treatment in Part 1 was collected.

Assessment report EMA/CHMP/22749/2020 Page 18/76
None of the patients tested in the present study developed anti-daratumumab neutralising antibodies, which is reassuring.
The MAH has sufficiently justified this sparse PK data collection as overall, the pharmacokinetics of daratumumab are well-known both as monotherapy and in various combinations. Therefore, the aim was mainly “to confirm that the observed daratumumab PK profile in MMY3006 population is similar to the predicted pharmacokinetic profile based on previous models.”. Information from a previous population PK analysis has been included in the present assessment report.
Overall, there is no new data with regard to the basic pharmacokinetic properties of daratumumab including absorption, distribution, metabolism, elimination and excretion. It is supported that as a mAb, the distribution of daratumumab is primarily localised to the vascular system, and the dose-dependent elimination (nonlinear characteristics) is consistent with target-mediated elimination (where clearance decreases as a function of dose).
The results confirmed, that there were no unexpected findings and that the observed daratumumab PK profile in MMY3006 population shows similar pattern to what has been observed both in the monotherapy and other combination-therapy studies.
It was agreed with the MAH that combination treatment with DVTd is not expected to interact with daratumumab. In accordance with this, the measured PK values seems to be similar between Study MMY3006 and the monotherapy studies as well as other combination treatment studies.
The pop-PK analysis reported in the present assessment report derives from the latest extension of indication procedure (Procedure No. EMEA/H/C/004077/II/0011, dated January 2018) and was based on 1,635 PK samples from 353 PK-evaluable patients (all receiving daratumumab at 16 mg/kg). Several covariates were investigated in the pop-PK analysis. Consistent with the results from the initial (mono- and combination-therapy) pop-PK analyses, results from this latest pop-PK analysis where daratumumab was given in combination with VMP (thus D-VMP combination treatment) show that albumin level, type of myeloma and body weight were the covariates with the highest impact on the PK values. Numeric differences were also observed for gender and renal function, but these findings were expected to be a random finding. Importantly, none of the findings from previous pop-PK analyses are expected to influence the recommended dose of daratumumab when given in the applied combination with DVTd.
With regards to the pharmacodynamics, no new data related to mechanism of action or QTc evaluation are presented. This is overall acceptable.
2.3.6. Conclusions on clinical pharmacology
The clinical pharmacology of daratumumab is well characterised and was summarised in the initial monotherapy submission. Further, the clinical pharmacology properties of daratumumab in combination treatment with other agents than the bortezomib-thalidomide-dexamethasone (DVTd) combination has been studied in numerous Phase (1, 2 and) 3 combination treatment studies totally including more than 1,000 patients treated with daratumumabThe new analyses presented do not change the current knowledge on PK/PD and immunogenicity of daratumumab.
2.4. Clinical efficacy
2.4.1. Dose response study(ies)
In previously reported Phase 1b, open-label, nonrandomized, multicenter study MMY1001 the safety, tolerability, and dose regimen of DVTd were evaluated in subjects with newly diagnosed MM.

Assessment report EMA/CHMP/22749/2020 Page 19/76
In study MMY3006, Daratumumab was administered at 16 mg/kg by intravenous (IV) infusion. In Arm B (D-VTd), daratumumab was administered once every week for 8 weeks (D-VTd Induction Cycle 1-2), then once every 2 weeks for 8 weeks (D-VTd Induction Cycle 3-4) and following ASCT once every 2 weeks for 8 weeks (D-VTd consolidation Cycle 5-6). Following subsequent re-randomization, subjects assigned to the maintenance Arm B received daratumumab (16 mg/kg) once every 8 weeks until documented disease progression (limited to a maximum duration of 2 years) (Part 2)
2.4.2. Main study(ies)
MMY3006: Study of Daratumumab (JNJ-54767414 [HuMax CD38]) in Combination with Bortezomib (VELCADE), Thalidomide, and Dexamethasone (VTd) in the First Line Treatment of Transplant Eligible Subjects with Newly Diagnosed Multiple Myeloma
The Study MMY3006 is a large randomised, open-label, active-control, parallel-group, multicenter, Phase 3 study comparing the efficacy of daratumumab when combined with VTd (D-VTd) to that of VTd in terms of achieving sCR 100 days post-ASCT in subjects at least 18 years up to 65 year of age with newly diagnosed multiple myeloma and who were eligible for ASCT. A target of 1080 subjects were planned to be enrolled in this study, with 540 subjects planned per treatment arm. The treatment phase of Study MMY3006 study consists of 2 stages:
• Part 1 (Induction/ASCT/Consolidation): subjects were randomized in a 1:1 ratio to receive either DVTd or VTd. Planned enrollment was 1080 subjects. The number of planned cycles was 6 overall (4 cycles of induction therapy before ASCT and 2 cycles of consolidation therapy after ASCT). Response was assessed approximately 100 days post-ASCT and eligibility for the second randomization was determined.
• Part 2 (Maintenance): subjects with at least a partial response (PR) by Day 100 post-transplant were re-randomized in a 1:1 ratio to daratumumab maintenance or observation only. Approximately 800 subjects (400/arm) of the initial 1080 subjects were expected to be randomized to maintenance.
The aim of Part 1 was to demonstrate the benefit of adding daratumumab to VTd induction and consolidation therapy and the aim of Part 2 will be to evaluate daratumumab monotherapy as maintenance therapy.

Assessment report EMA/CHMP/22749/2020 Page 20/76
Methods
Figure 2 Schematic Overview of Study MMY3006
Study participants
Main inclusion criteria for participation in the study were the following:
• Subjects had to have newly diagnosed Multiple Myeloma and eligible for high dose therapy and ASCT
• Subject must have documented multiple myeloma satisfying the CRAB (calcium elevation, renal insufficiency, anemia and bone abnormalities), or biomarkers of malignancy criteria (see Attachment 1) and measurable disease as defined by:
• Monoclonal plasma cells in the bone marrow ≥10% or presence of a biopsy proven plasmacytoma AND any one or more of the following myeloma defining events: - Hypercalcemia: serum calcium >0.25 mmol/L (>1 mg/dL) higher than ULN or >2.75
mmol/L (>11 mg/dL) - Renal insufficiency: creatinine clearance <40 mL/min or serum creatinine >177
μmol/L (>2 mg/dL) - Anemia: hemoglobin >2 g/dL below the lower limit of normal or hemoglobin<10
g/dL. - Bone lesions: one or more osteolytic lesions on skeletal radiography, CT, or PET-CT - Clonal bone marrow plasma cell percentage ≥60% - Involved: uninvolved serum free light chain ratio ≥100 - >1 focal lesion on MRI studies
Assessment report EMA/CHMP/22749/2020 Page 21/76
• Measurable disease at screening as defined by any of the following by a central laboratory: - IgG multiple myeloma: Serum monoclonal paraprotein (M-protein) level ≥1.0 g/dL
or urine M-protein level ≥200 mg/24 hours; or - IgA, IgE, IgD, or IgM multiple myeloma: serum M-protein level ≥0.5 g/dL or urine
M-protein level ≥200 mg/24 hours; or - IgD multiple myeloma: serum M-protein level <0.5 g/dL and Serum immunoglobulin
free light chain ≥10 mg/dL and abnormal serum immunoglobulin kappa lambda free light chain ratio; or
- Light chain multiple myeloma without measurable disease in the serum or the urine: Serum immunoglobulin free light chain ≥10 mg/dL and abnormal serum immunoglobulin kappa lambda free light chain ratio; or
• Subject must have had an ECOG Performance Status score of 0, 1, or 2. • Subject must have pretreatment clinical laboratory values meeting the following criteria during
the Screening Phase (Lab tests should be repeated if done more than 15 days before C1D1): a) hemoglobin ≥7.5 g/dL (prior red blood cell [RBC] transfusion or recombinant human erythropoietin use is permitted); b) absolute neutrophil count (ANC) ≥1.0 x 10⁹/L (GCSF use is permitted); c) AST ≤2.5 x upper limit of normal (ULN); ALT ≤2.5 x ULN; d) total bilirubin ≤1.5 x ULN (except in subjects with congenital bilirubinemia, such as Gilbert syndrome, direct bilirubin ≤1.5 x ULN); e) calculated creatinine clearance ≤40 mL/min/1.73 m2 (see Attachment 3); f) corrected serum calcium ≤14 mg/dL (<3.5 mmol/L); or free ionized calcium ≤6.5 mg/dL (≤1.6 mmol/L) (see Attachment 4); g) platelet count ≥70 x 109/L for subjects in whom <50% of bone marrow nucleated cells are plasma cells; otherwise platelet count >50x109/L (transfusions are not permitted to achieve this minimum platelet count).
Main exclusion criteria were:
• Subject has received daratumumab or other anti-CD38 therapies previously. • Subject had a diagnosis of primary amyloidosis, monoclonal gammopathy of undetermined
significance, smoldering multiple myeloma, or solitary plasmacytoma, • Subject has a diagnosis of Waldenström’s macroglobulinemia, or other conditions in which IgM
M-protein is present in the absence of a clonal plasma cell infiltration with lytic bone lesions. • Subject had prior or current systemic therapy or SCT for any plasma cell dyscrasia, with the
exception of an emergency use of a short course (equivalent of dexamethasone 40 mg/day for a maximum 4 days) of corticosteroids before treatment.
Treatments
Treatment Arm A: VTd (Bortezomib, Thalidome dexamethasone)
Treatment Arm B: D-VTd (Daratumab-Bortezomib, Thalidome dexamethasone)
The dosing schedules for VTd in both groups were as follows:
• Bortezomib (SC or intravenous [IV]): 1.3 mg/m2 body surface area twice weekly for 2 weeks (Days 1, 4, 8, and 11) in each cycle.
• Thalidomide (oral): 100 mg daily in each cycle.

Assessment report EMA/CHMP/22749/2020 Page 22/76
• Dexamethasone (oral or IV): 40 mg on Days 1, 2, 8, 9, 15, 16, 22, and 23 of Cycles 1 and 2, and at 40 mg on Days 1-2 and 20 mg on subsequent dosing days (Days 8, 9, 15, 16) of Cycles 3-4. Dexamethasone 20 mg was administered on Days 1, 2, 8, 9, 15, 16 in Cycles 5 and 6. If daratumumab was administered on the same day, the dexamethasone dose was administered IV as a pre-infusion medication.
• In the DVTd group, daratumumab 16 mg/kg body weight was administered as an IV infusion according to the dosing schedule in Table 4.
Table 4: Daratumumab Dosing Schedule in Combination with Bortezomib, Thalidomide, and Dexamethasone (VTd; 4-week Cycle Dosing Regimen) in Study MMY3006
Treatment Phase Weeks Schedule Induction Weeks 1 to 8 weekly (total of 8 doses)
Weeks 9 to 16a every 2 weeks (total of 4 doses) Stop for high dose chemotherapy and ASCT
Consolidation Weeks 1 to 8b every 2 weeks (total of 4 doses) Key: ASCT = autologous stem cell transplant; VTd = bortezomib (VELCADE) + thalidomide + dexamethasone. a First dose of the every-2-week dosing schedule was given at Week 9 b First dose of the every-2-week dosing schedule was given at Week 1 upon re-initiation of treatment following ASCT
Objectives
Primary Objectives:
• The primary objective in Part 1 is to determine if the addition of daratumumab to VTD will increase the proportion of subjects achieving stringent complete response (sCR) post completion of consolidation therapy compared with VTD alone.
• The primary objective in Part 2 is to determine if the use of daratumumab as single agent in maintenance compared to observation only will increase progression-free survival (PFS) when used after autologous stem cell transplant and consolidation therapy.
Secondary Objectives:
In Part 1, major secondary efficacy objectives are to determine if the addition of daratumumab to VTD will improve:
• Progression-free survival (PFS) from first randomization
• Time to progression (TTP) from first randomization
• Complete response (CR) rate by the end of ASCT/consolidation
• Minimal residual disease (MRD) negative rate by the end of ASCT/consolidation
• Post-induction stringent complete response (sCR) rate
• Progression-free survival after next line of therapy (PFS2)
• Post-induction overall response rate (ORR) and rate of very good partial response (VGPR) or better
• Overall survival (OS)
• Duration of CR and sCR

Assessment report EMA/CHMP/22749/2020 Page 23/76
In Part 2, major secondary efficacy objectives are to determine if the addition of daratumumab to VTD will
improve the assessment during maintenance of:
• Time to progression
• CR rate
• MRD negative rate
• PFS2
• Rate of improved response
• Rate of MRD negative conversion
• ORR
• OS
Other secondary objectives throughout the study are:
• To evaluate quality of life and health economic/resource utilization
• To assess immunogenicity of daratumumab
• To assess safety and tolerability of daratumumab in combination with VTD
Exploratory Objectives:
• To evaluate daratumumab’s impact on response and resistance to treatment
Outcomes/endpoints
Primary Endpoints
The primary endpoint is stringent complete response (sCR) by end of consolidation therapy, 100 days post-ASCT, defined as the percentage of subjects achieving CR in addition to having a normal serum FLC ratio and an absence of clonal cells in bone marrow by immunohistochemistry, immunofluorescence or 2- to 4-color flow cytometry. Subjects, who demonstrate all criteria for sCR, but have daratumumab interference on SPEP and IFE and have a NEGATIVE result per DIRA test, will be considered sCR.
Secondary endpoints controlled for multiplicity
• MRD negativity rate 100 days post-ASCT, defined as the proportion of subjects who have negative MRD at any timepoint after first dose by bone marrow aspirate by end of ASCT/consolidation. An assessment of MRD will be conducted using next generation sequencing (NGS) and multiparametric flow cytometry on bone marrow aspirates for all patients in induction/consolidation phases and for patients who achieve at least VGPR in maintenance phase (array sensitivity 1 cancer cell in the background of >= 100,000 white blood cells).
• Post-consolidation CR or better rate, defined as the proportion of subjects with a response of CR or better (i.e., CR or sCR), according to IMWG response criteria, by the end of ASCT/consolidation among all ITT population in each first randomized treatment arm.
• PFS from first randomization: PFS in Part 1 is defined as the duration from the date of first randomization to either progressive disease, according to the IMWG response criteria, or death, whichever occurs first.

Assessment report EMA/CHMP/22749/2020 Page 24/76
• OS from first randomization: OS in Part 1 is defined as the time from the date of first randomization to the date of the subject’s death.
Secondary endpoints not controlled for multiplicity (Part 1)
• Time to Progression, defined similarly as the PFS, except that death not due to PD will be censored.
• Post-induction overall response rate (ORR) and rate of very good partial response (VGPR) or better. Post-induction overall response rate (ORR) is defined as the proportion of subjects with a response of PR or better (i.e., PR, VGPR, CR or sCR), according to IMWG response criteria, by the end of induction.
• Post-induction sCR rate, defined as the proportion of subjects with a response of sCR, according to IMWG response criteria, by the end of induction phase.
• Progression-free survival on next line of therapy (PFS2), defined as the time from first randomization to progression on the next line of treatment or death, whichever comes first. Disease progression on the next line of treatment will be based on investigator judgment.
• Duration of CR/sCR and Duration of Response: Duration of CR/sCR is defined for a subject with confirmed CR/sCR as the time between the initial documentation of CR or better/sCR and disease progression (PD) per IMWG criteria, or death due to PD, whichever occurs first. Duration of Response is defined for a subject with confirmed response (PR or better) as the time between the initial documentation of response and disease progression per IMWG criteria, or death due to PD, whichever occurs first.
• Functional Status and Well-being: Health-related quality of life (HRQoL), symptoms, functional status and well-being will be assessed using 2 PRO measures, the EORTC-QLQ-C30 and the EQ-5D-5L. The EORTC QLQ-C30 includes 30 items resulting in 5 functional scales (physical functioning, role functioning, emotional functioning, cognitive functioning, and social functioning), 1 Global Health Status scale, 3 symptom scales (fatigue, nausea and vomiting, and pain), and 6 single items (dyspnoea, insomnia, appetite loss, constipation, diarrhoea, and financial difficulties). The recall period is 1 week (the past week). The EQ-5D-5L is a generic measure of health status. The EQ-5D-5L is a 5-item questionnaire that assesses 5 domains including mobility, self-care, usual activities, pain/discomfort and anxiety/depression plus a visual analog scale rating “health today” with anchors ranging from 0 (worst imaginable health state) to 100 (best imaginable health state).
Sample size
The sample size of this study takes into consideration the statistical power for the primary comparisons in both phases of the study. For Part 2 (maintenance phase), it is assumed that median PFS from the second randomization is 45 months for observation, and daratumumab maintenance will decrease the risk of progression or death by 25% (HR=0.75; estimated median PFS of 60 months for daratumumab maintenance). To achieve 80% power with a significance level of 0.05, 390 PFS events are needed. Assuming a 36-month accrual and 45 months of additional follow-up, approximately 800 subjects (400/arm) will be randomized in the second randomization (daratumumab maintenance vs. observation).
Assuming that 75% of subjects in the induction/consolidation phase are eligible to be randomized for maintenance, which takes into account the expected response rate as well as potential dropouts, 1080 subjects (540/arm) will be randomized in the first randomization (daratumumab in combination with VTD induction/consolidation vs. VTD induction/consolidation). This sample size would provide at least 85% power to detect an improvement in sCR rate from 25% to 35% at a 2- sided α of 0.05.

Assessment report EMA/CHMP/22749/2020 Page 25/76
Simulations have been performed to study the statistical powers in Part1 and Part 2. The simulation shows that the sample size is driven by maintenance stage. With adequate power for the maintenance stage, the induction/consolidation stage will have sufficient power as well. However, if an interaction exists between induction and maintenance, then the testing power for the maintenance effect could be different.
Table 5: Simulation results for interaction and power of PFS comparison
Randomisation
Subjects were assigned in a randomized manner to receive either D- VTD or VTD as induction and consolidation therapy. Subjects who successfully completed consolidation with a response of PR or better according to the IMWG criteria would be assigned a second time in a randomized manner to receive daratumumab alone or observation until documented progression of disease (limited to a maximum duration of 2 years). Permuted block randomization would be implemented in this study.
Subjects were stratified at first randomization by site, International Staging System stage I, II, or III and by cytogenetics.
Subjects were stratified at the second randomization by type of induction treatment and by depth of response to induction/consolidation therapy.
Blinding (masking)
This is an open-label study. Subjects and sites will not be blinded to treatment assignment.

Assessment report EMA/CHMP/22749/2020 Page 26/76
Statistical methods
Part 1
Analysis sets
• Intent-to-treat (ITT) analysis set: includes all subjects randomized in the first randomization.
• Maintenance-specific Intent-to-treat (ITT-m) analysis set: includes all subjects randomized in the second randomization.
• Induction-specific Safety analysis set: includes all subjects randomized in the induction/consolidation phase and have received at least 1 administration of any study treatment (daratumumab, bortezomib, thalidomide, or dexamethasone) in the first phase.
• Maintenance-specific Safety analysis set: includes all subjects who are randomized to daratumumab maintenance and have received at least 1 administration o daratumumab in the maintenance phase, and includes all subjects who are randomized to observation.
• Transplant-specific Safety analysis set: includes all subjects randomized in the induction/consolidation phase and have received transplant.
Primary endpoint: sCR rate
sCR rate is defined as the proportion of patients with sCR among ITT subjects in each first randomized treatment arm. Patients who have progression of disease before ASCT will also be counted in the ITT population for the analyses.
The primary comparison of the 2 randomized induction/consolidation treatments will be made with respect to sCR rate using the stratified Cochran-Mantel-Haenszel chi-square test in the ITT analysis set. A Mantel-Haenszel odds ratio, along with its 2-sided 95% confidence interval and the p-value from the CMH test will be reported. Stratification factors used in the analysis include site, International Staging System stage I, II, or III and by cytogenetics at first randomization.
Secondary endpoints controlled for multiplicity (Part 1)
1. Post ASCT/consolidation MRD negative rate
For analysis purpose, subjects in the ITT population without MRD assessment will be considered as having positive MRD. The MRD negative rate will be analyzed similarly to the sCR rate.
2. Post-ASCT/consolidation CR rate
A similar analysis to that described for post-consolidation sCR is performed.
3. Key secondary endpoint 3 Progression-Free survival (PFS) from first randomization
PFS in Part 1 is defined as the duration from the date of first randomization to either progressive disease, according to the IMWG response criteria, or death, whichever occurs first.
Analysis of PFS in Part 1 will be based on the ITT analysis set. Two ‘ITT’-type of induction comparisons, one specific to each maintenance treatment, will be conducted:
• DVTD-daratumumab vs. VTD-daratumumab
• DVTD-observation vs. VTD- observation
The weighted Kaplan-Meier method will be used to estimate the distribution of PFS for each of the 4 treatment sequences in the two ‘ITT’-type of induction comparisons. Weight 2 is assigned to subjects

Assessment report EMA/CHMP/22749/2020 Page 27/76
randomized to the specific maintenance treatment and weight 1 is assigned to those subjects who do not respond after the induction/consolidation stage or not consent to participate in the maintenance stage. The median PFS with 95% CI will be provided. The PFS rates will also be summarized at landmarks (e.g., 6 months, 12 months, 18 months, etc). The weighted Kaplan-Meier PFS curve will also be plotted by each induction treatment group for specific maintenance treatment in the ‘ITT’-type of induction comparisons. For each of the 2 comparisons, p-value from the log-rank test with risk factor adjusted by inverse probability- weight (IPW) method will be reported for the two ‘ITT’-type of induction comparisons. Hazard ratio and its 95% confidence interval will be estimated based on a Cox regression analysis with inverse probability weighting (IPW) (Lokhnygina 2007), in which the weights to be used are the same as the above weighted KM method. Due to the expected small number of PFS events at the end of Part I, unstratified analyses will be used in each of the 2 comparisons.
The overall comparison of induction treatments will be made treating these 2 comparisons as 2 strata with the variance estimated using the robust variance estimator (the sandwich estimate). These 3 comparisons will all be tested with the significance level of 0.05 (2-sided) following the closed testing procedure. Essentially, the statistical significance is established for each of the 2 maintenance-specific comparisons if both itself and the overall induction comparison are significant at the 2-sided level of 0.05.
Censoring rules for PFS
Subjects who have not achieved a response will enter the Follow-up Phase and will be followed until disease progression or death, even if they receive subsequent treatment.
Determination of dates of PFS event and dates for censoring is summarized in Table 6.
Table 6: PFS event and censoring method
4. Overall survival (OS) from first randomization
OS in Part 1 is defined as the time from the date of first randomization to the date of the subject’s death. If the subject is alive or the vital status is unknown, then the subject’s data will be censored at the date the subject was last known to be alive. A similar analysis as PFS in Part 1 will be performed.

Assessment report EMA/CHMP/22749/2020 Page 28/76
Secondary endpoints not controlled for multiplicity
• Time to progression (TTP): a similar analysis to that described for PFS is performed.
• Post-induction sCR rate: Post-induction sCR rate will be analysed similarly to post-consolidation sCR rate.
• Progression-free survival after next line of therapy (PFS2) from first randomization
PFS2 will be analysed for the ITT population. A similar analysis as PFS described will be performed.
Table 7: PFS2 event and censoring method
• Post-induction overall response rate (ORR) and rate of very good partial response (VGPR) or better: they will be analyzed similarly to post-consolidation sCR rate.
• Duration of CR and sCR: will be presented descriptively using the weighted Kaplan- Meier estimates by for two induction treatment groups with specific maintenance treatment in the ‘ITT’-type of induction comparisons.
Sensitivity analysis
Primary endpoint (sCR)
A sensitivity analysis of sCR by the end of consolidation therapy based on investigator assessment per the IMWG response criteria was performed in a similar manner as described for the primary analysis. sCR rate in the response-evaluable population will be summarized as a sensitivity analysis as well.
PFS
A sensitivity analysis for the overall comparison of induction treatments regardless of response and second randomization will be performed among the ITT population. This analysis is to compare two treatment policies starting with DVTD or VTD induction/consolidation and responders afterward with half chance to be re-randomized to data maintenance and half chance to no maintenance (observation). The Kaplan-Meier method will be used to estimate the distribution of overall PFS for each treatment group. The p-value for DVTD and VTD induction comparison is based on a log-rank test. Hazard ratio and its 95% confidence interval are to be estimated based on a Cox’s model with induction treatment as the

Assessment report EMA/CHMP/22749/2020 Page 29/76
explanatory variable. Kaplan-Meier PFS curve will also be plotted by DVTD and VTD induction treatment groups regardless of response and second randomization.
Additionally, reasons for PFS and censoring will be summarized for the ITT analysis set.
For the overall comparison, Cox regression model with weights as time-dependent covariate will be used as a sensitivity analysis.
A sensitivity analysis for PFS to evaluate the impact of transplant on the efficacy findings in the induction phase will be evaluated by including transplant as a time-varying covariate in the Cox regression model with inverse probability weighting (IPW) for two ‘ITT’-type of induction comparisons.
A sensitivity analysis of PFS, in which progressive disease is based on investigator assessment according to the IMWG response criteria, will be performed in a similar manner as described above.
A similar sensitivity analysis of PFS by not censoring data due to start of subsequent anticancer therapy will be performed in a similar manner as described above.
Post-ASCT/consolidation MRD negative rate
A sensitivity analysis of MRD negative rate by using threshold of <10-4, 10-6 will be performed in a similar manner as described for the primary analysis.
Type I error control
The study has a primary endpoint, sCR. If sCR is statistically significant, then 4 key secondary endpoints will be tested hierarchically: 1) post-consolidation MRD negativity rate 2) post-consolidation CR or better rate 3) PFS from first randomization 4) OS from first randomization. This method strongly controls the family-wise type I error rate at 0.05 (2-sided).
Interim analysis
An interim analysis was not planned for Part 1 of the study, it was only planned for Part 2 of the study.

Assessment report EMA/CHMP/22749/2020 Page 30/76
Results
Participant flow
Figure 3: Subject disposition as of clinical cut-off date (19 June 2018); study 54767414MMY30006

Assessment report EMA/CHMP/22749/2020 Page 31/76
Table 8 Summary of subject Disposition Intent to Treat Analysis set study MMY3006
Recruitment
Study Centres: Belgium (13 sites), France (70 sites), Netherlands (28 sites).
Study Period: The study was initiated 22 September 2015 (Date first subject signed informed consent), the data cut-off for Part 1 (induction/consolidation phase) was 19 June 2018 (Date of last observation recorded as part of the database for Part 1 analysis). The study is still ongoing. Updated data was requested for PFS, OS and key secondary points and a new clinical cut-off point of May 1st 2019 was set providing 10 additional months.
Conduct of the study
Protocol amendments
The initial protocol version was dated 14 January 2015, there were 2 amendments to the protocol. The first amendment (24 August 2015) was adopted before any study-related procedures had begun. Details of each amendment are included in the protocol (Appendix 1). The rationale for each amendment is summarized in Table 9:

Assessment report EMA/CHMP/22749/2020 Page 32/76
Table 9 Summary of Protocol Amendments for MMY3006
Protocol Deviations
All protocol deviations of eligibility criteria and those deviations that could impact subject safety or study endpoints were considered major protocol deviations. Major protocol deviations were reported for 48 subjects (8.8%) in the DVTd group and 56 subjects (10.3%) in the VTd group (Table 10).
Table 10 Major Protocol Deviations (excluding part 2) ITT set MMY3006

Assessment report EMA/CHMP/22749/2020 Page 33/76
Baseline data
Baseline disease characteristics
Table 11 Pre induction Baseline Disease characteristics by Induction/ASCT/Consolidation Treatment Group ITT analysis set MMY3006

Assessment report EMA/CHMP/22749/2020 Page 34/76

Assessment report EMA/CHMP/22749/2020 Page 35/76
Table 12 Summary of IMWG Revised ISS staging in Multiple Myeloma, ITT Analysis set MMY3006
The stratification factors for randomization, comprised of site affiliation (IFM vs HOVON), ISS staging (I vs II vs III) and cytogenic risks (normal vs high risk). After initiation of the study, a revised ISS (R-ISS) was published. In addition to albumin and β-2-microglobulin, the R-ISS uses additional information consisting of lactate dehydrogenase (LDH) and cytogenetic risk (Table 11).
Numbers analysed
The primary analysis population was the intent-to-treat (ITT) population, which included all randomized subjects. The per-protocol population included ≥94% of the ITT population; therefore, only ITT results are presented in-text for the efficacy endpoints. A summary of all subjects per analysis set is presented in Table 11.
Table 13 Summary of Subjects per Analysis Set MMY3006

Assessment report EMA/CHMP/22749/2020 Page 36/76
Outcomes and estimation
Primary endpoint: sCR Table 14: Summary of Post-Consolidation Response Based on Computerized Algorithm; Intent-to-treat Analysis Set (Study
54767414MMY3006)
Induction/ASCT/Consolidation VTd DVTd
n (%) 95% CI for % n (%) 95% CI for % Odds Ratio (95% CI)a P-valueb
Analysis set: intent-to-treat 542 543 Response category
Stringent complete response (sCR) 110 (20.3%) (17.0%, 23.9%) 157 (28.9%) (25.1%, 32.9%) Complete response (CR) 31 (5.7%) (3.9%, 8.0%) 54 (9.9%) (7.6%, 12.8%) Very good partial response (VGPR) 282 (52.0%) (47.7%, 56.3%) 242 (44.6%) (40.3%, 48.9%) Partial response (PR) 64 (11.8%) (9.2%, 14.8%) 50 (9.2%) (6.9%, 12.0%) Stable disease (SD) 15 (2.8%) (1.6%, 4.5%) 10 (1.8%) (0.9%, 3.4%) Progressive disease (PD) 25 (4.6%) (3.0%, 6.7%) 20 (3.7%) (2.3%, 5.6%) Not evaluable (NE) 15 (2.8%) (1.6%, 4.5%) 10 (1.8%) (0.9%, 3.4%)
Stringent complete response (sCR) 110 (20.3%) (17.0%, 23.9%) 157 (28.9%) (25.1%, 32.9%) 1.60 (1.21, 2.12) 0.0010 CR or better (sCR + CR) 141 (26.0%) (22.4%, 29.9%) 211 (38.9%) (34.7%, 43.1%) 1.82 (1.40, 2.36) <0.0001 VGPR or better (sCR + CR + VGPR) 423 (78.0%) (74.3%, 81.5%) 453 (83.4%) (80.0%, 86.5%) 1.41 (1.04, 1.92) 0.0239 Overall response (sCR+CR+VGPR+PR) 487 (89.9%) (87.0%, 92.3%) 503 (92.6%) (90.1%, 94.7%) 1.41 (0.92, 2.16) 0.1085
Key: VTd = bortezomib (VELCADE) + thalidomide + dexamethasone; DVTd = daratumumab + bortezomib (VELCADE) + thalidomide + dexamethasone. Key: CI = exact confidence interval. a Mantel-Haenszel estimate of the common odds ratio for stratified tables is used. The stratification factors are site affiliation, ISS stage and cytogenetic risks. b P-value from the stratified Cochran Mantel-Haenszel Chi-Squared test. Note: Response was assessed by computerized algorithm, based on International Uniform Response Criteria Consensus Recommendations. Note: Percentages are calculated with the number of subjects in each group as denominator.
[TEFRESP01_3006.RTF] [JNJ-54767414\MMY3006\DBR_PART1_CSR\RE_PART1_CSR\PROD\TEFRESP01_3006.SAS] 01NOV2018, 17:03

Assessment report EMA/CHMP/22749/2020 Page 37/76
Major Secondary Endpoints For key secondary endpoints, pre-specified hierarchical testing order is 1) post-consolidation MRD negativity rate 2) post-consolidation CR or better rate 3) PFS from first randomization 4) OS from first randomization. Post-consolidation MRD negativity rate Table 15 Summary of Post-Consolidation MRD Negative Rate by Flow Cytometry at 10-5 in Bone Marrow; ITT Analysis set MMY3006
Table 16 Summary of Post-Consolidation VGRD or better MRD Negative Rate by Flow Cytometry at 10-5 in Bone Marrow; ITT Analysis set MMY3006
Table 17 Forest Plot of Subgroup Analyses on Post-consolidation MRD negative Rate by Flow Cytometry at 10-5 in Bone Marrow; ITT Analysis set MMY3006

Assessment report EMA/CHMP/22749/2020 Page 38/76
Post-consolidation CR or better rate
The Number of patients who achieved CR or better was significantly higher in the DVTd group compared with the VTd group, 38.9% vs. 26.0%, (odds ratio=1.82, 95% CI: 1.40, 2.36; p-value<0.0001) (Table 12).
PFS from first randomization
The PFS events (PD or death) may include those that occur in the maintenance phase.
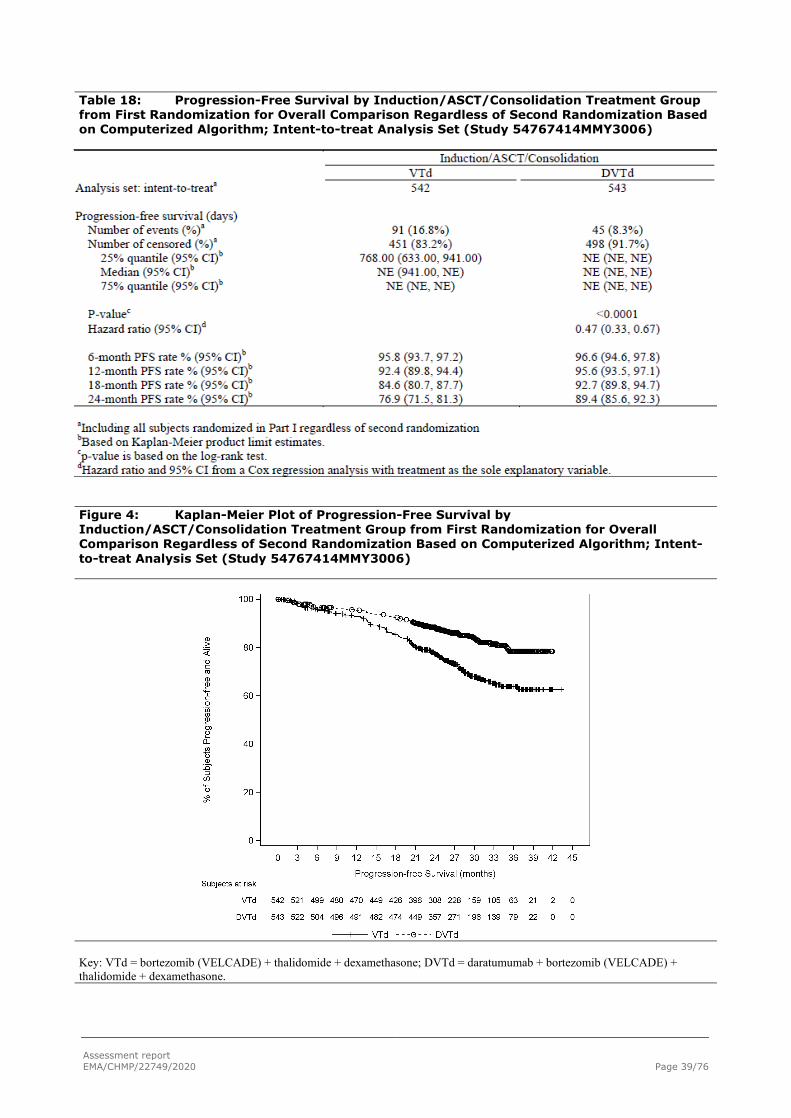
Assessment report EMA/CHMP/22749/2020 Page 39/76
Table 18: Progression-Free Survival by Induction/ASCT/Consolidation Treatment Group from First Randomization for Overall Comparison Regardless of Second Randomization Based on Computerized Algorithm; Intent-to-treat Analysis Set (Study 54767414MMY3006)
Figure 4: Kaplan-Meier Plot of Progression-Free Survival by Induction/ASCT/Consolidation Treatment Group from First Randomization for Overall Comparison Regardless of Second Randomization Based on Computerized Algorithm; Intent-to-treat Analysis Set (Study 54767414MMY3006)
Key: VTd = bortezomib (VELCADE) + thalidomide + dexamethasone; DVTd = daratumumab + bortezomib (VELCADE) + thalidomide + dexamethasone.

Assessment report EMA/CHMP/22749/2020 Page 40/76
Figure 5: Forest Plot of Subgroup Analyses on Progression-Free Survival by Induction/ASCT/Consolidation Treatment Group from First Randomization for Overall Comparison Regardless of Second Randomization Based on Computerized Algorithm; Intent-to-Treat Analysis Set (Study 54767414MMY3006)
Key: VTd = bortezomib (VELCADE) + thalidomide + dexamethasone; DVTd = daratumumab + bortezomib (VELCADE) + thalidomide + dexamethasone. Note: Impaired baseline hepatic function include mild (total bilirubin ≤ ULN and AST > ULN) or (ULN < total bilirubin ≤ 1.5×ULN); moderate (1.5×ULN < total bilirubin ≤ 3×ULN); and severe (total bilirubin > 3×ULN).
OS from first randomization. Table 19: Overall Survival by Induction/ASCT/Consolidation Treatment Group from First Randomization for Overall Comparison Regardless of Second Randomization; Intent-to-treat Analysis Set (Study 54767414MMY3006)
Induction/ASCT/Consolidation VTd DVTd
Analysis set: intent-to-treata 542 543
Overall survival (days) Number of events (%)a 48 (8.9%) 26 (4.8%) Number of censored (%)a 494 (91.1%) 517 (95.2%)
25% quantile (95% CI)b NE (NE, NE) NE (NE, NE) Median (95% CI)b NE (NE, NE) NE (NE, NE) 75% quantile (95% CI)b NE (NE, NE) NE (NE, NE)
P-valuec 0.0070 Hazard ratio (95% CI)d 0.52 (0.33, 0.85)

Assessment report EMA/CHMP/22749/2020 Page 41/76
Table 19: Overall Survival by Induction/ASCT/Consolidation Treatment Group from First Randomization for Overall Comparison Regardless of Second Randomization; Intent-to-treat Analysis Set (Study 54767414MMY3006)
Induction/ASCT/Consolidation VTd DVTd
6-month Survival rate % (95% CI)b 98.9 (97.5, 99.5) 99.6 (98.5, 99.9) 12-month Survival rate % (95% CI)b 97.8 (96.1, 98.7) 98.1 (96.6, 99.0) 18-month Survival rate % (95% CI)b 95.1 (92.9, 96.7) 97.2 (95.4, 98.3) 24-month Survival rate % (95% CI)b 93.2 (90.6, 95.0) 96.6 (94.7, 97.9)
aIncluding all subjects randomized in Part I regardless of second randomization. bBased on Kaplan-Meier product limit estimates. cp-value is based on the log-rank test. dHazard ratio and 95% CI from a Cox regression analysis with treatment as the sole explanatory variable. Figure 6: Kaplan-Meier Plot of Overall Survival by Induction/ASCT/Consolidation Treatment Group from First Randomization for Overall Comparison Regardless of Second Randomization; Intent-to-treat Analysis Set (Study 54767414MMY3006)
Key: VTd = bortezomib (VELCADE) + thalidomide + dexamethasone; DVTd = daratumumab + bortezomib (VELCADE) + thalidomide + dexamethasone.
[GEFOS01E_3006.RTF] [JNJ-54767414\MMY3006\DBR_EMA_UPDATE\RE_EMA_UPDATE\PROD\GEFOS01E_3006.SAS] 24JUL2019, 21:13

Assessment report EMA/CHMP/22749/2020 Page 42/76
Additional Analysis Requested by CHMP An additional analysis was requested by CHMP for PFS censoring subjects randomized to Daratumab Maintenance at 2nd Randomization. Results are shown in Table 20
Table 20 Progression Free Survival by Induction/ASCT/Consolidation Treatment Group from first randomization for overall comparison by censoring subjects randomized to Daratumumab Maintenance at Second randomization based on computerized algorithm.
Other Secondary Endpoints not controlled for multiplicity Post-consolidation VGPR or better and ORR and Post-induction Response Rate Time to progression At the time of clinical cutoff, 42 subjects (7.7%) in the DVTd group and 76 subjects (14.0%) in the VTd group had progressive disease or were reported to have died due to progressive disease throughout the entire study. The analysis showed an improvement for subjects in the DVTd group compared with subjects in the VTd group (HR=0.52; 95% CI: 0.36, 0.76, p=0.0006).
Time to Response The median time to response was approximately 1 month of treatment. Similar median time to VGPR or better (2.14 vs 2.83 months), and median time to CR or better (7.2 vs 7.4 months) were observed for the DVTd group versus the VTd group, respectively. Median durations of response were not reached.
Stem cell-related procedures and Transplant Mobilizing and collecting stem cells was feasible in both treatment arms, the proportion of treated subjects proceeding to stem cell transplantation did not differ between the treatment groups (DVTd: 91.2%, VTD: 90.0%).

Assessment report EMA/CHMP/22749/2020 Page 43/76
Table 21 Stem Cell Mobilization and Harvesting; Safety Analysis Set (MMY3006)
Patient-reported Outcomes (Functional Status and Well-being)
The functional status and well-being results from patient-reported outcome (PRO) endpoints, including the cancer-specific European Organization for Research and Treatment of Cancer - Quality of Life Questionnaire - Core Questionnaire (EORTC-QLQ-C30) and the general health EuroQol 5-dimension Questionnaire (EQ-5D-5L), indicated improvements in health-related quality of life (HRQOL) in subjects who remained in the study in both the DVTd and VTd groups.
Most scores showed numerical improvement in both arms (pain, physical, role and emotional). An improvement in the Global health Status Subscale (GHS) was observed from baseline to 100 days post-

Assessment report EMA/CHMP/22749/2020 Page 44/76
ASCT, but no statistically significant difference was noted between the two treatment groups. Cognitive functioning showed less deterioration in the DVTd group compared with the VTd group from baseline to day 100 post-ASCT (DVTd: -5.0 [95% CI: -7.6, -2.4]; VTd: -7.9 [95% CI: -10.6, -5.3], p=0.0358). An improvement in emotional functioning was observed from baseline to 100 days post-ASCT in the DVTd group (DVTd: 13.0 [95% CI: 10.4, 15.5]; VTd: 9.5 [95% CI: 6.9, 12.1]; p=0.0131). A reduction in pain was observed in both groups, with a greater reduction in pain symptoms from baseline to 100 days post-ASCT in the DVTd group (-23.3 [95% CI: -26.6, -20.0]) compared with VTd (-19.7 [95% CI: -23.0, -16.3]) (p=0.0416).
No statistically significant differences in the EQ-5D-5L LS utility value and theEQ-5D-5L visual analog scale (VAS) was observed for the two treatment groups, improvements in VAS and utility were comparable
Ancillary analyses Subgroup Analyses Figure 7: Forest Plot of Subgroup Analyses on Best Response sCR Based on Computerized Algorithm; Intent-to-treat Analysis Set (Study 54767414MMY3006)
Key: VTd = bortezomib (VELCADE) + thalidomide + dexamethasone; DVTd = daratumumab + bortezomib (VELCADE) + thalidomide + dexamethasone. Note: Impaired baseline hepatic function include mild (total bilirubin ≤ ULN and AST > ULN) or (ULN < total bilirubin ≤ 1.5×ULN); moderate (1.5×ULN < total bilirubin ≤ 3×ULN); and severe (total bilirubin > 3×ULN).

Assessment report EMA/CHMP/22749/2020 Page 45/76
Table 22 Rate of sCR in MRD negative and MRD positive subjects in ITT regardless treatment arm
Table 23 Summary of post-consolidation MRD negative rate by flow cytometry at 10-5 in bone marrow; ITT analysis set (MMY3006)
Summary of main study
The following tables summarise the efficacy results from the main studies supporting the present application. These summaries should be read in conjunction with the discussion on clinical efficacy as well as the benefit risk assessment (see later sections).
Summary of Efficacy for trial MMY 3006 Title: Open-label, Multi-center, randomized Study of Darzalex (daratumumab) in combination with bortezomib, thalidomide and dexamethasone (D-VTd) versus VTd alone for patients with newly diagnosed multiple myeloma who are eligible for autologous stem cell transplant.
Study identifier MMY 3006
Design Phase 3, open-label, multi-center, randomised trial Duration of main phase: study initiation date 22 September 2015,
data cut off 19 June 2018, ongoing
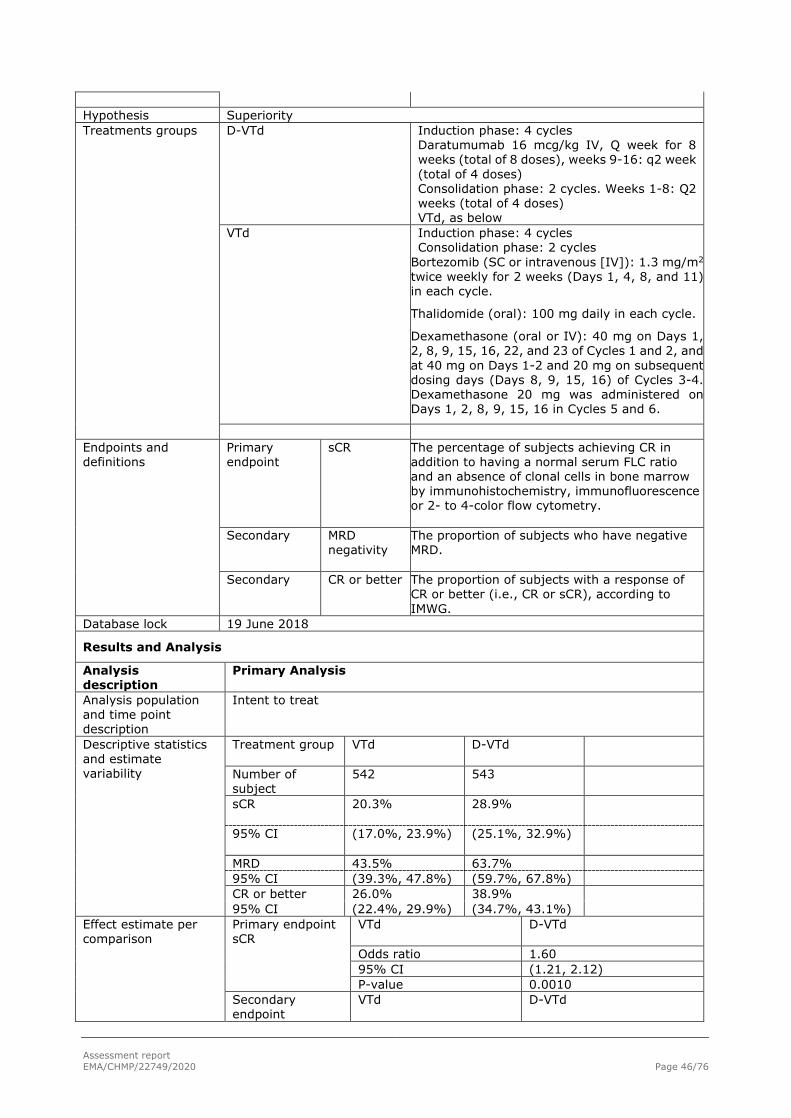
Assessment report EMA/CHMP/22749/2020 Page 46/76
Hypothesis Superiority Treatments groups
D-VTd
Induction phase: 4 cycles Daratumumab 16 mcg/kg IV, Q week for 8 weeks (total of 8 doses), weeks 9-16: q2 week (total of 4 doses) Consolidation phase: 2 cycles. Weeks 1-8: Q2 weeks (total of 4 doses) VTd, as below
VTd Induction phase: 4 cycles Consolidation phase: 2 cycles
Bortezomib (SC or intravenous [IV]): 1.3 mg/m2 twice weekly for 2 weeks (Days 1, 4, 8, and 11) in each cycle.
Thalidomide (oral): 100 mg daily in each cycle.
Dexamethasone (oral or IV): 40 mg on Days 1, 2, 8, 9, 15, 16, 22, and 23 of Cycles 1 and 2, and at 40 mg on Days 1-2 and 20 mg on subsequent dosing days (Days 8, 9, 15, 16) of Cycles 3-4. Dexamethasone 20 mg was administered on Days 1, 2, 8, 9, 15, 16 in Cycles 5 and 6.
Endpoints and definitions
Primary endpoint
sCR
The percentage of subjects achieving CR in addition to having a normal serum FLC ratio and an absence of clonal cells in bone marrow by immunohistochemistry, immunofluorescence or 2- to 4-color flow cytometry.
Secondary MRD negativity
The proportion of subjects who have negative MRD.
Secondary CR or better
The proportion of subjects with a response of CR or better (i.e., CR or sCR), according to IMWG.
Database lock 19 June 2018
Results and Analysis
Analysis description
Primary Analysis
Analysis population and time point description
Intent to treat
Descriptive statistics and estimate variability
Treatment group VTd
D-VTd
Number of subject
542 543
sCR
20.3% 28.9%
95% CI
(17.0%, 23.9%) (25.1%, 32.9%)
MRD 43.5% 63.7% 95% CI (39.3%, 47.8%) (59.7%, 67.8%) CR or better 26.0% 38.9% 95% CI (22.4%, 29.9%) (34.7%, 43.1%)
Effect estimate per comparison
Primary endpoint sCR
VTd D-VTd
Odds ratio 1.60 95% CI (1.21, 2.12) P-value 0.0010
Secondary endpoint
VTd D-VTd

Assessment report EMA/CHMP/22749/2020 Page 47/76
MRD negativity Odds ratio 2.27 95% CI (1.78, 2.90) P-value <0.0001
Secondary endpoint CR or better
VTd D-VTd
Odds ratio 1.82 95% CI (1.40, 2.36) P-value <0.0001
2.4.3. Discussion on clinical efficacy
Design and conduct of clinical studies
The MAH has provided a randomised phase 3, open label multicentre study, MMY3006 in patients 18-65 years newly diagnosed with multiple myeloma and eligible for HDT and ASCT.
The study MMY3006 consists of 2 stages: In Part 1 (Induction/ASCT/Consolidation) subjects were randomized in a 1:1 ratio to receive either D-VTd or VTd (4 cycles of induction therapy before ASCT and 2 cycles of consolidation therapy after ASCT). Response was assessed approximately 100 days post-ASCT and eligibility for the second randomization was determined. In Part 2 (Maintenance) subjects with at least a partial response (PR) by Day 100 post-transplant were re-randomized in a 1:1 ratio to daratumumab maintenance or observation only (not included in this submission). The goal of Part 1 was aimed to show a higher rate of sCR with the fact of adding daratumumab to VTd induction and consolidation therapy.
The objectives are clearly described and the primary endpoint sCR is acceptable, clinically meaningful and important for long term follow-up. The secondary endpoints are acceptable and relevant from a clinical point of view.
The proposed statistical methods are, in general, endorsed. The sample size calculations were based on both the induction and the maintenance phases, the power for the current study, Part 1, is considered acceptable. The MAH acknowledged the CHMP’s concern that the power for the maintenance phase may be decreased when interaction between maintenance and induction treatments exists. Simulations have been performed to understand the impact of the interaction on the power for Part 2.
The randomization stratification factors, i.e. site affiliation, ISS category (I, II, or III), and cytogenetics (standard risk or high risk) were agreed and considered important prognostic factors in MM.
It was agreed that the different age groups of the study should be reflected in Section 5.1, as age is not the only parameter defining eligibility for HDT and ASCT.
The baseline characteristics are well balanced. The majority of patients had IgG myeloma and measurable disease in IgG and IgA, ISS stage I and II, most patients had normal cytogenetics and were considered standard risk (85.5% vs. 15.5%). The median time from diagnosis of multiple myeloma to randomization was approximately 1 month, but the range for “time since initial diagnoses to randomisation” was up to 31 - and 66 months respectively in the VTd and the DVTd group. Minor protocol violations were considered non-significant to the overall result.
Overall the study was well conducted, however the MAH was requested to provide additional analyses in order to obtain more information about the difference observed in PFS given only by the induction/consolidation treatment This is because the treatment effect for PFS for Part 1 is affected by the second part of the study, since patients with PR or better after the consolidation phase were offered to be randomized to daratumumab maintenance or observation.

Assessment report EMA/CHMP/22749/2020 Page 48/76
Efficacy data and additional analyses
The study met its primary endpoint (part 1) results using a clinical cut-off of 19 June 2018showed a statistically significant improvement in the sCR rate post-consolidation (100 days post-ASCT) in favour of D-VTd arm (DVTd 28.9% vs. VTd 20.3%, odds ratio 95%CI: 1.60 (1.21, 2.12), p=0.0010).
Further data was provided from an updated clinical data cut-off of 1 May 2019, i.e. 10 months after the original cut-off. The updated data continue to show a statistically significant improvement in the sCR rate in favour of the D-VTd arm (DVTd 54.3% vs. VTd 42.1%, odds ratio 95%CI: 1.64, 2.09, p<0.0001). The updated results were consistent in the pre-specified subgroups. both ISS Stage III and cytogenetic high-risk subgroups did benefit in the DVTd treatment group compared with the VTd group. The updated investigator assessment was consistent with the computerised algorithm results with an odds ratio 95%CI: 1.66 (1.30, 2.11), p<0.0001. Nevertheless, the clinical relevance of gaining this difference in sCR is not entirely clear. Ideally, a quantitative correlation between sCR and PFS should be shown in order to achieve a positive conclusion from this part 1 of the study. However, the correlation of between-arm differences/odds ratios for sCR and HR for PFS and OS in the present treatment setting is not established. Further, due to the study design, including eligibility for randomisation to part 2 being contingent on a post-baseline event impacted by initial therapy, there appears to be no straightforward way within this study to isolate the impact of the induction/consolidation regimen alone on PFS in the ITT population for study part 1. It is agreed that the depth of response after ASCT in MM, especially achievement of CR is an important predictor of a positive long-term outcome by means of PFS and OS. The MAH refers to previous published trials showing that patients who achieved sCR, had better PFS (Chakraborty, 2017, Van de Velde, 2017). Despite several confounding factors and bias, pooling of previous studies MMY3003, MMY3004 and MMY3007 indicated an association between sCR and PFS. The MAH has updated the efficacy analyses for the MMY3006 study as of clinical cut-off of 1 May 2019, adding 10 months to the follow-up period with a median of 29.2 months of follow-up. The updated data were consistent with the primary analyses, by the means of sCR, CR or better, PFS, MRD negativity and TTP, with and without adjustment for the second randomization. The MAH performed an analysis for PFS where patients who received maintenance therapy at the second randomization were censored. The results are in line with those presented in the primary analysis, with a HR (95% CI) of 0.50 (0.34, 0.75), p-value = 0.0005. This analysis did not take into account the contribution of daratumumab maintenance on PFS. Part of the contribution of induction effect is also removed since patients are censored at the start of maintenance therapy. Therefore, it seems reasonable to conclude that the addition of daratumumab on top of VTd induction/consolidation regimen leads to significantly prolong the PFS over the VTd arm for study part 1
The updated prespecified subgroup analyses of PFS were consistent across subgroups, but OS data were however still immature, as expected.
Secondary endpoints, MRD negativity, CR or better and PFS were consistent and confirmed the primary analysis. The effect on MRD negativity was significant and consistent throughout all subgroups, also the high-risk and ISS Stage III subgroups. However, not all patients who were MRD negative had a sCR/CR response. The MAH speculated whether the discrepancy of MRD and CR may be related to the kinetics of clearance of plasma cells in the bone marrow compared with clearance of paraprotein in blood or urine. An analysis of why MRD negative subjects did not meet CR or sCR according to the IMWG criteria at post consolidation was performed. The main reasons for not having CR/sCR was that a negative immunofixation on the serum or urine could not be established, either due to missing confirmation of the clearance of paraprotein from serum/urine or due to remaining traces of the paraprotein, further sampling error in patient not in CR could not be ruled out. It is acknowledged that clinical trials in MM include measurements of MRD, and future studies can hopefully clarify how MRD pfs be used in clinical practice.
HDT and ASCT was performed in a similar proportion of patients in the two treatment groups. Mobilizing and collecting cells was feasible in both treatment groups. However, more patients in the DVTd group

Assessment report EMA/CHMP/22749/2020 Page 49/76
received Mozobil for mobilization compared with the VTd group (21.7%vs. 7.9%) and the number of collected cells was lower in the D-VTd group compared with the VTd group. This could indicate that patients in the DVTd group were poor mobiliser compared with the VTd group. The MAH performed analyses to identify potential factors that could explain the low yield of CD34+ cells in the DVTd arm. No relationship could be established between neutropenia before start of mobilisation and stem cell output or between the overall response to the treatment and stem cell yield.
It has been stated that subjects who did not achieve a response (i.e. PR or better) entered the Follow-up Phase and were followed until disease progression or death, even if they received subsequent treatment. In this regard
OS and PFS data are still immature. The MAH has committed (letter of recommendation) to provide post-approval updated part 1 PFS results (including the analysis censoring patients in each arm who were randomised to daratumumab maintenance in the second randomisation) and updated part 1 OS data in 2021 based on the data cut of the planned interim analysis.
2.4.4. Conclusions on the clinical efficacy
The Study MMY3006 in the part 1 met its primary endpoint and showed statistically significant results. Based on the whole PFS data, it seems reasonable to expect that the addition of daratumumab on top of VTd in the induction/consolidation regimen provides a longer PFS than VTd.
2.5. Clinical safety
Introduction
Summaries of adverse events and other safety data are based on 1074 subjects (DVTd: 536 subjects, VTd: 538 subjects) who The analysis includes all subjects that were randomized and treated in induction and consolidation (Part 1) or had discontinued study treatment by the time of the data cut-off and contributed any safety data after the start of study treatment, i.e. the Safety Population.
Patient exposure
The median duration of induction/ASCT/consolidation treatment was 8.9 months for the DVTd group and 8.7 months for the VTd group (Table 25). The median number of treatment cycles was 6 (range 1-6) for both DVTd group and VTd group (Table 24).

Assessment report EMA/CHMP/22749/2020 Page 50/76
Table 24 Induction/ASCT/Consolidation Treatment Cycles During Induction/ASCT/Consolidation Phase; Safety Analysis Set (Study 54767414MMY3006)

Assessment report EMA/CHMP/22749/2020 Page 51/76
Table 25 Summary of Duration of Induction/ASCT/Consolidation Treatment and Gaps Between Treatment Phases; Safety Analysis Set (Study 54767414MMY3006)

Assessment report EMA/CHMP/22749/2020 Page 52/76
The mean relative dose intensities were similar between the treatment groups (Table 26):
Table 26 Overview of Relative Dose Intensity During Induction/ASCT/Consolidation Phase; Safety Analysis Set (Study 54767414MMY3006)

Assessment report EMA/CHMP/22749/2020 Page 53/76
Adverse events
In the DVTd and VTd groups, 99.6% and 99.8% of subjects, respectively, experienced at least 1 treatment-emergent adverse event (TEAE) during induction/ASCT/consolidation.
Table 27 Overview of Treatment-Emergent Adverse Events During Induction/ASCT/Consolidation Phase; Safety Analysis Set (Study 54767414MMY3006)
The overall incidences of TEAEs during induction/ASCT/consolidation were similar in both treatment groups (DVTd: 99.6%; VTd: 99.8%). Treatment-emergent adverse events classified by SOC and preferred term that occurred in ≥10% of subjects from either treatment group are presented in Table 28.
TEAEs that occurred at a ≥5% higher frequency in the DVTd treatment group compared with the VTd treatment group, respectively, included
• Nausea (DVTd: 30.2%; VTd: 24.2%)
• Neutropenia (DVTd: 29.3%; VTd: 16.5%)
• Thrombocytopenia (DVTd: 20.3%; VTd: 13.6%)
• Lymphopenia (DVTd: 18.5%; VTd: 12.5%)
• Cough (DVTd: 17.2%; VTd: 10.4%)

Assessment report EMA/CHMP/22749/2020 Page 54/76
Table 28 Overview of Treatment-Emergent Adverse Events During Induction/ASCT/Consolidation Phase; Safety Analysis Set (Study 54767414MMY3006)
Grade 3 or 4 Treatment-emergent Adverse Events
The incidences of Grade 3 and Grade 4 TEAEs reported during induction/ASCT/consolidation were 80.6% in the DVTd group and 75.8% in the VTd group (Table 29).

Assessment report EMA/CHMP/22749/2020 Page 55/76
Table 29 Most Common (at least 5%) Grade 3 or 4 Treatment-emergent Adverse Events During Induction/ASCT/Consolidation Phase by MedDRA System Organ Class, Preferred Term and Maximum Toxicity Grade; Safety Analysis Set (Study 54767414MMY3006)
Adverse Drug Reactions
1. All TEAEs reported in ≥10% subjects in the DVTd treatment group and occurred at a higher incidence (≥5% difference) in the DVTd treatment group compared with the VTd treatment group were considered ADRs (Table 30). A comparative incidence of TEAEs between the 2 treatment groups was completed after rounding incidences to whole numbers for all events (i.e., 4.9% is rounded to 5%).
Table 30 Adverse Drug reactions (Study 54767414MMY3006)
2. All laboratory parameters in Study MMY3006 were reviewed. No laboratory parameters had an incidence of Grade 3 or 4 values ≥10% except for haematology parameters (Table 31).
3. Thrombocytopenia, neutropenia, lymphopenia, leukopenia, and anaemia are listed in a separate haematology laboratory table based on haematology laboratory parameters regardless of the incidence and difference between treatment groups (Table 31).

Assessment report EMA/CHMP/22749/2020 Page 56/76
Table 31 Treatment-emergent Hematology Lab Abnormalities; Safety Analysis Set (Study 54767414MMY3006)
4. Serious TEAEs that occurred at a higher incidence (≥2% difference) in the DVTd group compared with the VTd treatment group were considered ADRs (Table 32). A comparative incidence was completed after rounding to whole numbers for all events.
Table 32 Treatment-emergent Serious Adverse Events That Have ≥ 2% Higher Incidence in DVTd Than VTd During Induction/ASCT/consolidation Phase by System Organ Class and Preferred Term; Safety Analysis Set (Study 54767414MMY3006)
Pooled ADR Safety Data Set
Frequencies of ADRs from the pooled safety data set are included in the Summary of Product Characteristics (SmPC). The pooled safety data set reflects exposure to daratumumab (16 mg/kg) in 2,066 subjects with multiple myeloma including 536 subjects from Study MMY3006 and 1,530 subjects from 4 Phase 3 active controlled studies in which subjects received daratumumab in combination with either lenalidomide and dexamethasone (DRd, n=283 [Study MMY3003] and n=364 [Study MMY3008]), bortezomib and dexamethasone (DVd, n=243 [Study MMY3004]), or bortezomib, melphalan, and prednisone (D-VMP, n=346 [Study MMY3007]); and 5 non-randomized, clinical studies in which subjects received daratumumab either in combination with pomalidomide and dexamethasone (DPd, n=103) or lenalidomide and dexamethasone (DRd, n=35), or daratumumab as monotherapy (n=156).

Assessment report EMA/CHMP/22749/2020 Page 57/76
Table 33 Adverse reactions in multiple myeloma patients treated with DARZALEX 16 mg/kg

Assessment report EMA/CHMP/22749/2020 Page 58/76
Serious adverse event/deaths/other significant events
Table 34 presents a summary of deaths that occurred up to the clinical cut-off for this analysis.
Table 34 Death and Primary Cause of Death by Treatment Group; Safety Analysis Set (Study 54767414MMY3006)
During induction/ASCT/consolidation phase of the study, TEAEs with an outcome of death (toxicity Grade 5) were reported in 1 subject in the DVTd group (cardiac arrest; unrelated to study treatment) and 9 subjects (1.7%) in the VTd group (Table 27, Table 29). Of the 9 subjects with a TEAE outcome of death in the VTd group, only 7 subject deaths occurred within 30 days of last dose (Table 29). With the exception of the general term “death” (3 subjects), each fatal AE was reported in only 1 subject each.

Assessment report EMA/CHMP/22749/2020 Page 59/76
Table 35 Treatment-Emergent Adverse Events with Outcome of Death During Induction/ASCT/Consolidation Phase by System Organ Class, Preferred Term and Relationship; Safety Analysis Set (Study 54767414MMY3006)
The overall incidence of serious TEAEs was similar for both treatment groups (DVTd: 46.8%; VTd: 47.4%) (Table 13/SCS). Serious TEAEs that occurred at a ≥3% frequency in either treatment group were:
• Neutropenia (DVTd: 3.9%; VTd: 1.5%)
• Pneumonia (DVTd: 3.5%; VTd: 1.7%)
• Pyrexia (DVTd: 2.8%; VTd: 4.3%)
• Pulmonary embolism (DVTd: 1.5%; VTd: 3.7%)
Table 36 Most Common (At Least 2%) Treatment-Emergent Serious Adverse Events During Induction/ASCT/Consolidation Phase by System Organ Class, Preferred Term; Safety Analysis Set (Study 54767414MMY3006)

Assessment report EMA/CHMP/22749/2020 Page 60/76
Neutropenia was the only serious TEAEs that occurred at a ≥2% higher frequency in the DVTd treatment group compared with the VTd treatment group. Pulmonary embolism was the only serious TEAE that occurred at a ≥2% higher frequency in the VTd treatment group compared with the DVTd treatment group.
Adverse Events of Special Interest (AESI)
Infusion-Related Reactions (IRRs)
Of the 536 subjects who received daratumumab, 190 subjects (35.4%) experienced an IRR associated with daratumumab administration (Mod5.3.5.1/MMY3006/AttTSFAE06A). Of these 190 subjects with an IRR, 90.0% (n=171) were Grade 1 or 2 IRRs; 3.2% (n=17) were Grade 3 IRRs; 0.4% (n=2) were Grade 4 IRRs; no Grade 5 IRR was reported. The most frequently reported TEAE term (reported in ≥5% of subjects) used to describe IRRs was chills (5.6%).
Cytopenias
Neutropenia-Related Events
The incidence of neutropenia-related events (preferred term grouping of neutropenia, febrile neutropenia, neutropenic sepsis, and neutropenic infection) was higher in the DVTd treatment group (34.9% [Grade 3 or 4: 33.0%]) than in the VTd treatment group (24.5% [Grade 3 or 4: 21.9%]) (Table 37 and Table 38). The higher rate of neutropenia-related events did not translate into a higher rate of neutropenic fever, which was similar between the 2 treatment groups (DVTd: 6.9%; VTd: 5.2%). Neutropenia was managed with the use of growth factors (DVTd: 13.8%; VTd: 7.7%). There were no neutropenia-related events that led to the discontinuation of study treatment in either treatment group.
Table 37 Treatment-emergent Neutropenia During Induction/ASCT/Consolidation Phase by Phase (First Onset), MedDRA System Organ Class and Preferred Term; Safety Analysis Set (Study 54767414MMY3006)

Assessment report EMA/CHMP/22749/2020 Page 61/76
Table 38 Treatment-emergent Neutropenia During Induction/ASCT/Consolidation Phase by Phase (First Onset), MedDRA System Organ Class and Preferred Term; Safety Analysis Set (Study 54767414MMY3006)
Thrombocytopenia
The incidence of thrombocytopenia was higher in the DVTd treatment group (20.3% [Grade 3 or 4: 11.0%]) compared with the VTd treatment group (13.6% [Grade 3 or 4: 7.4%]).
Table 39 Treatment-emergent Thrombocytopenia During Induction/ASCT/Consolidation Phase by Phase (First Onset), MedDRA System Organ Class and Preferred Term; Safety Analysis Set (Study 54767414MMY3006)
The incidence of treatment-emergent haemorrhage events was low for both treatment groups (DVTd: 7.5% [Grade 3 or 4: 1.1%]; VTd: 6.7% [Grade 3 or 4: 0.7%]).
Viral infections
A total of 21 subjects reported a medical history of HBV infection (10 in the DVTd group and 11 in the VTd group). No subjects were reported with HBV reactivation in either treatment group.
Opportunistic infections
Opportunistic infections were defined as a subpopulation of the SOC “infections and infestations” by clinical review.
The incidence of treatment-emergent opportunistic infections was numerically higher in the DVTd treatment group compared to the VTd treatment group (DVTd: 13.1%; VTd: 8.2%). Grade 3 or 4 TEAEs opportunistic infections were low in both treatment groups (DVTd: 3.0%; VTd: 1.7%). There was no overall pattern regarding the type of opportunistic infection associated with the use of daratumumab.

Assessment report EMA/CHMP/22749/2020 Page 62/76
Table 40 Grade 3 or 4 Treatment-emergent Opportunistic Infections During Induction/ASCT/Consolidation Phase by Phase (First Onset), MedDRA System Organ Class and Preferred Term; Safety Analysis Set (Study 54767414MMY3006)
Tumor lysis syndrome
Tumor lysis syndrome was reported for no subject in the DVTd group and 1 subject in the VTd treatment group (Grade 3).
Treatment-emergent Interferences for Blood Typing
No subject had treatment-emergent interference for blood typing reported during the induction/ASCT/consolidation phase of the study.
Secondary Primary Malignancies
With a median follow-up of 18.8 months, the incidence of SPMs was balanced between both treatment groups (DVTd: 10 subjects [1.9%]; VTd: 12 subjects [2.2%]).
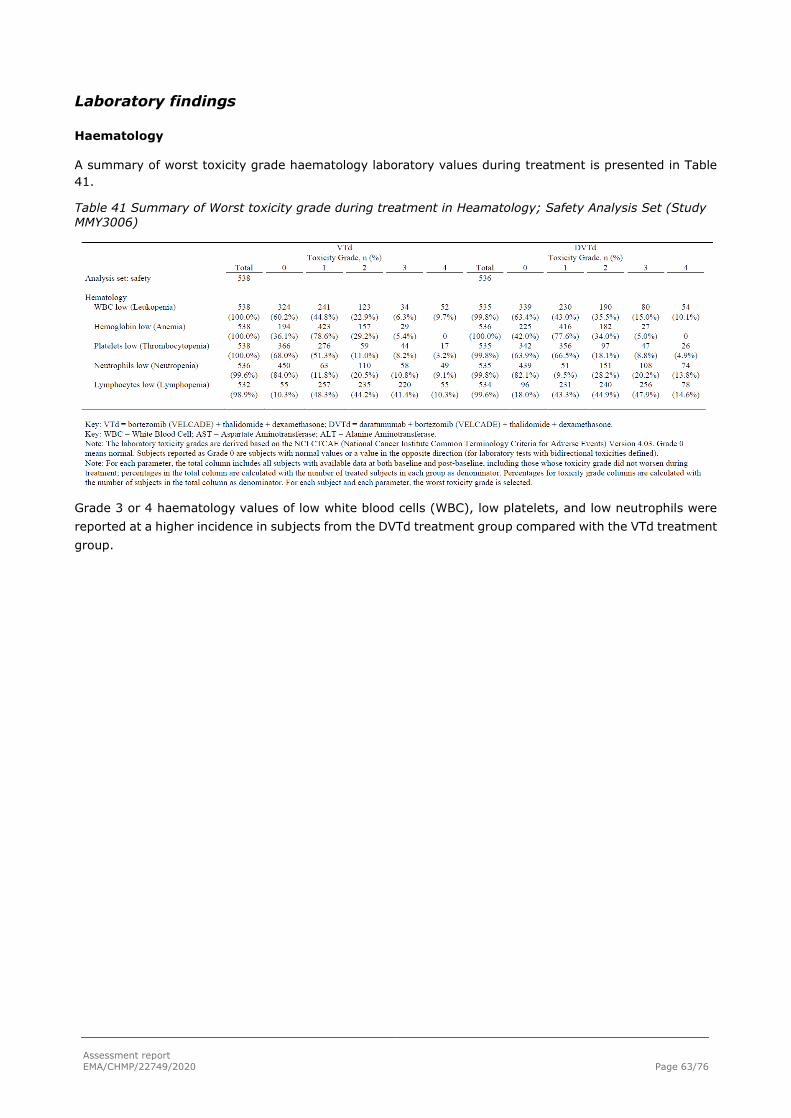
Assessment report EMA/CHMP/22749/2020 Page 63/76
Laboratory findings
Haematology
A summary of worst toxicity grade haematology laboratory values during treatment is presented in Table 41.
Table 41 Summary of Worst toxicity grade during treatment in Heamatology; Safety Analysis Set (Study MMY3006)
Grade 3 or 4 haematology values of low white blood cells (WBC), low platelets, and low neutrophils were reported at a higher incidence in subjects from the DVTd treatment group compared with the VTd treatment group.

Assessment report EMA/CHMP/22749/2020 Page 64/76
Chemistry
Overall, there were no clinically relevant trends observed for any chemistry parameter. Grade 3 or 4 biochemistry laboratory abnormalities during the study were low (<5%) in both treatment groups, with the exception of Grade 4 events of hypercalcemia (DVTd: 7.7%; VTd: 10.1%).
Table 42 Summary of Worst toxicity grade during treatment in Heamatology and Biochemistry; Safety Analysis Set (Study MMY3006)
A summary of biochemistry laboratory values over time is provided in Table 43.
Table 43 Chemistry: values and changes from pre-induction baseline over time during Induction/ASCT/Consolidation Phase Safety Analysis Set (Study MMY3006)
TSFLAB01B_EMA_3006: Calcium and Urate: Values and Changes from Pre-induction Baseline Over Time During Induction/ASCT/Consolidation Phase; Safety Analysis Set (Study 54767414MMY3006)
Induction/ASCT/Consolidation Change from Baseline
N Mean SD Median Min Max Base Mean N Mean SD SE Median Min Max
Calcium Corrected (mmol/L)
VTd Pre-induction
baseline 537 2.39 0.171 2.38 1.7 3.5 2.39 Cycle 2 Day 1 485 2.32 0.122 2.31 1.9 2.9 2.39 484 -0.08 0.177 0.008 -0.06 -1.1 0.7

Assessment report EMA/CHMP/22749/2020 Page 65/76
TSFLAB01B_EMA_3006: Calcium and Urate: Values and Changes from Pre-induction Baseline Over Time During Induction/ASCT/Consolidation Phase; Safety Analysis Set (Study 54767414MMY3006)
Induction/ASCT/Consolidation Change from Baseline
N Mean SD Median Min Max Base Mean N Mean SD SE Median Min Max
Cycle 3 Day 1 482 2.30 0.109 2.30 1.9 2.7 2.39 481 -0.09 0.184 0.008 -0.07 -1.1 0.7 Cycle 4 Day 1 474 2.29 0.108 2.29 2.0 2.6 2.39 474 -0.11 0.180 0.008 -0.10 -1.1 0.6 Cycle 5 Day 1 396 2.30 0.111 2.30 1.8 2.7 2.39 396 -0.09 0.193 0.010 -0.07 -1.1 0.6 Cycle 6 Day 1 404 2.29 0.117 2.29 1.3 2.6 2.39 404 -0.10 0.189 0.009 -0.10 -1.2 0.5
DVTd
Pre-induction baseline 536 2.38 0.178 2.37 1.2 3.3 2.38
Cycle 2 Day 1 490 2.29 0.114 2.29 1.9 2.8 2.38 490 -0.08 0.175 0.008 -0.09 -0.7 1.2 Cycle 3 Day 1 475 2.29 0.116 2.28 1.8 2.7 2.38 475 -0.09 0.181 0.008 -0.08 -0.7 1.3 Cycle 4 Day 1 479 2.28 0.118 2.28 1.9 3.0 2.38 479 -0.09 0.181 0.008 -0.08 -0.7 1.2 Cycle 5 Day 1 410 2.31 0.102 2.30 2.1 2.7 2.39 410 -0.08 0.160 0.008 -0.07 -0.7 0.5 Cycle 6 Day 1 430 2.29 0.108 2.29 1.9 2.7 2.38 430 -0.09 0.177 0.009 -0.08 -0.8 1.1
Total
Pre-induction baseline 1073 2.39 0.174 2.38 1.2 3.5 2.39
Cycle 2 Day 1 975 2.31 0.118 2.30 1.9 2.9 2.39 974 -0.08 0.176 0.006 -0.07 -1.1 1.2 Cycle 3 Day 1 957 2.30 0.112 2.29 1.8 2.7 2.38 956 -0.09 0.182 0.006 -0.08 -1.1 1.3 Cycle 4 Day 1 953 2.29 0.113 2.29 1.9 3.0 2.38 953 -0.10 0.181 0.006 -0.09 -1.1 1.2 Cycle 5 Day 1 806 2.31 0.106 2.30 1.8 2.7 2.39 806 -0.08 0.177 0.006 -0.07 -1.1 0.6 Cycle 6 Day 1 834 2.29 0.112 2.29 1.3 2.7 2.38 834 -0.10 0.183 0.006 -0.09 -1.2 1.1

Assessment report EMA/CHMP/22749/2020 Page 66/76
TSFLAB01B_EMA_3006: Calcium and Urate: Values and Changes from Pre-induction Baseline Over Time During Induction/ASCT/Consolidation Phase; Safety Analysis Set (Study 54767414MMY3006)
Induction/ASCT/Consolidation Change from Baseline
N Mean SD Median Min Max Base Mean N Mean SD SE Median Min Max
Urate (umol/L) VTd
Pre-induction baseline 525 337.44 95.067 333.00 60.0 826.8 337.44
Cycle 2 Day 1 456 250.92 73.272 242.50 22.0 512.0 339.30 453 -88.05 72.530 3.408 -83.00 -523.4 89.2 Cycle 3 Day 1 443 240.28 73.411 231.97 28.0 560.0 339.13 438 -98.83 75.606 3.613 -97.50 -523.4 154.1 Cycle 4 Day 1 448 249.02 73.753 239.50 89.0 529.4 338.62 444 -89.31 70.505 3.346 -83.27 -529.4 90.0 Cycle 5 Day 1 360 286.71 75.666 286.00 0.3 516.3 338.03 354 -51.27 77.838 4.137 -45.00 -409.8 154.0 Cycle 6 Day 1 369 253.90 68.795 248.00 60.0 498.0 336.80 363 -82.73 75.121 3.943 -77.32 -446.1 189.0
DVTd
Pre-induction baseline 523 337.19 98.112 328.00 1.0 672.0 337.19
Cycle 2 Day 1 451 236.13 69.887 231.00 0.2 462.0 336.80 447
-100.92 77.215 3.652 -95.00 -398.0 242.0
Cycle 3 Day 1 451 231.37 69.370 226.02 0.2 547.2 337.93 447
-106.58 80.905 3.827
-102.00 -388.0 265.3
Cycle 4 Day 1 442 244.10 72.916 237.96 0.2 570.0 335.89 438 -91.52 82.445 3.939 -89.61 -392.6 271.2 Cycle 5 Day 1 386 283.50 74.024 280.00 31.5 640.0 334.84 382 -50.80 78.627 4.023 -47.79 -309.3 241.5 Cycle 6 Day 1 396 253.83 72.080 249.82 0.2 460.0 336.16 390 -81.81 77.264 3.912 -80.00 -380.7 283.1
Total
Pre-induction baseline 1048 337.31 96.552 329.50 1.0 826.8 337.31
Cycle 2 Day 1 907 243.56 71.951 237.92 0.2 512.0 338.06 900 -94.44 75.128 2.504 -89.25 -523.4 242.0 Cycle 3 Day 1
894 235.78 71.500 230.00 0.2 560.0 338.52 885 -
102.74 78.379 2.635 -
101.00 -523.4 265.3 Cycle 4 Day 1 890 246.58 73.339 239.00 0.2 570.0 337.27 882 -90.41 76.631 2.580 -88.31 -529.4 271.2 Cycle 5 Day 1 746 285.05 74.788 282.00 0.3 640.0 336.37 736 -51.03 78.195 2.882 -47.00 -409.8 241.5 Cycle 6 Day 1 765 253.87 70.468 249.82 0.2 498.0 336.47 753 -82.25 76.189 2.776 -79.00 -446.1 283.1
Key: VTd = bortezomib (VELCADE) + thalidomide + dexamethasone; DVTd = daratumumab + bortezomib (VELCADE) + thalidomide + dexamethasone. [TSFLAB01B_EMA_3006.RTF] [JNJ-54767414\MMY3006\DBR_EMA_UPDATE\RE_EMA_UPDATE\PROD\TSFLAB01B_EMA_3006.SAS]
29JUL2019, 21:33

Assessment report EMA/CHMP/22749/2020 Page 67/76
Vital signs
A summary of vital signs collected at baseline is provided in Table 44. There were no clinically meaningful differences between the treatment groups.
Table 44 Summary of Vital Signs Values at Pre-induction Baseline; Intent-to-treat Analysis Set (Study 54767414MMY3006)
Safety in special populations
Subgroup analyses of adverse events (TEAEs, serious TEAEs, Grade 3 or higher TEAEs, treatment discontinuations due to TEAEs, and drug related TEAEs) demonstrated that the safety profile of DVTd and

Assessment report EMA/CHMP/22749/2020 Page 68/76
VTd was consistent across pre-specified, clinically relevant subgroups. Race was not collected in accordance with the study protocol.
Table 45 Subgroup Analyses on Overview of Treatment-Emergent Adverse Events During Induction/ASCT/Consolidation Phase;Safety Analysis Set (Study 54767414MMY3006)

Assessment report EMA/CHMP/22749/2020 Page 69/76
Safety related to drug-drug interactions and other interactions
No dedicated drug-drug interaction studies were performed. Since there is no overlapping pathway of elimination, no pharmacokinetic interactions are expected between daratumumab and co-administered small-molecule drugs such as bortezomib, thalidomide, and dexamethasone. As reported in a previous submission, analysis of daratumumab and bortezomib concentrations from Study MMY1001 indicated a lack of clinically relevant drug-drug interaction between these molecules.
Discontinuation due to adverse events
The frequency of AEs leading to treatment discontinuation in induction/ASCT/consolidation was similar in DVTd group (7.5%) compared with VTd group (8.4%). The most common reported AE leading to treatment discontinuation was peripheral sensory neuropathy (DVTd: 1.9%; VTd: 4.3%) (Table 26).
Table 46Most Common (at least 1%) Treatment-Emergent Adverse Events Leading to Discontinuation of Study Treatment During Induction/ASCT/Consolidation Phase by MedDRA System Organ Class, Preferred Term and Maximum Toxicity Grade; Safety Analysis Set (Study 54767414MMY3006)
Adverse Events Leading to Dose Modifications of Daratumumab
TEAEs leading to daratumumab infusion interruptions were reported in 31.9% of subjects. The most commonly reported (≥2%) TEAEs leading to daratumumab infusion interruptions were consistent with IRRs and include:
• Chills (4.1%)
• Dyspnoea (2.6%)
• Pyrexia (2.4%)
• Cough (2.2%)
• Vomiting (2.2%)
• Nausea (2.1%)
Grade 3 or 4 TEAEs leading to daratumumab infusion interruptions were infrequent, occurring in 3.2% of subjects.

Assessment report EMA/CHMP/22749/2020 Page 70/76
2.6. Discussion on clinical safety
There are no new safety signals from this study: Neutropenia and infections, in particular respiratory but with no particular pattern of infectious agent, were more frequently observed in the DVTd arm as was nausea, thrombocytopenia, lymphopenia, and cough. The TEAEs that occurred more frequently in the DVTd arm are all well-known AEs (Very Common) for daratumumab as listed in the SmPC.
The results for IRRs in study 3006 are in line with the previous studies as listed in the SmPC.
According to the RMP Hepatitis B virus reactivation has been added to the list of Important identified risks;. In study 3006 10 subjects in the DVTd group and 11 in the VTd group reported a medical history of HBV infection. Half of the patients in each arm received Hepatitis B prophylaxis. No subjects were reported with HBV reactivation in either treatment group.
2.6.1. Conclusions on clinical safety
Overall, the addition of daratumumab to the combination of VTd does not seem to increase toxicity significantly and it appears to be relatively well tolerated. The safety profile of daratumumab is unchanged. The toxicity reflects the well-known safety profile as described in the SmPC. The majority of adverse events are manageable in the clinical setting and well-known to haematologists (cytopenias and infections). No new safety signals from study MMMY3006 were observed.
2.6.2. PSUR cycle
The requirements for submission of periodic safety update reports for this medicinal product are set out in the list of Union reference dates (EURD list) provided for under Article 107c(7) of Directive 2001/83/EC and any subsequent updates published on the European medicines web-portal.
2.7. Risk management plan
The CHMP endorsed the Risk Management Plan version 6.4 with the following content:
Safety concerns
Table 47: Summary of the safety concerns:
Important identified risks Interference for blood typing (minor antigen) (positive indirect Coombs’ test)
Hepatitis B virus reactivation
Important potential risk Immunogenicity
Missing information Use in pregnancy and lactation
Reproductive and developmental toxicity
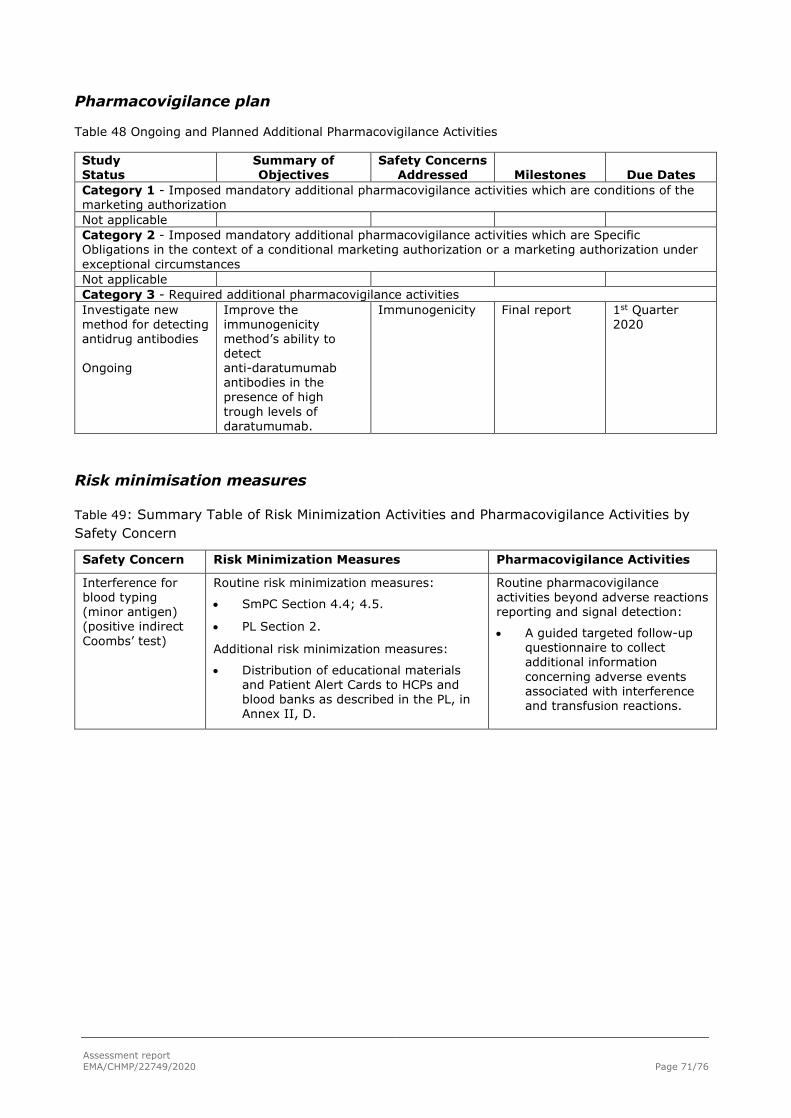
Assessment report EMA/CHMP/22749/2020 Page 71/76
Pharmacovigilance plan
Table 48 Ongoing and Planned Additional Pharmacovigilance Activities
Study Status
Summary of Objectives
Safety Concerns Addressed Milestones Due Dates
Category 1 - Imposed mandatory additional pharmacovigilance activities which are conditions of the marketing authorization Not applicable Category 2 - Imposed mandatory additional pharmacovigilance activities which are Specific Obligations in the context of a conditional marketing authorization or a marketing authorization under exceptional circumstances Not applicable Category 3 - Required additional pharmacovigilance activities Investigate new method for detecting antidrug antibodies Ongoing
Improve the immunogenicity method’s ability to detect anti-daratumumab antibodies in the presence of high trough levels of daratumumab.
Immunogenicity Final report 1st Quarter 2020
Risk minimisation measures
Table 49: Summary Table of Risk Minimization Activities and Pharmacovigilance Activities by Safety Concern
Safety Concern Risk Minimization Measures Pharmacovigilance Activities
Interference for blood typing (minor antigen) (positive indirect Coombs’ test)
Routine risk minimization measures:
• SmPC Section 4.4; 4.5.
• PL Section 2.
Additional risk minimization measures:
• Distribution of educational materials and Patient Alert Cards to HCPs and blood banks as described in the PL, in Annex II, D.
Routine pharmacovigilance activities beyond adverse reactions reporting and signal detection:
• A guided targeted follow-up questionnaire to collect additional information concerning adverse events associated with interference and transfusion reactions.

Assessment report EMA/CHMP/22749/2020 Page 72/76
Safety Concern Risk Minimization Measures Pharmacovigilance Activities
Hepatitis B virus reactivation
Routine risk minimization measures:
• SmPC Section 4.4; 4.8.
• PL Section 2; 4.
Additional risk minimization measures:
• Distribution of a DHPC to HCPs who prescribe daratumumab was issued in the EU member states in June 2019.
Routine pharmacovigilance activities beyond adverse reactions reporting and signal detection:
• None.
Additional pharmacovigilance activities:
• None.
Immunogenicity Routine risk minimization measures:
• SmPC Section 5.1.
Additional risk minimization measures:
• None.
Routine pharmacovigilance activities beyond adverse reactions reporting and signal detection:
• None.
Additional pharmacovigilance activities:
• Investigation of a new method for detecting antidrug antibodies to improve the immunogenicity method’s ability to detect anti-daratumumab antibodies in the presence of high trough levels of daratumumab. Final report 4th Quarter 2018.
Use in pregnancy and lactation
Routine risk minimization measures:
• SmPC Section 4.6 and PL Section 2.
Additional risk minimization measures:
• None.
Routine pharmacovigilance activities beyond adverse reactions reporting and signal detection:
• None.
Additional pharmacovigilance activities:
• None.
Reproductive and developmental toxicity
Routine risk communication:
• SmPC Section 5.3.
Additional risk minimization measures:
• None.
Routine pharmacovigilance activities beyond adverse reactions reporting and signal detection:
• None.
Additional pharmacovigilance activities:
• None.
The CHMP, having considered the data submitted in the application was of the opinion that the risk management plan is acceptable.
2.8. Update of the Product information
As a consequence of this new indication, sections 4.1, 4.2, 4.5, 4.8, 5.1 and 5.2 of the SmPC have been updated. The Package Leaflet has been updated accordingly.
2.8.1. User consultation
A justification for not performing a full user consultation with target patient groups on the package leaflet has been submitted by the MAH and has been found acceptable for the following reasons:

Assessment report EMA/CHMP/22749/2020 Page 73/76
The changes to the package leaflet are minimal and do not require user consultation with target patient groups.
3. Benefit-Risk Balance
3.1. Therapeutic Context
Darzalex is indicated in combination with bortezomib, thalidomide and dexamethasone for the treatment of adult patients with newly diagnosed multiple myeloma who are eligible for autologous stem cell transplant.
3.2. Disease or condition
Multiple myeloma, a malignant disorder of plasma cells, is characterised by uncontrolled and progressive proliferation of plasma cell clones. The proliferation of myeloma cells causes displacement of the normal bone marrow hematopoietic precursors, an overproduction of M-proteins, anemia and an increased susceptibility to infections. Other characteristics to multiple myeloma include osteolytic lesions, hypercalcemia, renal insufficiency and neurological complications, resulting in progressive morbidity and eventual mortality.
3.2.1. Available therapies and unmet medical need
Patients with newly diagnosed multiple myeloma are typically categorised into 2 subpopulations defined by their age, comorbidity and suitability for intensive treatment. For patients who are less than 65 years of age and considered fit, an induction regimen followed by high dose chemotherapy (HDT) and ASCT is considered the standard of care according to European Society for Medical Oncology [ESMO]; Moreau 2017 guidelines. Patient up to 70 years who are considered fit will usually also be treated in a similar way.
For induction, a triplet regimen such as VTd, bortezomib + cyclophosphamide + dexamethasone (VCd), bortezomib + doxorubicin + dexamethasone (PAD) or VRd are the current standard of care for induction therapy. In Europe, VTd and VCd are the more commonly used regimens with 4 to 6 courses typically given before transplant.
3.2.2. Main clinical studies
The MAH has provided a randomised phase 3, open label multicentre study, MMY3006 in patients 18-65 years newly diagnosed with multiple myeloma and eligible for HDT and ASCT randomized in a 1:1 ratio to receive either D-VTd or VTd (4 cycles of induction therapy before ASCT and 2 cycles of consolidation therapy after ASCT).
3.3. Favourable effects
The study met its primary endpoint, a statistically significant improvement in the sCR rate 100 days post-ASCT was demonstrated in favour of D-VTd, 28.9% vs. 20.3%.
Additional data from an exploratory analysis, corresponding to an updated clinical data cut-off of 1 May 2019, i.e. 10 months after the original cut-off date was provided as well. The updated data confirmed a statistically significant improvement in the sCR rate in favour of D-VTd, 54.3% vs. 42.1%. The results were consistent in the pre-specified subgroups.
Secondary endpoints: MRD negativity, CR or better and PFS were consistent and confirmed the primary analysis.
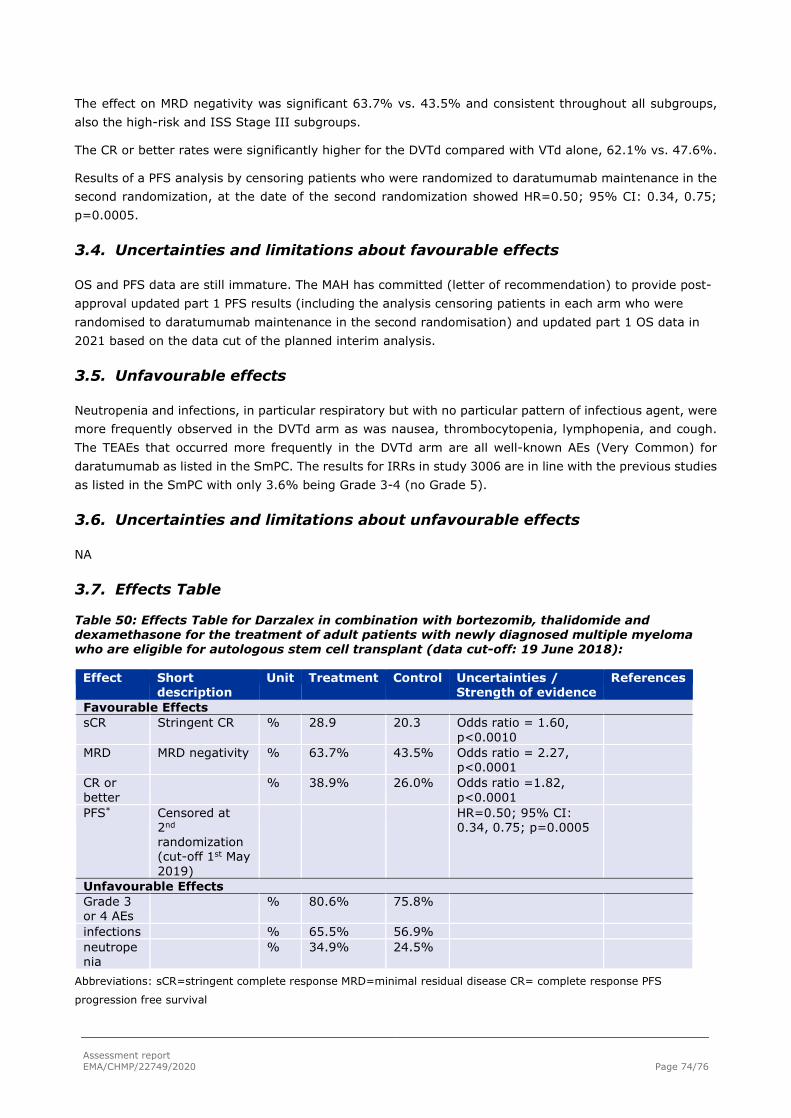
Assessment report EMA/CHMP/22749/2020 Page 74/76
The effect on MRD negativity was significant 63.7% vs. 43.5% and consistent throughout all subgroups, also the high-risk and ISS Stage III subgroups.
The CR or better rates were significantly higher for the DVTd compared with VTd alone, 62.1% vs. 47.6%.
Results of a PFS analysis by censoring patients who were randomized to daratumumab maintenance in the second randomization, at the date of the second randomization showed HR=0.50; 95% CI: 0.34, 0.75; p=0.0005.
3.4. Uncertainties and limitations about favourable effects
OS and PFS data are still immature. The MAH has committed (letter of recommendation) to provide post-approval updated part 1 PFS results (including the analysis censoring patients in each arm who were randomised to daratumumab maintenance in the second randomisation) and updated part 1 OS data in 2021 based on the data cut of the planned interim analysis.
3.5. Unfavourable effects
Neutropenia and infections, in particular respiratory but with no particular pattern of infectious agent, were more frequently observed in the DVTd arm as was nausea, thrombocytopenia, lymphopenia, and cough. The TEAEs that occurred more frequently in the DVTd arm are all well-known AEs (Very Common) for daratumumab as listed in the SmPC. The results for IRRs in study 3006 are in line with the previous studies as listed in the SmPC with only 3.6% being Grade 3-4 (no Grade 5).
3.6. Uncertainties and limitations about unfavourable effects
NA
3.7. Effects Table
Table 50: Effects Table for Darzalex in combination with bortezomib, thalidomide and dexamethasone for the treatment of adult patients with newly diagnosed multiple myeloma who are eligible for autologous stem cell transplant (data cut-off: 19 June 2018):
Effect Short description
Unit Treatment Control Uncertainties / Strength of evidence
References
Favourable Effects sCR Stringent CR % 28.9 20.3 Odds ratio = 1.60,
p<0.0010
MRD MRD negativity % 63.7% 43.5% Odds ratio = 2.27, p<0.0001
CR or better
% 38.9% 26.0% Odds ratio =1.82, p<0.0001
PFS* Censored at 2nd randomization (cut-off 1st May 2019)
HR=0.50; 95% CI: 0.34, 0.75; p=0.0005
Unfavourable Effects Grade 3 or 4 AEs
% 80.6% 75.8%
infections % 65.5% 56.9% neutropenia
% 34.9% 24.5%
Abbreviations: sCR=stringent complete response MRD=minimal residual disease CR= complete response PFS
progression free survival
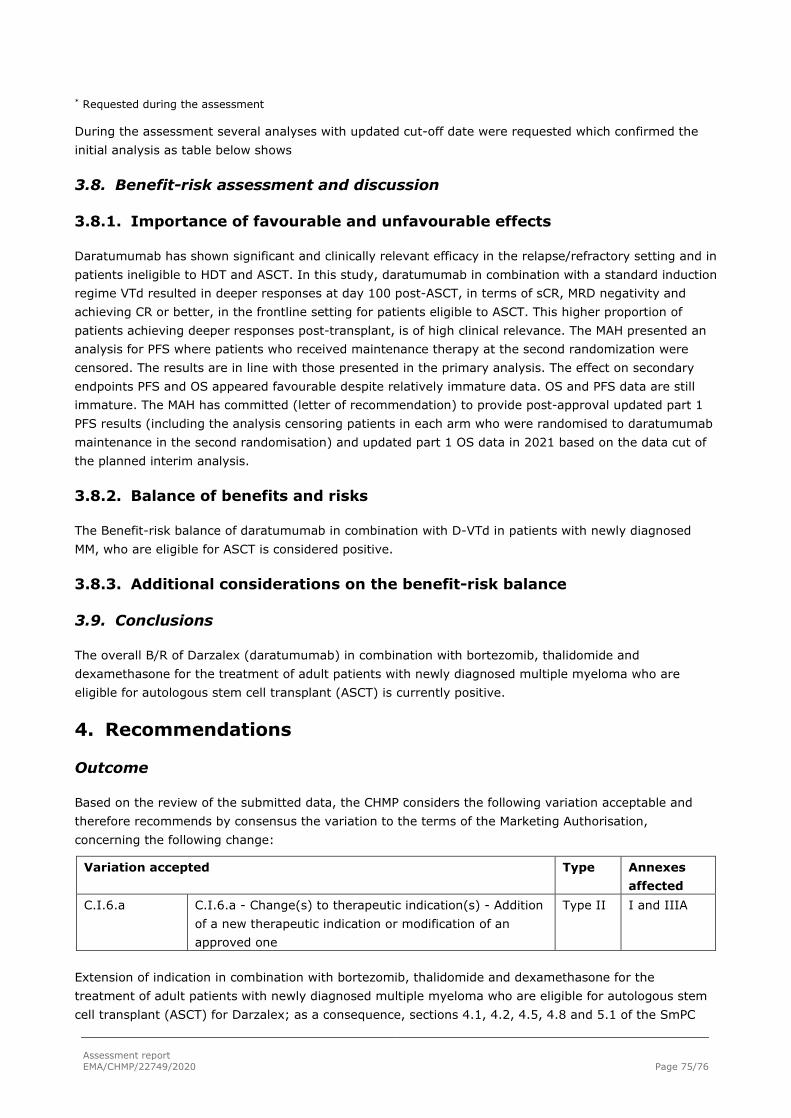
Assessment report EMA/CHMP/22749/2020 Page 75/76
* Requested during the assessment
During the assessment several analyses with updated cut-off date were requested which confirmed the initial analysis as table below shows
3.8. Benefit-risk assessment and discussion
3.8.1. Importance of favourable and unfavourable effects
Daratumumab has shown significant and clinically relevant efficacy in the relapse/refractory setting and in patients ineligible to HDT and ASCT. In this study, daratumumab in combination with a standard induction regime VTd resulted in deeper responses at day 100 post-ASCT, in terms of sCR, MRD negativity and achieving CR or better, in the frontline setting for patients eligible to ASCT. This higher proportion of patients achieving deeper responses post-transplant, is of high clinical relevance. The MAH presented an analysis for PFS where patients who received maintenance therapy at the second randomization were censored. The results are in line with those presented in the primary analysis. The effect on secondary endpoints PFS and OS appeared favourable despite relatively immature data. OS and PFS data are still immature. The MAH has committed (letter of recommendation) to provide post-approval updated part 1 PFS results (including the analysis censoring patients in each arm who were randomised to daratumumab maintenance in the second randomisation) and updated part 1 OS data in 2021 based on the data cut of the planned interim analysis.
3.8.2. Balance of benefits and risks
The Benefit-risk balance of daratumumab in combination with D-VTd in patients with newly diagnosed MM, who are eligible for ASCT is considered positive.
3.8.3. Additional considerations on the benefit-risk balance
3.9. Conclusions
The overall B/R of Darzalex (daratumumab) in combination with bortezomib, thalidomide and dexamethasone for the treatment of adult patients with newly diagnosed multiple myeloma who are eligible for autologous stem cell transplant (ASCT) is currently positive.
4. Recommendations
Outcome
Based on the review of the submitted data, the CHMP considers the following variation acceptable and therefore recommends by consensus the variation to the terms of the Marketing Authorisation, concerning the following change:
Variation accepted Type Annexes affected
C.I.6.a C.I.6.a - Change(s) to therapeutic indication(s) - Addition of a new therapeutic indication or modification of an approved one
Type II I and IIIA
Extension of indication in combination with bortezomib, thalidomide and dexamethasone for the treatment of adult patients with newly diagnosed multiple myeloma who are eligible for autologous stem cell transplant (ASCT) for Darzalex; as a consequence, sections 4.1, 4.2, 4.5, 4.8 and 5.1 of the SmPC

Assessment report EMA/CHMP/22749/2020 Page 76/76
are updated. The Package Leaflet is updated in accordance. The RMP (version 6.4) has also been agreed.
The variation leads to amendments to the Summary of Product Characteristics and Labelling and to the Risk Management Plan (RMP).
Similarity with authorised orphan medicinal products
The CHMP by consensus is of the opinion that Darzalex is not similar to Imnovid (pomalidomide), Farydak (panabinostat), Kyprolis (carfilzomib) and Ninlaro (ixazomib) within the meaning of Article 3 of Commission Regulation (EC) No. 847/200.
5. EPAR changes
The EPAR will be updated following Commission Decision for this variation. In particular the EPAR module 8 "steps after the authorisation" will be updated as follows:
Scope
Extension of indication in combination with bortezomib, thalidomide and dexamethasone for the treatment of adult patients with newly diagnosed multiple myeloma who are eligible for autologous stem cell transplant (ASCT) for Darzalex; as a consequence, sections 4.1, 4.2, 4.5, 4.8 and 5.1 of the SmPC are updated. The Package Leaflet is updated in accordance. The RMP (version 6.4) has also been agreed.
Summary
Please refer to the Scientific Discussion Darzalex-H-C-4077-II-0030.