assessors retirement fund
TRANSCRIPT
ASSESSORS’
RETIREMENT FUND
ACTUARIAL VALUATION AS OF
SEPTEMBER 30, 2018
G. S. CURRAN & COMPANY, LTD. Actuarial Services
10555 N. Glenstone Place Baton Rouge, Louisiana 70810 (225)769-4825
Gary S. Curran, FCA, MAAA, ASA, EA Gregory M. Curran, FCA, MAAA, ASA, EA
Consulting Actuary Consulting Actuary
February 28, 2019
Board of Trustees
Louisiana Assessors’ Retirement Fund
P.O. Box 14699
Baton Rouge, LA 70898-4699
Ladies and Gentlemen:
We are pleased to present our report on the actuarial valuation of the Louisiana Assessors’ Retirement
Fund for the fiscal year ending September 30, 2018. Our report is based on the actuarial assumptions
specified and relies on the data supplied by the system’s administrators and accountants. This report
was prepared at the request of the Board of Trustees of the Louisiana Assessors’ Retirement Fund of the
State of Louisiana. The primary purpose of this report is to determine the actuarially required
contribution for the retirement system for the fiscal year ending 2019, and to recommend the net direct
employer contribution rate for Fiscal 2020. This report does not contain the information necessary for
accounting disclosures as required by Governmental Accounting Standards Board (GASB) Statements
67 and 68; that information is included in a separate report. This report was prepared exclusively for the
Louisiana Assessors’ Retirement Fund for a specific limited purpose. It is not for the use or benefit of
any third party for any purpose.
In our opinion, all of the assumptions on which this valuation is based are reasonable individually and
in the aggregate. Both economic and demographic assumptions are based on our expectations for future
experience for the fund. This report has been prepared in accordance with generally accepted actuarial
principles and practices, and to the best of our knowledge and belief, fairly reflects the actuarial present
values and costs stated herein. The undersigned actuaries are members of the American Academy of
Actuaries and have met the qualification standards for the American Academy of Actuaries to render
the actuarial opinions incorporated in this report, and are available to provide further information or
answer any questions with respect to this valuation.
Sincerely,
G. S. CURRAN & COMPANY, LTD.
By: __________________________________ ___________________________________
Gary Curran, F.C.A., M.A.A.A., A.S.A. Gregory Curran, F.C.A., M.A.A.A., A.S.A.

TABLE OF CONTENTS
SUBJECT PAGE
SUMMARY OF VALUATION RESULTS .................................................................................................... 1
GENERAL COMMENTS ............................................................................................................................... 2
COMMENTS ON DATA ................................................................................................................................ 3
COMMENTS ON ACTUARIAL METHODS AND ASSUMPTIONS.......................................................... 4
RISK FACTORS .............................................................................................................................................. 5
CHANGES IN PLAN PROVISIONS .............................................................................................................. 7
ASSET EXPERIENCE .................................................................................................................................... 8
DEMOGRAPHICS AND LIABILITY EXPERIENCE .................................................................................. 9
FUNDING ANALYSIS AND RECOMMENDATIONS ................................................................................ 9
COST OF LIVING INCREASES .................................................................................................................. 11
GRAPHS ........................................................................................................................................................ 13
EXHIBIT I – Analysis Of Actuarially Required Contributions ..................................................................... 19
EXHIBIT II – Present Value Of Future Benefits ........................................................................................... 20
EXHIBIT III – Schedule A – Market Value Of Assets .................................................................................. 21
EXHIBIT III – Schedule B – Actuarial Value Of Assets .............................................................................. 22
EXHIBIT IV – Present Value Of Future Contributions ................................................................................. 23
EXHIBIT V – Change In Frozen Unfunded Actuarial Accrued Liability ..................................................... 23
EXHIBIT VI – Analysis Of Change In Assets .............................................................................................. 24
EXHIBIT VII – Funding Deposit Account .................................................................................................... 25
EXHIBIT VIII – Pension Benefit Obligation ................................................................................................ 25
EXHIBIT IX – Entry Age Normal Accrued Liabilities ................................................................................. 25
EXHIBIT X – Census Data ............................................................................................................................ 26
EXHIBIT XI – Year-To-Year Comparison ................................................................................................... 33
SUMMARY OF PRINCIPAL PLAN PROVISIONS ................................................................................... 35
ACTUARIAL ASSUMPTIONS .................................................................................................................... 39
PRIOR YEAR ASSUMPTIONS ................................................................................................................... 44
GLOSSARY ................................................................................................................................................... 45
G. S. Curran & Company, Ltd. -1-
SUMMARY OF VALUATION RESULTS ASSESSORS’ RETIREMENT FUND
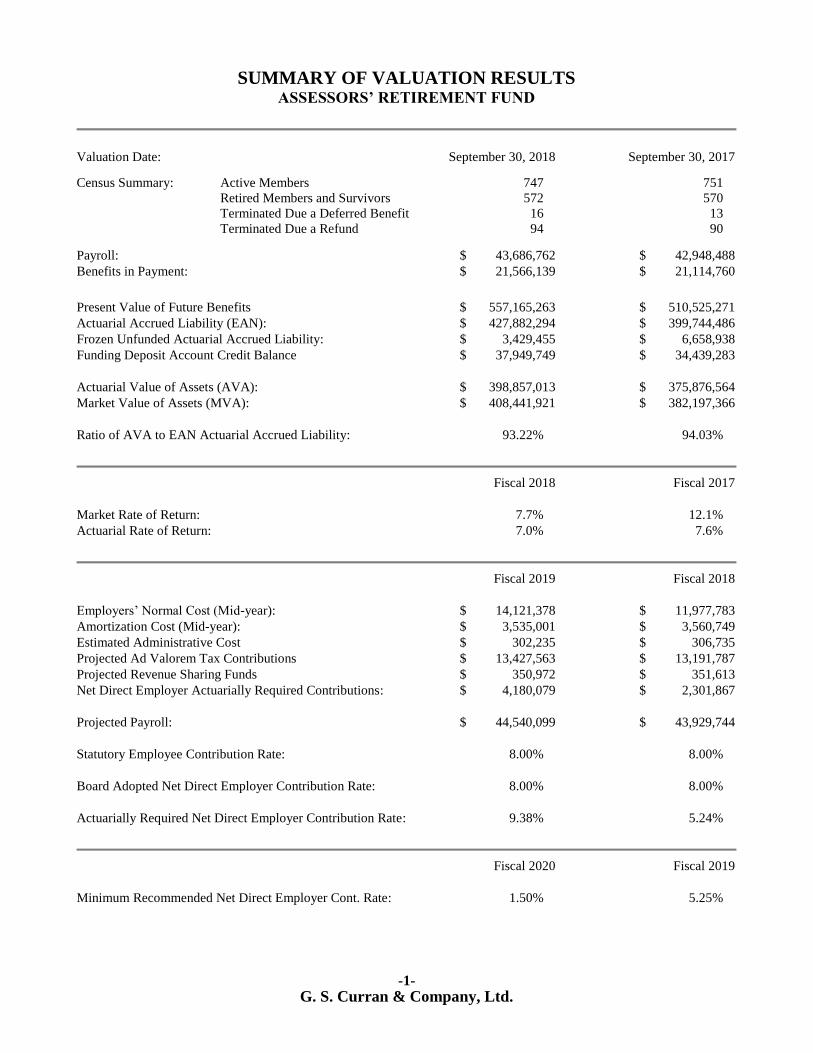
Valuation Date: September 30, 2018 September 30, 2017 Census Summary: Active Members 747 751
Retired Members and Survivors 572 570
Terminated Due a Deferred Benefit 16 13
Terminated Due a Refund 94 90
Payroll: $ 43,686,762 $ 42,948,488
Benefits in Payment: $ 21,566,139 $ 21,114,760
Present Value of Future Benefits $ 557,165,263 $ 510,525,271
Actuarial Accrued Liability (EAN): $ 427,882,294 $ 399,744,486
Frozen Unfunded Actuarial Accrued Liability: $ 3,429,455 $ 6,658,938
Funding Deposit Account Credit Balance $ 37,949,749 $ 34,439,283
Actuarial Value of Assets (AVA): $ 398,857,013 $ 375,876,564
Market Value of Assets (MVA): $ 408,441,921 $ 382,197,366
Ratio of AVA to EAN Actuarial Accrued Liability: 93.22% 94.03%
Fiscal 2018 Fiscal 2017
Market Rate of Return: 7.7% 12.1%
Actuarial Rate of Return: 7.0% 7.6%
Fiscal 2019 Fiscal 2018
Employers’ Normal Cost (Mid-year): $ 14,121,378 $ 11,977,783
Amortization Cost (Mid-year): $ 3,535,001 $ 3,560,749
Estimated Administrative Cost $ 302,235 $ 306,735
Projected Ad Valorem Tax Contributions $ 13,427,563 $ 13,191,787
Projected Revenue Sharing Funds $ 350,972 $ 351,613
Net Direct Employer Actuarially Required Contributions: $ 4,180,079 $ 2,301,867
Projected Payroll: $ 44,540,099 $ 43,929,744
Statutory Employee Contribution Rate: 8.00% 8.00%
Board Adopted Net Direct Employer Contribution Rate: 8.00% 8.00%
Actuarially Required Net Direct Employer Contribution Rate: 9.38% 5.24%
Fiscal 2020 Fiscal 2019
Minimum Recommended Net Direct Employer Cont. Rate: 1.50% 5.25%
-2-
G. S. Curran & Company, Ltd.
GENERAL COMMENTS
The values and calculations in this report were determined by applying statistical analysis and
projections to system data and the assumptions listed. There is sometimes a tendency for readers to
either dismiss results as mere “guesses” or alternatively to ascribe a greater degree of accuracy to the
results than is warranted. In fact, neither of these assessments is valid. Actuarial calculations by their
very nature involve estimations. As such, it is likely that eventual results will differ from those
presented. The degree to which such differences evolve will depend on several factors including the
completeness and accuracy of the data utilized, the degree to which assumptions approximate future
experience, and the extent to which the mathematical model accurately describes the plan’s design and
future outcomes.
Data quality varies from system to system and year to year. The data inputs involve both asset
information and census information of plan participants. In both cases, the actuary must rely on third
parties; nevertheless, steps are taken to reduce the probability and degree of errors. The development
of assumptions is primarily the task of the actuary; however, information and advice from plan
administrators, staff, and other professionals may be factored into the formation of assumptions. The
process of setting assumptions is based primarily on analysis of past trends, but modification of
historical experience is often required when the actuary has reason to believe that future circumstances
may vary significantly from the past. Setting assumptions includes but is not limited to collecting past
plan experience and studying general population demographics and economic factors from the past.
The actuary will also consider current and future macro-economic and financial expectations as well as
factors that are likely to impact the particular group under consideration. Hence, assumptions will also
reflect the actuary’s judgment with regard to future changes in plan population and decrements in view
of the particular factors which impact participants. Thus, the process of setting assumptions is not mere
“guess work” but rather a process of mathematical analysis of past experience and of those factors
likely to impact the future.
One area where the actuary is limited in his ability to develop accurate estimates is the projection of
future investment earnings. The difficulties here are significant. First, the future is rarely like the past,
and the data points available to develop stochastic trials are far fewer than the number required for
statistical significance. In this area, some guess work is inevitable. However, there are tools available
to lay a foundation for making estimates with an expectation of reliability. Although past data is
limited, that which is available is likely to provide some insight into the future. This data consists of
general economic and financial values such as past rates of inflation, rates of return variance, and
correlations of returns among various asset classes along with the actual asset experience of the plan.
In addition, the actuary can review the current asset market environment as well as economic forecasts
from governmental and investment research groups to form a reasonable opinion with regard to
probable future investment experience for the plan.
All of the above efforts would be in vain if the assumption process was static, and the plan would have
to deal with the consequences of actual experience differing from assumptions after forty or fifty years
of compounded errors. However, actuarial funding methods for pension plans all allow for periodic
corrections of assumptions to conform with reality as it unfolds. This process of repeated correction of
estimates produces results which although imperfect are nevertheless a reasonable approach to
determine the contribution levels which will provide for the future benefits of plan participants.

-3-
G. S. Curran & Company, Ltd.
COMMENTS ON DATA
For the valuation, the administrative staff of the system furnished a census on electronic media derived
from the system’s master data processing file indicating each active covered employee’s sex, date of
birth, service credit, annual salary, and accumulated contributions. Information on retirees detailing
dates of birth of retirees and beneficiaries, as well as option categories and benefit amounts, was
provided in like manner. In addition, data was supplied on former employees who are vested or who
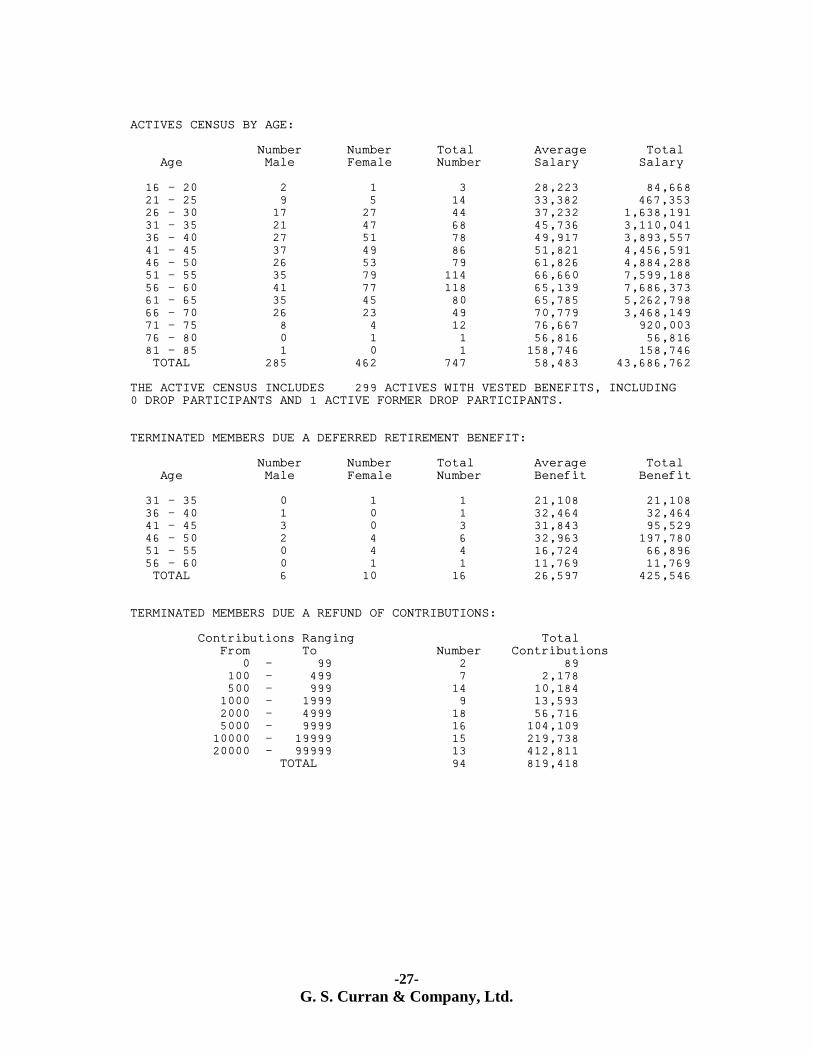
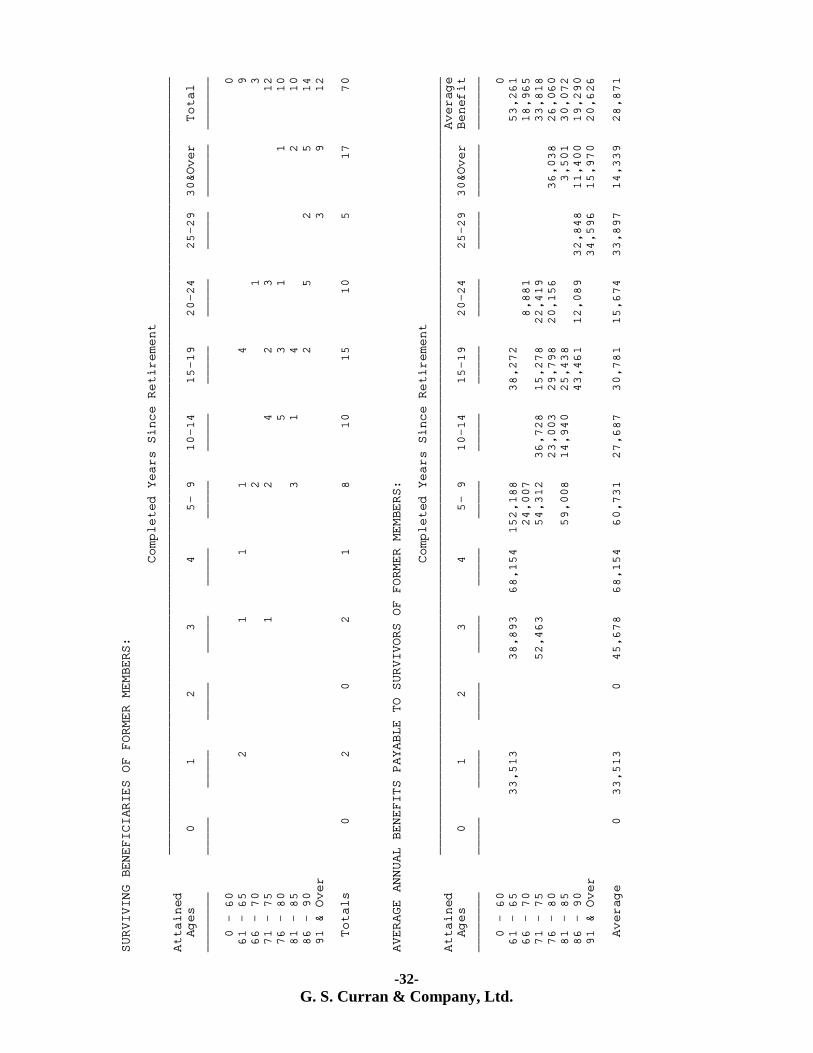
have contributions remaining on deposit. As illustrated in Exhibit X, there are 747 active members in
the system of whom 299 members have vested retirement benefits; 572 former members or their
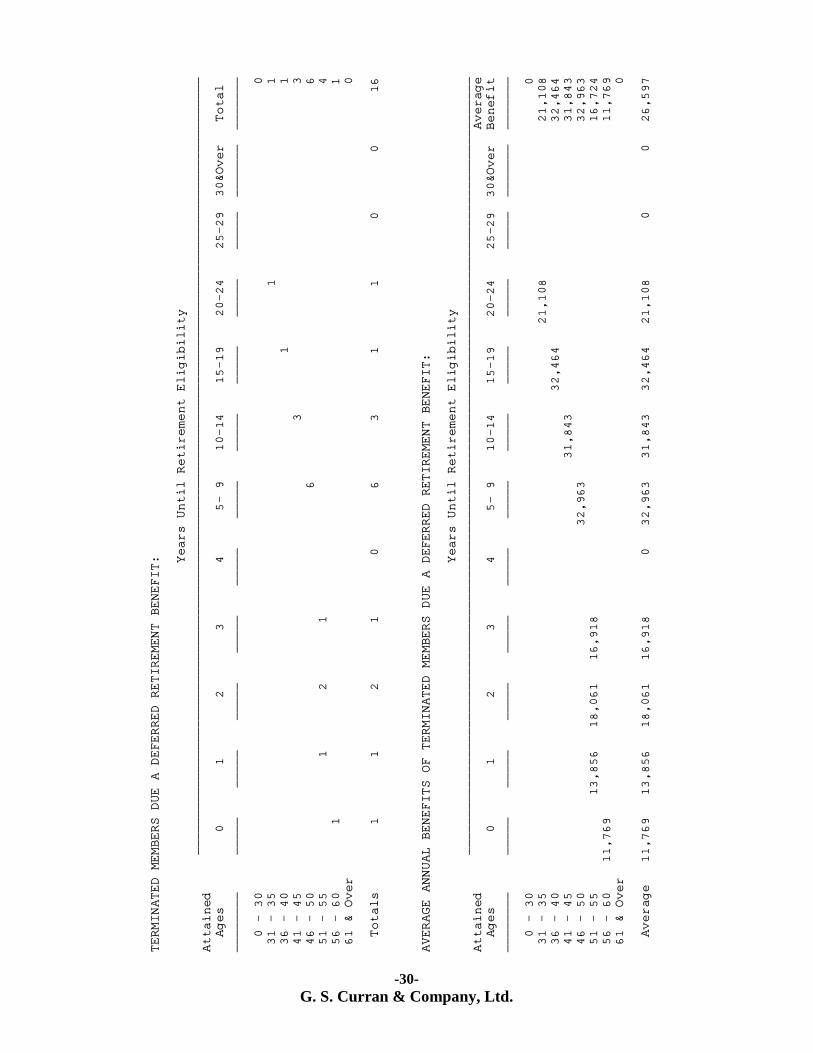
beneficiaries are receiving retirement benefits. An additional 110 terminated members have
contributions remaining on deposit with the system; of this number, 16 have vested rights for future
retirement benefits. All participant data is as of September 30, 2018. All individuals submitted were
included in the valuation.
Census data submitted to our office is tested for errors. Several types of census data errors are possible;
to ensure that the valuation results are as accurate as possible, a significant effort is made to identify
and correct these errors. In order to minimize coverage errors (i.e., missing or duplicated individual
records) the records are checked for duplicates, and a comparison of the current year’s records to those
submitted in prior years is made. Changes in status, new records, and previous records, which have no
corresponding current record, are identified. This portion of the review indicates the annual flow of
members from one status to another and is used to check some of the actuarial assumptions, such as
retirement rates, rates of withdrawal, and mortality. In addition, the census is checked for
reasonableness in several areas, such as age, service, salary, and current benefits. The records
identified by this review as questionable are checked against data from prior valuations; those not
recently verified are included in a detailed list of items sent to the system’s administrator for
verification and/or correction. Once the identified data has been researched and verified or corrected, it
is returned to us for use in the valuation. Occasionally some requested information is either unavailable
or impractical to obtain. In such cases, values may be assigned to missing data. The assigned values
are based on information from similar records or based on information implied from other data in the
record.
In addition to the statistical information provided on the system’s participants, the system’s
administrator furnished general information related to other aspects of the system’s expenses, benefits
and funding. Valuation asset values as well as income and expenses for the fiscal year were based on
information furnished by the system’s auditor, the firm of Hawthorne, Waymouth, and Carroll, L.L.P.
As indicated in the system’s audit report, the net market value of system’s assets was $408,441,921 as
of September 30, 2018. Net investment income for Fiscal 2018 measured on a market value basis was
$29,357,768. Contributions to the system for the fiscal year totaled $20,749,680; benefits and expenses
amounted to $23,862,893.
Notwithstanding our efforts to review both census and financial data for apparent errors, we must rely
upon the system’s administrative staff and accountants to provide accurate information. Our review of
submitted information is limited to validation of reasonableness and consistency. Verification of
submitted data to source information is beyond the scope of our efforts.
-4-
G. S. Curran & Company, Ltd.
COMMENTS ON ACTUARIAL METHODS AND ASSUMPTIONS
This valuation is based on the Frozen Attained Age Normal actuarial cost method with the unfunded
accrued liability frozen as of September 30, 1989. Under the provisions of Louisiana R.S. 11:103 the
unfunded accrued liability which was determined to be $27,874,011 as of September 30, 1989, was
amortized over forty years with payments increasing at 3.5% per year. Under the Frozen Attained Age
Normal Cost Method, actuarial gains and losses are spread over future normal costs. Thus, favorable
plan experience will lower future normal costs; unfavorable experience will cause future normal costs
to increase. In addition, changes in benefits and assumptions are also spread over future normal costs.
The cost method used for this valuation generally produces normal costs which are level as a
percentage of pay if assumptions are met and the composition of the active group with regard to age
and service is stable. Overall costs may increase or decrease depending on payroll growth.
Prior to the passage of Act 296 in the 2009 legislative session, as detailed by R. S. 11:105, in any year
in which the net direct employer contribution was scheduled to decrease, the Board of Trustees could
freeze the net direct employer contribution rate and use the excess funds collected, if any, to reduce the
frozen unfunded actuarial accrued liability. Also, in any year in which the Board elected to increase
contributions pursuant to R.S. 11:106 the excess funds, if any, were used to reduce the system’s frozen
unfunded actuarial accrued liability. Notwithstanding such a decrease, payments were made according
to the regular amortization schedule, thereby reducing the amortization period. Such additional
unfunded liability payments of $791,748; $101,831; $538,661; $1,020,879; $2,890,530; and
$7,988,122 were made in Fiscal 1999, Fiscal 2000, Fiscal 2003, Fiscal 2006, Fiscal 2007, and Fiscal
2008, respectively. As a result of these additional payments, the frozen unfunded actuarial accrued
liability will be fully amortized by September 30, 2019, ten years ahead of the original schedule. No
future payments will be due on the frozen unfunded actuarial accrued liability and the system will be
funded on the Aggregate actuarial cost method. In addition, the Board of Trustees voted to maintain
the net direct employer contribution rate at 13.50% for fiscal years 2009 through 2016 and at 8.00%
for 2017 instead of lowering the rate to the minimum recommended employer contribution rate for
those years. These freezes resulted in additional collections totaling $28,220,036 over the nine fiscal
years, which under the provisions of Act 296 were credited to the Funding Deposit Account. For Fiscal
2018, the contribution rate was maintained at 8.00%; the additional funds collected, amounting to
$1,185,814, were also credited to the Funding Deposit Account.
The current year actuarial assumptions utilized for this report are based on the results of an actuarial
experience study for the period October 1, 2009 – September 30, 2014, unless otherwise specified in
this report. In determining the valuation interest rate, consideration was given to several factors. First,
average estimates of rates of return, standard deviations, and correlation coefficients for asset classes
derived from various asset consulting firms were developed. These factors were used to derive forward
estimates of the Fund’s portfolio earnings rate. Consideration was also given to 2018 information from
the AndCo Consulting Group on future expected rates of return for the current portfolio’s asset
allocation. Based on the results of this interest rate assumption review and a desire to reduce the long-
term risk of the retirement fund, the assumed rate of return for the valuation was reduced from 6.75%
to 6.25%. An inflation rate of 2.2% was implicit in both the assumed rate of return and rate of salary
increases. Additional details are given in the complete Experience Report for fiscal years 2010 through
2014.
-5-
G. S. Curran & Company, Ltd.
Although the Board of Trustees has authority to grant ad hoc Cost of Living Increases (COLAs) under
limited circumstances, these COLAs have not been shown to have a historical pattern, the amounts of
the COLAs have not been relative to a defined cost-of-living or inflation index, and there is no
evidence to conclude that COLAs will be granted on a predictable basis in the future. Therefore, for
purposes of determining the present value of benefits, these COLAs were deemed not to be
substantively automatic and the present value of benefits excludes COLAs not previously granted by
the Board of Trustees.
The current year actuarial assumptions utilized for the report are outlined on pages thirty-nine through
forty-three. With the exception of the assumptions described above, all assumptions were the same as
those used in the Fiscal 2017 valuation. All assumptions used are based on estimates of future long-
term experience for the fund. All calculations, recommendations, and conclusions are based on the
assumptions specified. To the extent that prospective experience differs from that assumed,
adjustments to contribution levels will be required. Such differences will be revealed in future actuarial
valuations. The net effect of the changes in assumptions on the normal cost accrual rate was an
increase of 6.6038%.
RISK FACTORS
Defined benefit pension plans are subject to a number of risks. These can be related either to plan
assets or liabilities. In order to pay benefits, the plan must have sufficient assets. Several factors can
lead to asset levels which are below those required to pay promised benefits. The first risk in this
regard is the failure to contribute adequate funds to the plan. In some ways, this is the greatest risk,
since other risks can usually be addressed by adequate actuarial funding.
All pension plans are subject to asset performance risk. Asset performance is comprised of the real
rates of return earned on the portfolio of investments plus the underlying inflation rate. High levels of
inflation or deflation can present the plan with problems by either reducing the purchasing power of
plan benefits or impairing asset values in the trust. Asset performance over the long run depends not
only on average returns but also on the volatility of returns. Two portfolios of identical size with
identical average rates of return will accumulate different levels of assets if the volatility of returns
differs since increased volatility reduces the accumulation of assets. Another element of asset risk is
reinvestment risk. Recent interest rate declines have subjected pension plans to an increase in this risk.
As fixed income securities have matured, investment managers have been forced to reinvest funds at
decreasing rates of return. For pension plans which require significant net cash flow above
contributions to fund benefit payments, the risk of insufficient liquidity is another risk component
which can create problems if it becomes necessary to sell securities under unfavorable market
conditions in order to raise cash necessary to pay retirement benefits. Even for individual securities,
insolvency and performance risk can subject a plan to stress if these investments comprise a significant
portion of plan assets. Security insolvency or severe underperformance can result in steep increases in
sponsor contributions where individual investments comprise more than a de minimis amount of the
investment portfolio.
In addition to asset risk, the plan is also subject to risks related to liabilities. These risks include
longevity risk (the risk that retirees will live longer than expected), termination risk (the risk that fewer
than the anticipated number of members will terminate service prior to retirement), and other factors
that may have an impact on the liability structure of the plan. Final average compensation plans are
-6-
G. S. Curran & Company, Ltd.
vulnerable to unexpectedly large increases in salary for individual members near retirement.
Conversely, in cases where plans have large unfunded liabilities, payroll contraction is a risk insofar as
contributions which are typically reported as a percentage of payroll may increase as payrolls decline.
Liability risk also includes items such as data errors. Significant errors in plan data can distort or
disguise plan liabilities. When data corrections are made, the plan may experience unexpected
increases or decreases in liabilities. Even natural disasters and dislocations in the economy or other
unforeseen events can present risks to the plan. These events can affect member payroll and plan
demographics, both of which impact costs.
Recommended actuarial contributions are based on expectations related to asset and liability
performance; all of the above mentioned factors can produce unexpected changes in the future cost
structures of the plan. For this reason, future costs may differ significantly from current levels.
Ordinarily, variations in these factors will offset to some extent. However, even with the expectation
that not all variations in costs will likely travel in the same direction, certain factors have the potential
on their own accord to pose a significant risk to future cost levels and solvency.
Beyond identifying risk categories, it is possible to quantify some risk factors. One fairly well known
risk metric is the funded ratio of the plan. The rate is given as plan assets divided by plan liabilities.
However, the definition of each of these terms may vary. The two typical alternatives used for assets
are the market and actuarial value of assets. There are a number of alternative measures of liability
depending on the funding method employed. The Governmental Accounting Standards Board (GASB)
specifies that for financial reporting purposes, the funded ratio is determined by using the market value
of assets divided by the entry age normal accrued liability. This value is given in the system’s financial
report. Alternatively, we have calculated the ratio of the actuarial value of assets to the entry age
normal accrued liability based on the funding methodology used to fund the plan. The ratio is 93.22%
as of September 30, 2018. This value gives some indication of the financial strength of the plan;
however, it does not guarantee the ability of the fund to pay benefits in the future or indicate that in the
future, contributions are likely to be less than or greater than current contributions. In addition, the
ratio cannot be used in isolation to compare the relative strength of different retirement systems.
However, the trend of this ratio over time can give some insight into the financial health of the plan.
Even in this regard, caution is warranted since market fluctuations in asset values and changes in plan
assumptions can distort underlying trends in this value. One additional risk measure is the sensitivity
of the plan’s cost structure to asset gains and losses. For this plan, we have determined that based on
current assets and demographics, for each percentage under (over) the assumed rate of return on the
actuarial value of assets, there will be a corresponding increase (reduction) in the actuarially required
contribution as a percentage of projected payroll of 0.83% for the fund.
The ability of a system to recover from adverse asset or liability performance is related to the maturity
of the plan population. In general, plans with increasing active membership are less sensitive to asset
and liability gains and losses than mature plans since changes in plan costs can be partially allocated to
new members. If the plan has a large number of active members compared to retirees, asset or liability
losses can be more easily addressed. As more members retire, contributions can only be collected from
a smaller segment of the overall plan population. Often, population ratios of actives to annuitants are
used to measure the plan’s ability to adjust or recover from adverse events since contributions are
made by or on behalf of active members but not for retirees. Thus, if the plan suffers a mortality loss
through increased longevity, this will affect both actives and retirees, but the system can only fund this
-7-
G. S. Curran & Company, Ltd.
loss by contributions related to active members. A measure of risk related to plan maturity is the ratio
of total benefit payments to active payroll. For Fiscal 2018, this ratio is 49%; ten years ago this ratio
was 26%.
One other area of risk is the risk that plan assumptions will need to be revised to conform to changing
actual or expected plan experience. Such assumption revisions could relate to demographic or
economic factors. With regard to the economic assumptions, we have determined that a reduction in
the valuation interest rate by 1% (without any change to other collateral factors) would increase the
actuarially required employer contribution rate for Fiscal 2019 by 14.01% of payroll.
There is a risk that future actuarial measurements may differ significantly from current measurements
presented in this report due to factors such as the following: plan experience differing from that
anticipated by the economic or demographic assumptions, changes in economic or demographic
assumption, completion of amortization payment and credit schedules, and changes in plan provisions
or applicable law. Analysis of the effect of all these factors and additional risk metrics is beyond the
scope of this report.
CHANGES IN PLAN PROVISIONS
The following statutes affecting the retirement system were enacted during the 2018 Regular Session
of the Louisiana Legislature:
Act 45 provides that state and statewide retirement systems may invest in terror free investments
outside of index fund vehicles to meet the requirements of R.S. 11:316.
Act 113 made technical changes to R.S. 11:241(B) which deals with the structure of COLAs based on
the length of service and elapsed time since retirement.
Act 344 provides for eligible rollover distributions to certain persons.
Act 397 stipulates that state and statewide retirement systems may appoint an actuary or actuaries
whose duties assigned by the Board shall relate only to the practice of actuarial science or ministerial
duties that do not require the exercise of supervision or discretionary control over the administration or
management of the system.
Act 399 stipulates that the Public Retirement Systems’ Actuarial Committee is established as the
public retirement and pension system advisor of the Legislature of Louisiana. The act further states
that the chair and vice chair shall rotate biennially between the speaker of the House of
Representatives, or his designee, and the president of the Senate, or his designee, with terms beginning
on the first of July. The committee shall elect any other officers as deemed advisable but no officer
shall serve for more than four consecutive years.
-8-
G. S. Curran & Company, Ltd.
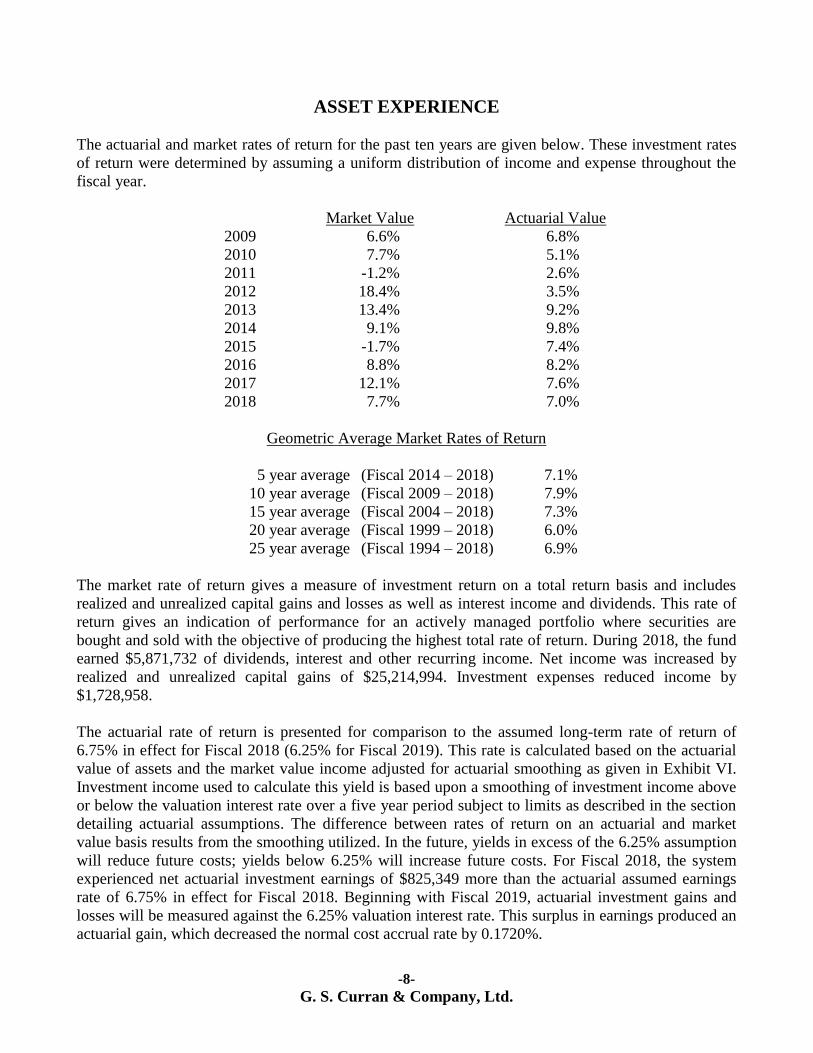
ASSET EXPERIENCE
The actuarial and market rates of return for the past ten years are given below. These investment rates
of return were determined by assuming a uniform distribution of income and expense throughout the
fiscal year.
Market Value Actuarial Value
2009 6.6% 6.8%
2010 7.7% 5.1%
2011 -1.2% 2.6%
2012 18.4% 3.5%
2013 13.4% 9.2%
2014 9.1% 9.8%
2015 -1.7% 7.4%
2016 8.8% 8.2%
2017 12.1% 7.6%
2018 7.7% 7.0%
Geometric Average Market Rates of Return
5 year average (Fiscal 2014 – 2018) 7.1%
10 year average (Fiscal 2009 – 2018) 7.9%
15 year average (Fiscal 2004 – 2018) 7.3%
20 year average (Fiscal 1999 – 2018) 6.0%
25 year average (Fiscal 1994 – 2018) 6.9%
The market rate of return gives a measure of investment return on a total return basis and includes
realized and unrealized capital gains and losses as well as interest income and dividends. This rate of
return gives an indication of performance for an actively managed portfolio where securities are
bought and sold with the objective of producing the highest total rate of return. During 2018, the fund
earned $5,871,732 of dividends, interest and other recurring income. Net income was increased by
realized and unrealized capital gains of $25,214,994. Investment expenses reduced income by
$1,728,958.
The actuarial rate of return is presented for comparison to the assumed long-term rate of return of
6.75% in effect for Fiscal 2018 (6.25% for Fiscal 2019). This rate is calculated based on the actuarial
value of assets and the market value income adjusted for actuarial smoothing as given in Exhibit VI.
Investment income used to calculate this yield is based upon a smoothing of investment income above
or below the valuation interest rate over a five year period subject to limits as described in the section
detailing actuarial assumptions. The difference between rates of return on an actuarial and market
value basis results from the smoothing utilized. In the future, yields in excess of the 6.25% assumption
will reduce future costs; yields below 6.25% will increase future costs. For Fiscal 2018, the system
experienced net actuarial investment earnings of $825,349 more than the actuarial assumed earnings
rate of 6.75% in effect for Fiscal 2018. Beginning with Fiscal 2019, actuarial investment gains and
losses will be measured against the 6.25% valuation interest rate. This surplus in earnings produced an
actuarial gain, which decreased the normal cost accrual rate by 0.1720%.
-9-
G. S. Curran & Company, Ltd.
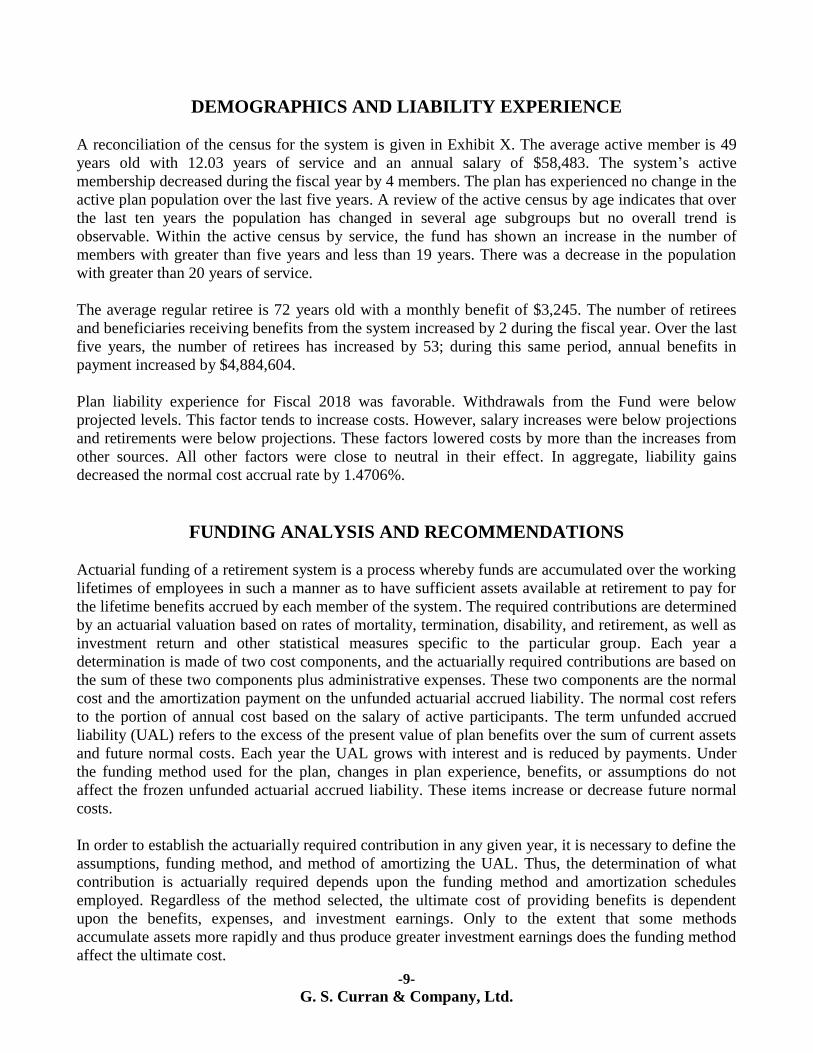
DEMOGRAPHICS AND LIABILITY EXPERIENCE
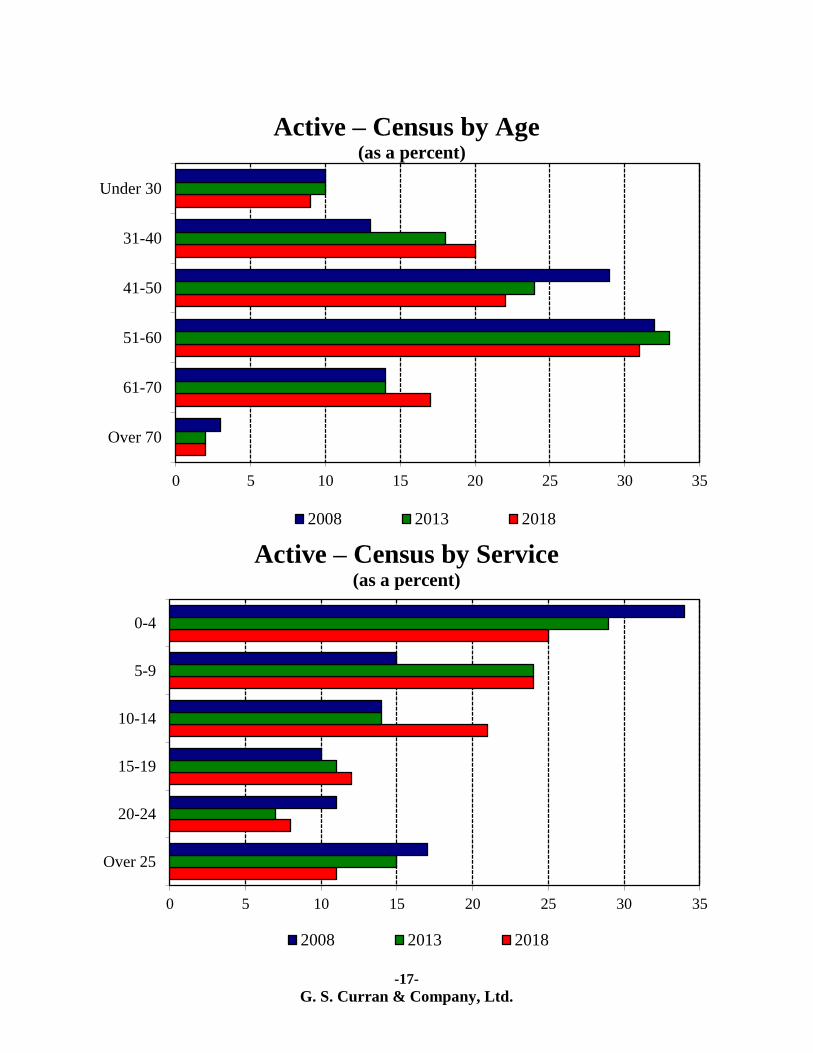
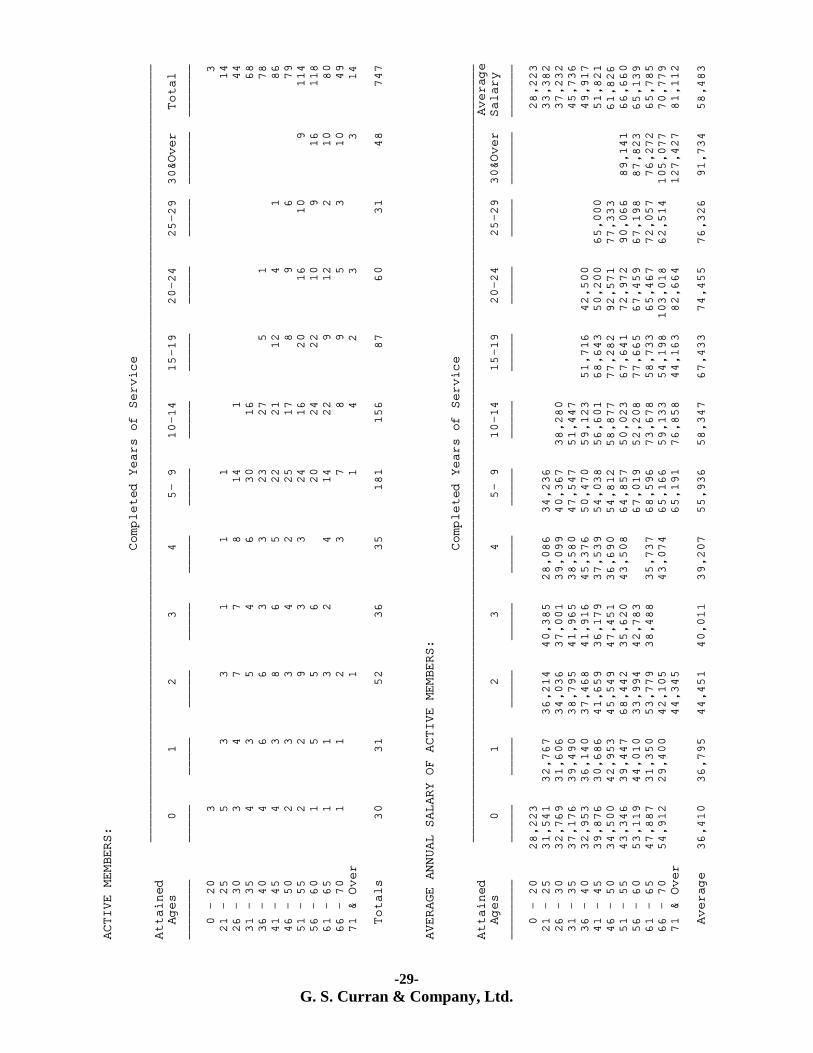
A reconciliation of the census for the system is given in Exhibit X. The average active member is 49
years old with 12.03 years of service and an annual salary of $58,483. The system’s active
membership decreased during the fiscal year by 4 members. The plan has experienced no change in the
active plan population over the last five years. A review of the active census by age indicates that over
the last ten years the population has changed in several age subgroups but no overall trend is
observable. Within the active census by service, the fund has shown an increase in the number of
members with greater than five years and less than 19 years. There was a decrease in the population
with greater than 20 years of service.
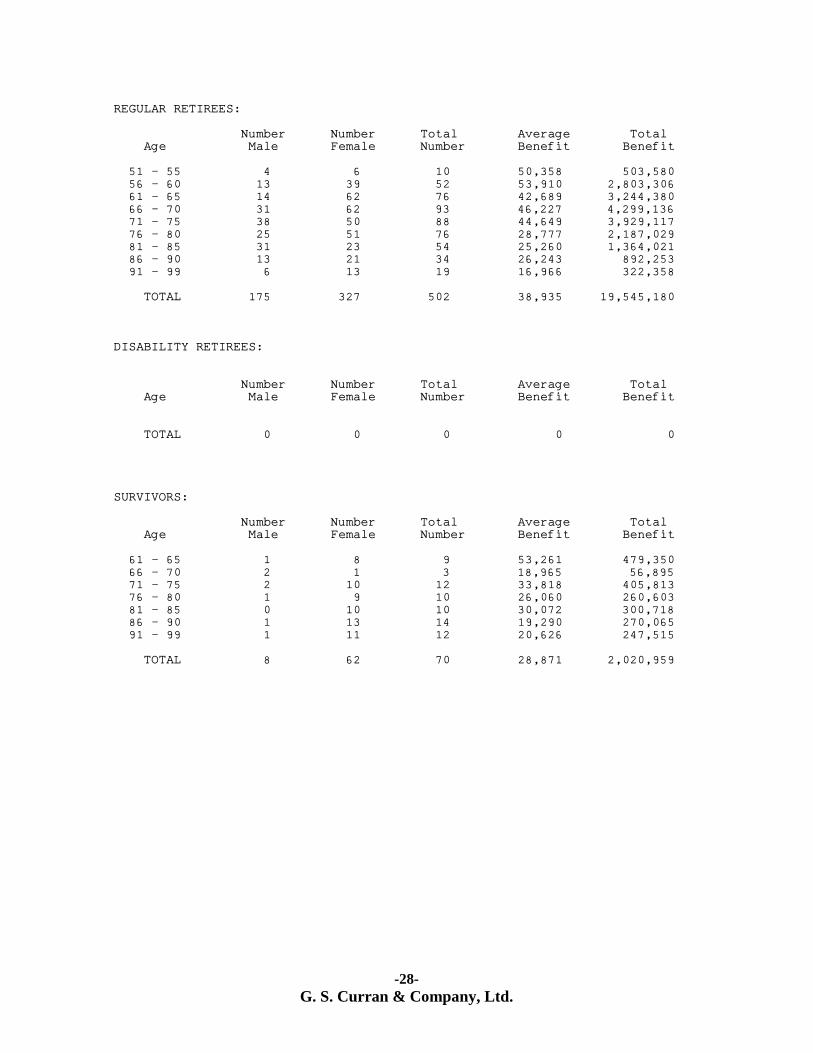
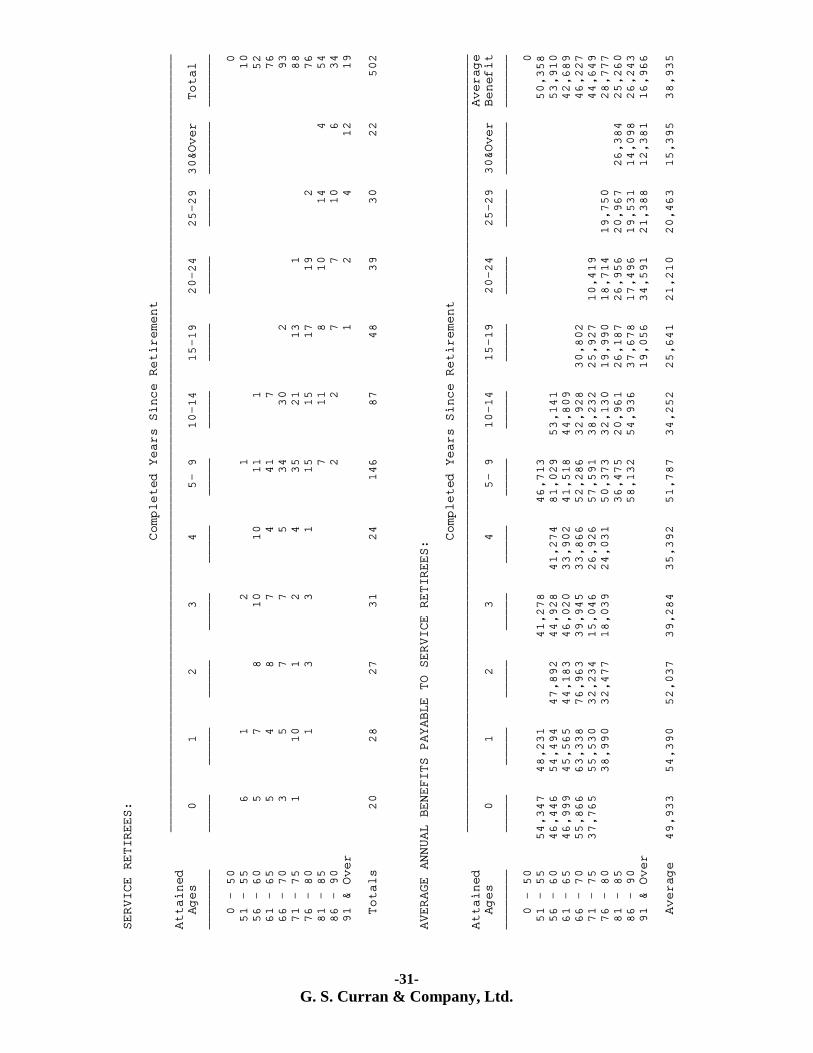
The average regular retiree is 72 years old with a monthly benefit of $3,245. The number of retirees
and beneficiaries receiving benefits from the system increased by 2 during the fiscal year. Over the last
five years, the number of retirees has increased by 53; during this same period, annual benefits in
payment increased by $4,884,604.
Plan liability experience for Fiscal 2018 was favorable. Withdrawals from the Fund were below
projected levels. This factor tends to increase costs. However, salary increases were below projections
and retirements were below projections. These factors lowered costs by more than the increases from
other sources. All other factors were close to neutral in their effect. In aggregate, liability gains
decreased the normal cost accrual rate by 1.4706%.
FUNDING ANALYSIS AND RECOMMENDATIONS
Actuarial funding of a retirement system is a process whereby funds are accumulated over the working
lifetimes of employees in such a manner as to have sufficient assets available at retirement to pay for
the lifetime benefits accrued by each member of the system. The required contributions are determined
by an actuarial valuation based on rates of mortality, termination, disability, and retirement, as well as
investment return and other statistical measures specific to the particular group. Each year a
determination is made of two cost components, and the actuarially required contributions are based on
the sum of these two components plus administrative expenses. These two components are the normal
cost and the amortization payment on the unfunded actuarial accrued liability. The normal cost refers
to the portion of annual cost based on the salary of active participants. The term unfunded accrued
liability (UAL) refers to the excess of the present value of plan benefits over the sum of current assets
and future normal costs. Each year the UAL grows with interest and is reduced by payments. Under
the funding method used for the plan, changes in plan experience, benefits, or assumptions do not
affect the frozen unfunded actuarial accrued liability. These items increase or decrease future normal
costs.
In order to establish the actuarially required contribution in any given year, it is necessary to define the
assumptions, funding method, and method of amortizing the UAL. Thus, the determination of what
contribution is actuarially required depends upon the funding method and amortization schedules
employed. Regardless of the method selected, the ultimate cost of providing benefits is dependent
upon the benefits, expenses, and investment earnings. Only to the extent that some methods
accumulate assets more rapidly and thus produce greater investment earnings does the funding method
affect the ultimate cost.
-10-
G. S. Curran & Company, Ltd.
The derivation of the actuarially required contribution for the current fiscal year is given in Exhibit I.
The normal cost for Fiscal 2019 adjusted with interest for mid-year payment is $14,121,378. The
amortization payment on the fund’s frozen unfunded actuarial accrued liability adjusted with interest
for mid-year payment is $3,535,001. The total actuarially required contribution is determined by
adding to these values estimated administrative expenses. As given on line 16 of Exhibit I the total
actuarially required contribution for Fiscal 2019 is $17,958,614. When this amount is reduced by
projected tax contributions and revenue sharing funds, the resulting employers’ net direct actuarially
required contribution for Fiscal 2019 is $4,180,079 or 9.38% of projected payroll.
Liability and asset experience as well as changes in assumptions and benefits can increase or decrease
plan costs. In addition to these factors, any COLA granted in the prior fiscal year will increase required
contributions. New entrants to the system can also increase or decrease costs as a percent of payroll
depending upon their demographic distribution and other factors related to prior plan experience.
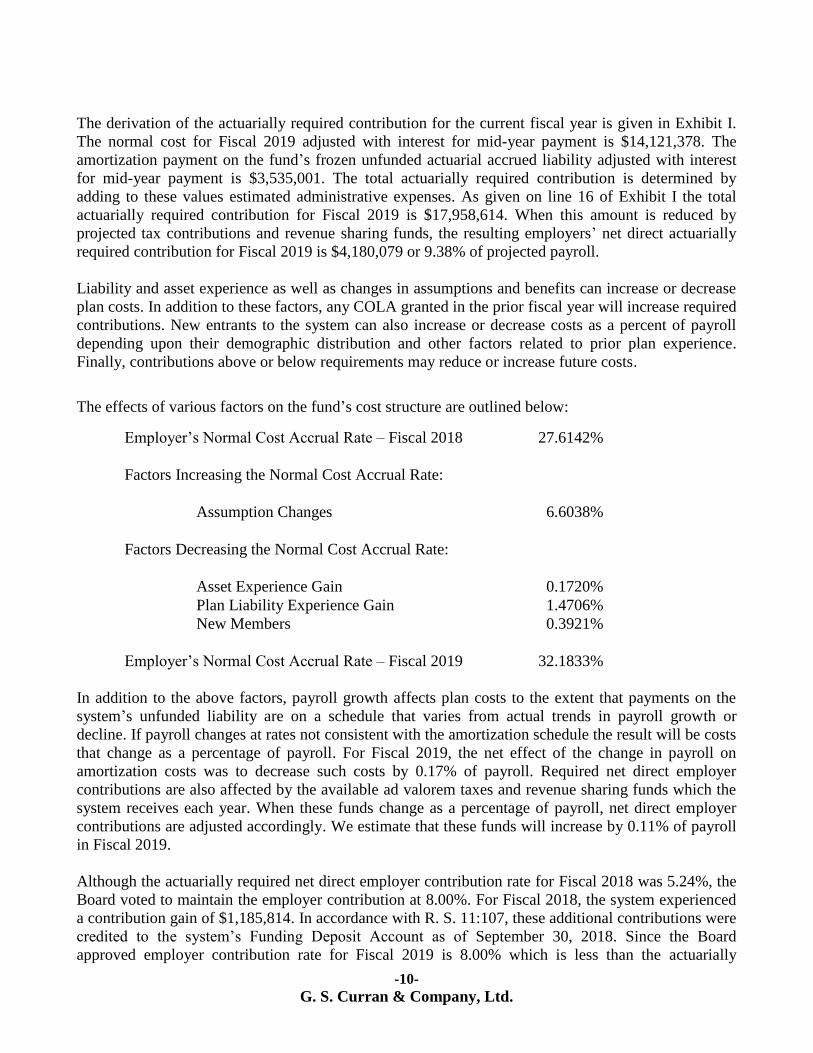
Finally, contributions above or below requirements may reduce or increase future costs. The effects of various factors on the fund’s cost structure are outlined below: Employer’s Normal Cost Accrual Rate – Fiscal 2018 27.6142%
Factors Increasing the Normal Cost Accrual Rate:
Assumption Changes 6.6038%
Factors Decreasing the Normal Cost Accrual Rate:
Asset Experience Gain 0.1720%
Plan Liability Experience Gain 1.4706%
New Members 0.3921%
Employer’s Normal Cost Accrual Rate – Fiscal 2019 32.1833%
In addition to the above factors, payroll growth affects plan costs to the extent that payments on the
system’s unfunded liability are on a schedule that varies from actual trends in payroll growth or
decline. If payroll changes at rates not consistent with the amortization schedule the result will be costs
that change as a percentage of payroll. For Fiscal 2019, the net effect of the change in payroll on
amortization costs was to decrease such costs by 0.17% of payroll. Required net direct employer
contributions are also affected by the available ad valorem taxes and revenue sharing funds which the
system receives each year. When these funds change as a percentage of payroll, net direct employer
contributions are adjusted accordingly. We estimate that these funds will increase by 0.11% of payroll
in Fiscal 2019.
Although the actuarially required net direct employer contribution rate for Fiscal 2018 was 5.24%, the
Board voted to maintain the employer contribution at 8.00%. For Fiscal 2018, the system experienced
a contribution gain of $1,185,814. In accordance with R. S. 11:107, these additional contributions were
credited to the system’s Funding Deposit Account as of September 30, 2018. Since the Board
approved employer contribution rate for Fiscal 2019 is 8.00% which is less than the actuarially
-11-
G. S. Curran & Company, Ltd.
required net direct employer contribution rate of 9.38%, there will be a contribution shortfall of 1.38%
of payroll. This shortfall will increase the actuarially required contribution recommended for Fiscal
2020. In order to determine a minimum recommended net direct employer contribution rate for Fiscal
2020, the employer normal cost was adjusted for the impact of the estimated contribution shortfall.
Based upon this projected contribution loss, we adjusted the Employers’ Minimum Net Direct
Actuarially Required Contribution for Fiscal 2019 by adding an additional 0.12% when calculating the
Minimum Recommended Net Direct Employer Contribution Rate for Fiscal 2020.
Typically, the recommended net direct employer contribution rate for a given year is based on the
actuarially required contributions for the preceding year with an adjustment for anticipated
contribution gains or loss, if any. However, in Fiscal 2019, the frozen unfunded actuarial accrued
liability for the system will be completely amortized and no future payments will be due. Thus, in
setting the recommended employer contribution for Fiscal 2020, we have further adjusted the result for
elimination of the amortization payment. The anticipated reduction in the recommended employer rate
is 7.94% of projected payroll. Furthermore, R.S. 11:103 requires that the net direct employer
contributions be rounded to the nearest 0.25%, hence we are recommending a minimum net direct
employer contribution rate of 1.50% for Fiscal 2020. Under the provisions of R.S. 11:105, R.S. 11:106
and R.S. 11:107, the Board of Trustees may set the net direct employer contribution at any level
between the minimum recommended employer contribution rate of 1.50% and 8.00%. If the Board sets
the net direct employer contribution rate above the minimum rate, any excess funds collected will be
deposited into the Funding Deposit Account. Funds in this account can be used to reduce future
required contributions in a particular year, to reduce the normal cost accrual rate, or to grant a cost of
living increase to retirees.
COST OF LIVING INCREASES
During Fiscal 2018 the actual cost of living (as measured by the US Department of Labor CPI-U)
increased by 2.3%. Cost of living provisions for the system are detailed in R.S. 11: 1461, R.S. 11:246,
R.S. 11:241, and R.S. 11:243. R.S. 11:1461 allows the Board of Trustees to provide a cost of living
increase from excess interest earnings to members who have been retired for at least one full calendar
year. The increase cannot exceed the lesser of: 3% of the retiree’s original benefit or an increase of
$300 per year for each year of retirement. R.S. 11:246 provides cost of living increases to retirees and
beneficiaries over the age of 65 equal to 2% of the benefit in payment on October 1, 1977, or the date
the benefit was originally received if retirement commenced after that date. R.S. 11:241 provides for
cost of living benefits payable based on a formula equal to up to $1 times the total of the number of
years of credited service accrued at retirement or at death of the member or retiree plus the number of
years since retirement or since death of the member or retiree to the system’s fiscal year end preceding
the payment of the benefit increase. The provisions of R.S. 11:241 do not repeal provisions relative to
cost of living adjustments contained within the individual laws governing systems; however, they are
to be controlling in cases of conflict. In addition, Act 113 of the 2008 Regular Legislation Session
provides for a COLA of 3% of the normal monthly benefit but not less than $20 per month. Although
this COLA is permanent, it may only be granted once.
In order to grant a COLA, the system must meet the funded ratio criteria specified in R.S. 11:243. For
purposes of COLAs payable under R.S. 11:1461(A), R.S. 11:246, or R.S. 11:241, the system must
-12-
G. S. Curran & Company, Ltd.
have investment earnings in excess of the valuation interest rate sufficient to offset the additional
liability due to the cost of the COLA or fund the COLA out of the Funding Deposit Account.
The limitations on timing of COLAs given in R.S. 11:243 are as follows:
1. The system has a funded ratio of 90% or more and has not granted a benefit increase to
retirees, survivors, and beneficiaries in the most recent fiscal year.
2. The system has a funded ratio of 80% or more and has not granted a benefit increase to
retirees, survivors, and beneficiaries in the two most recent fiscal years.
3. The system has a funded ratio of 70% or more and has not granted a benefit increase to
retirees, survivors, and beneficiaries in the three most recent fiscal years.
Since the most recent cost of living increase was granted by the Board of Trustees in a vote at its July
25, 2017 Board meeting based upon the results of the September 30, 2016 actuarial valuation and the
system’s funded ratio exceeds 90% as of September 30, 2018, it appears that the Fund meets the
timing limitations contained within R.S. 11:243 to grant a cost of living increase based upon the results
of the June 30, 2018 actuarial valuation. For Fiscal 2018 the fund achieved an actuarial rate of return
of 7.0%. This return exceeded the assumed rate of return for Fiscal 2018 of 6.75% and generated
$825,349 in excess interest. Therefore, the Board may not grant a full cost of living increase unless
such an increase is funded through the system’s Funding Deposit Account, which has a balance of
$37,949,749 as of September 30, 2018.
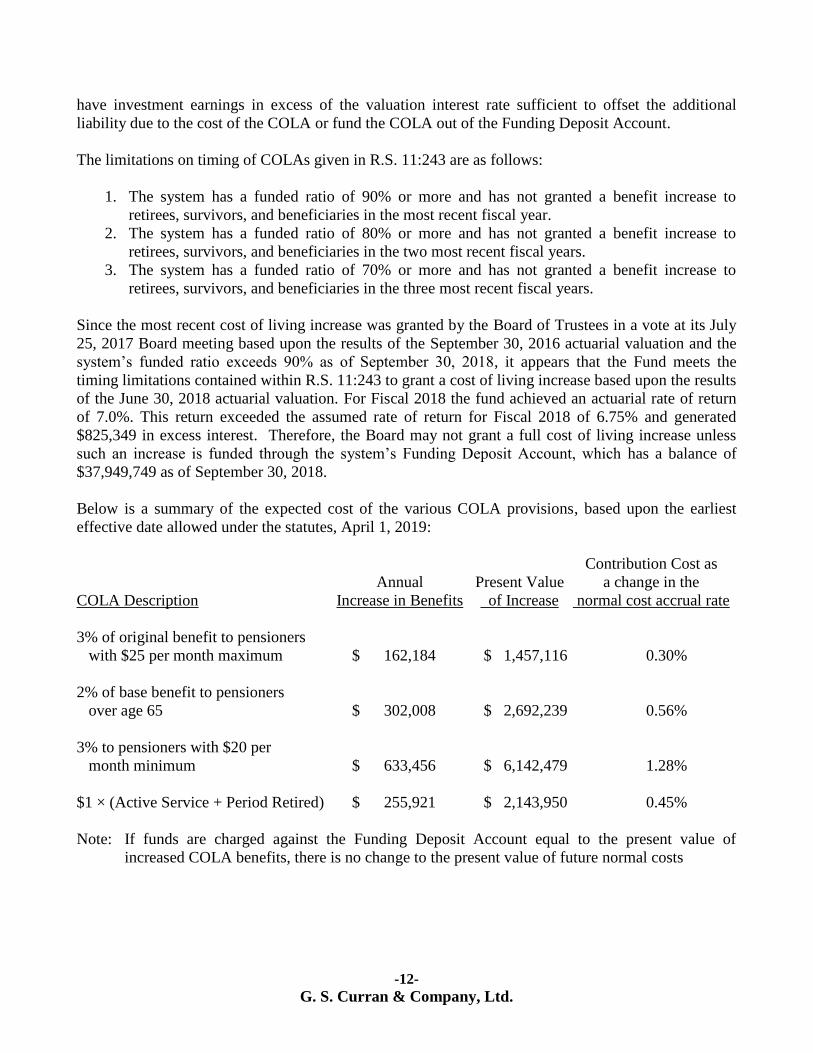
Below is a summary of the expected cost of the various COLA provisions, based upon the earliest
effective date allowed under the statutes, April 1, 2019:
Contribution Cost as
Annual Present Value a change in the
COLA Description Increase in Benefits of Increase normal cost accrual rate
3% of original benefit to pensioners
with $25 per month maximum $ 162,184 $ 1,457,116 0.30%
2% of base benefit to pensioners
over age 65 $ 302,008 $ 2,692,239 0.56%
3% to pensioners with $20 per
month minimum $ 633,456 $ 6,142,479 1.28%
$1 × (Active Service + Period Retired) $ 255,921 $ 2,143,950 0.45%
Note: If funds are charged against the Funding Deposit Account equal to the present value of
increased COLA benefits, there is no change to the present value of future normal costs
-13-
G. S. Curran & Company, Ltd.
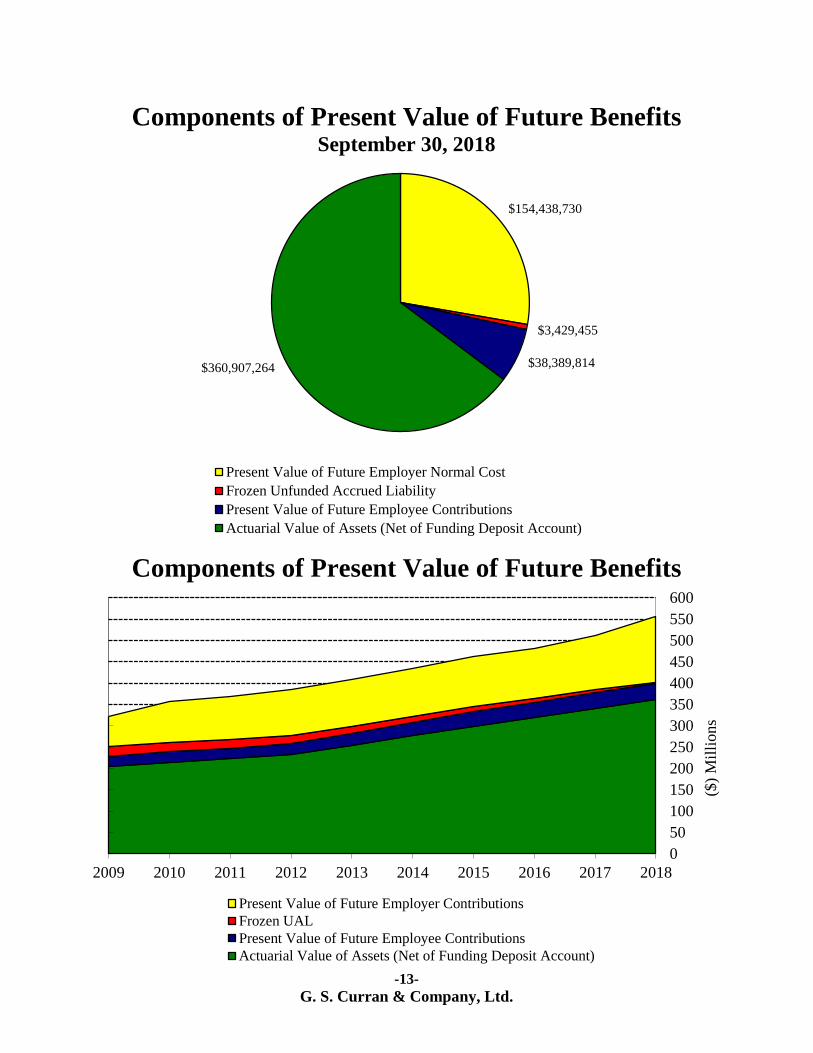
GRAPHS Components of Present Value of Future Benefits
September 30, 2018
Components of Present Value of Future Benefits
$154,438,730
$3,429,455
$38,389,814 $360,907,264
Present Value of Future Employer Normal Cost
Frozen Unfunded Accrued Liability
Present Value of Future Employee Contributions
Actuarial Value of Assets (Net of Funding Deposit Account)
0
50
100
150
200
250
300
350
400
450
500
550
600
2009 2010 2011 2012 2013 2014 2015 2016 2017 2018
($)
Mil
lions
Present Value of Future Employer Contributions
Frozen UAL
Present Value of Future Employee Contributions
Actuarial Value of Assets (Net of Funding Deposit Account)
-14-
G. S. Curran & Company, Ltd.
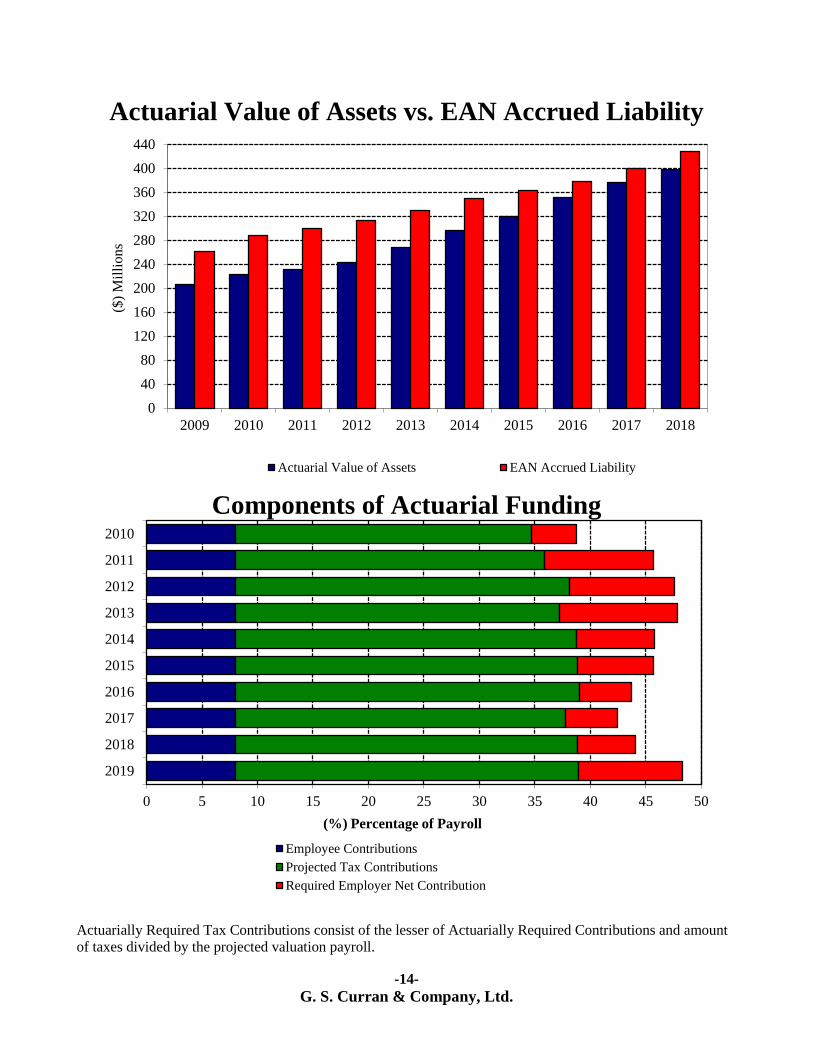
Actuarial Value of Assets vs. EAN Accrued Liability
Components of Actuarial Funding
Actuarially Required Tax Contributions consist of the lesser of Actuarially Required Contributions and amount
of taxes divided by the projected valuation payroll.
0
40
80
120
160
200
240
280
320
360
400
440
2009 2010 2011 2012 2013 2014 2015 2016 2017 2018
($)
Mil
lio
ns
Actuarial Value of Assets EAN Accrued Liability
0 5 10 15 20 25 30 35 40 45 50
2019
2018
2017
2016
2015
2014
2013
2012
2011
2010
(%) Percentage of Payroll
Employee Contributions
Projected Tax Contributions
Required Employer Net Contribution

-15-
G. S. Curran & Company, Ltd.
Frozen Unfunded Actuarial Accrued Liability
Historical Asset Yields
0
10
20
30
40
1989 1999 2009 2019 2029
Original UAL 1999 Revisions 2000 Revisions 2003 Revisions
2006 Revisions 2007 Revisions 2008 Revisions
$M
illi
on
s
6.8
5.1
2.6 3.5
9.2 9.8
7.4 8.2
7.6 7.0
6.6
7.7
-1.2
18.4
13.4
9.1
-1.7
8.8
12.1
7.7
-5
0
5
10
15
20
2009 2010 2011 2012 2013 2014 2015 2016 2017 2018
Yie
ld (
As
a P
erce
nt)
Actuarial Yield Market Yield

-16-
G. S. Curran & Company, Ltd.
Net Non-Investment Income
2009 2010 2011 2012 2013 2014 2015 2016 2017 2018
Non-Investment Income ($Mil) 18.0 18.9 19.5 19.8 20.8 21.7 22.1 28.0 21.3 20.7
Benefits and Expenses ($Mil)
13.9 14.0 15.9 15.9 19.6 19.6 20.5 22.5 23.6 23.9
Net Non-Investment Income ($Mil) 4.1 4.9 3.6 3.9 1.2 2.1 1.6 5.5 -2.3 -3.2
Total Income vs. Expenses (Based on Market Value of Assets)
2009 2010 2011 2012 2013 2014 2015 2016 2017 2018
Total Income ($Mil) 29.5 33.4 17.0 58.6 54.5 47.7 16.7 55.5 62.5 50.1
Benefits and Expenses ($Mil)
13.9 14.0 15.9 15.9 19.6 19.6 20.5 22.5 23.6 23.9
Net Change in MVA ($Mil) 15.6 19.4 1.1 42.7 34.9 28.1 -3.8 33.0 38.9 26.2
-5
0
5
10
15
20
25
30
2009 2010 2011 2012 2013 2014 2015 2016 2017 2018
$M
illi
on
s
-10
0
10
20
30
40
50
60
70
2009 2010 2011 2012 2013 2014 2015 2016 2017 2018
$M
illi
on
s
-17-
G. S. Curran & Company, Ltd.
Active – Census by Age (as a percent)
Active – Census by Service (as a percent)
0 5 10 15 20 25 30 35
Over 70
61-70
51-60
41-50
31-40
Under 30
2008 2013 2018
0 5 10 15 20 25 30 35
Over 25
20-24
15-19
10-14
5-9
0-4
2008 2013 2018

-18-
G. S. Curran & Company, Ltd.
EXHIBITS
-19-
G. S. Curran & Company, Ltd.
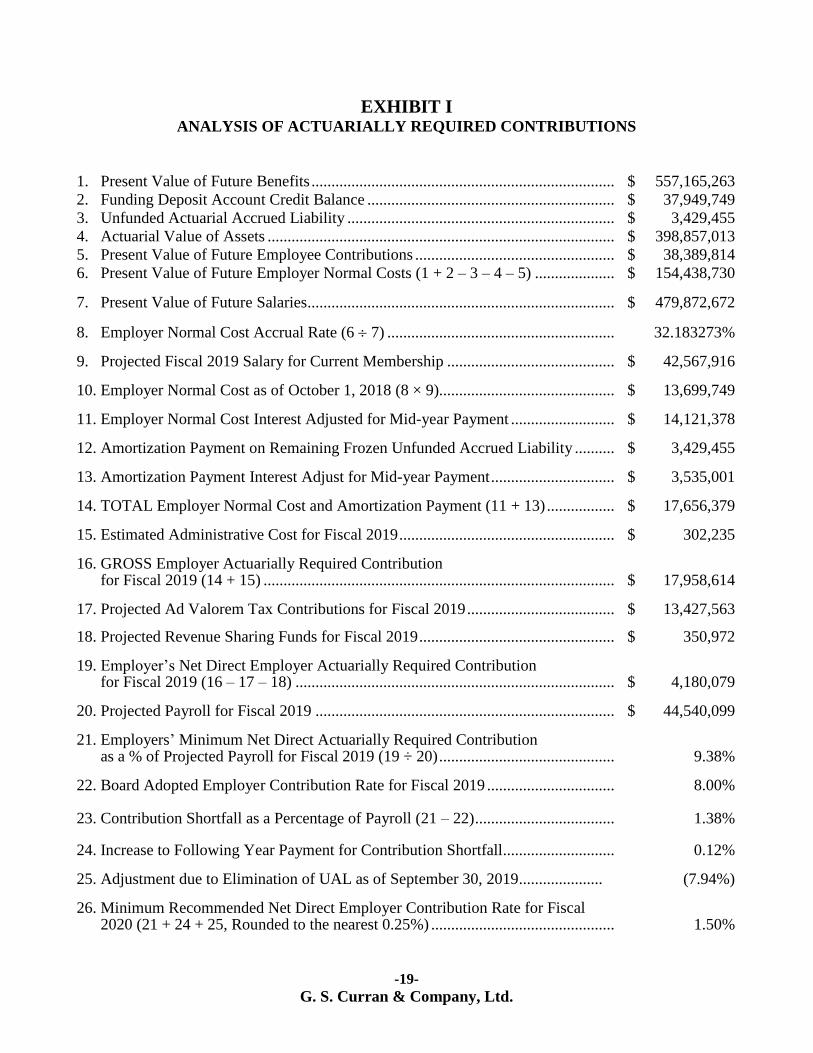
EXHIBIT I ANALYSIS OF ACTUARIALLY REQUIRED CONTRIBUTIONS
1. Present Value of Future Benefits ............................................................................ $ 557,165,263
2. Funding Deposit Account Credit Balance .............................................................. $ 37,949,749
3. Unfunded Actuarial Accrued Liability ................................................................... $ 3,429,455
4. Actuarial Value of Assets ....................................................................................... $ 398,857,013
5. Present Value of Future Employee Contributions .................................................. $ 38,389,814
6. Present Value of Future Employer Normal Costs (1 + 2 – 3 – 4 – 5) .................... $ 154,438,730
7. Present Value of Future Salaries............................................................................. $ 479,872,672
8. Employer Normal Cost Accrual Rate (6 7) ......................................................... 32.183273%
9. Projected Fiscal 2019 Salary for Current Membership .......................................... $ 42,567,916
10. Employer Normal Cost as of October 1, 2018 (8 × 9)............................................ $ 13,699,749
11. Employer Normal Cost Interest Adjusted for Mid-year Payment .......................... $ 14,121,378
12. Amortization Payment on Remaining Frozen Unfunded Accrued Liability .......... $ 3,429,455
13. Amortization Payment Interest Adjust for Mid-year Payment ............................... $ 3,535,001
14. TOTAL Employer Normal Cost and Amortization Payment (11 + 13) ................. $ 17,656,379
15. Estimated Administrative Cost for Fiscal 2019 ...................................................... $ 302,235
16. GROSS Employer Actuarially Required Contribution for Fiscal 2019 (14 + 15) ........................................................................................ $ 17,958,614
17. Projected Ad Valorem Tax Contributions for Fiscal 2019 ..................................... $ 13,427,563
18. Projected Revenue Sharing Funds for Fiscal 2019 ................................................. $ 350,972
19. Employer’s Net Direct Employer Actuarially Required Contribution for Fiscal 2019 (16 – 17 – 18) ................................................................................ $ 4,180,079
20. Projected Payroll for Fiscal 2019 ........................................................................... $ 44,540,099
21. Employers’ Minimum Net Direct Actuarially Required Contribution as a % of Projected Payroll for Fiscal 2019 (19 ÷ 20) ............................................ 9.38%
22. Board Adopted Employer Contribution Rate for Fiscal 2019 ................................ 8.00% 23. Contribution Shortfall as a Percentage of Payroll (21 – 22) ................................... 1.38%
24. Increase to Following Year Payment for Contribution Shortfall............................ 0.12%
25. Adjustment due to Elimination of UAL as of September 30, 2019 ..................... (7.94%)
26. Minimum Recommended Net Direct Employer Contribution Rate for Fiscal 2020 (21 + 24 + 25, Rounded to the nearest 0.25%) .............................................. 1.50%
-20-
G. S. Curran & Company, Ltd.
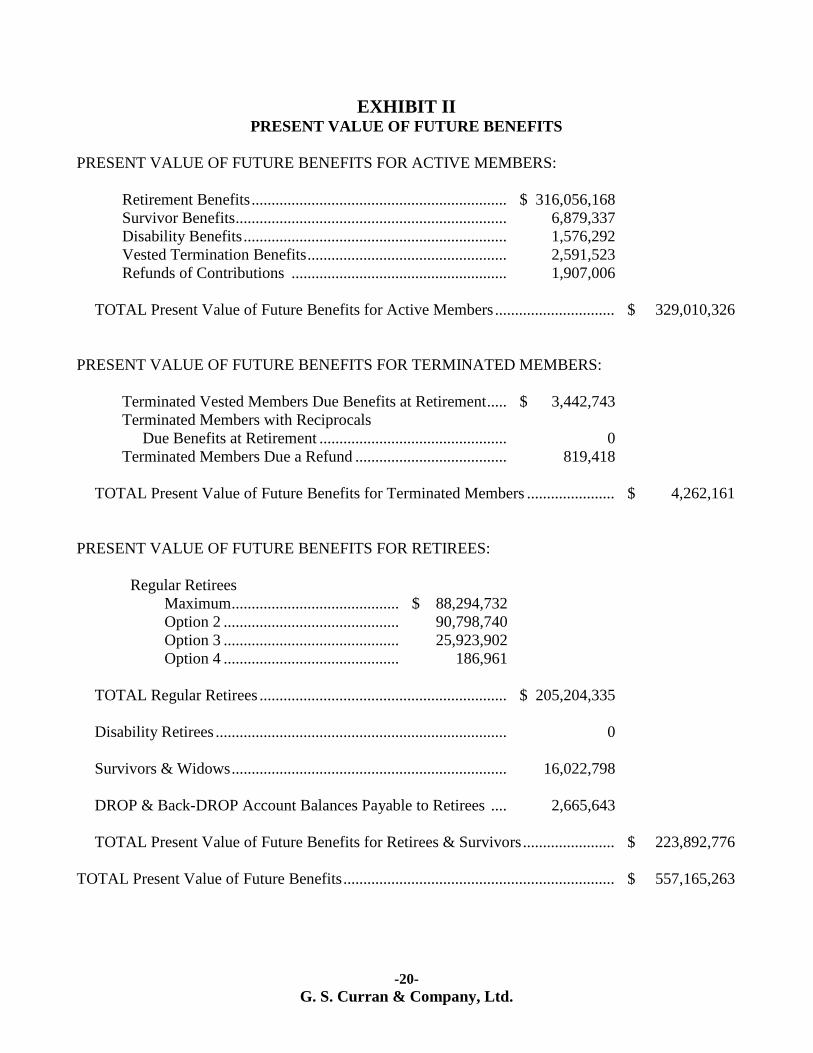
EXHIBIT II PRESENT VALUE OF FUTURE BENEFITS
PRESENT VALUE OF FUTURE BENEFITS FOR ACTIVE MEMBERS:
Retirement Benefits ................................................................ $ 316,056,168
Survivor Benefits .................................................................... 6,879,337
Disability Benefits .................................................................. 1,576,292
Vested Termination Benefits .................................................. 2,591,523
Refunds of Contributions ...................................................... 1,907,006
TOTAL Present Value of Future Benefits for Active Members .............................. $ 329,010,326
PRESENT VALUE OF FUTURE BENEFITS FOR TERMINATED MEMBERS:
Terminated Vested Members Due Benefits at Retirement ..... $ 3,442,743
Terminated Members with Reciprocals
Due Benefits at Retirement ............................................... 0
Terminated Members Due a Refund ...................................... 819,418
TOTAL Present Value of Future Benefits for Terminated Members ...................... $ 4,262,161
PRESENT VALUE OF FUTURE BENEFITS FOR RETIREES:
Regular Retirees
Maximum .......................................... $ 88,294,732
Option 2 ............................................ 90,798,740
Option 3 ............................................ 25,923,902
Option 4 ............................................ 186,961
TOTAL Regular Retirees .............................................................. $ 205,204,335
Disability Retirees ......................................................................... 0
Survivors & Widows ..................................................................... 16,022,798
DROP & Back-DROP Account Balances Payable to Retirees .... 2,665,643
TOTAL Present Value of Future Benefits for Retirees & Survivors ....................... $ 223,892,776
TOTAL Present Value of Future Benefits .................................................................... $ 557,165,263
-21-
G. S. Curran & Company, Ltd.
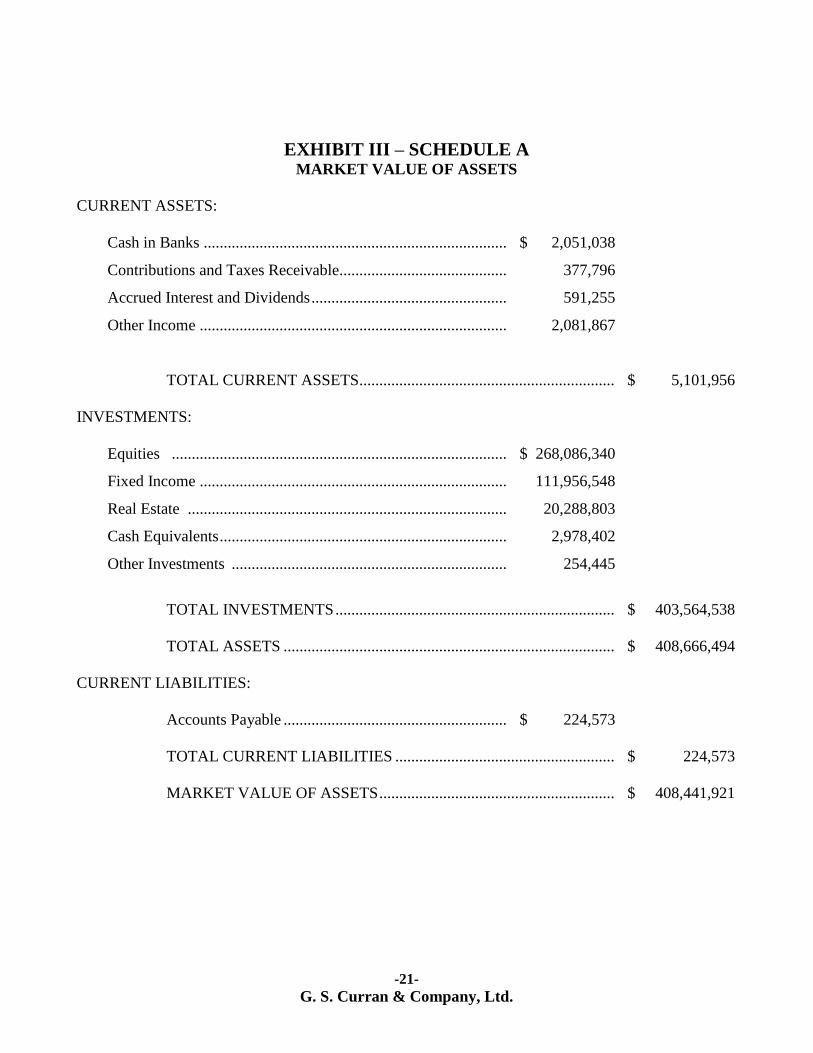
EXHIBIT III – SCHEDULE A MARKET VALUE OF ASSETS
CURRENT ASSETS:
Cash in Banks ............................................................................ $ 2,051,038
Contributions and Taxes Receivable.......................................... 377,796
Accrued Interest and Dividends ................................................. 591,255
Other Income ............................................................................. 2,081,867
TOTAL CURRENT ASSETS ................................................................ $ 5,101,956
INVESTMENTS:
Equities .................................................................................... $ 268,086,340
Fixed Income ............................................................................. 111,956,548
Real Estate ................................................................................ 20,288,803
Cash Equivalents ........................................................................ 2,978,402
Other Investments ..................................................................... 254,445
TOTAL INVESTMENTS ...................................................................... $ 403,564,538
TOTAL ASSETS ................................................................................... $ 408,666,494
CURRENT LIABILITIES:
Accounts Payable ........................................................ $ 224,573
TOTAL CURRENT LIABILITIES ....................................................... $ 224,573
MARKET VALUE OF ASSETS ........................................................... $ 408,441,921
-22-
G. S. Curran & Company, Ltd.
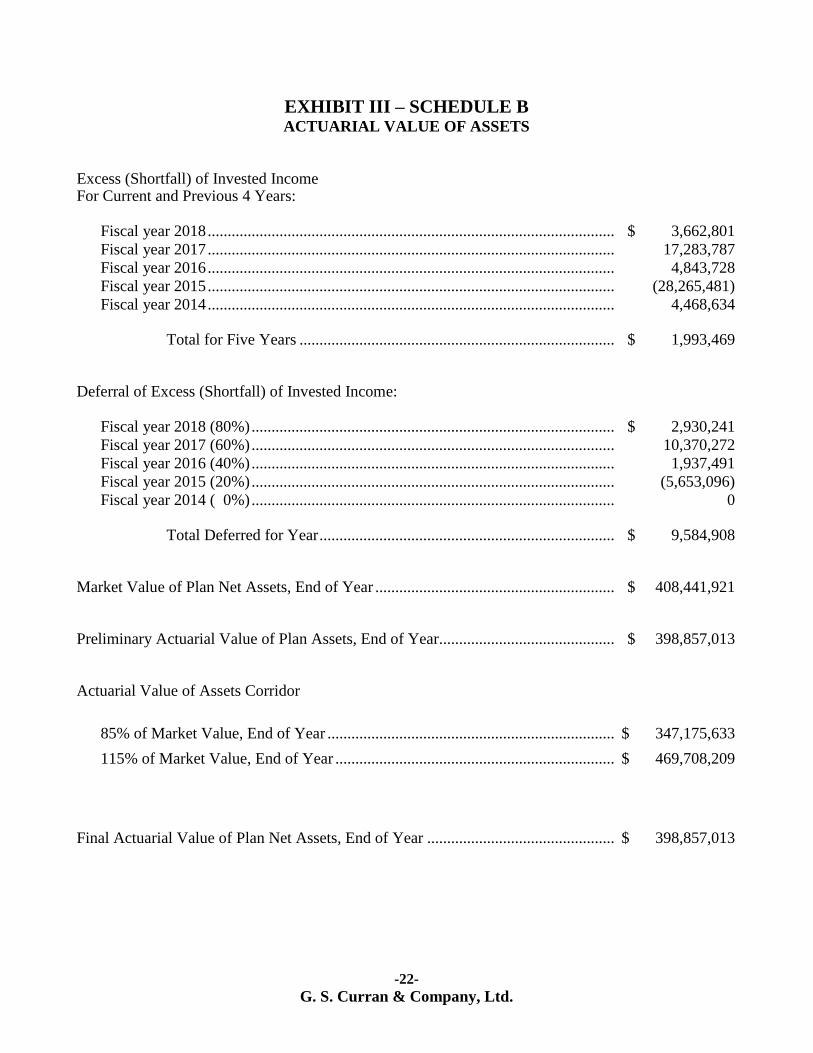
EXHIBIT III – SCHEDULE B ACTUARIAL VALUE OF ASSETS
Excess (Shortfall) of Invested Income For Current and Previous 4 Years: Fiscal year 2018 ...................................................................................................... $ 3,662,801
Fiscal year 2017 ...................................................................................................... 17,283,787
Fiscal year 2016 ...................................................................................................... 4,843,728
Fiscal year 2015 ...................................................................................................... (28,265,481)
Fiscal year 2014 ...................................................................................................... 4,468,634 Total for Five Years ............................................................................... $ 1,993,469 Deferral of Excess (Shortfall) of Invested Income: Fiscal year 2018 (80%) ........................................................................................... $ 2,930,241
Fiscal year 2017 (60%) ........................................................................................... 10,370,272
Fiscal year 2016 (40%) ........................................................................................... 1,937,491
Fiscal year 2015 (20%) ........................................................................................... (5,653,096)
Fiscal year 2014 ( 0%) ........................................................................................... 0 Total Deferred for Year .......................................................................... $ 9,584,908 Market Value of Plan Net Assets, End of Year ............................................................ $ 408,441,921 Preliminary Actuarial Value of Plan Assets, End of Year............................................ $ 398,857,013 Actuarial Value of Assets Corridor
85% of Market Value, End of Year ........................................................................ $ 347,175,633
115% of Market Value, End of Year ...................................................................... $ 469,708,209
Final Actuarial Value of Plan Net Assets, End of Year ............................................... $ 398,857,013
-23-
G. S. Curran & Company, Ltd.
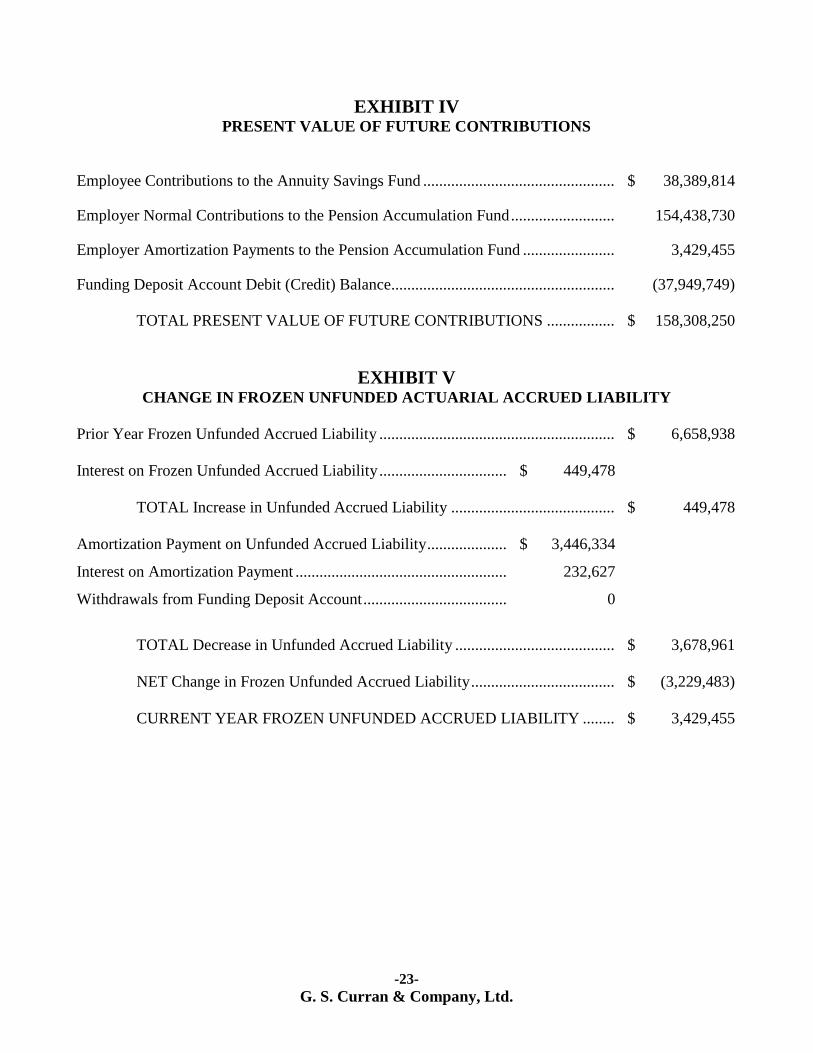
EXHIBIT IV PRESENT VALUE OF FUTURE CONTRIBUTIONS
Employee Contributions to the Annuity Savings Fund ................................................ $ 38,389,814 Employer Normal Contributions to the Pension Accumulation Fund .......................... 154,438,730 Employer Amortization Payments to the Pension Accumulation Fund ....................... 3,429,455 Funding Deposit Account Debit (Credit) Balance........................................................ (37,949,749)
TOTAL PRESENT VALUE OF FUTURE CONTRIBUTIONS ................. $ 158,308,250
EXHIBIT V CHANGE IN FROZEN UNFUNDED ACTUARIAL ACCRUED LIABILITY
Prior Year Frozen Unfunded Accrued Liability ........................................................... $ 6,658,938
Interest on Frozen Unfunded Accrued Liability ................................ $ 449,478
TOTAL Increase in Unfunded Accrued Liability ......................................... $ 449,478
Amortization Payment on Unfunded Accrued Liability .................... $ 3,446,334
Interest on Amortization Payment ..................................................... 232,627
Withdrawals from Funding Deposit Account .................................... 0
TOTAL Decrease in Unfunded Accrued Liability ........................................ $ 3,678,961
NET Change in Frozen Unfunded Accrued Liability .................................... $ (3,229,483)
CURRENT YEAR FROZEN UNFUNDED ACCRUED LIABILITY ........ $ 3,429,455
-24-
G. S. Curran & Company, Ltd.
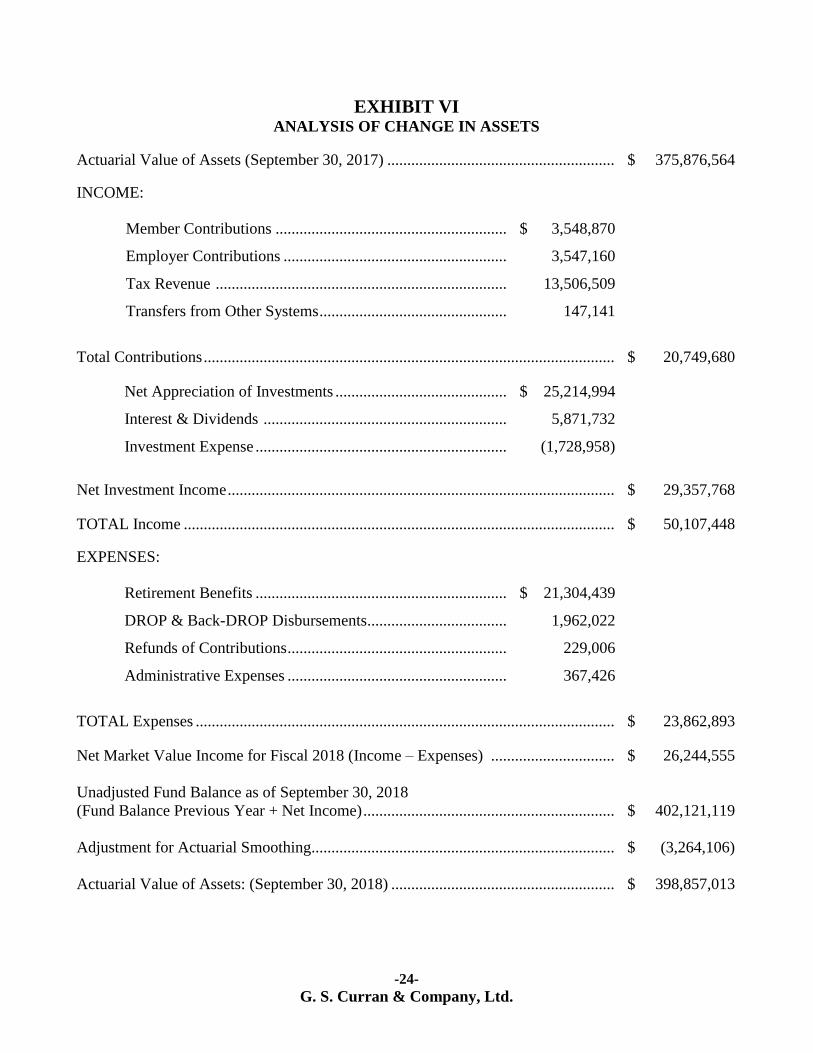
EXHIBIT VI ANALYSIS OF CHANGE IN ASSETS
Actuarial Value of Assets (September 30, 2017) ......................................................... $ 375,876,564 INCOME:
Member Contributions .......................................................... $ 3,548,870
Employer Contributions ........................................................ 3,547,160
Tax Revenue ......................................................................... 13,506,509
Transfers from Other Systems ............................................... 147,141
Total Contributions ....................................................................................................... $ 20,749,680 Net Appreciation of Investments ........................................... $ 25,214,994
Interest & Dividends ............................................................. 5,871,732
Investment Expense ............................................................... (1,728,958)
Net Investment Income ................................................................................................. $ 29,357,768 TOTAL Income ............................................................................................................ $ 50,107,448 EXPENSES:
Retirement Benefits ............................................................... $ 21,304,439
DROP & Back-DROP Disbursements ................................... 1,962,022
Refunds of Contributions ....................................................... 229,006
Administrative Expenses ....................................................... 367,426
TOTAL Expenses ......................................................................................................... $ 23,862,893 Net Market Value Income for Fiscal 2018 (Income – Expenses) ............................... $ 26,244,555
Unadjusted Fund Balance as of September 30, 2018
(Fund Balance Previous Year + Net Income) ............................................................... $ 402,121,119
Adjustment for Actuarial Smoothing ............................................................................ $ (3,264,106)
Actuarial Value of Assets: (September 30, 2018) ........................................................ $ 398,857,013
-25-
G. S. Curran & Company, Ltd.
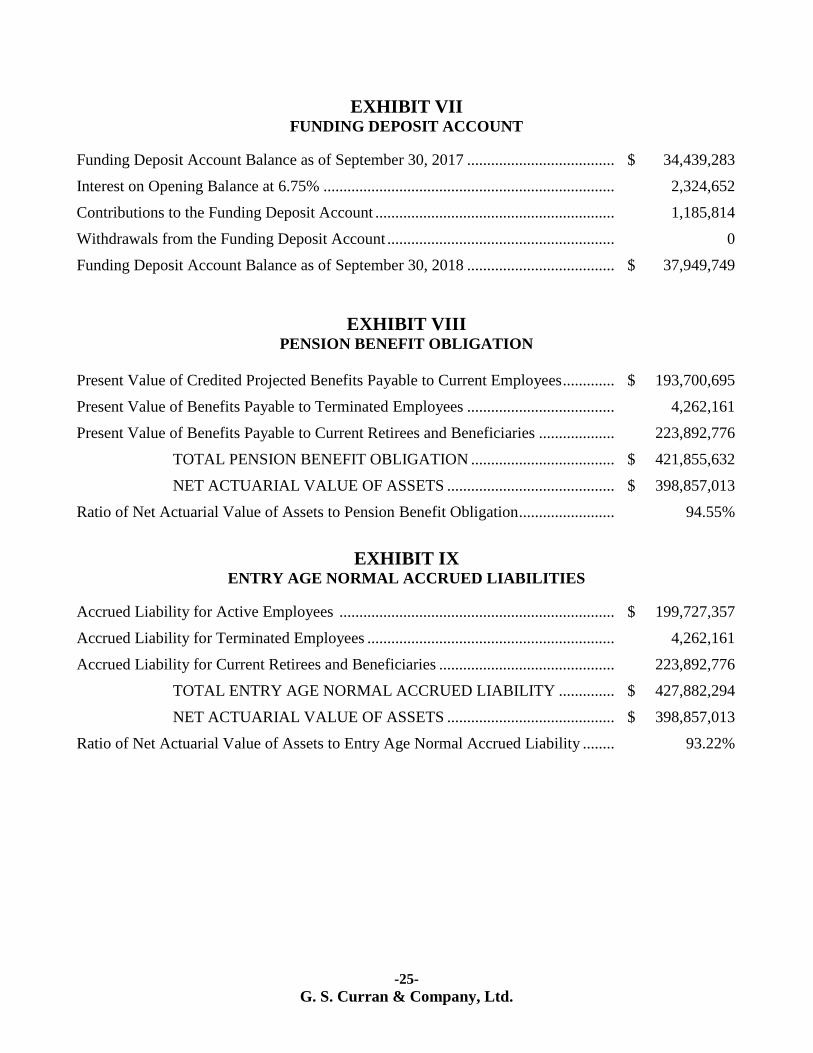
EXHIBIT VII FUNDING DEPOSIT ACCOUNT
Funding Deposit Account Balance as of September 30, 2017 ..................................... $ 34,439,283
Interest on Opening Balance at 6.75% ......................................................................... 2,324,652
Contributions to the Funding Deposit Account ............................................................ 1,185,814
Withdrawals from the Funding Deposit Account ......................................................... 0
Funding Deposit Account Balance as of September 30, 2018 ..................................... $ 37,949,749
EXHIBIT VIII PENSION BENEFIT OBLIGATION
Present Value of Credited Projected Benefits Payable to Current Employees ............. $ 193,700,695
Present Value of Benefits Payable to Terminated Employees ..................................... 4,262,161
Present Value of Benefits Payable to Current Retirees and Beneficiaries ................... 223,892,776
TOTAL PENSION BENEFIT OBLIGATION .................................... $ 421,855,632
NET ACTUARIAL VALUE OF ASSETS .......................................... $ 398,857,013
Ratio of Net Actuarial Value of Assets to Pension Benefit Obligation ........................ 94.55%
EXHIBIT IX ENTRY AGE NORMAL ACCRUED LIABILITIES
Accrued Liability for Active Employees ..................................................................... $ 199,727,357
Accrued Liability for Terminated Employees .............................................................. 4,262,161
Accrued Liability for Current Retirees and Beneficiaries ............................................ 223,892,776
TOTAL ENTRY AGE NORMAL ACCRUED LIABILITY .............. $ 427,882,294
NET ACTUARIAL VALUE OF ASSETS .......................................... $ 398,857,013
Ratio of Net Actuarial Value of Assets to Entry Age Normal Accrued Liability ........ 93.22%

-26-
G. S. Curran & Company, Ltd.
EXHIBIT X CENSUS DATA
Active
Terminated
with Funds
on Deposit
Retired
Total
Number of members as of
September 30, 2017 751 103 570 1,424
Additions to Census
Initial membership
Omitted in error last year
Death of another member
Adjustment for multiple records
31
6
31
6
Change in Status during Year
Actives terminating service
Actives who retired
Term. members rehired
Term. members who retire
Retirees who are rehired
Refunded who are rehired
Omitted in error last year
(15)
(16)
15
(1)
16
1
Eliminated from Census
Refund of contributions
Deaths
Included in error last year
Adjustment for multiple records
(4)
(7)
(21)
(11)
(21)
Number of members as of
September 30, 2018 747 110 572 1,429
-27-
G. S. Curran & Company, Ltd.
-28-
G. S. Curran & Company, Ltd.
-29-
G. S. Curran & Company, Ltd.
-30-
G. S. Curran & Company, Ltd.
-31-
G. S. Curran & Company, Ltd.
-32-
G. S. Curran & Company, Ltd.
-33-
G. S. Curran & Company, Ltd.
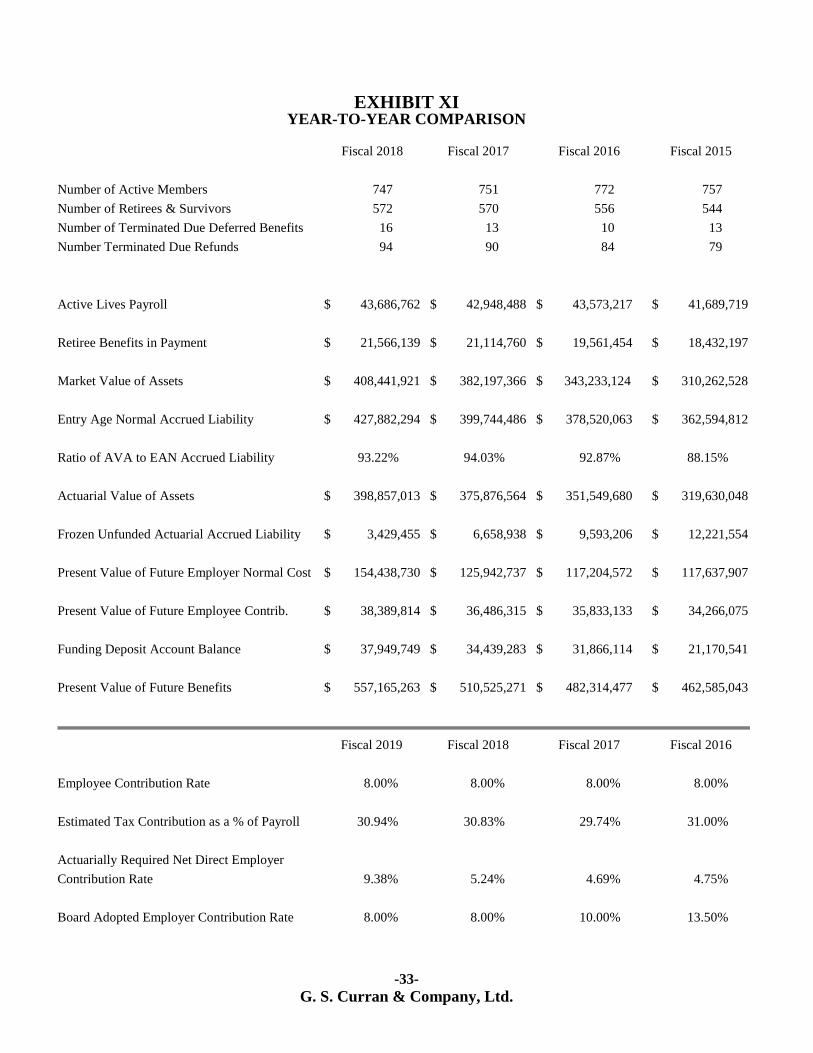
EXHIBIT XI YEAR-TO-YEAR COMPARISON
Fiscal 2018 Fiscal 2017 Fiscal 2016 Fiscal 2015
Number of Active Members 747 751 772 757
Number of Retirees & Survivors 572 570 556 544
Number of Terminated Due Deferred Benefits 16 13 10 13
Number Terminated Due Refunds 94 90 84 79
Active Lives Payroll $ 43,686,762 $ 42,948,488 $ 43,573,217 $ 41,689,719
Retiree Benefits in Payment $ 21,566,139 $ 21,114,760 $ 19,561,454 $ 18,432,197
Market Value of Assets $ 408,441,921 $ 382,197,366 $ 343,233,124 $ 310,262,528
Entry Age Normal Accrued Liability $ 427,882,294 $ 399,744,486 $ 378,520,063 $ 362,594,812
Ratio of AVA to EAN Accrued Liability 93.22% 94.03% 92.87% 88.15%
Actuarial Value of Assets $ 398,857,013 $ 375,876,564 $ 351,549,680 $ 319,630,048
Frozen Unfunded Actuarial Accrued Liability $ 3,429,455 $ 6,658,938 $ 9,593,206 $ 12,221,554
Present Value of Future Employer Normal Cost $ 154,438,730 $ 125,942,737 $ 117,204,572 $ 117,637,907
Present Value of Future Employee Contrib. $ 38,389,814 $ 36,486,315 $ 35,833,133 $ 34,266,075
Funding Deposit Account Balance $ 37,949,749 $ 34,439,283 $ 31,866,114 $ 21,170,541
Present Value of Future Benefits $ 557,165,263 $ 510,525,271 $ 482,314,477 $ 462,585,043
Fiscal 2019 Fiscal 2018 Fiscal 2017 Fiscal 2016
Employee Contribution Rate 8.00% 8.00% 8.00% 8.00%
Estimated Tax Contribution as a % of Payroll 30.94% 30.83% 29.74% 31.00%
Actuarially Required Net Direct Employer
Contribution Rate 9.38% 5.24% 4.69% 4.75%
Board Adopted Employer Contribution Rate 8.00% 8.00% 10.00% 13.50%

-34-
G. S. Curran & Company, Ltd.
Fiscal 2014 Fiscal 2013 Fiscal 2012 Fiscal 2011 Fiscal 2010 Fiscal 2009
757 747 758 744 768 777
535 519 489 493 460 454
14 17 18 20 22 23
74 75 70 68 60 58
$ 40,498,685 $ 39,962,471 $ 39,098,798 $ 36,976,826 $ 37,837,825 $ 38,039,395
$ 17,346,092 $ 16,681,535 $ 14,191,340 $ 13,718,479 $ 11,705,460 $ 11,184,513
$ 314,045,097 $ 285,977,787 $ 251,096,489 $ 208,403,362 $ 207,336,952 $ 187,888,278
$ 349,004,741 $ 329,768,390 $ 312,848,872 $ 300,017,223 $ 288,389,709 $ 261,531,084
84.80% 81.11% 77.93% 77.21% 77.03% 79.03%
$ 295,965,881 $ 267,473,843 $ 243,797,375 $ 231,647,617 $ 222,141,802 $ 206,677,106
$ 14,585,158 $ 16,695,158 $ 18,552,185 $ 20,177,466 $ 21,590,624 $ 22,817,329
$ 110,250,598 $ 108,615,730 $ 108,058,007 $ 101,041,103 $ 95,265,554 $ 69,846,719
$ 29,803,451 $ 28,814,590 $ 26,841,544 $ 25,278,807 $ 24,956,172 $ 24,352,444
$ 17,024,774 $ 13,720,700 $ 11,421,183 $ 9,257,096 $ 7,104,280 $ 2,939,108
$ 433,580,314 $ 407,878,621 $ 385,827,928 $ 368,887,897 $ 356,849,872 $ 320,754,490
Fiscal 2015 Fiscal 2014 Fiscal 2013 Fiscal 2012 Fiscal 2011 Fiscal 2010
8.00% 8.00% 8.00% 8.00% 8.00% 8.00%
30.90% 30.75% 29.26% 30.13% 27.88% 26.69%
6.84% 7.05% 10.58% 9.49% 9.83% 4.08%
13.50% 13.50% 13.50% 13.50% 13.50% 13.50%

-35-
G. S. Curran & Company, Ltd.
SUMMARY OF PRINCIPAL PLAN PROVISIONS
The Louisiana Assessors’ Retirement Fund is a defined benefit pension plan that provides retirement allowances and other benefits for the assessors and their permanent, full-time employees. The plan was established by Act 91 of the 1950 Louisiana Legislative Session. Provisions of the plan are set forth in the Louisiana Revised Statutes (R.S. 11:1401 through R.S. 11:1483). The following summary of plan provisions is for general informational purposes only and does not constitute a guarantee of benefits. MEMBERSHIP – Membership in the fund is allowed only to assessors, full-time permanent employees of assessors, the secretary and regular employees of the Assessors’ Retirement Fund, and permanent employees of the Louisiana Assessors’ Association and Louisiana Assessors’ Insurance Fund. Full-time, permanent employees as used herein, means those employed on a full twelve-month basis within each calendar year; provided, however, that members may be granted leaves of absence, with no creditable service to be allowed for time on leave. Membership is not allowed on a part-time, temporary, or intermittent basis. CONTRIBUTION RATES – Under the provisions of R.S. 11:62 and 11:103, the fund is financed by employee contributions of 8% of earnable compensation as determined by the Board of Trustees. Each assessor has the option of electing to pay all or a portion of their employees’ contribution into the retirement fund. This election remains in effect for 1 year and can be rescinded only upon written notice to the retirement system. In addition, the fund receives revenue sharing funds as appropriated each year by the legislature. Also, under R.S. 11:82, each sheriff and ex-officio tax collector remits the employers’ share of the actuarially required contribution to fund the system up to a maximum of 0.25% of the aggregate amount of the tax shown to be collected by the tax roll of each respective parish, including that shown on the tax rolls to be exempted by virtue of homestead exemptions. Should employee contributions and tax funds collected from ad valorem taxes and revenue sharing funds be insufficient to provide for the gross employer actuarially required contribution, the employer is required to make direct contributions as determined by the Public Retirement Systems’ Actuarial Committee. Under R.S. 11:106, the Board of Trustees is authorized to require a net direct contribution rate of up to three percent more than the rate determined under R.S. 11:103. Under R.S. 11:105 and R.S. 11:107, in any fiscal year during which the net direct employer contribution rates would otherwise be decreased, the Board of Trustees is authorized to set the employer contribution rate at any point between the previous year’s employer contribution rate and the decreased rate that would otherwise occur. Any excess funds resulting from the additional contributions will be credited to the Funding Deposit Account defined in R.S. 11:107.1. FUNDING DEPOSIT ACCOUNT – If the contribution rate is set above the minimum recommended rate pursuant to R.S. 11:105, 11:106 or 11:107, the surplus contributions collected, if any, are credited to the Funding Deposit Account defined in R.S. 11:107.1. The funds in the account earn interest annually at the Board-approved actuarial valuation interest rate, and such interest is credited to the account at least once a year. The Board of Trustees may, in any fiscal year, direct that funds from the account be charged for the following purposes: (1) to reduce the unfunded accrued liability; (2) to reduce the present value of future normal costs for systems using an aggregate funding method; (3) to pay all or a portion of any future net direct employer contributions; or (4) to provide for cost of living increases, in accordance with applicable law. In no event will the funds charged from the account exceed the outstanding account balance. If the Board of Trustees of the system elects to utilize funds from the funding deposit account to pay all or a portion of any future net direct employer contributions, the percent reduction in the minimum recommended employer contribution rate otherwise applicable is determined by dividing the interest-adjusted value of the charges from the funding deposit account by the projected payroll for the fiscal year for which the contribution rate is to
-36-
G. S. Curran & Company, Ltd.
be reduced. For funding purposes, any asset value utilized in the calculation of the actuarial value of assets of a system excludes the funding deposit account balance as of the asset determination date for such calculation. For all purposes other than funding, the funds in the account are considered assets of the system. RETIREMENT BENEFITS – For members hired before October 1, 2013 – Members with thirty years of creditable service may retire at any age and members with at least twelve years of service may retire at age fifty-five. The benefit accrual rate is three and one-third percent for all years of service. The normal retirement benefit for individuals hired prior to October 1, 2006, will be equal to three and one-third percent of the highest monthly average final compensation received during any thirty-six consecutive months while employed in an assessor’s office or other creditable employment times the number of years of the member’s creditable service not to exceed one hundred percent of the member’s monthly average final compensation after taking into account the reduction arising from any optional retirement selected. The normal retirement benefit for individuals hired on or after October 1, 2006, will be equal to three and one-third percent of the highest monthly average final compensation received during any sixty consecutive months while employed in an assessor’s office or other creditable employment times the number of years of the member’s creditable service not to exceed one hundred percent of the member’s monthly average final compensation after taking into account the reduction arising from any optional retirement selected. For members hired on or after October 1, 2013 – Members with twelve or more years of creditable service may retire at age sixty and members with thirty or more years of creditable service may retire at age fifty-five. The normal retirement benefit for members with less than thirty years of creditable service will be equal to three percent of the highest monthly average final compensation times the number of years of creditable service. The normal retirement benefit for members with at least thirty years of creditable service will be equal to three and one-third percent of the highest monthly average final compensation times the number of years of creditable service. Only transferred service with an accrual rate of at least three and one-third percent will be used to meet the thirty year requirement. Benefits are calculated using the highest sixty month average compensation. Monthly benefits may not exceed 100% of the monthly average final compensation. OPTIONAL ALLOWANCES – Members may receive their benefits as a life annuity, or in lieu of such receive a reduced benefit according to the option selected that is the actuarial equivalent of the maximum benefit. If, upon retirement, a member selects their spouse as their beneficiary under Option 2 or Option 3 or Option 4, the option reduction factor will be based on the ages of the member and his or her beneficiary as of the member’s sixtieth birthday. If a participant selects an option 4 for someone other than their spouse, the option reduction factor is based on the ages of the member and beneficiary as of the later of the date of the member’s retirement or the member’s sixtieth birthday. Option 1 – If the member dies before he has received in annuity payments the present value of
his member’s annuity, as it was at the time of retirement the balance is paid to his beneficiary. Option 2 – Upon retirement, the member receives a reduced benefit. Upon the member’s death,
the surviving spouse will continue to receive the same reduced benefit. Option 3 – Upon retirement, the member receives a reduced benefit. Upon the member’s death,
the surviving spouse will receive one-half of the member’s reduced benefit.
-37-
G. S. Curran & Company, Ltd.
Option 4 – Upon retirement, the member may elect to receive a Board-approved benefit that is actuarially equivalent to the maximum benefit.
EXCESS BENEFIT PLAN – Under the provisions of this excess benefit plan a member may receive a benefit equal to the amount by which the member’s monthly benefit from the fund has been reduced because of the limitations of Section 415 of the Internal Revenue Code. DISABILITY BENEFITS – Disability benefits are awarded to active members who are totally disabled with twelve or more years of creditable service. In addition, any member with twenty years of service who withdraws from service prior to reaching retirement age is eligible for disability benefits. The disability benefit is equal to the lesser of the member’s applicable retirement accrual rate times the final average compensation multiplied by the number of years of creditable service (but not less than forty-five percent) or the retirement benefit which would be payable assuming accrued creditable service plus additional accrued service, if any, to the earliest normal retirement age. SURVIVOR BENEFITS – If a member dies in service with less than twelve years of service credit, his accumulated contributions are paid to the surviving spouse. If a member dies with twelve or more years of creditable service and is not eligible for retirement, the surviving spouse receives an automatic option 2 benefit that ceases on remarriage. If a member dies who is eligible for retirement, the surviving spouse receives an automatic option 2 benefit that does not terminate on remarriage. The minor children or handicapped children of a member with no spouse who dies in the line of duty or with four years of creditable service receives $50 per month for the first child and $10 per month for each additional child. Back-DROP – In lieu of receiving a service retirement allowance any member of the fund who has more than sufficient service for a regular service retirement may elect to receive a “Back-DROP” benefit. The Back-DROP benefit is based upon the Back-DROP period selected and the final average compensation prior to the period selected. The Back-DROP period is the lesser of three years or the service accrued between the time a member first becomes eligible for retirement and his actual date of retirement. At retirement the member’s maximum monthly retirement benefit is based upon his service, final average compensation, and plan provisions in effect on the last day of creditable service immediately prior to the commencement of the Back-DROP period. In addition to the monthly benefit at retirement, the member receives a lump-sum payment equal to the maximum monthly benefit as calculated above multiplied by the number of months in the Back-DROP period. CONTRIBUTION REFUNDS – Upon withdrawal from service, members not entitled to a retirement allowance are paid a refund of accumulated contributions upon request. Receipt of such a refund cancels all accrued benefits in the system. If the total of all benefits paid to a retiree and all benefits paid on the retiree’s account after their death is less than the retiree’s accumulated employee contributions, the remaining accumulated employee contributions shall be paid to the retiree’s beneficiary or to their estate if they do not have a designated beneficiary. Upon the death of a member or former member who has not been paid any benefits from the fund and who is not survived by any person eligible for any benefits from the fund, the accumulated employee contributions of the member or former member shall be paid to their designated beneficiary or to their estate if they do not have a designated beneficiary. COST OF LIVING INCREASES – Cost of living provisions for the system are detailed in
R.S.11:1461, R.S. 11:246, R.S. 11:241, and R.S. 11:243. R.S. 11:1461 allows the Board of Trustees to
provide a cost of living increase from excess interest earnings to members who have been retired for at
least one full calendar year. The increase cannot exceed the lesser of: 3% of the retiree’s original
-38-
G. S. Curran & Company, Ltd.
benefit or an increase of $300 per year for each year of retirement. R.S. 11:246 provides cost of living
increases to retirees and beneficiaries over the age of 65 equal to 2% of the benefit in payment on
October 1, 1977, or the date the benefit was originally received if retirement commenced after that
date. R.S. 11:241 provides for cost of living benefits payable based on a formula equal to up to $1
times the total of the number of years of credited service accrued at retirement or at death of the
member or retiree plus the number of years since retirement or since death of the member or retiree to
the system’s fiscal year end preceding the payment of the benefit increase. The provisions of R.S.
11:241 do not repeal provisions relative to cost of living adjustments contained within the individual
laws governing systems; however, they are to be controlling in cases of conflict. In addition, Act 113
of the 2008 Regular Legislation Session provides for a COLA of 3% of the normal monthly benefit but
not less than $20 per month. Although this COLA is permanent, it may only be granted once.
In order to grant a COLA, the system must meet the funded ratio criteria specified in R.S. 11:243. For
purposes of COLAs payable under R.S. 11:1461(A), R.S. 11:246, or R.S. 11:241, the system must
have investment earnings in excess of the valuation interest rate sufficient to offset the additional
liability due to the cost of the COLA or fund the COLA out of the Funding Deposit Account.
The limitations on timing of COLAs given in R.S. 11:243 are as follows:
1. The system has a funded ratio of 90% or more and has not granted a benefit increase to
retirees, survivors, and beneficiaries in the most recent fiscal year.
2. The system has a funded ratio of 80% or more and has not granted a benefit increase to
retirees, survivors, and beneficiaries in the two most recent fiscal years.
3. The system has a funded ratio of 70% or more and has not granted a benefit increase to
retirees, survivors, and beneficiaries in the three most recent fiscal years.
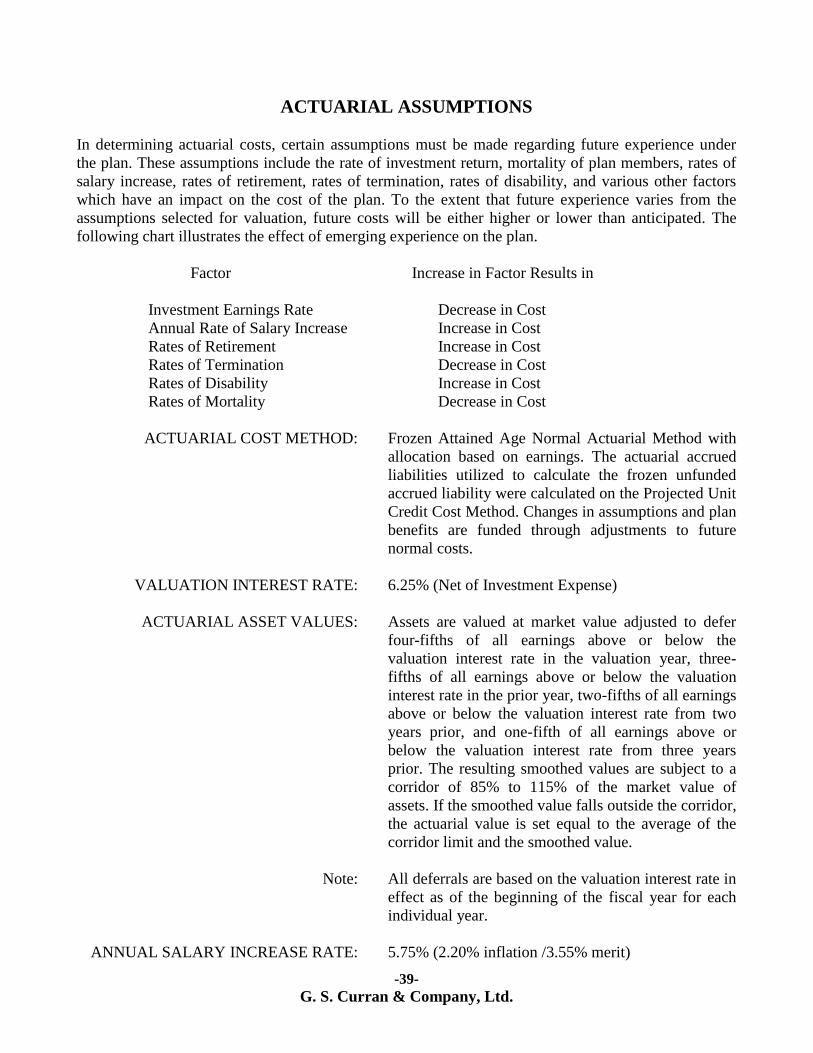
-39-
G. S. Curran & Company, Ltd.
ACTUARIAL ASSUMPTIONS
In determining actuarial costs, certain assumptions must be made regarding future experience under
the plan. These assumptions include the rate of investment return, mortality of plan members, rates of
salary increase, rates of retirement, rates of termination, rates of disability, and various other factors
which have an impact on the cost of the plan. To the extent that future experience varies from the
assumptions selected for valuation, future costs will be either higher or lower than anticipated. The
following chart illustrates the effect of emerging experience on the plan.
Factor Increase in Factor Results in
Investment Earnings Rate Decrease in Cost
Annual Rate of Salary Increase Increase in Cost
Rates of Retirement Increase in Cost
Rates of Termination Decrease in Cost
Rates of Disability Increase in Cost
Rates of Mortality Decrease in Cost
ACTUARIAL COST METHOD: Frozen Attained Age Normal Actuarial Method with
allocation based on earnings. The actuarial accrued
liabilities utilized to calculate the frozen unfunded
accrued liability were calculated on the Projected Unit
Credit Cost Method. Changes in assumptions and plan
benefits are funded through adjustments to future
normal costs.
VALUATION INTEREST RATE: 6.25% (Net of Investment Expense)
ACTUARIAL ASSET VALUES: Assets are valued at market value adjusted to defer
four-fifths of all earnings above or below the
valuation interest rate in the valuation year, three-
fifths of all earnings above or below the valuation
interest rate in the prior year, two-fifths of all earnings
above or below the valuation interest rate from two
years prior, and one-fifth of all earnings above or
below the valuation interest rate from three years
prior. The resulting smoothed values are subject to a
corridor of 85% to 115% of the market value of
assets. If the smoothed value falls outside the corridor,
the actuarial value is set equal to the average of the
corridor limit and the smoothed value.
Note: All deferrals are based on the valuation interest rate in
effect as of the beginning of the fiscal year for each
individual year.
ANNUAL SALARY INCREASE RATE: 5.75% (2.20% inflation /3.55% merit)
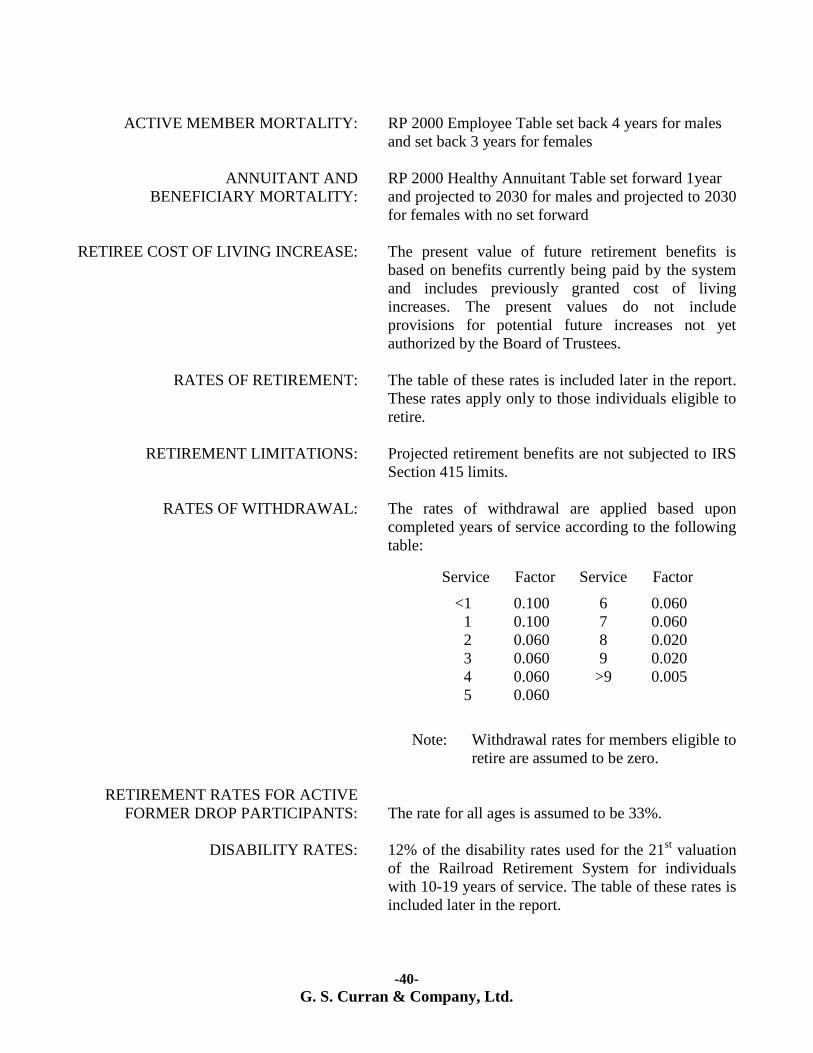
-40-
G. S. Curran & Company, Ltd.
ACTIVE MEMBER MORTALITY: RP 2000 Employee Table set back 4 years for males
and set back 3 years for females
ANNUITANT AND RP 2000 Healthy Annuitant Table set forward 1year
BENEFICIARY MORTALITY: and projected to 2030 for males and projected to 2030
for females with no set forward
RETIREE COST OF LIVING INCREASE: The present value of future retirement benefits is
based on benefits currently being paid by the system
and includes previously granted cost of living
increases. The present values do not include
provisions for potential future increases not yet
authorized by the Board of Trustees.
RATES OF RETIREMENT: The table of these rates is included later in the report.
These rates apply only to those individuals eligible to
retire.
RETIREMENT LIMITATIONS: Projected retirement benefits are not subjected to IRS
Section 415 limits.
RATES OF WITHDRAWAL: The rates of withdrawal are applied based upon
completed years of service according to the following
table: Service Factor Service Factor <1 0.100 6 0.060
1 0.100 7 0.060
2 0.060 8 0.020
3 0.060 9 0.020
4 0.060 >9 0.005
5 0.060
Note: Withdrawal rates for members eligible to
retire are assumed to be zero.
RETIREMENT RATES FOR ACTIVE
FORMER DROP PARTICIPANTS: The rate for all ages is assumed to be 33%.
DISABILITY RATES: 12% of the disability rates used for the 21st valuation
of the Railroad Retirement System for individuals
with 10-19 years of service. The table of these rates is
included later in the report.
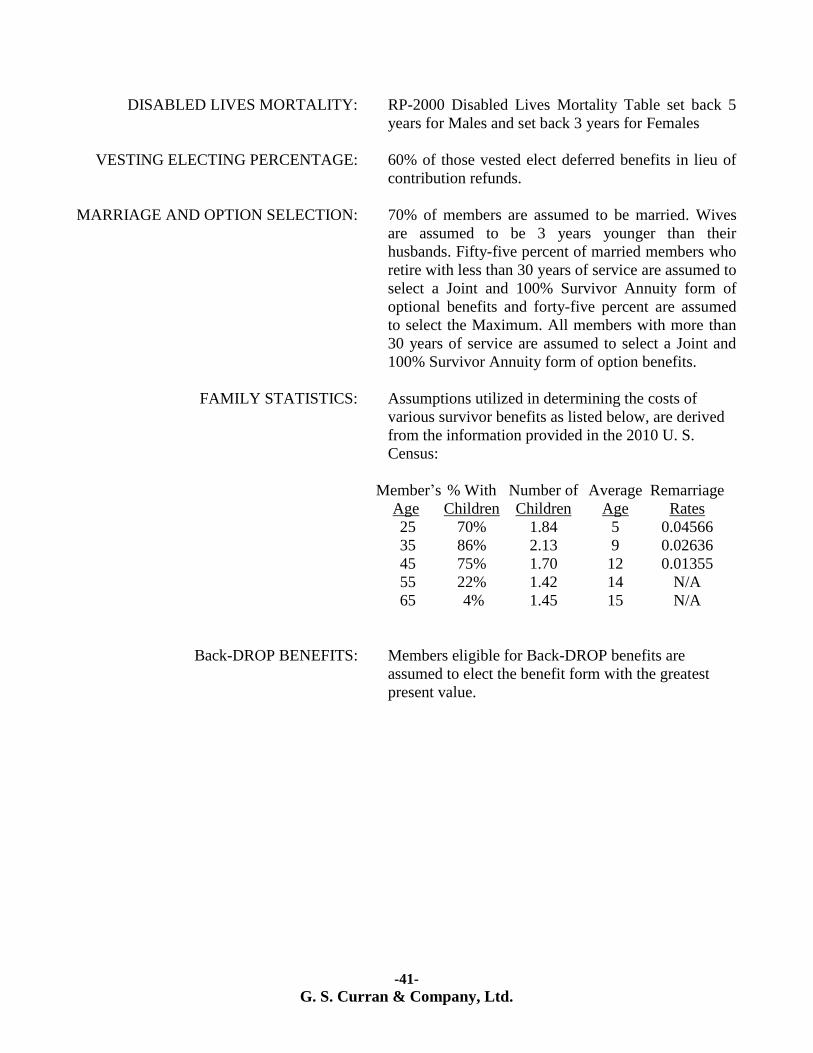
-41-
G. S. Curran & Company, Ltd.
DISABLED LIVES MORTALITY: RP-2000 Disabled Lives Mortality Table set back 5
years for Males and set back 3 years for Females
VESTING ELECTING PERCENTAGE: 60% of those vested elect deferred benefits in lieu of
contribution refunds.
MARRIAGE AND OPTION SELECTION: 70% of members are assumed to be married. Wives
are assumed to be 3 years younger than their
husbands. Fifty-five percent of married members who
retire with less than 30 years of service are assumed to
select a Joint and 100% Survivor Annuity form of
optional benefits and forty-five percent are assumed
to select the Maximum. All members with more than
30 years of service are assumed to select a Joint and
100% Survivor Annuity form of option benefits.
FAMILY STATISTICS: Assumptions utilized in determining the costs of
various survivor benefits as listed below, are derived
from the information provided in the 2010 U. S.
Census:
Member’s % With Number of Average Remarriage
Age Children Children Age Rates
25 70% 1.84 5 0.04566
35 86% 2.13 9 0.02636
45 75% 1.70 12 0.01355
55 22% 1.42 14 N/A
65 4% 1.45 15 N/A
Back-DROP BENEFITS: Members eligible for Back-DROP benefits are
assumed to elect the benefit form with the greatest
present value.
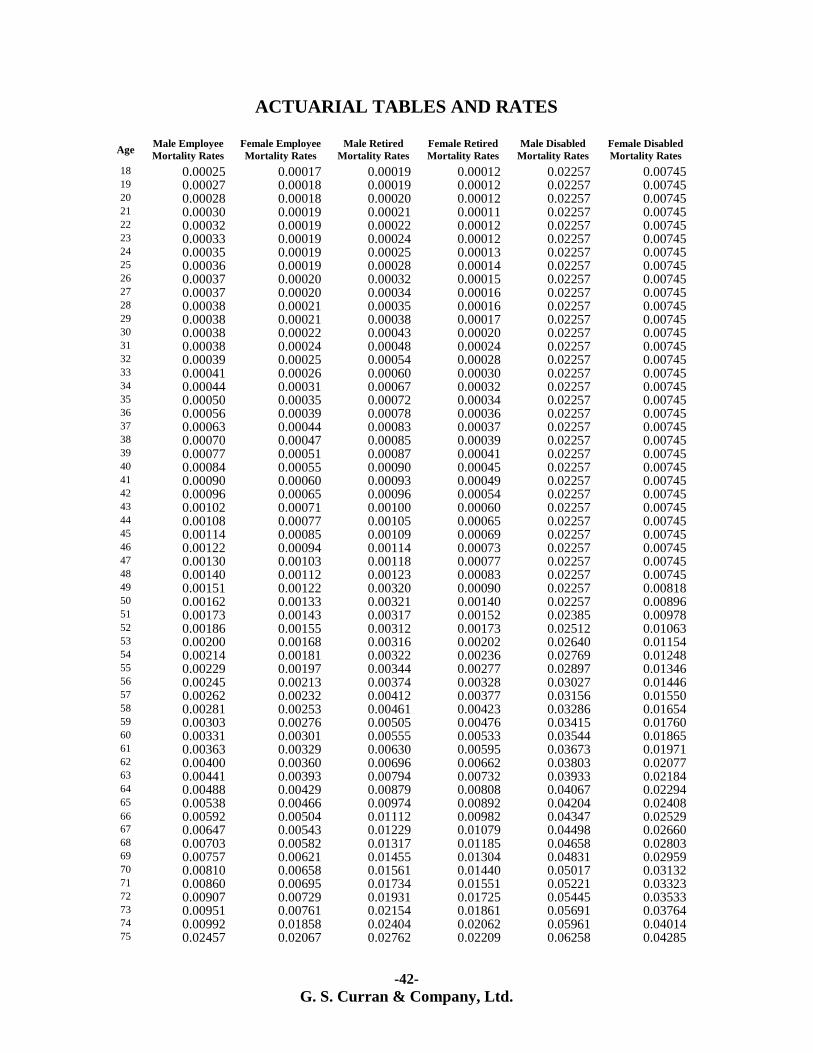
-42-
G. S. Curran & Company, Ltd.
ACTUARIAL TABLES AND RATES
Age Male Employee
Mortality Rates
Female Employee
Mortality Rates
Male Retired
Mortality Rates
Female Retired
Mortality Rates
Male Disabled
Mortality Rates
Female Disabled
Mortality Rates
18 0.00025 0.00017 0.00019 0.00012 0.02257 0.00745 19 0.00027 0.00018 0.00019 0.00012 0.02257 0.00745 20 0.00028 0.00018 0.00020 0.00012 0.02257 0.00745 21 0.00030 0.00019 0.00021 0.00011 0.02257 0.00745 22 0.00032 0.00019 0.00022 0.00012 0.02257 0.00745 23 0.00033 0.00019 0.00024 0.00012 0.02257 0.00745 24 0.00035 0.00019 0.00025 0.00013 0.02257 0.00745 25 0.00036 0.00019 0.00028 0.00014 0.02257 0.00745 26 0.00037 0.00020 0.00032 0.00015 0.02257 0.00745 27 0.00037 0.00020 0.00034 0.00016 0.02257 0.00745 28 0.00038 0.00021 0.00035 0.00016 0.02257 0.00745 29 0.00038 0.00021 0.00038 0.00017 0.02257 0.00745 30 0.00038 0.00022 0.00043 0.00020 0.02257 0.00745 31 0.00038 0.00024 0.00048 0.00024 0.02257 0.00745 32 0.00039 0.00025 0.00054 0.00028 0.02257 0.00745 33 0.00041 0.00026 0.00060 0.00030 0.02257 0.00745 34 0.00044 0.00031 0.00067 0.00032 0.02257 0.00745 35 0.00050 0.00035 0.00072 0.00034 0.02257 0.00745 36 0.00056 0.00039 0.00078 0.00036 0.02257 0.00745 37 0.00063 0.00044 0.00083 0.00037 0.02257 0.00745 38 0.00070 0.00047 0.00085 0.00039 0.02257 0.00745 39 0.00077 0.00051 0.00087 0.00041 0.02257 0.00745 40 0.00084 0.00055 0.00090 0.00045 0.02257 0.00745 41 0.00090 0.00060 0.00093 0.00049 0.02257 0.00745 42 0.00096 0.00065 0.00096 0.00054 0.02257 0.00745 43 0.00102 0.00071 0.00100 0.00060 0.02257 0.00745 44 0.00108 0.00077 0.00105 0.00065 0.02257 0.00745 45 0.00114 0.00085 0.00109 0.00069 0.02257 0.00745 46 0.00122 0.00094 0.00114 0.00073 0.02257 0.00745 47 0.00130 0.00103 0.00118 0.00077 0.02257 0.00745 48 0.00140 0.00112 0.00123 0.00083 0.02257 0.00745 49 0.00151 0.00122 0.00320 0.00090 0.02257 0.00818 50 0.00162 0.00133 0.00321 0.00140 0.02257 0.00896 51 0.00173 0.00143 0.00317 0.00152 0.02385 0.00978 52 0.00186 0.00155 0.00312 0.00173 0.02512 0.01063 53 0.00200 0.00168 0.00316 0.00202 0.02640 0.01154 54 0.00214 0.00181 0.00322 0.00236 0.02769 0.01248 55 0.00229 0.00197 0.00344 0.00277 0.02897 0.01346 56 0.00245 0.00213 0.00374 0.00328 0.03027 0.01446 57 0.00262 0.00232 0.00412 0.00377 0.03156 0.01550 58 0.00281 0.00253 0.00461 0.00423 0.03286 0.01654 59 0.00303 0.00276 0.00505 0.00476 0.03415 0.01760 60 0.00331 0.00301 0.00555 0.00533 0.03544 0.01865 61 0.00363 0.00329 0.00630 0.00595 0.03673 0.01971 62 0.00400 0.00360 0.00696 0.00662 0.03803 0.02077 63 0.00441 0.00393 0.00794 0.00732 0.03933 0.02184 64 0.00488 0.00429 0.00879 0.00808 0.04067 0.02294 65 0.00538 0.00466 0.00974 0.00892 0.04204 0.02408 66 0.00592 0.00504 0.01112 0.00982 0.04347 0.02529 67 0.00647 0.00543 0.01229 0.01079 0.04498 0.02660 68 0.00703 0.00582 0.01317 0.01185 0.04658 0.02803 69 0.00757 0.00621 0.01455 0.01304 0.04831 0.02959 70 0.00810 0.00658 0.01561 0.01440 0.05017 0.03132 71 0.00860 0.00695 0.01734 0.01551 0.05221 0.03323 72 0.00907 0.00729 0.01931 0.01725 0.05445 0.03533 73 0.00951 0.00761 0.02154 0.01861 0.05691 0.03764 74 0.00992 0.01858 0.02404 0.02062 0.05961 0.04014 75 0.02457 0.02067 0.02762 0.02209 0.06258 0.04285
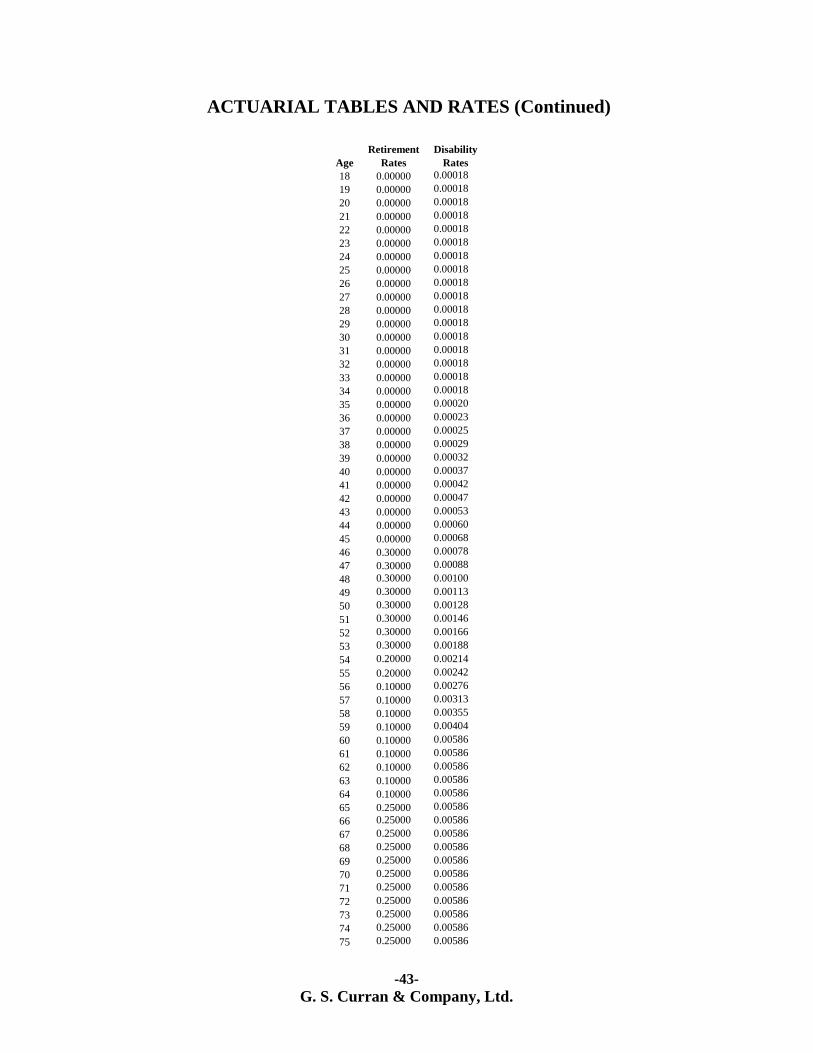
-43-
G. S. Curran & Company, Ltd.
ACTUARIAL TABLES AND RATES (Continued)
Retirement Disability
Age Rates Rates
18 0.00000 0.00018
19 0.00000 0.00018
20 0.00000 0.00018
21 0.00000 0.00018
22 0.00000 0.00018
23 0.00000 0.00018
24 0.00000 0.00018
25 0.00000 0.00018
26 0.00000 0.00018
27 0.00000 0.00018
28 0.00000 0.00018
29 0.00000 0.00018
30 0.00000 0.00018
31 0.00000 0.00018
32 0.00000 0.00018
33 0.00000 0.00018
34 0.00000 0.00018
35 0.00000 0.00020
36 0.00000 0.00023
37 0.00000 0.00025
38 0.00000 0.00029
39 0.00000 0.00032
40 0.00000 0.00037
41 0.00000 0.00042
42 0.00000 0.00047
43 0.00000 0.00053
44 0.00000 0.00060
45 0.00000 0.00068
46 0.30000 0.00078
47 0.30000 0.00088
48 0.30000 0.00100
49 0.30000 0.00113
50 0.30000 0.00128
51 0.30000 0.00146
52 0.30000 0.00166
53 0.30000 0.00188
54 0.20000 0.00214
55 0.20000 0.00242
56 0.10000 0.00276
57 0.10000 0.00313
58 0.10000 0.00355
59 0.10000 0.00404
60 0.10000 0.00586
61 0.10000 0.00586
62 0.10000 0.00586
63 0.10000 0.00586
64 0.10000 0.00586
65 0.25000 0.00586
66 0.25000 0.00586
67 0.25000 0.00586
68 0.25000 0.00586
69 0.25000 0.00586
70 0.25000 0.00586
71 0.25000 0.00586
72 0.25000 0.00586
73 0.25000 0.00586
74 0.25000 0.00586
75 0.25000 0.00586
-44-
G. S. Curran & Company, Ltd.
PRIOR YEAR ASSUMPTIONS
VALUATION INTEREST RATE: 6.75% (Net of investment expense)
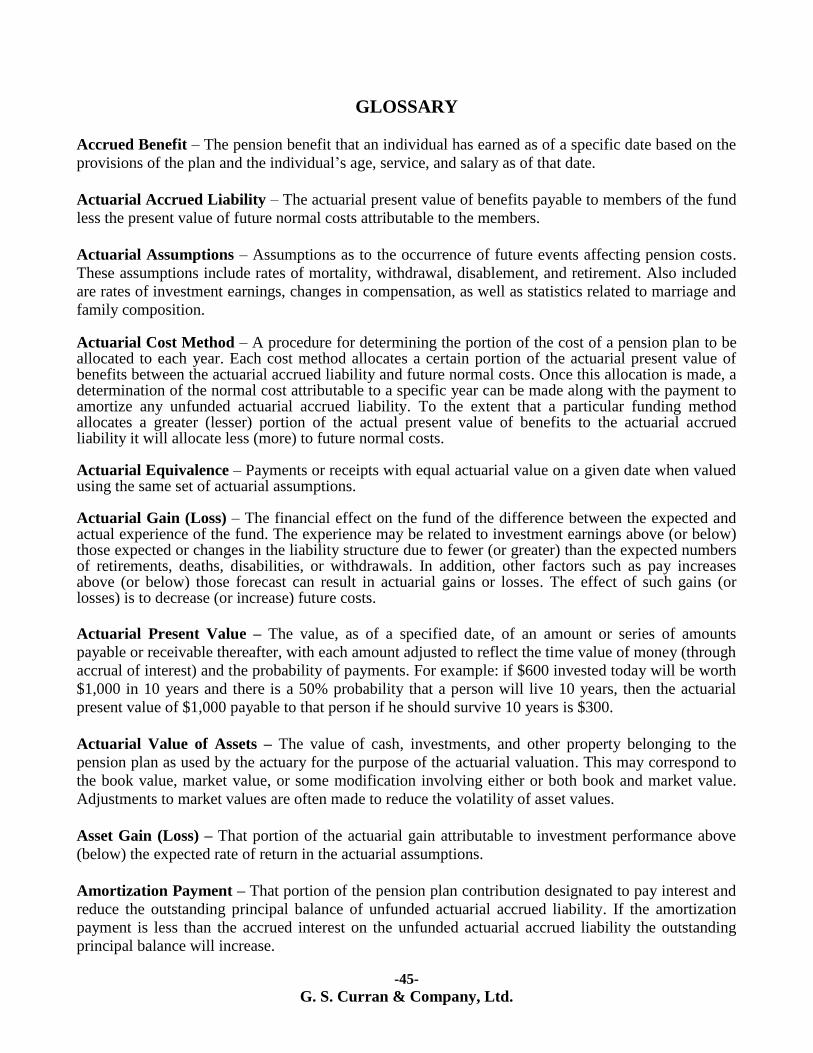
-45-
G. S. Curran & Company, Ltd.
GLOSSARY
Accrued Benefit – The pension benefit that an individual has earned as of a specific date based on the
provisions of the plan and the individual’s age, service, and salary as of that date.
Actuarial Accrued Liability – The actuarial present value of benefits payable to members of the fund
less the present value of future normal costs attributable to the members.
Actuarial Assumptions – Assumptions as to the occurrence of future events affecting pension costs.
These assumptions include rates of mortality, withdrawal, disablement, and retirement. Also included
are rates of investment earnings, changes in compensation, as well as statistics related to marriage and
family composition. Actuarial Cost Method – A procedure for determining the portion of the cost of a pension plan to be allocated to each year. Each cost method allocates a certain portion of the actuarial present value of benefits between the actuarial accrued liability and future normal costs. Once this allocation is made, a determination of the normal cost attributable to a specific year can be made along with the payment to amortize any unfunded actuarial accrued liability. To the extent that a particular funding method allocates a greater (lesser) portion of the actual present value of benefits to the actuarial accrued liability it will allocate less (more) to future normal costs. Actuarial Equivalence – Payments or receipts with equal actuarial value on a given date when valued using the same set of actuarial assumptions. Actuarial Gain (Loss) – The financial effect on the fund of the difference between the expected and actual experience of the fund. The experience may be related to investment earnings above (or below) those expected or changes in the liability structure due to fewer (or greater) than the expected numbers of retirements, deaths, disabilities, or withdrawals. In addition, other factors such as pay increases above (or below) those forecast can result in actuarial gains or losses. The effect of such gains (or losses) is to decrease (or increase) future costs.
Actuarial Present Value – The value, as of a specified date, of an amount or series of amounts
payable or receivable thereafter, with each amount adjusted to reflect the time value of money (through
accrual of interest) and the probability of payments. For example: if $600 invested today will be worth
$1,000 in 10 years and there is a 50% probability that a person will live 10 years, then the actuarial
present value of $1,000 payable to that person if he should survive 10 years is $300.
Actuarial Value of Assets – The value of cash, investments, and other property belonging to the
pension plan as used by the actuary for the purpose of the actuarial valuation. This may correspond to
the book value, market value, or some modification involving either or both book and market value.
Adjustments to market values are often made to reduce the volatility of asset values.
Asset Gain (Loss) – That portion of the actuarial gain attributable to investment performance above
(below) the expected rate of return in the actuarial assumptions.
Amortization Payment – That portion of the pension plan contribution designated to pay interest and
reduce the outstanding principal balance of unfunded actuarial accrued liability. If the amortization
payment is less than the accrued interest on the unfunded actuarial accrued liability the outstanding
principal balance will increase.
-46-
G. S. Curran & Company, Ltd.
Contribution Shortfall (Excess) – The difference between contributions recommended in the prior
valuation and the actual amount received.
Decrements – Events which result in the termination of membership in the system such as retirement,
disability, withdrawal, or death.
Employer Normal Cost – That portion of the normal cost not attributable to employee contributions.
It includes both direct contributions made by the employer and contributions from other non-employee
sources such as revenue sharing and revenues related to taxes.
Funded Ratio – A measure of the ratio of assets to liabilities of the system according to a specific
definition of those two values. Typically the assets used in the measure are the actuarial value of
assets; the liabilities are defined by reference to some recognized actuarial funding method. Thus the
funded ratio of a plan depends not only on the financial strength of the plan but also on the funding
method used to determine the liabilities and the asset valuation method used to determine the assets in
the ratio.
Normal Cost – That portion of the actuarial present value of pension plan benefits and expenses
allocated to a valuation year by the actuarial cost method. This is analogous to one year’s insurance
premium.
Pension Benefit Obligation – The actuarial present value of benefits earned or credited to date based
on the members expected final average compensation at retirement. For current retirees or terminated
members this is equivalent to the actuarial present value of their accrued benefit.
Projected Benefits – The benefits expected to be paid in the future based on the provisions of the plan
and the actuarial assumptions. The projected values are based on anticipated future advancement in
age and accrual of service as well as increases in salary paid to the participant.
Unfunded Actuarial Accrued Liability – The excess of the actuarial accrued liability over the
actuarial value of assets.
Vested Benefits – Benefits that the members are entitled to even if they withdraw from service.