asset allocation and portfolio construction chapter 38 tools & techniques of investment planning...
TRANSCRIPT
Asset Allocation and Portfolio Construction
Chapter 38Tools & Techniques of
Investment Planning
Copyright 2007, The National Underwriter Company 1
• Asset allocation involves selecting the proportions of various types of assets to include in a portfolio. – In designing an overall asset allocation strategy, the advisor
must consider which asset classes to include for a particular client.
• Proper asset allocation improves a portfolio’s risk-adjusted return.
• The asset allocation decision is a prelude to selecting individual securities or funds for portfolio inclusion.
What is it?
Asset Allocation and Portfolio Construction
Chapter 38Tools & Techniques of
Investment Planning
Copyright 2007, The National Underwriter Company 2
Asset Allocation
• The relationship of return and risk is an important investment planning concept. – Generally, riskier investments must offer a higher potential
return to compensate for the added risk.
• Combining two or more risky assets can actually reduce the risk of the overall portfolio, as long as they are not highly correlated.– Highly correlated assets tend to move in the same direction and
at a similar magnitude, while assets that are not highly correlated do not.
• Investors can use non-highly correlated assets to build portfolios with more favorable risk/return relationships.
Asset Allocation and Portfolio Construction
Chapter 38Tools & Techniques of
Investment Planning
Copyright 2007, The National Underwriter Company 3
Example
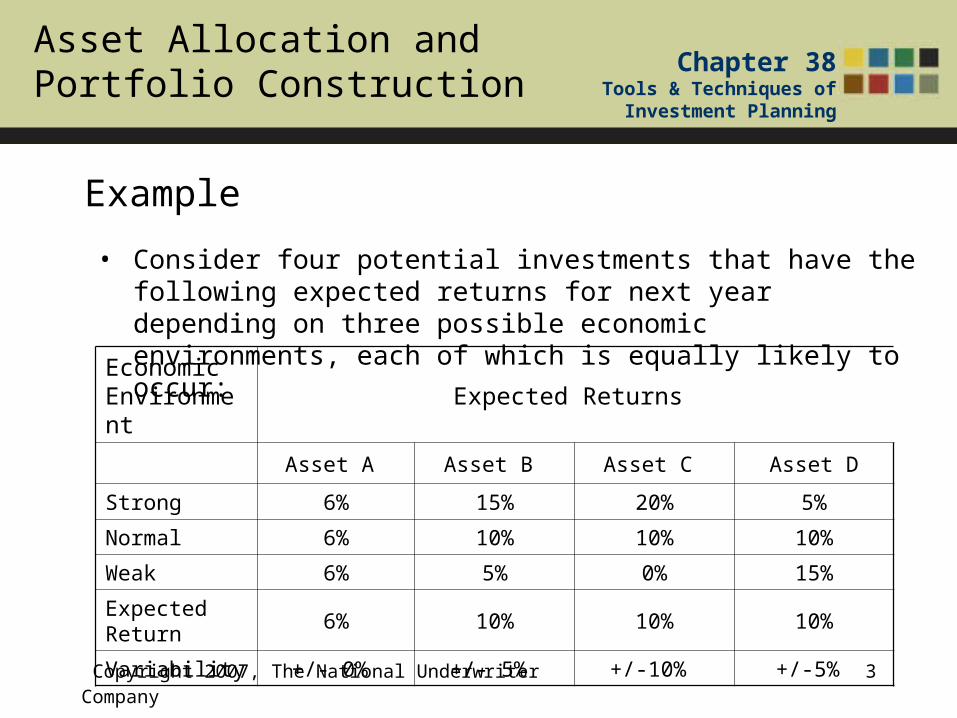
• Consider four potential investments that have the following expected returns for next year depending on three possible economic environments, each of which is equally likely to occur:
Economic Environment
Expected Returns
Asset A Asset B Asset C Asset D
Strong 6% 15% 20% 5%
Normal 6% 10% 10% 10%
Weak 6% 5% 0% 15%
Expected Return
6% 10% 10% 10%
Variability +/- 0% +/- 5% +/-10% +/-5%
Asset Allocation and Portfolio Construction
Chapter 38Tools & Techniques of
Investment Planning
Copyright 2007, The National Underwriter Company 4
Example
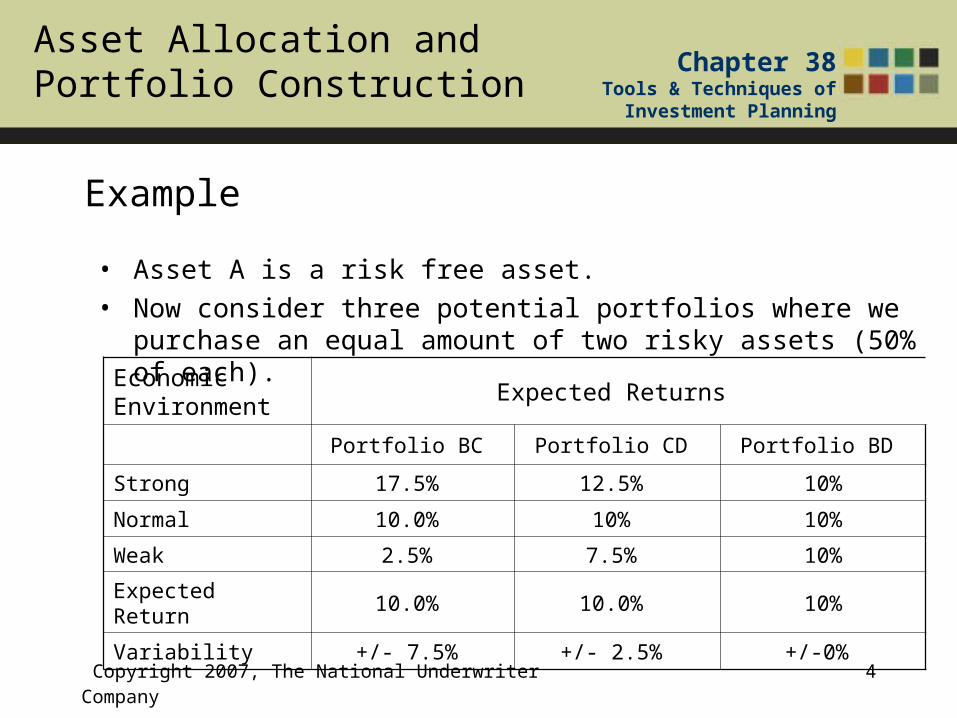
• Asset A is a risk free asset. • Now consider three potential portfolios where we purchase an
equal amount of two risky assets (50% of each).Economic Environment
Expected Returns
Portfolio BC Portfolio CD Portfolio BD
Strong 17.5% 12.5% 10%
Normal 10.0% 10% 10%
Weak 2.5% 7.5% 10%
Expected Return 10.0% 10.0% 10%
Variability +/- 7.5% +/- 2.5% +/-0%
Asset Allocation and Portfolio Construction
Chapter 38Tools & Techniques of
Investment Planning
Copyright 2007, The National Underwriter Company 5
Example
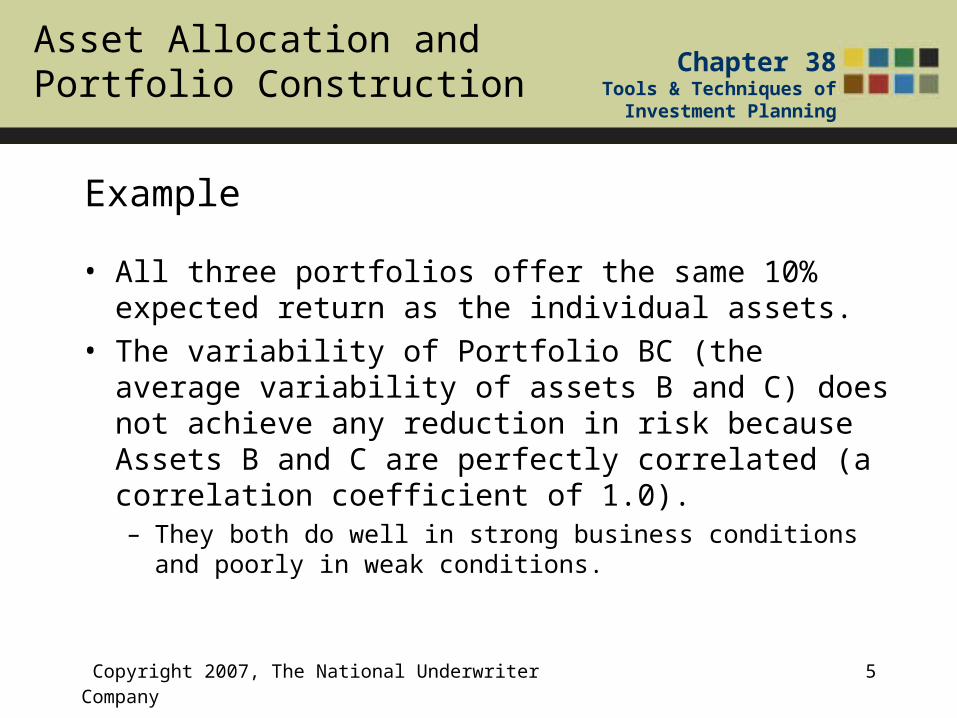
• All three portfolios offer the same 10% expected return as the individual assets.
• The variability of Portfolio BC (the average variability of assets B and C) does not achieve any reduction in risk because Assets B and C are perfectly correlated (a correlation coefficient of 1.0). – They both do well in strong business conditions and poorly in
weak conditions.
Asset Allocation and Portfolio Construction
Chapter 38Tools & Techniques of
Investment Planning
Copyright 2007, The National Underwriter Company 6
Example
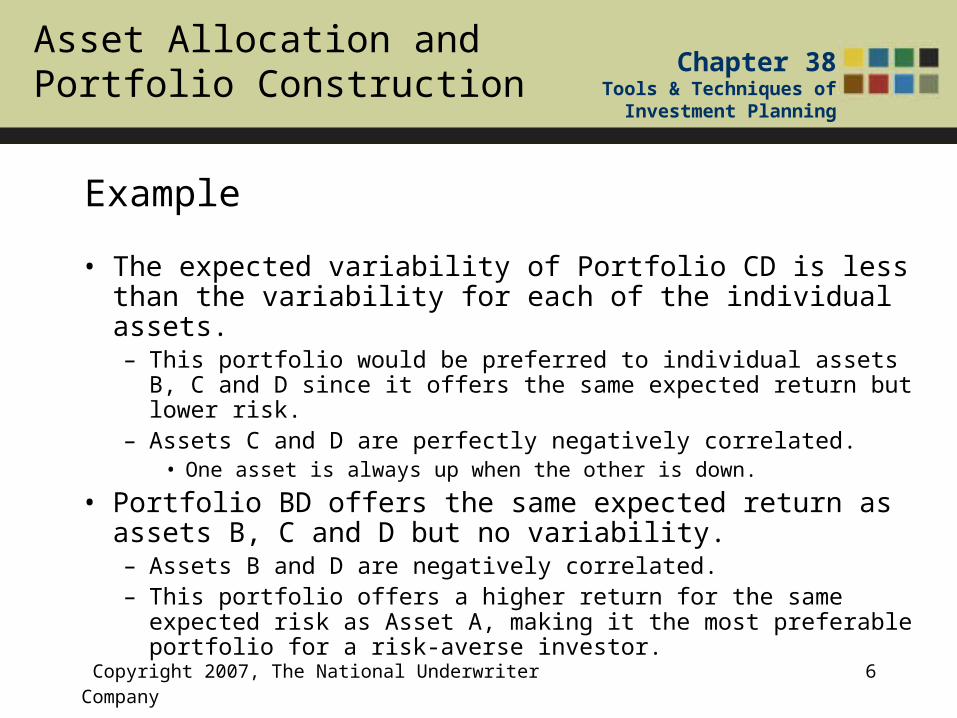
• The expected variability of Portfolio CD is less than the variability for each of the individual assets. – This portfolio would be preferred to individual assets B, C and D
since it offers the same expected return but lower risk. – Assets C and D are perfectly negatively correlated.
• One asset is always up when the other is down.
• Portfolio BD offers the same expected return as assets B, C and D but no variability. – Assets B and D are negatively correlated.– This portfolio offers a higher return for the same expected risk
as Asset A, making it the most preferable portfolio for a risk-averse investor.
Asset Allocation and Portfolio Construction
Chapter 38Tools & Techniques of
Investment Planning
Copyright 2007, The National Underwriter Company 7
Asset Allocation
• By combining assets that are not highly correlated together in portfolios, the investor can achieve a more favorable risk/return relationship. – It is not necessary for assets to be negatively correlated to
achieve this benefit. – Small positive correlations (assets that occasionally, but not
always, move in the same direction) also reduce risk.
Asset Allocation and Portfolio Construction
Chapter 38Tools & Techniques of
Investment Planning
Copyright 2007, The National Underwriter Company 8
Modern Portfolio Theory and Asset Allocation
• A fundamental principal of modern portfolio theory (MPT) is the ability to reduce risk for a given level of return.
• Properly constructed portfolios of assets that are not highly correlated achieve the highest possible return for a given level of risk.
• MPT measures risk as standard deviation of returns.
Asset Allocation and Portfolio Construction
Chapter 38Tools & Techniques of
Investment Planning
Copyright 2007, The National Underwriter Company 9
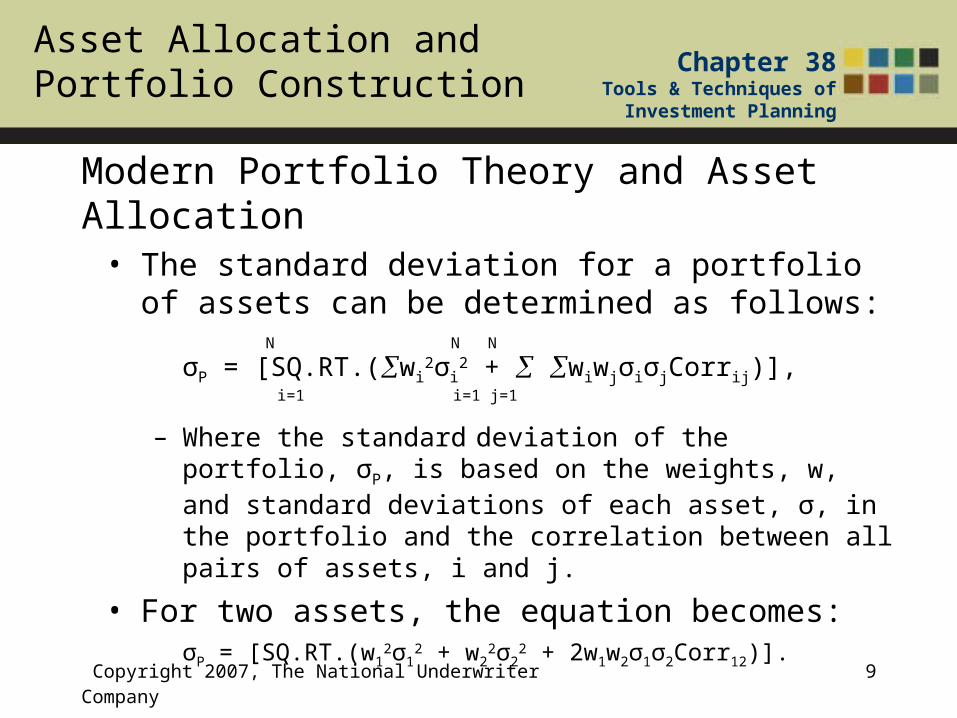
Modern Portfolio Theory and Asset Allocation
• The standard deviation for a portfolio of assets can be determined as follows:
N N N
σP = [SQ.RT.(wi2σi
2 + wiwjσiσjCorrij)], i=1 i=1 j=1
– Where the standard deviation of the portfolio, σP, is based on the weights, w, and standard deviations of each asset, σ, in the portfolio and the correlation between all pairs of assets, i and j.
• For two assets, the equation becomes: σP = [SQ.RT.(w1
2σ12 + w2
2σ22 + 2w1w2σ1σ2Corr12)].
Asset Allocation and Portfolio Construction
Chapter 38Tools & Techniques of
Investment Planning
Copyright 2007, The National Underwriter Company 10
Example
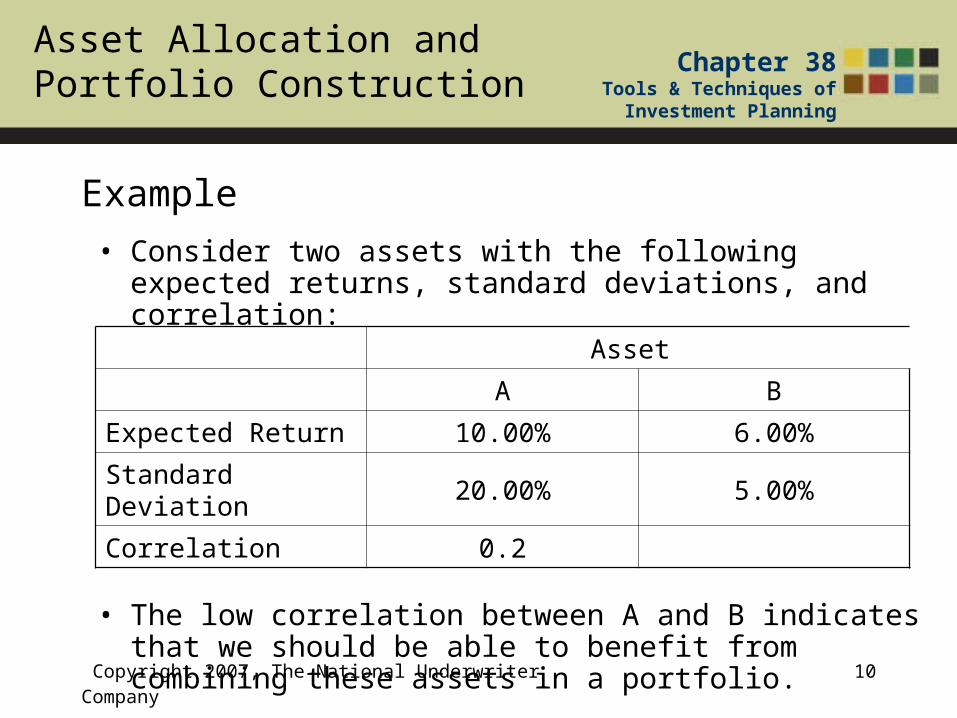
• Consider two assets with the following expected returns, standard deviations, and correlation:
• The low correlation between A and B indicates that we should be able to benefit from combining these assets in a portfolio.
Asset
A B
Expected Return 10.00% 6.00%
Standard Deviation 20.00% 5.00%
Correlation 0.2
Asset Allocation and Portfolio Construction
Chapter 38Tools & Techniques of
Investment Planning
Copyright 2007, The National Underwriter Company 11
Example
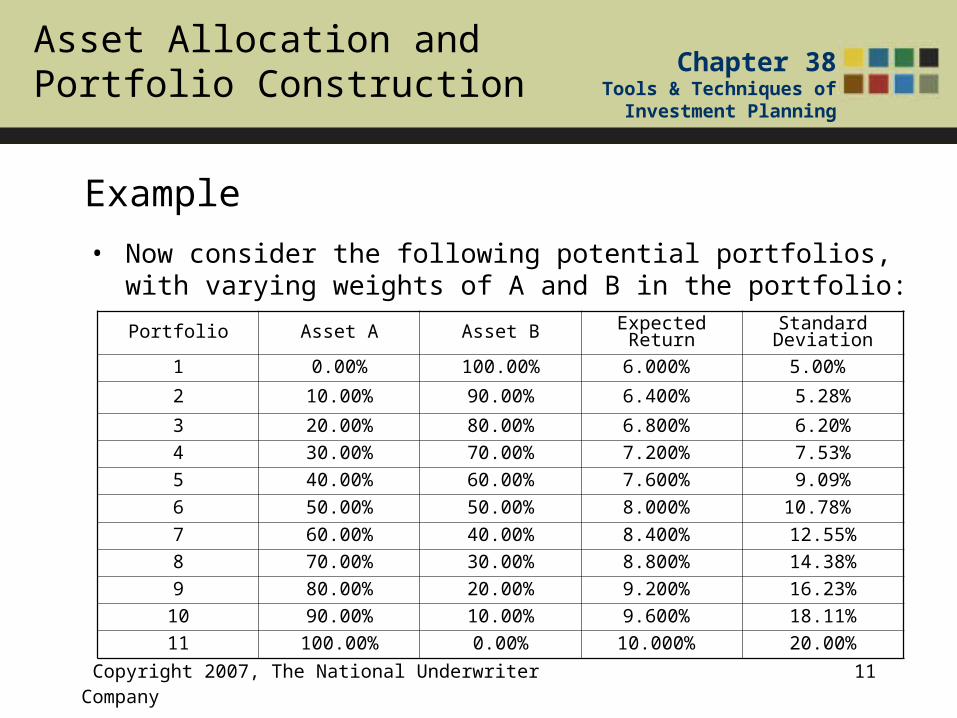
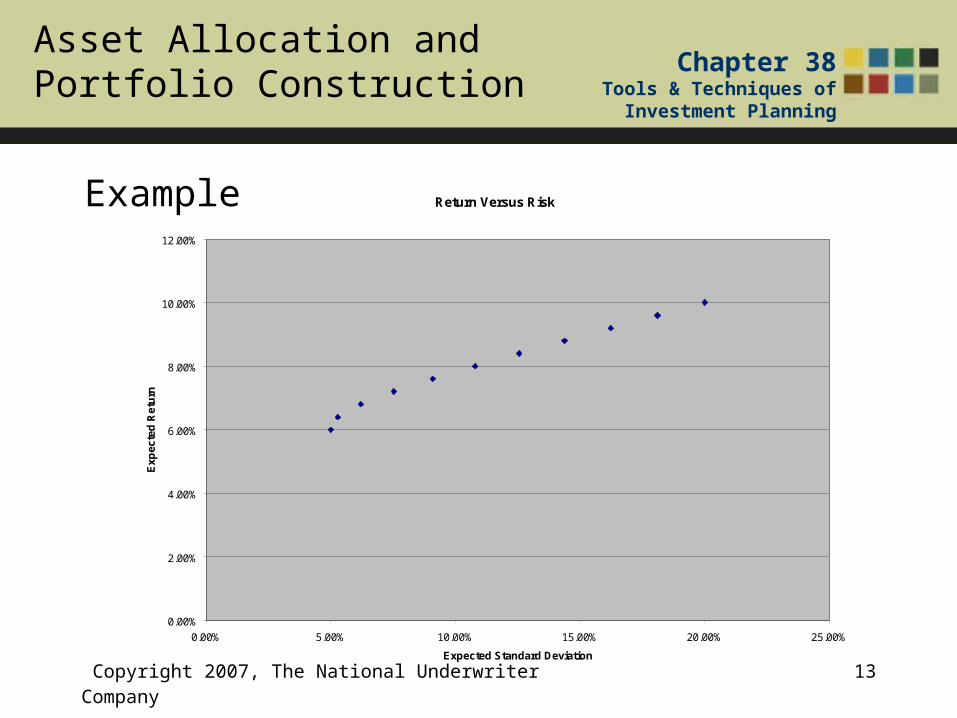
• Now consider the following potential portfolios, with varying weights of A and B in the portfolio:
Portfolio Asset A Asset B Expected Return Standard Deviation
1 0.00% 100.00% 6.000% 5.00%
2 10.00% 90.00% 6.400% 5.28%
3 20.00% 80.00% 6.800% 6.20%
4 30.00% 70.00% 7.200% 7.53%
5 40.00% 60.00% 7.600% 9.09%
6 50.00% 50.00% 8.000% 10.78%
7 60.00% 40.00% 8.400% 12.55%
8 70.00% 30.00% 8.800% 14.38%
9 80.00% 20.00% 9.200% 16.23%
10 90.00% 10.00% 9.600% 18.11%
11 100.00% 0.00% 10.000% 20.00%
Asset Allocation and Portfolio Construction
Chapter 38Tools & Techniques of
Investment Planning
Copyright 2007, The National Underwriter Company 12
Example
• The expected return is always the weighted average return of the underlying assets.
• The standard deviation of each portfolio is based upon the standard deviation formula for the two-asset portfolio above.
• For a risk adverse investor, note that relative to portfolio 1, portfolio 2 offers a 6.7% higher return but has only a 5% increase in standard deviation.– The return/risk ratio is 1.20 for portfolio 1 and 1.212 for portfolio 2.
– Portfolio 2 offers a greater return relative to risk compared to portfolio 1.
• The relationship between risk and return for these portfolios can be graphed.
Asset Allocation and Portfolio Construction
Chapter 38Tools & Techniques of
Investment Planning
Copyright 2007, The National Underwriter Company 13
Example Return Versus Risk
0.00%
2.00%
4.00%
6.00%
8.00%
10.00%
12.00%
0.00% 5.00% 10.00% 15.00% 20.00% 25.00%
Expected Standard Deviation
Ex
pe
cte
d R
etu
rn
Asset Allocation and Portfolio Construction
Chapter 38Tools & Techniques of
Investment Planning
Copyright 2007, The National Underwriter Company 14
Example
• An investor could choose the combination of assets A and B which provides them with their desired return while maintaining an acceptable level of risk.
• Portfolios of more than two assets make the math more complex, but the basic concepts are the same. – Adding assets with low or negative correlations to the rest of
the portfolio improves the return/risk relationship.
Asset Allocation and Portfolio Construction
Chapter 38Tools & Techniques of
Investment Planning
Copyright 2007, The National Underwriter Company 15
Modern Portfolio Theory and Asset Allocation
• Overall portfolio asset allocation decisions are made using the expected returns, standard deviation, and correlations between asset classes, rather than individual assets. – An asset class is a group of securities with similar characteristics.
• Broadly speaking, the major asset classes include stocks, bonds, real estate, cash, commodities, and international investments.
• Within each asset class, however, there can be various gradations that sometimes constitute their own asset class.
• Asset allocation strategies must also consider the appropriateness of each asset class for the particular investor or account.
Asset Allocation and Portfolio Construction
Chapter 38Tools & Techniques of
Investment Planning
Copyright 2007, The National Underwriter Company 16
• The advisor should attempt to generate an efficient frontier of potential portfolios.– This can be achieved using asset allocation software and
the expected returns, standard deviations, and correlations of the asset classes.
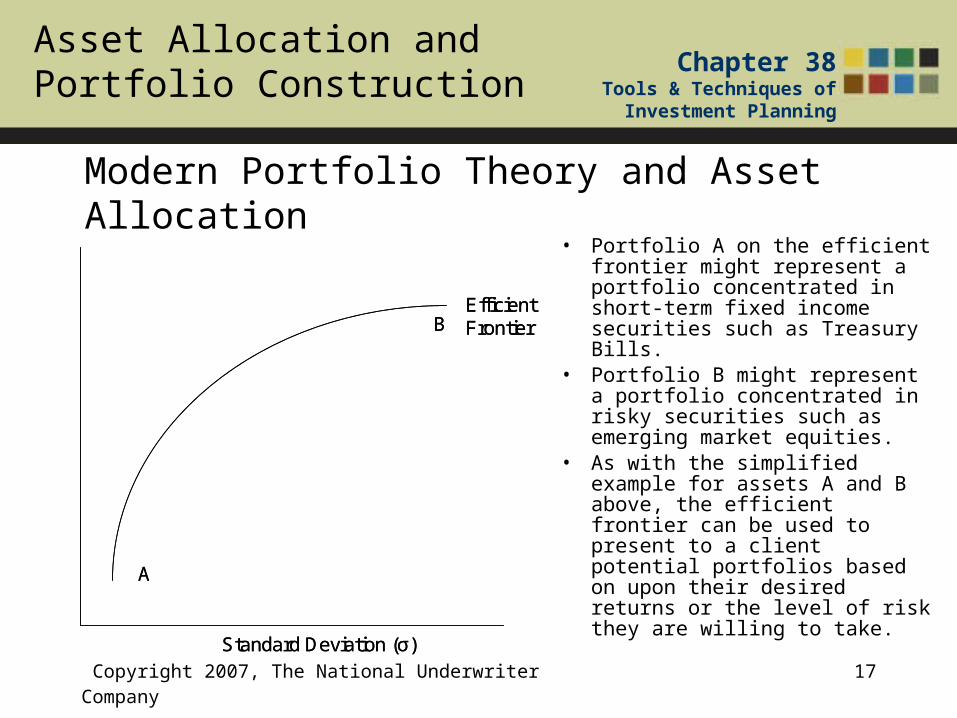
– The efficient frontier represents those portfolios with the highest expected return for a given level of expected risk
Modern Portfolio Theory and Asset Allocation
Asset Allocation and Portfolio Construction
Chapter 38Tools & Techniques of
Investment Planning
Copyright 2007, The National Underwriter Company 17
Modern Portfolio Theory and Asset Allocation• Portfolio A on the efficient
frontier might represent a portfolio concentrated in short-term fixed income securities such as Treasury Bills.
• Portfolio B might represent a portfolio concentrated in risky securities such as emerging market equities.
• As with the simplified example for assets A and B above, the efficient frontier can be used to present to a client potential portfolios based on upon their desired returns or the level of risk they are willing to take.
Standard Deviation (σ)
EfficientFrontier
A
B
Standard Deviation (σ)
EfficientFrontier
A
B
Asset Allocation and Portfolio Construction
Chapter 38Tools & Techniques of
Investment Planning
Copyright 2007, The National Underwriter Company 18
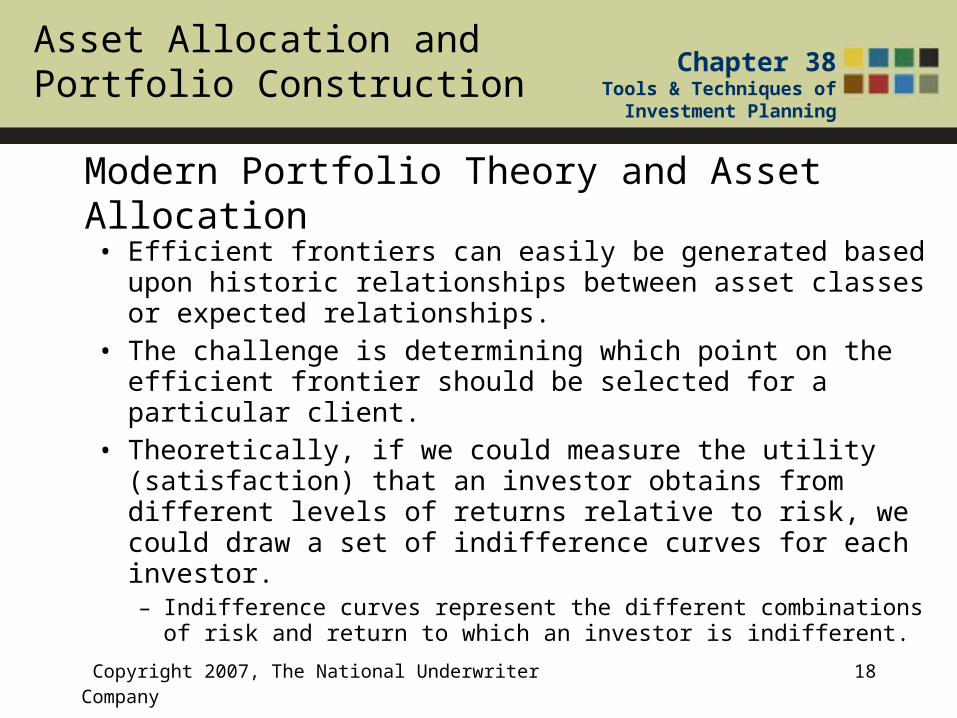
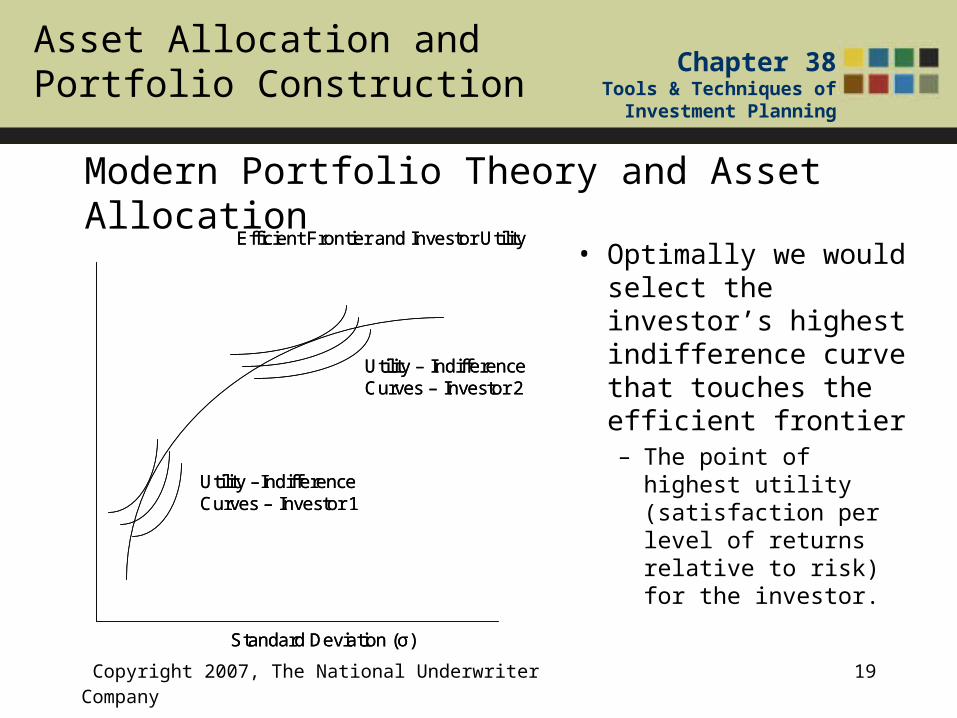
Modern Portfolio Theory and Asset Allocation
• Efficient frontiers can easily be generated based upon historic relationships between asset classes or expected relationships.
• The challenge is determining which point on the efficient frontier should be selected for a particular client.
• Theoretically, if we could measure the utility (satisfaction) that an investor obtains from different levels of returns relative to risk, we could draw a set of indifference curves for each investor. – Indifference curves represent the different combinations of risk
and return to which an investor is indifferent.
Asset Allocation and Portfolio Construction
Chapter 38Tools & Techniques of
Investment Planning
Copyright 2007, The National Underwriter Company 19
Modern Portfolio Theory and Asset Allocation
• Optimally we would select the investor’s highest indifference curve that touches the efficient frontier– The point of highest
utility (satisfaction per level of returns relative to risk) for the investor.
Standard Deviation (σ)
Utility –IndifferenceCurves – Investor 1
Utility – Indifference Curves – Investor 2
Efficient Frontier and Investor Utility
Standard Deviation (σ)
Utility –IndifferenceCurves – Investor 1
Utility – Indifference Curves – Investor 2
Efficient Frontier and Investor Utility
Asset Allocation and Portfolio Construction
Chapter 38Tools & Techniques of
Investment Planning
Copyright 2007, The National Underwriter Company 20
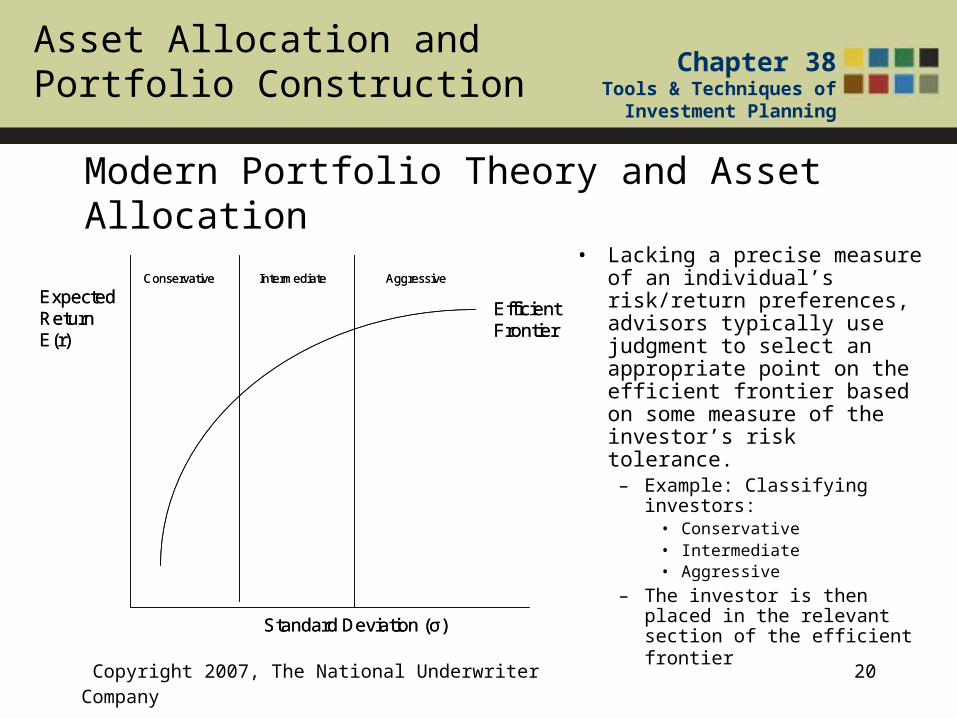
Modern Portfolio Theory and Asset Allocation
• Lacking a precise measure of an individual’s risk/return preferences, advisors typically use judgment to select an appropriate point on the efficient frontier based on some measure of the investor’s risk tolerance.
– Example: Classifying investors:
• Conservative• Intermediate• Aggressive
– The investor is then placed in the relevant section of the efficient frontier
ExpectedReturnE(r)
Standard Deviation (σ)
EfficientFrontier
Conservative Intermediate Aggressive
ExpectedReturnE(r)
Standard Deviation (σ)
EfficientFrontier
Conservative Intermediate Aggressive
Asset Allocation and Portfolio Construction
Chapter 38Tools & Techniques of
Investment Planning
Copyright 2007, The National Underwriter Company 21
Modern Portfolio Theory and Asset Allocation
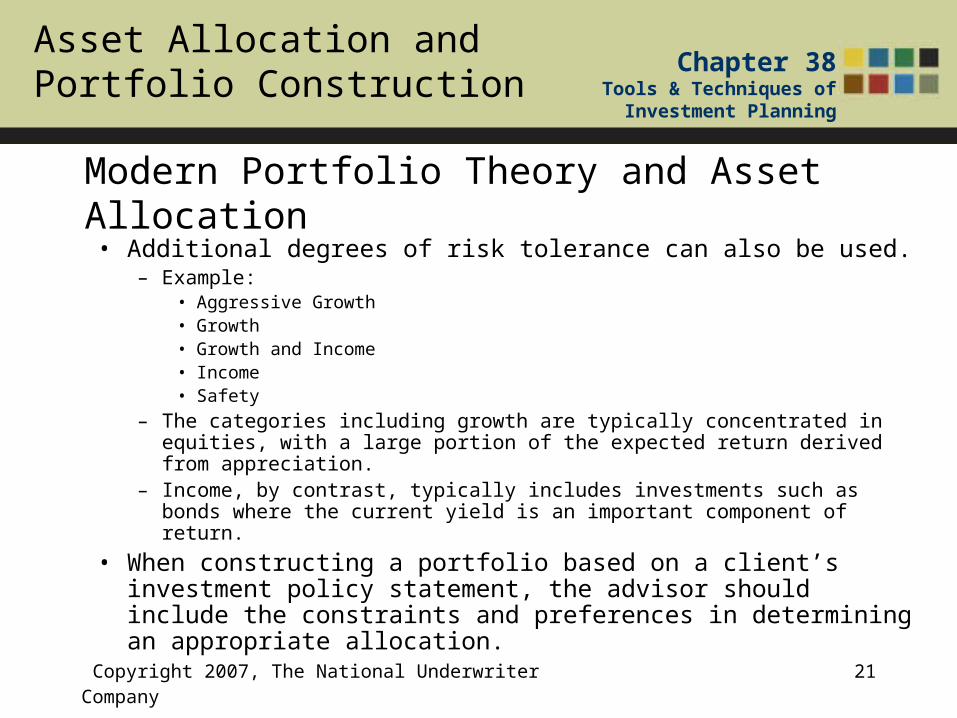
• Additional degrees of risk tolerance can also be used.– Example:
• Aggressive Growth • Growth• Growth and Income • Income• Safety
– The categories including growth are typically concentrated in equities, with a large portion of the expected return derived from appreciation.
– Income, by contrast, typically includes investments such as bonds where the current yield is an important component of return.
• When constructing a portfolio based on a client’s investment policy statement, the advisor should include the constraints and preferences in determining an appropriate allocation.
Asset Allocation and Portfolio Construction
Chapter 38Tools & Techniques of
Investment Planning
Copyright 2007, The National Underwriter Company 22
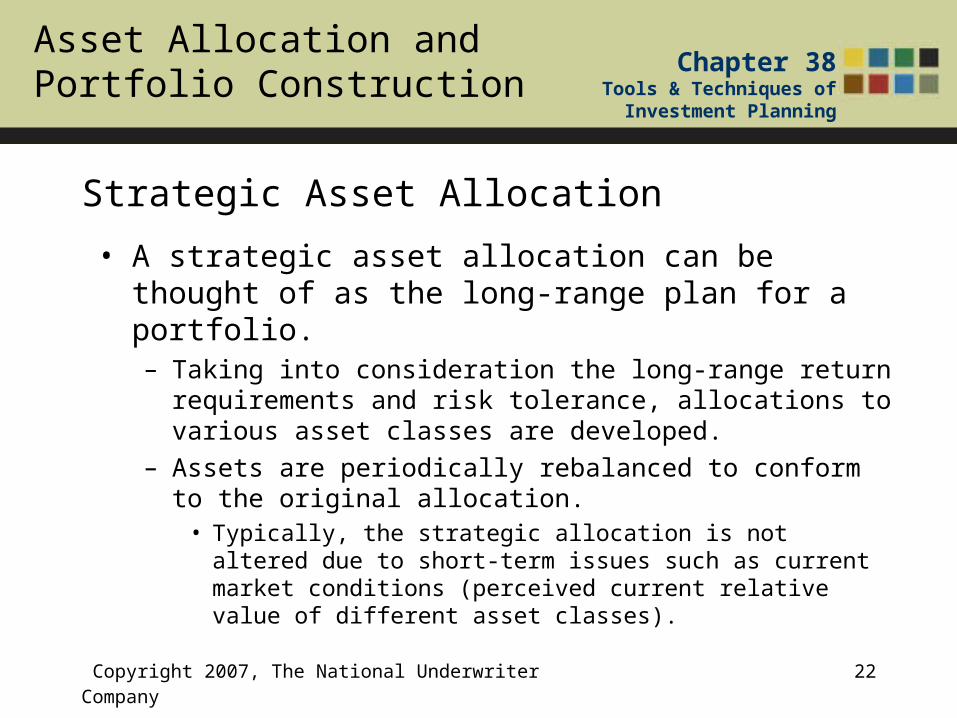
• A strategic asset allocation can be thought of as the long-range plan for a portfolio. – Taking into consideration the long-range return requirements
and risk tolerance, allocations to various asset classes are developed.
– Assets are periodically rebalanced to conform to the original allocation.
• Typically, the strategic allocation is not altered due to short-term issues such as current market conditions (perceived current relative value of different asset classes).
Strategic Asset Allocation
Asset Allocation and Portfolio Construction
Chapter 38Tools & Techniques of
Investment Planning
Copyright 2007, The National Underwriter Company 23
Strategic Asset Allocation
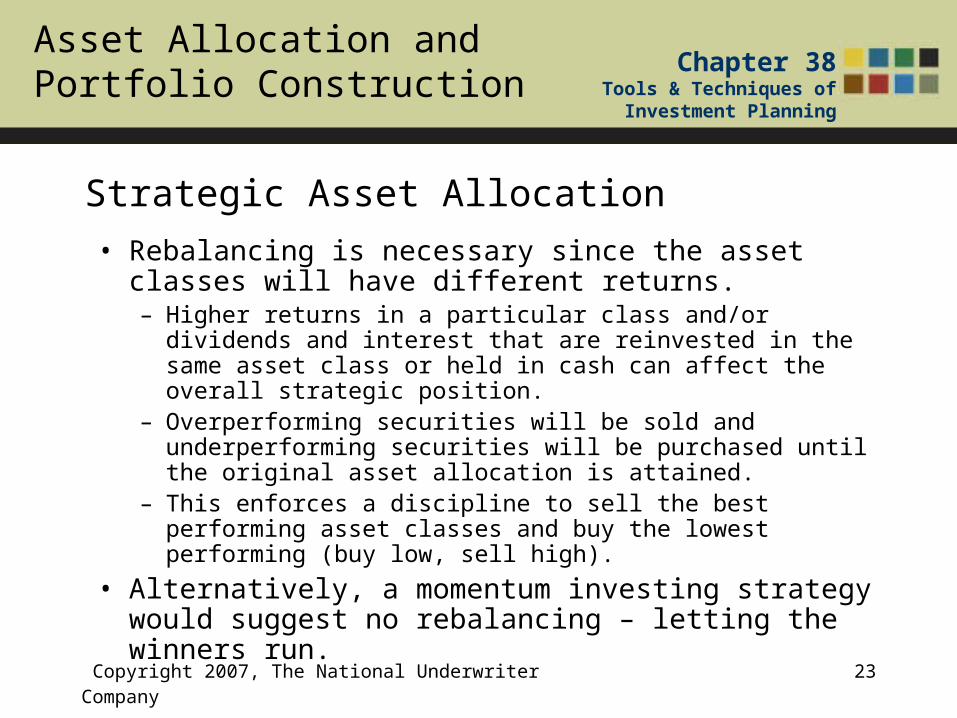
• Rebalancing is necessary since the asset classes will have different returns. – Higher returns in a particular class and/or dividends and
interest that are reinvested in the same asset class or held in cash can affect the overall strategic position.
– Overperforming securities will be sold and underperforming securities will be purchased until the original asset allocation is attained.
– This enforces a discipline to sell the best performing asset classes and buy the lowest performing (buy low, sell high).
• Alternatively, a momentum investing strategy would suggest no rebalancing – letting the winners run.

Asset Allocation and Portfolio Construction
Chapter 38Tools & Techniques of
Investment Planning
Copyright 2007, The National Underwriter Company 24
Example
• Consider an investor who has created a strategic asset allocation of 30% bonds, 30% commodities and 40% stocks.
– Guideline (set by investor): The portfolio will be rebalanced when any asset class varies from the strategic allocation by more than 500 basis points (5%).
• Over the next five years, the assets exhibit the following return pattern:
Year Bonds Commodities Stocks
1 2.43% 13.54% 4.91%
2 4.34% 20.25% 10.88%
3 4.10% 38.59% 28.68%
4 10.25% -15.94% -22.10%
5 8.44% -21.44% -11.89%
Asset Allocation and Portfolio Construction
Chapter 38Tools & Techniques of
Investment Planning
Copyright 2007, The National Underwriter Company 25
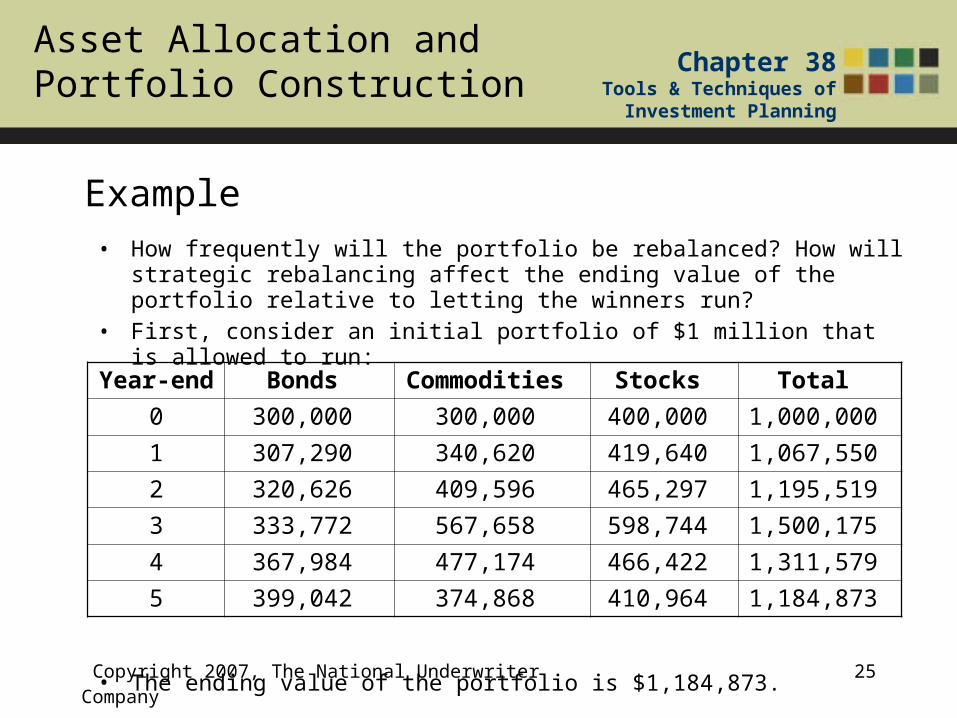
Example• How frequently will the portfolio be rebalanced? How will strategic
rebalancing affect the ending value of the portfolio relative to letting the winners run?
• First, consider an initial portfolio of $1 million that is allowed to run:
• The ending value of the portfolio is $1,184,873.
Year-end Bonds Commodities Stocks Total
0 300,000 300,000 400,000 1,000,000
1 307,290 340,620 419,640 1,067,550
2 320,626 409,596 465,297 1,195,519
3 333,772 567,658 598,744 1,500,175
4 367,984 477,174 466,422 1,311,579
5 399,042 374,868 410,964 1,184,873
Asset Allocation and Portfolio Construction
Chapter 38Tools & Techniques of
Investment Planning
Copyright 2007, The National Underwriter Company 26
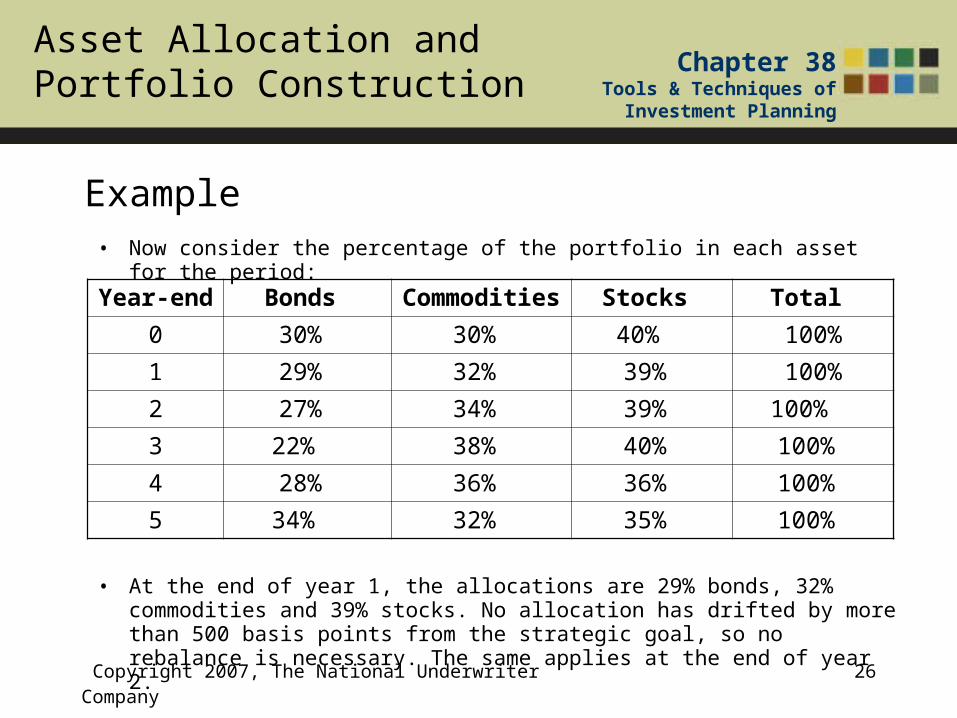
Example• Now consider the percentage of the portfolio in each asset for the period:
• At the end of year 1, the allocations are 29% bonds, 32% commodities and 39% stocks. No allocation has drifted by more than 500 basis points from the strategic goal, so no rebalance is necessary. The same applies at the end of year 2.
Year-end Bonds Commodities Stocks Total
0 30% 30% 40% 100%
1 29% 32% 39% 100%
2 27% 34% 39% 100%
3 22% 38% 40% 100%
4 28% 36% 36% 100%
5 34% 32% 35% 100%
Asset Allocation and Portfolio Construction
Chapter 38Tools & Techniques of
Investment Planning
Copyright 2007, The National Underwriter Company 27
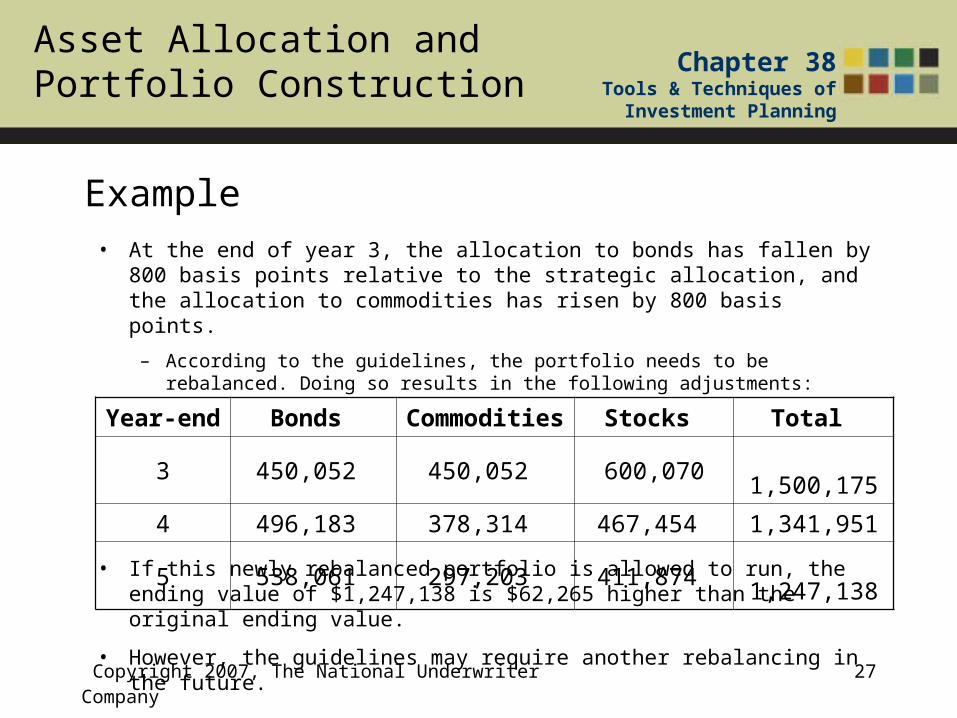
Example
• At the end of year 3, the allocation to bonds has fallen by 800 basis points relative to the strategic allocation, and the allocation to commodities has risen by 800 basis points.
– According to the guidelines, the portfolio needs to be rebalanced. Doing so results in the following adjustments:
• If this newly rebalanced portfolio is allowed to run, the ending value of $1,247,138 is $62,265 higher than the original ending value.
• However, the guidelines may require another rebalancing in the future.
Year-end Bonds Commodities Stocks Total
3 450,052 450,052 600,070 1,500,175
4 496,183 378,314 467,454 1,341,951
5 538,061 297,203 411,874 1,247,138
Asset Allocation and Portfolio Construction
Chapter 38Tools & Techniques of
Investment Planning
Copyright 2007, The National Underwriter Company 28
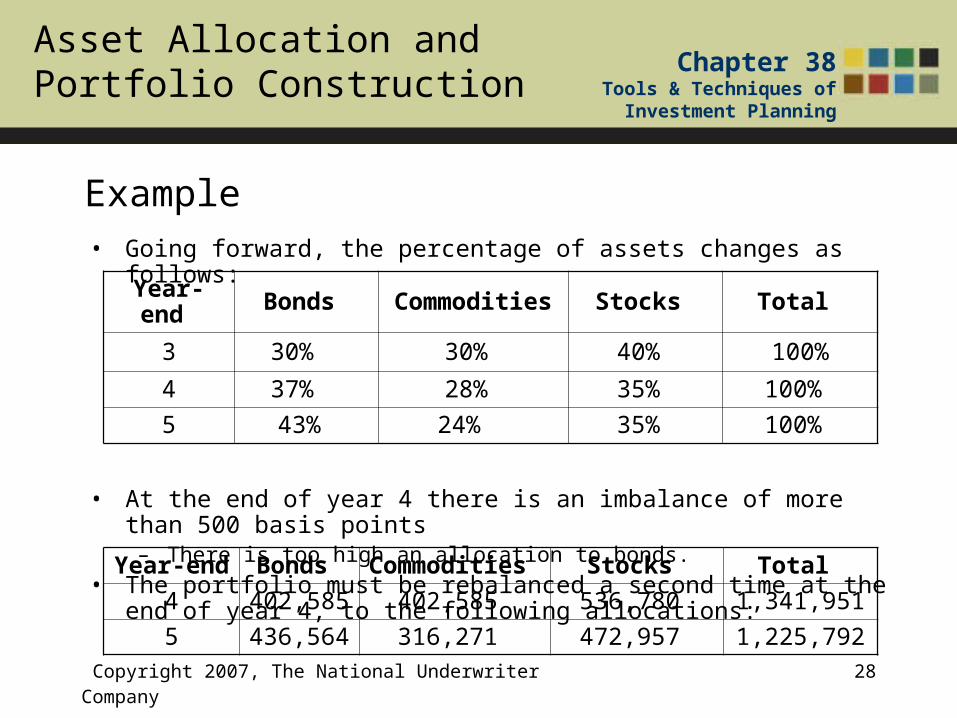
Example• Going forward, the percentage of assets changes as follows:
• At the end of year 4 there is an imbalance of more than 500 basis points– There is too high an allocation to bonds.
• The portfolio must be rebalanced a second time at the end of year 4, to the following allocations:
Year-end Bonds Commodities Stocks Total
3 30% 30% 40% 100%
4 37% 28% 35% 100%
5 43% 24% 35% 100%
Year-end Bonds Commodities Stocks Total
4 402,585 402,585 536,780 1,341,951
5 436,564 316,271 472,957 1,225,792
Asset Allocation and Portfolio Construction
Chapter 38Tools & Techniques of
Investment Planning
Copyright 2007, The National Underwriter Company 29
Example
• After the new rebalancing is completed and the final year elapses, the ending value of the portfolio is still $40,919 better than would have been achieved from letting the assets run from year 1 on.
• It is $21,346 lower than it would have been if the second rebalancing had not been done.– In year 5 bonds continued to do well, while stocks and
commodities continued to fall.
Asset Allocation and Portfolio Construction
Chapter 38Tools & Techniques of
Investment Planning
Copyright 2007, The National Underwriter Company 30
Strategic Asset Allocation
• There is no way of knowing in advance whether the trends will continue or reverse in a given year.
• It is generally best to decide in advance how frequently to rebalance in order to retain the desired level of risk for the client’s portfolio.
Asset Allocation and Portfolio Construction
Chapter 38Tools & Techniques of
Investment Planning
Copyright 2007, The National Underwriter Company 31
• Attempts to capitalize changing market conditions.– Contrasts strategic allocation
• The overall asset allocation is frequently adjusted to take advantage of perceived opportunities in the current market.– Example: In a high interest rate environment, the advisor may shift
the asset allocation to favor long-term bonds.
• The rewards of tactical asset allocation depend on the advisor's ability to predict which asset classes will perform best in the near term.
• Strategic asset allocation is generally a low turnover investment strategy, while tactical asset allocation generally results in high turnover.
Tactical Asset Allocation
Asset Allocation and Portfolio Construction
Chapter 38Tools & Techniques of
Investment Planning
Copyright 2007, The National Underwriter Company 32
Example
• Consider the investor from the previous example, who starts with the same $1 million portfolio and strategic allocation guidelines.
• The advisor is given discretion to shift the allocation tactically once per year as long as the starting allocations are within 500 basis points of each asset’s strategic goal.
• The advisor decides to follow a momentum strategy that overweights the previous year’s top-performing asset by 500 basis points and underweights the worst-performing asset by 500 basis points.
Asset Allocation and Portfolio Construction
Chapter 38Tools & Techniques of
Investment Planning
Copyright 2007, The National Underwriter Company 33
Example
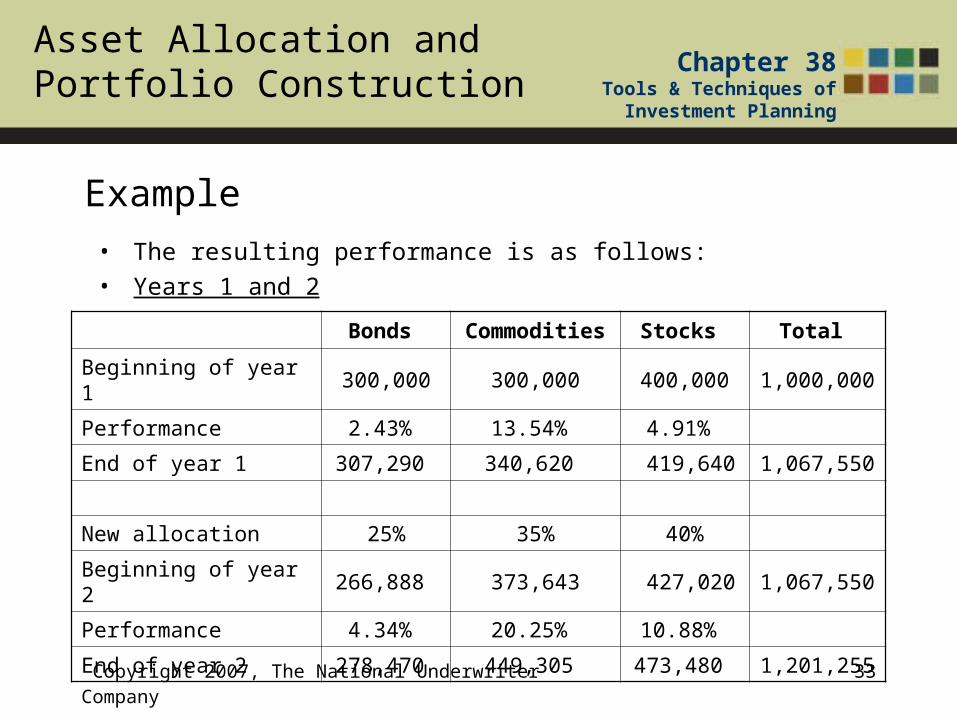
• The resulting performance is as follows:
• Years 1 and 2
Bonds Commodities Stocks Total
Beginning of year 1 300,000 300,000 400,000 1,000,000
Performance 2.43% 13.54% 4.91%
End of year 1 307,290 340,620 419,640 1,067,550
New allocation 25% 35% 40%
Beginning of year 2 266,888 373,643 427,020 1,067,550
Performance 4.34% 20.25% 10.88%
End of year 2 278,470 449,305 473,480 1,201,255
Asset Allocation and Portfolio Construction
Chapter 38Tools & Techniques of
Investment Planning
Copyright 2007, The National Underwriter Company 34
Example
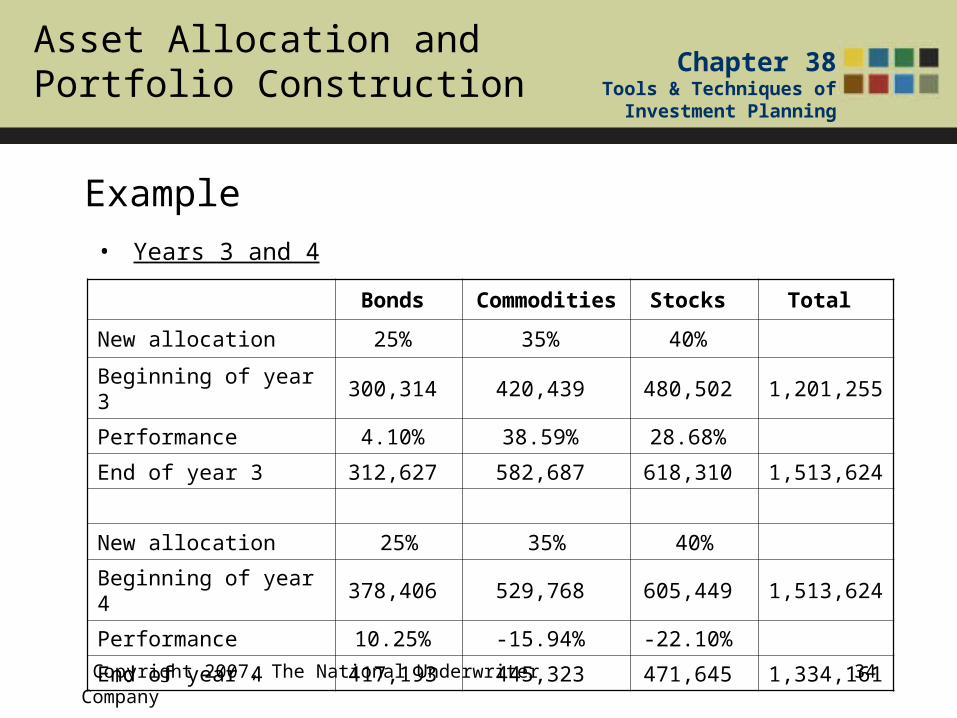
• Years 3 and 4
Bonds Commodities Stocks Total
New allocation 25% 35% 40%
Beginning of year 3 300,314 420,439 480,502 1,201,255
Performance 4.10% 38.59% 28.68%
End of year 3 312,627 582,687 618,310 1,513,624
New allocation 25% 35% 40%
Beginning of year 4 378,406 529,768 605,449 1,513,624
Performance 10.25% -15.94% -22.10%
End of year 4 417,193 445,323 471,645 1,334,161
Asset Allocation and Portfolio Construction
Chapter 38Tools & Techniques of
Investment Planning
Copyright 2007, The National Underwriter Company 35
Example
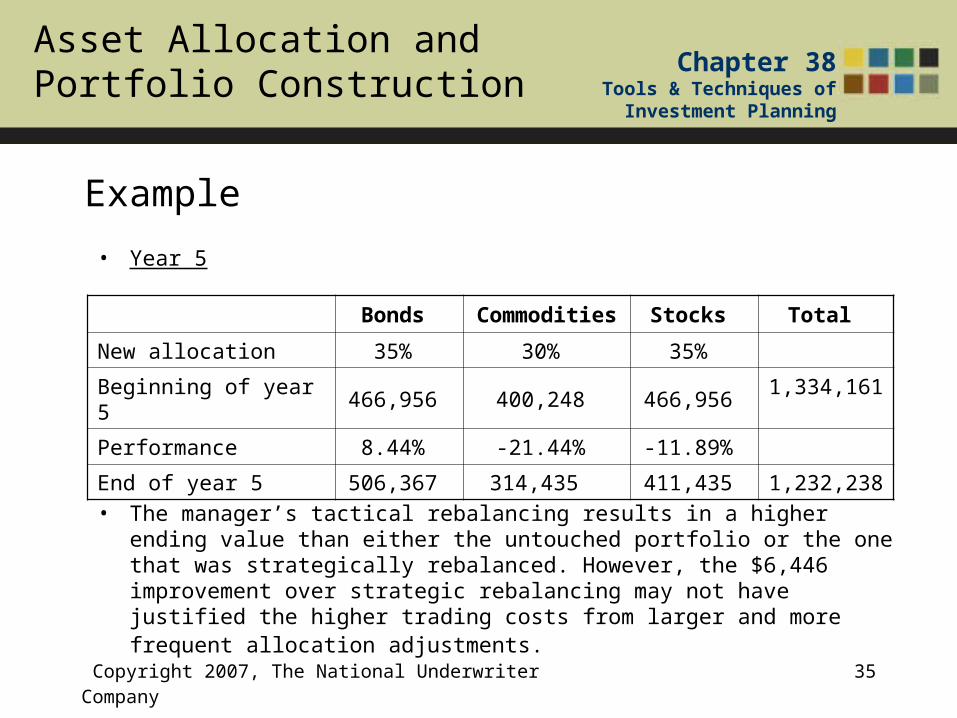
• Year 5
• The manager’s tactical rebalancing results in a higher ending value than either the untouched portfolio or the one that was strategically rebalanced. However, the $6,446 improvement over strategic rebalancing may not have justified the higher trading costs from larger and more frequent allocation adjustments.
Bonds Commodities Stocks Total
New allocation 35% 30% 35%
Beginning of year 5 466,956 400,248 466,956 1,334,161
Performance 8.44% -21.44% -11.89%
End of year 5 506,367 314,435 411,435 1,232,238
Asset Allocation and Portfolio Construction
Chapter 38Tools & Techniques of
Investment Planning
Copyright 2007, The National Underwriter Company 36
Controlling Volatility
• Asset allocation is a means of controlling the volatility that is inherent in investment returns.– Some investors may have a high degree of risk tolerance and
desire to achieve the maximum possible return regardless of risk.
– Other investors may not sleep well at night with volatile portfolio values.
– Some investors who think they can tolerate risk, may have circumstances where volatility can impair their ability to maintain a certain standard of living.
• Example: During retirement, consistent withdrawal rates may not be possible given the volatility of returns. In spite of the anticipated returns and inflation rates, the maximum safe withdrawal rate may be lower than anticipated.
Asset Allocation and Portfolio Construction
Chapter 38Tools & Techniques of
Investment Planning
Copyright 2007, The National Underwriter Company 37
Controlling Volatility
• Methods of reducing and moderating volatility– Creating a diversified portfolio with assets that are not highly
correlated – Time
• If an investor has a long time horizon before investment withdrawals are to begin the impact of volatility is dampened over time.
– Hedging strategies and options strategies such as covered calls• Covered calls involving selling a call option on a currently held
investment, which sells some of the upside and reduces the potential downside (from the collection of the option premium), reducing the standard deviation of the portfolio.
• Downside risk can also be reduced through the purchase of put options.
Asset Allocation and Portfolio Construction
Chapter 38Tools & Techniques of
Investment Planning
Copyright 2007, The National Underwriter Company 38
Monte-Carlo Simulation
• Expected returns and standard deviation are not necessarily constant over time.
• The return in an individual period is also not necessarily predictable.
• Returns in each asset class are probabilistic. • Investors may also make periodic deposits and
withdrawals– Increases the difficulty of predicting long-term returns and risk.
Asset Allocation and Portfolio Construction
Chapter 38Tools & Techniques of
Investment Planning
Copyright 2007, The National Underwriter Company 39
• Monte-Carlo simulation assesses the likelihood of an expected outcome.
• A computer program randomly chooses returns from an expected distribution of returns for each period (perhaps rebalancing the asset allocation if required under the strategy). – Each run results in an ending expected portfolio value. – The process is run many times (perhaps 1,000) to achieve a
distribution of ending values. – This process can help assess the probability of achieving a
certain value or income in the future.• Including the possibility that an individual will outlive his retirement
assets
Monte-Carlo Simulation
Asset Allocation and Portfolio Construction
Chapter 38Tools & Techniques of
Investment Planning
Copyright 2007, The National Underwriter Company 40
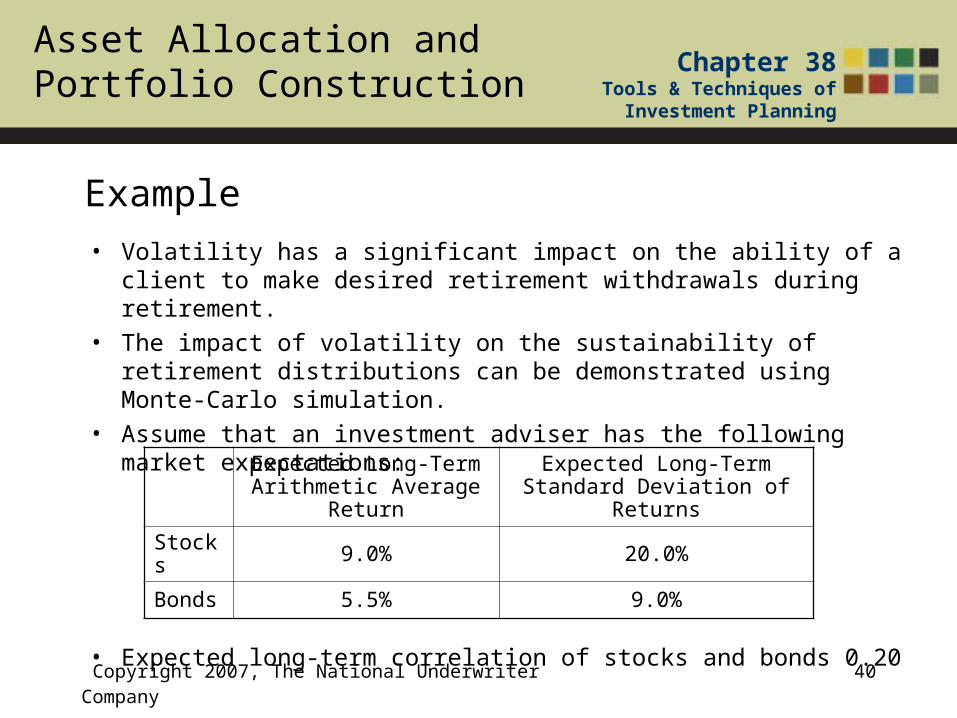
Example
• Volatility has a significant impact on the ability of a client to make desired retirement withdrawals during retirement.
• The impact of volatility on the sustainability of retirement distributions can be demonstrated using Monte-Carlo simulation.
• Assume that an investment adviser has the following market expectations:
• Expected long-term correlation of stocks and bonds 0.20
Expected Long-Term Arithmetic Average
Return
Expected Long-Term Standard Deviation of Returns
Stocks 9.0% 20.0%
Bonds 5.5% 9.0%
Asset Allocation and Portfolio Construction
Chapter 38Tools & Techniques of
Investment Planning
Copyright 2007, The National Underwriter Company 41
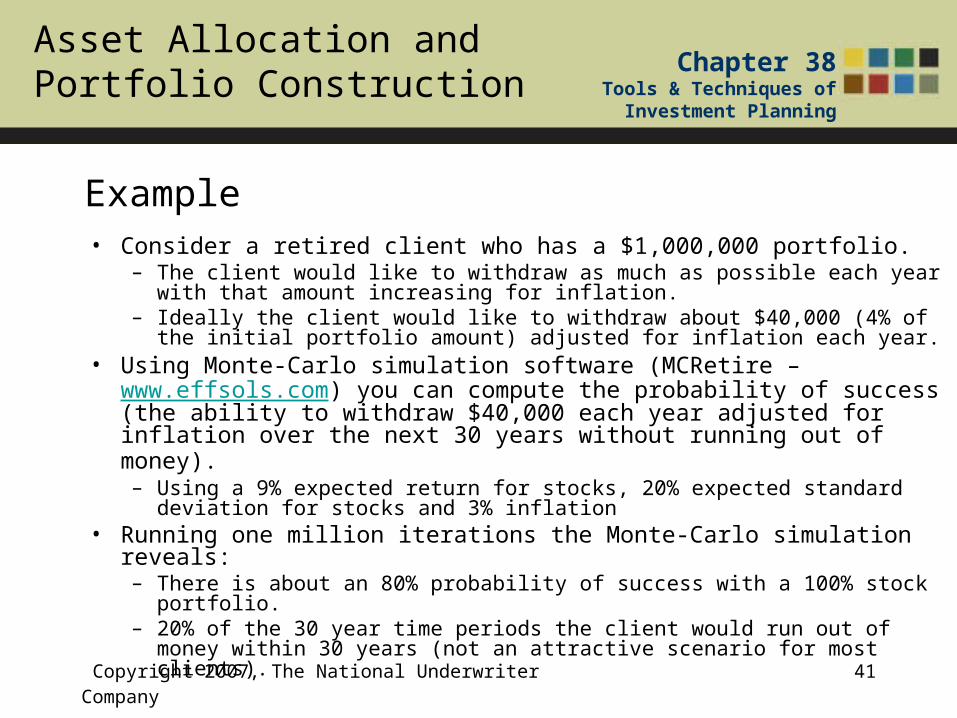
Example• Consider a retired client who has a $1,000,000 portfolio.
– The client would like to withdraw as much as possible each year with that amount increasing for inflation.
– Ideally the client would like to withdraw about $40,000 (4% of the initial portfolio amount) adjusted for inflation each year.
• Using Monte-Carlo simulation software (MCRetire – www.effsols.com) you can compute the probability of success (the ability to withdraw $40,000 each year adjusted for inflation over the next 30 years without running out of money). – Using a 9% expected return for stocks, 20% expected standard deviation
for stocks and 3% inflation• Running one million iterations the Monte-Carlo simulation reveals:
– There is about an 80% probability of success with a 100% stock portfolio.– 20% of the 30 year time periods the client would run out of money within
30 years (not an attractive scenario for most clients).
Asset Allocation and Portfolio Construction
Chapter 38Tools & Techniques of
Investment Planning
Copyright 2007, The National Underwriter Company 42
Example
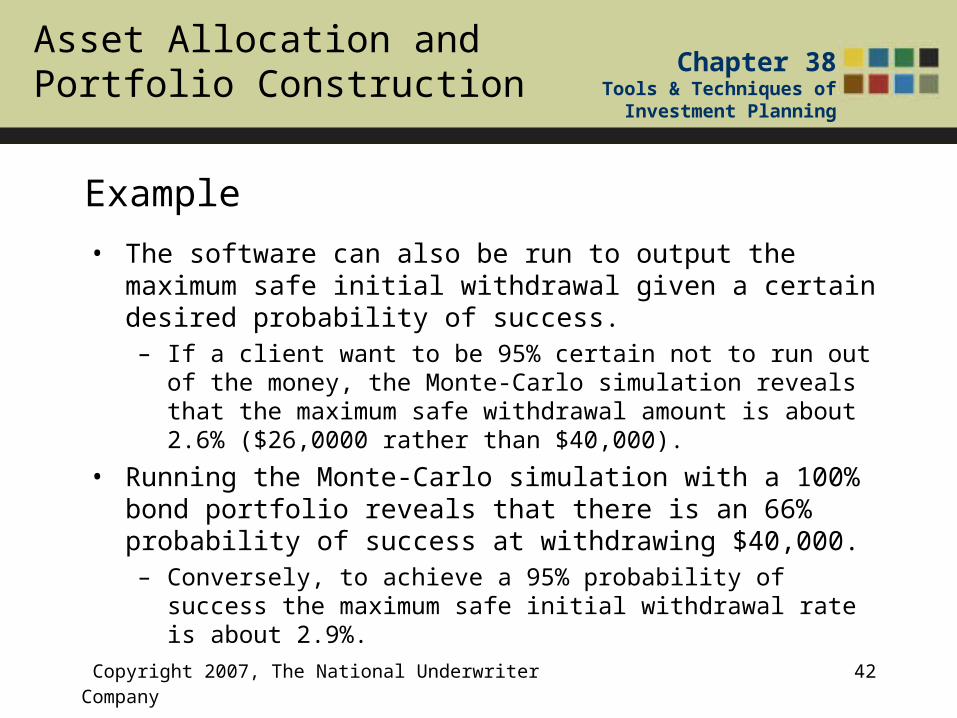
• The software can also be run to output the maximum safe initial withdrawal given a certain desired probability of success.– If a client want to be 95% certain not to run out of the money, the
Monte-Carlo simulation reveals that the maximum safe withdrawal amount is about 2.6% ($26,0000 rather than $40,000).
• Running the Monte-Carlo simulation with a 100% bond portfolio reveals that there is an 66% probability of success at withdrawing $40,000. – Conversely, to achieve a 95% probability of success the maximum
safe initial withdrawal rate is about 2.9%.
Asset Allocation and Portfolio Construction
Chapter 38Tools & Techniques of
Investment Planning
Copyright 2007, The National Underwriter Company 43
Example
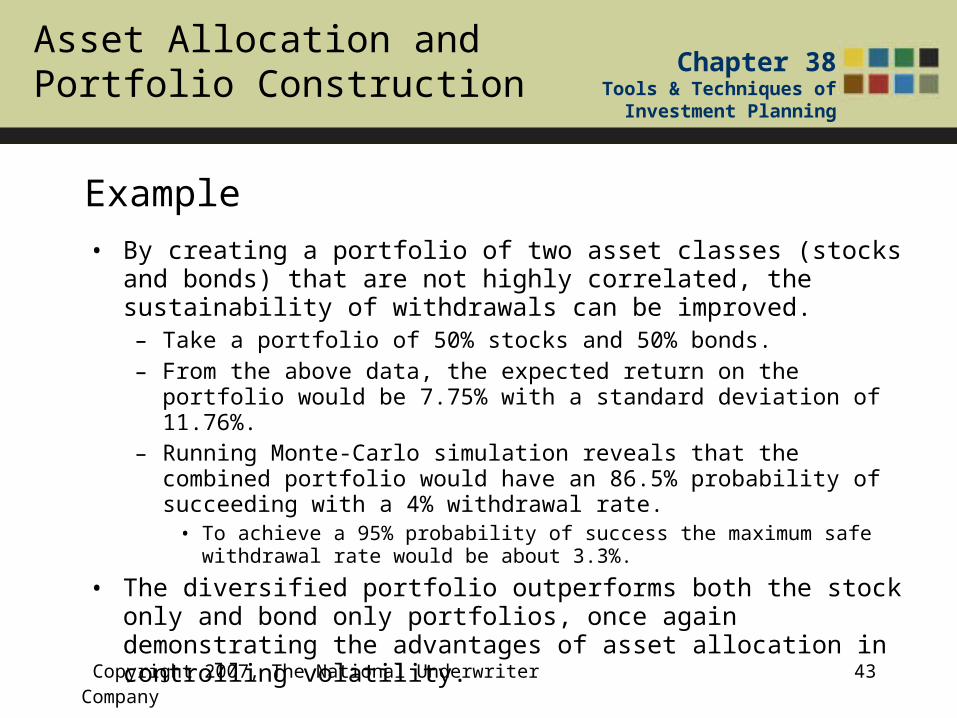
• By creating a portfolio of two asset classes (stocks and bonds) that are not highly correlated, the sustainability of withdrawals can be improved. – Take a portfolio of 50% stocks and 50% bonds.– From the above data, the expected return on the portfolio would be
7.75% with a standard deviation of 11.76%.– Running Monte-Carlo simulation reveals that the combined portfolio
would have an 86.5% probability of succeeding with a 4% withdrawal rate.
• To achieve a 95% probability of success the maximum safe withdrawal rate would be about 3.3%.
• The diversified portfolio outperforms both the stock only and bond only portfolios, once again demonstrating the advantages of asset allocation in controlling volatility.
Asset Allocation and Portfolio Construction
Chapter 38Tools & Techniques of
Investment Planning
Copyright 2007, The National Underwriter Company 44
Example
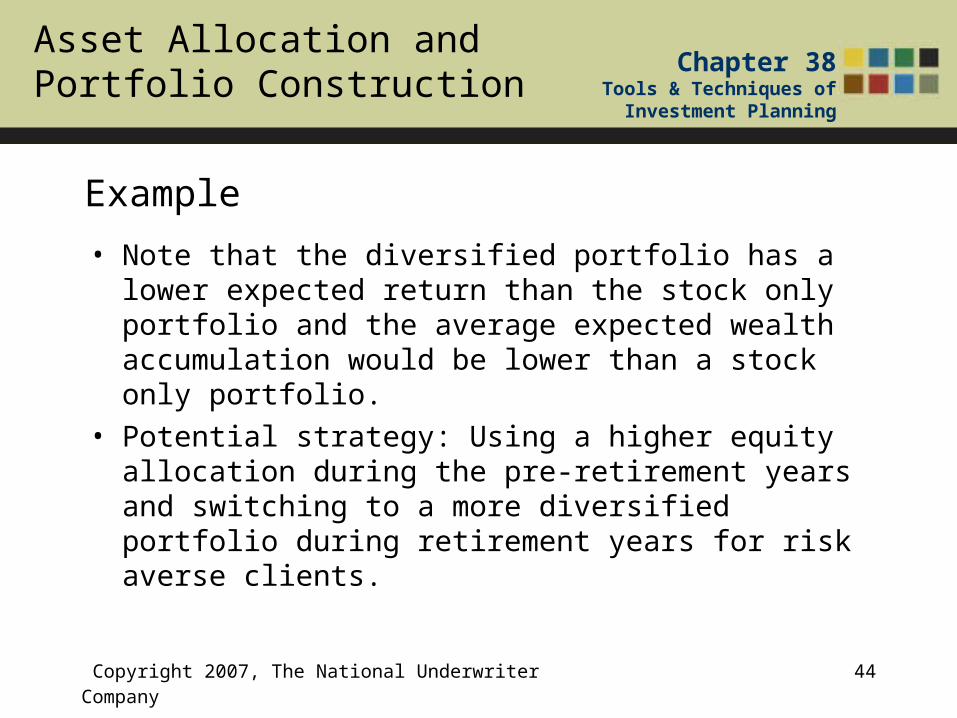
• Note that the diversified portfolio has a lower expected return than the stock only portfolio and the average expected wealth accumulation would be lower than a stock only portfolio.
• Potential strategy: Using a higher equity allocation during the pre-retirement years and switching to a more diversified portfolio during retirement years for risk averse clients.
Asset Allocation and Portfolio Construction
Chapter 38Tools & Techniques of
Investment Planning
Copyright 2007, The National Underwriter Company 45
Individual Security Selection
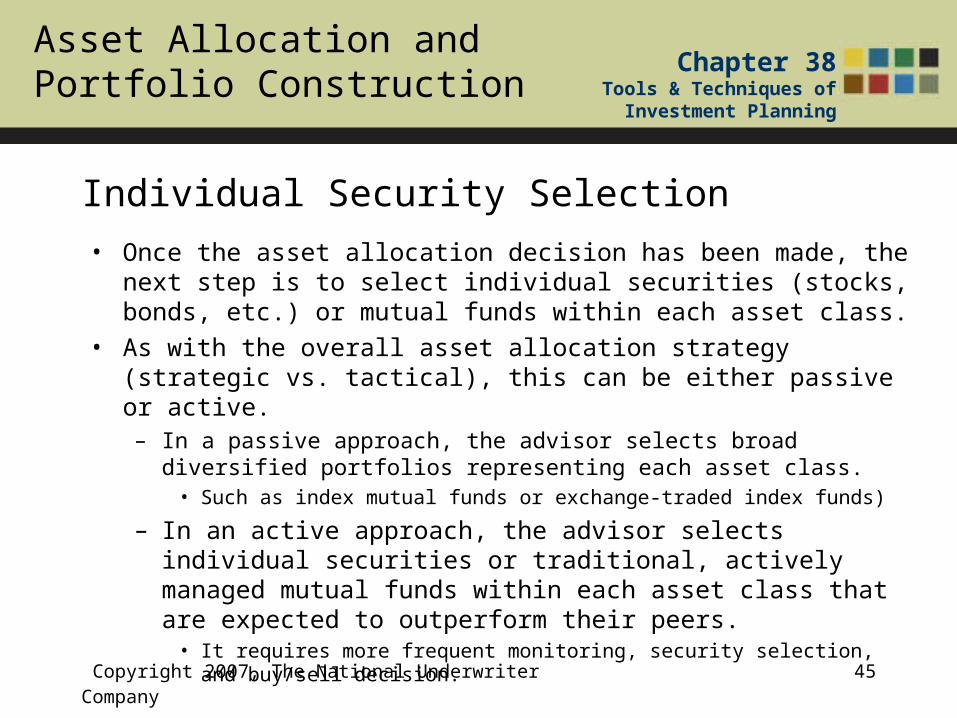
• Once the asset allocation decision has been made, the next step is to select individual securities (stocks, bonds, etc.) or mutual funds within each asset class.
• As with the overall asset allocation strategy (strategic vs. tactical), this can be either passive or active.– In a passive approach, the advisor selects broad diversified portfolios
representing each asset class. • Such as index mutual funds or exchange-traded index funds)
– In an active approach, the advisor selects individual securities or traditional, actively managed mutual funds within each asset class that are expected to outperform their peers.
• It requires more frequent monitoring, security selection, and buy/sell decision.
Asset Allocation and Portfolio Construction
Chapter 38Tools & Techniques of
Investment Planning
Copyright 2007, The National Underwriter Company 46
Individual Security Selection
• The choice between the active and passive approaches depends upon an advisor’s beliefs about market efficiency and the advisor’s ability to select, in advance, better performing securities or funds.
• Efficient markets generally assume rational behavior by market participants and a number of anomalies have been shown to occur. – A study of behavioral finance can help the advisor understand
investor behavior both in selecting investment strategies and educating clients to avoid some common pitfalls.
Asset Allocation and Portfolio Construction
Chapter 38Tools & Techniques of
Investment Planning
Copyright 2007, The National Underwriter Company 47
Market Hypotheses
• The Efficient Market Theory (EMT) hypothesizes that securities markets process information efficiently.– This implies that new information about a security is quickly
(almost instantaneously) reflected in its price.
• In order for the market to be efficient, certain conditions must be met:– A large number of profit maximizing investors competing in
the market – A free, random flow of information
• However, some factors can still limit an investor’s ability to trade (e.g., 1987 exchange rules).
Asset Allocation and Portfolio Construction
Chapter 38Tools & Techniques of
Investment Planning
Copyright 2007, The National Underwriter Company 48
Market Hypotheses
• Strong Form EMT– Argues that all information, whether public or not, is reflected
in security prices.– Assumes the existence of a perfect market.– Under this form, no participants would be able to
consistently perform better than the market other than by random luck.
Asset Allocation and Portfolio Construction
Chapter 38Tools & Techniques of
Investment Planning
Copyright 2007, The National Underwriter Company 49
Market Hypotheses
• Semi-Strong Form EMT – Argues that all public information is reflected in stock prices. – This includes prices of securities, security volume data,
financial reports, press releases, statements of company officers, newspaper articles, and the work of sell-side securities analysts, as well as many other types of information.
Asset Allocation and Portfolio Construction
Chapter 38Tools & Techniques of
Investment Planning
Copyright 2007, The National Underwriter Company 50
Market Hypotheses
• Weak Form EMT – Argues that security prices reflect only market data, such as
historical trade prices, volume, and order size. – Under this form, an investor could use fundamental analysis
tools such as financial statement analysis and other fundamental information to glean information that has not been efficiently priced.
• This information could be used to outperform the market.
• Technical analysis (charting of security price and volume data) would still fail to provide consistent out-performance, because it relies on market data.
Asset Allocation and Portfolio Construction
Chapter 38Tools & Techniques of
Investment Planning
Copyright 2007, The National Underwriter Company 51
EMT Anomalies
• EMT Anomalies occur when fundamental strategies result in an investor out-performing the market.
• These EMT Anomalies include:– Stocks paying high dividend yields have been shown to
perform better over time than low dividend yield stocks– stocks with low price/book, price/sales, and price/earnings
ratios have been found to outperform those stocks with higher price multiples.
– The market appears to over and under react to news.• Studies have been done showing that the market overreacts,
and others indicate that there is persistent under-reaction.
Asset Allocation and Portfolio Construction
Chapter 38Tools & Techniques of
Investment Planning
Copyright 2007, The National Underwriter Company 52
EMT Anomalies
• EMT Anomalies (Continued)– Researched has demonstrated a January Effect.
• The market tends to perform better in January.
• Some of this effect may be explained by the timing of tax selling.
– Late in the year, investors who want to minimize taxes will sell stocks that have gone down in order to incur a capital loss.
– In compliance with tax rules, the investor must wait 30 days if he/she desires to repurchase the security. The repurchase may then by done in January.
– Shares of firms with small market capitalization (the size effect) or few dedicated analysts (the neglect effect) tend to perform better than others.
Asset Allocation and Portfolio Construction
Chapter 38Tools & Techniques of
Investment Planning
Copyright 2007, The National Underwriter Company 53
EMT Anomalies
• EMT Anomalies (Continued)– The Value Line effect is a finding that stocks ranked highest
by Value Line have been found to outperform the market in certain periods.
• Consistent outperformance should be recognized by the market and reflected in the stock price as soon as the ranking is published.
Asset Allocation and Portfolio Construction
Chapter 38Tools & Techniques of
Investment Planning
Copyright 2007, The National Underwriter Company 54
EMT Anomalies
• The existence of the various anomalies calls into question the relative efficiency of the markets.
• The research studies that uncovered these anomalies relate to particular time periods and, of course, do not guarantee they will work in future periods.
• Identifying anomalies should cause traders to act on them, which in turn helps to achieve a greater level of market efficiency.
Asset Allocation and Portfolio Construction
Chapter 38Tools & Techniques of
Investment Planning
Copyright 2007, The National Underwriter Company 55
Behavioral Finance
• Behavioral finance involves the study of how investors make decisions. – Investors often use mental shortcuts or demonstrate biases
in their decision making. – Understanding these concepts can assist the advisor in
understanding market behavior and anomalies and helping clients make better decisions.
– Some investment managers and mutual funds have been formed to exploit these behavioral issues in making securities investments.
Asset Allocation and Portfolio Construction
Chapter 38Tools & Techniques of
Investment Planning
Copyright 2007, The National Underwriter Company 56
Behavioral Finance
• Mental Accounting– Investors (and consumers) have been shown to have
“categories of money” such that all dollars are not equivalent.
– They categorize money into buckets.– In the investment arena, clients may be included to mentally
view money differently depending upon the source such as an inheritance versus earned money or principal versus capital gains.
Asset Allocation and Portfolio Construction
Chapter 38Tools & Techniques of
Investment Planning
Copyright 2007, The National Underwriter Company 57
Behavioral Finance• Confirmation Bias
– People tend to search for and select information which confirms their beliefs.
– This is a dangerous bias that can lead to bad investment decisions.
– Example: An analyst writing an investment recommendation report may have used confirmation bias in evaluating data for purposes of reaching their recommendation based on other relationships they may have with the company.
– Advisors need to be aware of the potential existence of this bias in evaluating reports of others and in making their own evaluations.
– An independent, objective frame of mind should be strived for.
Asset Allocation and Portfolio Construction
Chapter 38Tools & Techniques of
Investment Planning
Copyright 2007, The National Underwriter Company 58
Behavioral Finance
• Optimism/Overconfidence– People tend to believe that they are better than average
• By definition, we all can not be above average.
• For example, in a survey of British drivers, 95% of them felt they were above average.
– Analysts, investors and advisors may be overconfident in their abilities to forecast company earnings, future growth rates, investment returns and similar future events.
– Overconfidence can be reduced by considering many different possibilities or alternatives.
Asset Allocation and Portfolio Construction
Chapter 38Tools & Techniques of
Investment Planning
Copyright 2007, The National Underwriter Company 59
Behavioral Finance
• Loss Aversion/Framing– Individuals are generally willing to take more risk to avoid a
certain loss but are conservative in locking in gains and avoiding risk.
– Aversion to losses also results in a reluctance of investors to sell losing investments.
• They may feel they can “avoid” avoid the loss by not selling the investment, even though the investment has declined in value.
Asset Allocation and Portfolio Construction
Chapter 38Tools & Techniques of
Investment Planning
Copyright 2007, The National Underwriter Company 60
Behavioral Finance
• Herding– Individuals may engage in herding behavior.– Example: A financial analyst who forecasts earnings for a
company may want to stay with the herd by having a forecast that is similar to the forecast of other analysts.
• Having a forecast that is much higher or lower than the “herd” can result in being out on a limb if the analyst is wrong.
• If you are wrong, but in with the herd there is no loss in reputation.
Asset Allocation and Portfolio Construction
Chapter 38Tools & Techniques of
Investment Planning
Copyright 2007, The National Underwriter Company 61
Behavioral Finance• Use of Heuristics
– Individuals often use heuristics (shortcuts) in making decisions.– These include representativeness, availability and anchoring.
• Representativeness: Involves individuals making judgments based on similar past events.
• Availability: Involves making decisions based on how recent or vivid information is.
• Anchoring: Involves individuals anchoring on a current number such as a stock price or returns and making adjustments from that number rather than making an independent assessment of potential outcomes.
– These simple shortcuts can ease decision making but can result in bad investment decision such as buying investments that have recently increased in value rather than buying those that have recently declined.
Asset Allocation and Portfolio Construction
Chapter 38Tools & Techniques of
Investment Planning
Copyright 2007, The National Underwriter Company 62
Active Security Selection
• If an active security selection strategy is chosen, there are two basic approaches:– Top-down approach – Bottom-up approach
• Top-Down Approach – The advisor performs an analysis of the global and domestic
economy. – Based on this economic analysis, the advisor selects industries
or sectors that are expected to do well under those economic conditions.
– The advisor then selects the best securities within those industries or sectors, perhaps based on fundamental character-istics such as earnings, cash flow, growth prospects, and risk.
Asset Allocation and Portfolio Construction
Chapter 38Tools & Techniques of
Investment Planning
Copyright 2007, The National Underwriter Company 63
Active Security Selection
• Bottom-Up Approach– The advisor starts at the individual security level, identifying
the “best” companies according to some predefined criteria. – These criteria can be based on relative valuation,
fundamental analysis, or technical analysis.