asset allocation / benchmark review - nc treasurer resources... · asset allocation / benchmark...
TRANSCRIPT

Aon Hewitt Retirement and Investment
Investment advice and consulting services provided by Aon Hewitt Investment Consulting, Inc., an Aon Company.
Nothing in this document should be construed as legal or investment advice. Please consult with your independent professional for any such advice. To protect the
confidential and proprietary information included in this material, it may not be disclosed or provided to any third parties without the approval of Aon Hewitt.
Asset Allocation / Benchmark Review
North Carolina Department of State Treasurer Investment Advisory Committee | March 5, 2015

Aon Hewitt | Retirement and Investment
Proprietary & Confidential
Investment advice and consulting services provided by Aon Hewitt Investment Consulting, Inc., an Aon Company. 2
(This page left blank intentionally)

Aon Hewitt | Retirement and Investment
Proprietary & Confidential
Investment advice and consulting services provided by Aon Hewitt Investment Consulting, Inc., an Aon Company. 3
Section 1 Project Overview
Section 2 NCRS Benchmark Composition
Section 3 How to measure the success of an institutional investment the program?
Section 4 Performance Reporting and Plan Structure
Section 5 Appendix
Our Discussion Today

Aon Hewitt | Retirement and Investment
Proprietary & Confidential
Investment advice and consulting services provided by Aon Hewitt Investment Consulting, Inc., an Aon Company. 4
(This page left blank intentionally)

Aon Hewitt | Retirement and Investment
Proprietary & Confidential
Investment advice and consulting services provided by Aon Hewitt Investment Consulting, Inc., an Aon Company. 5
Agenda Tracker
Section 1 Project Overview
Section 2 NCRS Benchmark Composition
Section 3 How to measure the success of an institutional investment the program?
Section 4 Performance Reporting and Plan Structure
Section 5 Appendix

Aon Hewitt | Retirement and Investment
Proprietary & Confidential
Investment advice and consulting services provided by Aon Hewitt Investment Consulting, Inc., an Aon Company. 6
Project Overview
Aon Hewitt was retained by the North Carolina Department of State Treasurer
Investment Advisory Committee to provide an overview on our fundamental beliefs
regarding benchmarking and asset allocation
• Aon Hewitt attended the March 5th 2015 Investment Advisory Committee (IAC) meeting,
discussed our views, and received feedback from the IAC
• Following the meeting we provided a memo highlighting our understanding of the open
questions discussed at the March 5th meeting
• The following slide summarizes the follow-up items identified in the March 9th memo
• The following sections of this report address the follow-up items detailed on the next
slide

Aon Hewitt | Retirement and Investment
Proprietary & Confidential
Investment advice and consulting services provided by Aon Hewitt Investment Consulting, Inc., an Aon Company. 7
Project Overview (continued)
Analyze the NCRS Total Plan benchmark, and provide analysis to assist the IAC in
better understanding its current construction as well as historical composition
How should the IAC be measuring the success of the Plan?
Is the current use of private equity appropriate for the Plan?
Review the performance reporting provided to the IAC, and provide potential refinements
Evaluate peer group usage, and the potential for identifying a standard universe
Provide insight on peer handling of international currency exposure in their non-U.S.
equity and non-U.S. fixed income portfolios
Aon Hewitt | Retirement and Investment
Proprietary & Confidential
Investment advice and consulting services provided by Aon Hewitt Investment Consulting, Inc., an Aon Company. 8
(This page left blank intentionally)

Aon Hewitt | Retirement and Investment
Proprietary & Confidential
Investment advice and consulting services provided by Aon Hewitt Investment Consulting, Inc., an Aon Company. 9
Agenda Tracker
Section 1 Project Overview
Section 2 NCRS Benchmark Composition
Section 3 How to measure the success of an institutional investment the program?
Section 4 Performance Reporting and Plan Structure
Section 5 Appendix

Aon Hewitt | Retirement and Investment
Proprietary & Confidential
Investment advice and consulting services provided by Aon Hewitt Investment Consulting, Inc., an Aon Company. 10
Benchmark Review
Over time, benchmarks of institutional investors change for various reasons
– Evolution of the investable opportunity set outlined below
– Changes in the underlying liability of the Plan, or increased actuarial assumptions
– Strategic opportunities available in the market
The following slide highlights how the NCRS benchmark has changed over time
The "Institutionalization" of Various Asset Classes
<1960 1970 1980 1990 2000 2010
Developed
Equity
Private
Equity
Fixed Income
Fixed
Income
Funds
Infra-
structure
Commodities
TIPS
Core Plus
Risk
Time
U.S. Equities
Developed Non-U.S. Equities
PrivateEquity
Core PlusFixed Income
High Yield
Emerging Market Equity
U.S. TIPS
Global Equity
Hedge Funds
Commodities
Emerging Market
Debt
Infrastructure
Core Real Estate
Value Added Real
Estate

Aon Hewitt | Retirement and Investment
Proprietary & Confidential
Investment advice and consulting services provided by Aon Hewitt Investment Consulting, Inc., an Aon Company. 11
Similar to other institutional investors, the NCRS pension plan has added additional asset classes
over time
– The grey component of the analytic represents the period of time where the investment policy
was set on a monthly basis based on the actual asset allocation
NCRS Total Fund Benchmark (Legacy Benchmark)

Aon Hewitt | Retirement and Investment
Proprietary & Confidential
Investment advice and consulting services provided by Aon Hewitt Investment Consulting, Inc., an Aon Company. 12
In July of 2014 NCRS Staff restated the legacy benchmark, and created the Implementation
benchmark with the intention of aligning the historical policy exposures more consistently with the
current policy structure
– Public Equity, Private Equity, Non-Core Real Estate, Opportunistic Fixed Income, Investment
Grade Fixed Income, Inflation Sensitive, Core Real Estate, and Multi-Strategy
The methodology of the restatement is described below;
– Public Equity – 100% MSCI ACWI IMI for all time periods
– Private Equity – Burgiss Group 50% Buyout, 20% Venture Cap, and 30% Spec Sit & Distressed
– Non-Core RE – Burgiss Group 80% U.S. Non-Core RE, 20% Non-U.S. Non-Core RE
– Opportunistic Fixed Income – 50% HFRX Distressed Securities, 20% HFRX Relative Value, 15%
Credit Suisse Leveraged Loan, and 15% BOAML High Yield
– Investment Grade Fixed Income – Prior to July 2014, 100% BOAML Core Investment Grade; July
2014 through present, transitional weighting comprised of the BOAML Core Investment Grade
and iMoneyNet
– Inflation Sensitive – Dynamically weighted using underlying components (Energy, Timber, Public
Natural Resources, and Real Assets & Other Diversifiers)
– Core Real Estate - Prior to May 2007, 100% NCREIF ODCE; May 2007 thru present, 80%
NCREIF ODCE and 20% FTSE EPRA/NAREIT Global Index
– Multi-Strategy – Dynamically weighted combination of the HFRX ED: Multi-Strategy and the
market value weighted benchmarks for any other total fund strategies within the Portfolio
NCRS Benchmark Restatement
Implementation Benchmark (restatement #1)

Aon Hewitt | Retirement and Investment
Proprietary & Confidential
Investment advice and consulting services provided by Aon Hewitt Investment Consulting, Inc., an Aon Company. 13
In July of 2014 NCRS Staff also created the Long-Term Policy Benchmark with the intention of
replicating the projected volatility of the investment program utilizing broad traditional asset classes
The Long-Term Policy benchmark is comprised of;
– 57% MSCI All Country World Investable Market Index
– 33% Bank of America Merrill Lynch 5+ Years U.S. Treasury Index
– 6% Dow Jones-UBS Commodities Index
– 4% Bank of America Merrill Lynch 1-3 Years U.S. Inflation-Linked Treasury Index.
NCRS Benchmark Restatement
Long-Term Policy Benchmark (restatement #2)

Aon Hewitt | Retirement and Investment
Proprietary & Confidential
Investment advice and consulting services provided by Aon Hewitt Investment Consulting, Inc., an Aon Company. 14
The analytic below represents the performance of the NCRS benchmarks over time
The legacy benchmark and implementation benchmark are both intended to represent the actual
exposures of the investment program over time
– The legacy benchmark is the most representative depiction of the Plan’s asset allocation
exposures over time
– The most meaningful difference between the benchmarks is the Implementation Benchmarks
higher relative weight to international equities
NCRS Benchmark Performance
(Legacy Benchmark vs Implementation Benchmark)
3.15 3.08
0.80
0.90
1.00
1.10
1.20
1.30
1.40
-
0.50
1.00
1.50
2.00
2.50
3.00
3.50
6/1
/199
7
12
/1/1
99
7
6/1
/199
8
12
/1/1
99
8
6/1
/199
9
12
/1/1
99
9
6/1
/200
0
12
/1/2
00
0
6/1
/200
1
12
/1/2
00
1
6/1
/200
2
12
/1/2
00
2
6/1
/200
3
12
/1/2
00
3
6/1
/200
4
12
/1/2
00
4
6/1
/200
5
12
/1/2
00
5
6/1
/200
6
12
/1/2
00
6
6/1
/200
7
12
/1/2
00
7
6/1
/200
8
12
/1/2
00
8
6/1
/200
9
12
/1/2
00
9
6/1
/201
0
12
/1/2
01
0
6/1
/201
1
12
/1/2
01
1
6/1
/201
2
12
/1/2
01
2
6/1
/201
3
12
/1/2
01
3
6/1
/201
4
12
/1/2
01
4
Legacy Benchmark Implementation Benchmark U.S. Performance Relative to MSCI ACWI IMI
U.S. Outperforms
U.S. Underperforms

Aon Hewitt | Retirement and Investment
Proprietary & Confidential
Investment advice and consulting services provided by Aon Hewitt Investment Consulting, Inc., an Aon Company. 15
Benchmark Review
The table to the left depicts the underlying
benchmarks utilized for Total Fund
Benchmarking
AHIC is comfortable with all the
benchmarks utilized within the Total Fund
Benchmark
Where possible, AHIC has a preference
for static policy weights within an asset
class over dynamic weighting
For private equity and non-core real
estate we often use public markets +
premium and NCREIF ODCE + premium,
respectively
– We are comfortable with the inclusion
of Burgiss in Total Fund Benchmark,
and it is a practice we are beginning to
see more often
Policy Weight AHIC Recommendation Comments
Public Equity 42% --
MSCI ACWI IMI Index -- No Change
MSCI ACWI IMI Index (beta adjusted) -- No Change
Private Equity 6% --
Burgiss Group Buyout 3.0% No Change
Burgiss Group Venture Capital 1.2% No Change
Burgiss Group Special Situations & Distressed 1.8% No Change
Non-Core Real Estate 3% --
Burgiss Group U.S. Non-Core 2.4% No Change
Burgiss Group Non-U.S. Non-Core 0.6% No Change
Opportunistic Fixed Income 7% --
HFRX Distressed Securities Index 3.5% No Change
HFRX Relative Value Index 1.4% No Change
Credit Suisse Leveraged Loan Index 1.1% No Change
BOAML High Yield Index 1.1% No Change
Investment Grade Fixed Income 28% --
iMoneyNet First Tier Institutional MM 2.8% No Change
BOAML 5+ Years Governments 7.6% No Change
BOAML 5+ Years Investment Grade Corporates 8.8% No Change
BOAML Mortgage Master 8.8% No Change
Inflation Sensitive 6% --
BOAML 1-3 Years TIPS Index 2.0% No Change
Bloomberg Commodity Index 1.0% No Change
Dynamic benchmark of Private Natural
Resources or Other Real Assets and
Diversifiers
3.0% No Change
Prefer Static Weights
relative to dynamic
weights.
Core Real Estate 5% --
NCREIF ODCE Index 4.0% No Change
FTSA/EPRA/NAREIT Global Index 1.0% No Change
Multi-Strategy 2% --
Dynamic benchmark of HFRX Multi-Strategy
Hedge Fund Index, and other utilized
benchmarks
-- No Change
Cash
iMoneyNet First Tier Institutional MM 1% No Change
Asset Class
Typically AHIC recommends
the use of Public Equity +
Premium. However we are
comfortable with peer
benchmarking.
Typically AHIC recommends
the use of NCREIF ODCE +
Premium. However we are
comfortable with peer
benchmarking.
Prefer HFRI Indicies
relative to HFRX indicies.

Aon Hewitt | Retirement and Investment
Proprietary & Confidential
Investment advice and consulting services provided by Aon Hewitt Investment Consulting, Inc., an Aon Company. 16
NCRS Benchmark Findings
Consistent with other institutional investors, the NCRS Total Fund benchmark has evolved over time, and additional
diversifying asset classes have been added
The Legacy Benchmark is the most relevant proxy for NCRS relative performance comparisons
We understand the desire to restate the NCRS benchmark in a more consistent streamlined manner (Implementation
Benchmark)
– The Implementation Benchmark and the Legacy Benchmark have produced similar investment returns over time
– The largest contributor to the return disparity over time has been the structure of the equity component
We believe analyzing performance over long time periods relative to a broad mandate, traditional asset class structure,
is useful in understanding the relative value of investing in non-traditional asset classes (Long-Term Policy Benchmark)
We believe the Implementation Benchmark and the Long-Term Policy Benchmark can be used to draw inferences on
the relative investment performance of the Plan over the last 10 years and longer
We are comfortable with the IAC reviewing investment performance relative to the implementation benchmark going
forward
Recommendation
We recommend including a policy weight to U.S. and non-U.S. equity during the historical periods, prior to the legacy
benchmark’s usage of the MSCI ACWI IMI

Aon Hewitt | Retirement and Investment
Proprietary & Confidential
Investment advice and consulting services provided by Aon Hewitt Investment Consulting, Inc., an Aon Company. 17
Our Discussion Today
Section 1 Project Overview
Section 2 NCRS Benchmark Composition
Section 3 How to measure the success of an institutional investment the program?
Section 4 Performance Reporting and Plan Structure
Section 5 Appendix

Aon Hewitt | Retirement and Investment
Proprietary & Confidential
Investment advice and consulting services provided by Aon Hewitt Investment Consulting, Inc., an Aon Company. 18
Introduction
Most important decision for long-term investment results is asset allocation
Step 1: Asset Liability Study
– Provides fiduciaries with an understanding of the dynamic relationship between plan assets and
liabilities over time
– Provides an evaluation of the impact of a Plan’s level of risk on future economic cost
– Provides the framework for stakeholders to make the first decision in setting asset allocation
policy: Determine level of risk that is appropriate (i.e. split between return-seeking and risk-
reducing assets) in the context of the Plan’s liabilities
Step 2: Setting Asset Allocation
– Translate the results of the Asset/Liability study into an actionable, strategic asset allocation
– Goal of Asset Allocation:
• Efficiently and prudently implement previously established return-seeking/risk-reducing
split
• Improve results with better diversification
• Increase risk/reward trade-off Improve cost savings (reward) and/or lower risk

Aon Hewitt | Retirement and Investment
Proprietary & Confidential
Investment advice and consulting services provided by Aon Hewitt Investment Consulting, Inc., an Aon Company. 19
Setting Asset Allocation: Key Qualitative Factors
Key Drivers & Considerations Client XYZ
Governance
• Oversight & resources
• Speed of action
• (Freedom from) scrutiny
Strategic
- Public scrutiny
Flexible
+ Skilled investment staff with discretion
+ Expert oversight
+ Ability to allocate to broad range of asset strategies
Time Horizon
• Life span
• Cash flow position
• Ability to access less liquid opportunities
• Ability to capture illiquidity premium
Short
- Large cash outflows
- Risk of plan closing
Long
+ Open plan
+ Ability to tolerate some illiquidity
Portfolio Size
• Ability to diversify
• Market impact
• Potential for closet indexing
• Fees
Small
Large
+ Access to skilled managers
+ Ability to diversify (alternatives)
+ Size allows fee negotiation
- Large market impact
- Large # of managers/strategies

Aon Hewitt | Retirement and Investment
Proprietary & Confidential
Investment advice and consulting services provided by Aon Hewitt Investment Consulting, Inc., an Aon Company. 20
Evaluation of Asset Allocation Decisions and Investment Performance
Evaluating asset allocation decisions over long periods of times is challenging; however, three ways
to accomplish this include:
– Investment Objective: Performance relative to the actuarial assumed rate of return, which is
currently 7.25%
– Peers: Risk adjusted performance metrics relative to peers (recognizing that each plan has
unique circumstances that drive differences in long-term asset allocation)
– Opportunity Set: Performance relative to the World Market Opportunity Set

Aon Hewitt | Retirement and Investment
Proprietary & Confidential
Investment advice and consulting services provided by Aon Hewitt Investment Consulting, Inc., an Aon Company. 21
Absolute Nominal Target Rate of Return
NCRS
Absolute Nominal
Target Rate of Return
8.7%
6.1% 5.6%
6.8% 7.25% 7.25% 7.25% 7.25%
0.0%
2.0%
4.0%
6.0%
8.0%
10.0%
12.0%
5-Year 10-Year 15-Year Since July 1997
As of December 31, 2014
0.00%
1.00%
2.00%
3.00%
4.00%
5.00%
6.00%
7.00%
8.00%
9.00%
6/1
/200
7
9/1
/200
7
12
/1/2
00
7
3/1
/200
8
6/1
/200
8
9/1
/200
8
12
/1/2
00
8
3/1
/200
9
6/1
/200
9
9/1
/200
9
12
/1/2
00
9
3/1
/201
0
6/1
/201
0
9/1
/201
0
12
/1/2
01
0
3/1
/201
1
6/1
/201
1
9/1
/201
1
12
/1/2
01
1
3/1
/201
2
6/1
/201
2
9/1
/201
2
12
/1/2
01
2
3/1
/201
3
6/1
/201
3
9/1
/201
3
12
/1/2
01
3
3/1
/201
4
6/1
/201
4
9/1
/201
4
12
/1/2
01
4
Rolling 10-Year Annualized Returns
Total Pension Plan Implementation Benchmark Absolute Nominal Target Rate of ReturnNCRS Implementation Benchmark Absolute Nominal Target Rate of Return

Aon Hewitt | Retirement and Investment
Proprietary & Confidential
Investment advice and consulting services provided by Aon Hewitt Investment Consulting, Inc., an Aon Company. 22
NCRS Results Relative to Peers
NCRS Relative to BNY Mellon Universe as of December 31, 2014
6.2
10.1
8.7
6.1 6.2
11.4
9.5
6.4
0.0%
2.0%
4.0%
6.0%
8.0%
10.0%
12.0%
1-Year 3-Year 5-Year 10-Year
NCRS BNY Mellon >$1 billion
On a risk adjusted basis, the Plan has
produced strong investment
performance over the trailing 10-year
period
The Plan has produced a return lower
than the median over ten years, but has
incurred the lowest level of volatility
NCRS

Aon Hewitt | Retirement and Investment
Proprietary & Confidential
Investment advice and consulting services provided by Aon Hewitt Investment Consulting, Inc., an Aon Company. 23
World Market Opportunity Set
The World Market Opportunity Set represents the sum total of the entire global investment
opportunity set including global equities, global bonds, real estate, and alternatives
Total Pension Plan
$3.12
World Market Opportunity Set
$2.94
$-
$0.50
$1.00
$1.50
$2.00
$2.50
$3.00
$3.50
Jun
-97
Ma
r-98
De
c-98
Sep
-99
Jun
-00
Ma
r-01
De
c-01
Sep
-02
Jun
-03
Ma
r-04
De
c-04
Sep
-05
Jun
-06
Ma
r-07
De
c-07
Sep
-08
Jun
-09
Ma
r-10
De
c-10
Sep
-11
Jun
-12
Ma
r-13
De
c-13
Sep
-14
Growth of a Dollar17 Years 3 months
NCRS

Aon Hewitt | Retirement and Investment
Proprietary & Confidential
Investment advice and consulting services provided by Aon Hewitt Investment Consulting, Inc., an Aon Company. 24
(This page left blank intentionally)

Aon Hewitt | Retirement and Investment
Proprietary & Confidential
Investment advice and consulting services provided by Aon Hewitt Investment Consulting, Inc., an Aon Company. 25
Agenda Tracker
Section 1 Project Overview
Section 2 NCRS Benchmark Composition
Section 3 How to measure the success of an institutional investment the program?
Section 4 Performance Reporting and Plan Structure
Section 5 Appendix
Aon Hewitt | Retirement and Investment
Proprietary & Confidential
Investment advice and consulting services provided by Aon Hewitt Investment Consulting, Inc., an Aon Company. 26
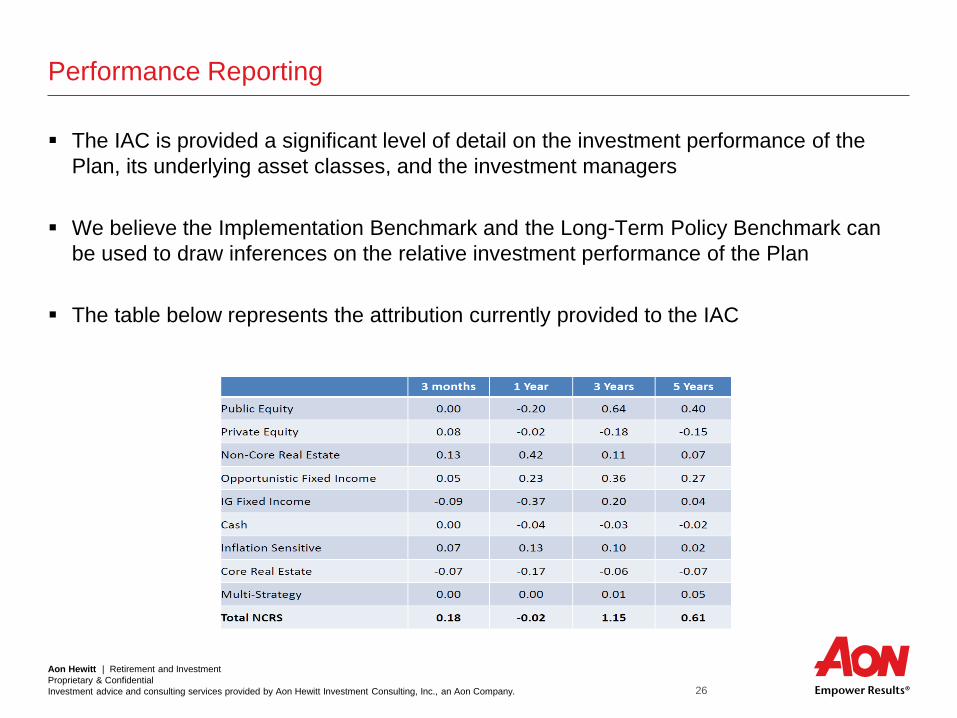
Performance Reporting
The IAC is provided a significant level of detail on the investment performance of the
Plan, its underlying asset classes, and the investment managers
We believe the Implementation Benchmark and the Long-Term Policy Benchmark can
be used to draw inferences on the relative investment performance of the Plan
The table below represents the attribution currently provided to the IAC

Aon Hewitt | Retirement and Investment
Proprietary & Confidential
Investment advice and consulting services provided by Aon Hewitt Investment Consulting, Inc., an Aon Company. 27
Performance Attribution (Total Fund Attribution)
Performance Attribution allows individuals to more easily understand the drivers of
relative performance within an investment program
– Below is a series of charts that represent similar information provided within the IAC
materials, but in a format that allows readers to draw quick conclusions

Aon Hewitt | Retirement and Investment
Proprietary & Confidential
Investment advice and consulting services provided by Aon Hewitt Investment Consulting, Inc., an Aon Company. 28
Performance Attribution (Asset Class Attribution)
Attribution can also used perform deeper analysis into the relative performance an asset
class
This client had one active investment manager who had strong performance for the
period, but the asset class performance was relatively flat?
– A Committee member could flip to the attribution page and see that the active
investment manager added 19 bps of relative performance, but this was offset by the
negative benchmark effect (-14 bps)
– An overweight allocation to large cap equities during a period where large cap
underperformed the asset class benchmark caused the benchmark effect of -14 bps
– Manager selection added value, but asset class structure detracted during the period
Aon Hewitt | Retirement and Investment
Proprietary & Confidential
Investment advice and consulting services provided by Aon Hewitt Investment Consulting, Inc., an Aon Company. 29
Private Equity Usage
For a Plan the size of NCRS we believe the benefits of private equity exposure are
meaningful
Academic research1 increasingly suggests that private equity, particularly buyout funds,
outperform the public equity market, even after adjusting for beta/leverage
Additionally, AHIC believes that private equity is a form of equity investing which allows
for a higher likelihood of alpha than traditional equity
– Alpha produced in any asset class can be a great source of diversification and return
As private equity requires significant time and resources, we recommend clients consider
whether they have an allocation of sufficient size to overcome the semi-fixed costs of
oversight
– We believe the size of the NCRS portfolio provides significant scale to efficiently
oversee a diversified private equity portfolio
1Harris, R., Jenkinson, T., and S. Kaplan. 2015. “How Do Private Equity Investments Perform Compared to Public Equity?”
http://papers.ssrn.com/sol3/papers.cfm?abstract_id=2597259

Aon Hewitt | Retirement and Investment
Proprietary & Confidential
Investment advice and consulting services provided by Aon Hewitt Investment Consulting, Inc., an Aon Company. 30
Peer Usage
While AHIC understands the desire to standardize the peer information utilized, we believe it will be
very difficult to use a consistent grouping of peers for all analysis
There are times where an analysis of a smaller number of very similar plans is helpful (particular data
points on extremely similar peers), and there are scenarios where having a deeper sample size is
important to draw appropriate conclusions (statistical analysis)
– In a world where perfect information existed consistent peer analysis would be ideal
– Different vendors have access to different sources of information, however, there is likely
considerable overlap across datasets
The peer group presented on page 23 of this report utilized a larger sample size, illustrating the
benefit of a larger sample sizes for statistical analysis
– If this chart were shown with less plans it would be very difficult to visualize and understand the
risk return tradeoff available in the market
We believe as long as the peer universe is appropriate and robust, having the same samples on a
consistent basis is not necessarily important

Aon Hewitt | Retirement and Investment
Proprietary & Confidential
Investment advice and consulting services provided by Aon Hewitt Investment Consulting, Inc., an Aon Company. 31
International Currency Exposure
NCRS currently has exposure to equity investments denominated in currencies other
than the U.S. dollar, as the dollar has strengthened, these investments have struggled, in
part due to weakening in their base currencies
While currency impacts can be meaningful over shorter time periods, they tend to wash
out over very long periods
The challenge is how to deal with currency volatility in the short / intermediate-term
Nearly none of AHIC’s clients hedge currency exposure within their international equity
portfolios on a strategic basis
– Some clients hedge on a tactical basis, which AHIC is supportive of
Some of our clients hedge the currency exposure within their international fixed income
The next slide highlights to pros and cons to currency hedging

Aon Hewitt | Retirement and Investment
Proprietary & Confidential
Investment advice and consulting services provided by Aon Hewitt Investment Consulting, Inc., an Aon Company. 32
Currency Hedging – Pros & Cons
Pros Cons
Reduce return volatility Higher correlations reduce diversification benefits
Reduce volatility drag Costs of hedging negates any positive returns
Liabilities in home currency Administrative complexity
Execute tactical views (stronger dollar) No significant volatility reduction within equities
Cash flow volatility
Over the long-run, currency movements tend to be a wash. No significant long-term
positive return from hedging currency is expected, after factoring for hedging costs.
MSCI EAFE Return Differences 0% Hedged versus 100% Hedged (Through December 2014)

Aon Hewitt | Retirement and Investment
Proprietary & Confidential
Investment advice and consulting services provided by Aon Hewitt Investment Consulting, Inc., an Aon Company. 33
Forward-Looking Risk/Return Analysis (10 Year Assumptions)*
Global hedged appears superior with the highest expected return, however when you
factor in the cost of hedging the return advantage will disappear
Hedging does not significantly reduce expected risk for global equities, over the long-
term
Nearly none of AHIC’s clients have a policy to hedge international equity currency
exposure
*Global hedged portfolio assumes the major developed currencies are hedged (GBP, Euro & JPY). Liability proxy is
long credit bond. Efficient frontiers assume two asset portfolio (equities and long credit bonds).
3.0%
4.0%
5.0%
6.0%
7.0%
8.0%
10.0% 11.0% 12.0% 13.0% 14.0% 15.0% 16.0% 17.0% 18.0% 19.0%
Exp
ecte
d R
etu
rn
Annualized Expected Risk
Efficient Frontier (Forward-Looking)
Global Hedged Global Unhedged US Equity

Aon Hewitt | Retirement and Investment
Proprietary & Confidential
Investment advice and consulting services provided by Aon Hewitt Investment Consulting, Inc., an Aon Company. 34
Performance Reporting and Plan Structure Findings
We believe the IAC receives sufficient information to evaluate the performance of the Plan
– We believe the quality of the reporting could be strengthened by providing attribution analytics for
the Total Plan and underlying asset classes
We believe the use of private equity is beneficial from a diversification, and nominal performance
perspective
Creating a standard peer group would be administratively difficult, and we feel it would not
meaningfully increase the value of peer analysis
– As long as the peer sample is robust and appropriate, we believe it will provide relevant insight
– NCRS is also a client of CEM who can create custom peer groups for the IAC
AHIC clients, in general, do not hedge international equity exposure on a strategic basis, but some do
so for their international fixed income exposure
Recommendation
We recommend the inclusion of Total Fund and asset class attribution analytics in the quarterly IAC
reporting to allow for greater insight into the drivers of relative performance

Aon Hewitt | Retirement and Investment
Proprietary & Confidential
Investment advice and consulting services provided by Aon Hewitt Investment Consulting, Inc., an Aon Company. 35
Agenda Tracker
Section 1 Project Overview
Section 2 NCRS Benchmark Composition
Section 3 How to measure the success of an institutional investment the program?
Section 4 Performance Reporting and Plan Structure
Section 5 Appendix

Aon Hewitt | Retirement and Investment
Proprietary & Confidential
Investment advice and consulting services provided by Aon Hewitt Investment Consulting, Inc., an Aon Company. 36
High Yield Fixed Income: BofA Merrill Lynch US High Yield Index
General Characteristics
– Size: $1,399 billion
– Number of Issues: 2,326
– Average Credit Quality: B+
– Yield to Worst: 6.04%
– Modified Adjusted Duration: 4.95yrs
– Effective Duration: 4.41yrs
BB, 47%
B, 40%
CCC, 13%
CC, 0% C, 0% D, 0%
Quality Breakdown
Industrials, 87%
Financial, 10%
Utility, 3%
Industry Breakdown
Note: Data sourced from BofA Merrill Lynch and is as of April 30, 2015

Aon Hewitt | Retirement and Investment
Proprietary & Confidential
Investment advice and consulting services provided by Aon Hewitt Investment Consulting, Inc., an Aon Company. 37
Government Fixed Income: BofA Merrill Lynch 5+ Year US Treasury
Index
General Characteristics
– Size: $3,961 billion
– Number of Issues: 99
– Average Credit Quality: AAA
– Yield to Worst: 2.11%
– Modified Adjusted Duration: 10.37yrs
– Effective Duration: 10.63yrs
26% 26%
10%
3%
35%
0%
5%
10%
15%
20%
25%
30%
35%
40%
4 - 6 6 - 8 8 - 10 10 - 12 12+P
erc
en
tag
e o
f In
de
x
Duration (yrs)
Duration (Effective) Distribution
Note: Data sourced from BofA Merrill Lynch and is as of April 30, 2015

Aon Hewitt | Retirement and Investment
Proprietary & Confidential
Investment advice and consulting services provided by Aon Hewitt Investment Consulting, Inc., an Aon Company. 38
IG Corporate Fixed Income: BofA Merrill Lynch 5+ Year US Corporate
Index
General Characteristics
– Size: $3,158 billion
– Number of Issues: 4,040
– Average Credit Quality: A-
– Yield to Worst: 3.80%
– Modified Adjusted Duration: 9.70yrs
– Effective Duration: 9.82yrs
BBB, 50%
A, 38%
AA, 10% AAA, 1%
Quality Breakdown
Industrials, 69%
Financial, 22%
Utility, 9%
Industry Breakdown
Note: Data sourced from BofA Merrill Lynch and is as of April 30, 2015

Aon Hewitt | Retirement and Investment
Proprietary & Confidential
Investment advice and consulting services provided by Aon Hewitt Investment Consulting, Inc., an Aon Company. 39
Securitized Fixed Income: BofA Merrill Lynch US Mortgage Backed
Securities Index
General Characteristics
– Size: $5,200 billion
– Number of Issues: 456
– Average Credit Quality: AAA
– Yield to Worst: 2.19%
– Modified Adjusted Duration: 4.47yrs
– Effective Duration: 3.97yrs
1% 2%
17%
27%
32%
19%
1%
0%
5%
10%
15%
20%
25%
30%
35%
<1 1 2 3 4 5 >5P
erc
en
tag
e o
f In
de
x
Duration (yrs)
Duration (Effective) Distribution
Note: Data sourced from BofA Merrill Lynch and is as of April 30, 2015

Aon Hewitt | Retirement and Investment
Proprietary & Confidential
Investment advice and consulting services provided by Aon Hewitt Investment Consulting, Inc., an Aon Company. 40
Inflation-Protection Fixed Income: BofA Merrill Lynch 1-3 Year US
Inflation-Linked Treasury Index
General Characteristics
– Size: $181 billion
– Number of Issues: 6
– Average Credit Quality: AAA
– Yield to Worst: -0.99%
– Modified Adjusted Duration: 2.20yrs
– Effective Duration: 2.85yrs
61%
39%
0%
10%
20%
30%
40%
50%
60%
70%
2 - 3 3 - 4P
erc
en
tag
e o
f In
de
x
Duration (yrs)
Duration (Effective) Distribution
Note: Data sourced from BofA Merrill Lynch and is as of April 30, 2015

Aon Hewitt | Retirement and Investment
Proprietary & Confidential
Investment advice and consulting services provided by Aon Hewitt Investment Consulting, Inc., an Aon Company. 41
Inflation Sensitive: Bloomberg Commodity Index
General Characteristics
– Introduction: July, 1998 (formerly known as the Dow
Jones-UBS Commodity Index)
– Number of Issues: 22 exchange-traded futures, which
represent 20 different commodities
– Weighting: Commodity weightings are based on
production and liquidity; no related group of
commodities constitutes more than 33% of the index,
and no single commodity constitutes more than 15%
– Review Frequency: Reweighted and rebalanced
annually on a price-percentage basis
– Opinion: Weighting restrictions on individual
commodities and commodity groups promote
diversification
Energy, 33%
Agriculture, 29%
Industrial Metals, 17%
Precious Metals, 16%
Livestock, 5%
Commodity Sector Breakdown
Gold, 12%
WTI Crude Oil, 8%
Brent Crude Oil, 8%
COMEX Copper, 8%
Natural Gas, 8%
Corn, 7% RBOB Gasoline, 5%
Soybeans, 5%
Aluminum, 5%
Silver, 4%
ULS Diesel, 4%
Soybean Metal, 3%
Soybean Oil, 3%
Sugar, 3%
Chicago Wheat, 3%
Live Cattle, 3%
Nickel, 2% Zinc, 2% Coffee, 2%
Cotton, 2% Lean Hogs, 2%
Kansas City Wheat, 1%
Commodity Breakdown
Note: Data sourced from Bloomberg and is as of March 31, 2015

Aon Hewitt | Retirement and Investment
Proprietary & Confidential
Investment advice and consulting services provided by Aon Hewitt Investment Consulting, Inc., an Aon Company. 42
Public Equity: MSCI ACWI IMI Index
General Characteristics
– Size: $43,404 billion
– Number of Securities: 8,551
– Methodology: Market Capitalization Weighted
– Market Coverage: Approximately 99% of
investable market universe
– 23 Developed Markets; 23 Emerging
Markets
– Large, mid, and small market cap
representation
Note: Data sourced from MSCI and is as of March 31, 2015
Market Cap
(USD Billions)
Index Weight
(%)
Apple 729.76 1.68
Exxon Mobil 359.93 0.83
Microsoft 318.36 0.73
Johnson & Johnson 281.59 0.65
Wells Fargo 268.1 0.62
General Electric 249.15 0.57
Nestle 243.69 0.56
Novartis 227.71 0.52
JPMorgan Chase 226.46 0.52
Procter & Gamble 221.41 0.51
Total 3,126.16 7.19
Top 10 Constituents

Aon Hewitt | Retirement and Investment
Proprietary & Confidential
Investment advice and consulting services provided by Aon Hewitt Investment Consulting, Inc., an Aon Company. 43
Opportunistic Fixed Income: Credit Suisse Leveraged Loan Index
General Characteristics
– Size: $951 billion
– Number of Issues: 1,651
– Average Credit Quality: Split BB
– Yield to Maturity: 5.82%
– Industry Type:
– Defensive: 51%
– Cyclical: 45%
– Energy: 4%
8%
26%
15%
40%
2% 5% 3% 2%
0%
10%
20%
30%
40%
50%
Perc
en
tag
e o
f In
dex
Rating Distribution
Media/Telecom, 15%
Healthcare, 12%
Service, 12% Information Technology, 9%
Gaming/Leisure, 6%
Retail, 5%
Food/Tobacco, 5%
Utility, 4%
Energy, 4%
Manufacturing, 4%
Top 10 Industries Breakdown
Note: Data sourced from Credit Suisse and is as of March 31, 2015

Aon Hewitt | Retirement and Investment
Proprietary & Confidential
Investment advice and consulting services provided by Aon Hewitt Investment Consulting, Inc., an Aon Company. 44
General Characteristics
– Benchmark: Index representing investment returns
of an aggregate of open-end, commingled equity real
estate funds with similar Core investment strategies
– Size: $133 billion
– Index Type: Fund Level
– Pricing: Quarterly
– Number of Active Funds: 23
– Average Leverage: 21.7% (up to 40% allowed)
– Pros: Includes leverage and is net of fees
– Cons: Less properties represented than the NCREIF
Property Index; only represents the Core real estate
market
Opinion: AHIC views the NCREIF ODCE Index as an
appropriate benchmark for core private real estate
Core Real Estate: NCREIF Open End Diversified Core Equity Index
Office, 38%
Apartment, 25%
Retail, 19%
Industrial, 14%
Other, 3% Hotels, 1%
Property Type Diversification
West, 39%
East, 33%
South, 19%
Mid-West, 9%
Regional Diversification
Note: Data sourced from NCREIF and is as of March 31, 2015

Aon Hewitt | Retirement and Investment
Proprietary & Confidential
Investment advice and consulting services provided by Aon Hewitt Investment Consulting, Inc., an Aon Company. 45
General Characteristics
– Size: $1,465 billion
– Number of Constituents: 470
– Dividend Yield: 3.27%
– Pricing: Daily/Real Time
– Diversification:
– International: 55%
– USA: 45%
Public Real Estate: FTSE EPRA/NAREIT Global Index
Diversified, 33%
Retail, 23%
Residential, 14%
Office, 11%
Industrial, 7%
HealthCare, 6%
Hotels, 4%
Self-Storage, 3%
Industry Breakdown
Note: Data sourced from FTSE and is as of April 30, 2015

Aon Hewitt | Retirement and Investment
Proprietary & Confidential
Investment advice and consulting services provided by Aon Hewitt Investment Consulting, Inc., an Aon Company. 46
HFRX Indices
Methodology
• Constituents of all indices are selected from an eligible pool of more than 6,800 funds that report to the HFR Database. These
funds are screened for various reporting characteristics, the level of assets under management, length of track records, unique
fund strategy inclusion, and if open to accepting new investments via a fully transparent managed account format
• Funds included in the HFRX monthly indices must have the following criteria:
• Report monthly returns
• Report net of all fees returns
• Report assets in USD
• Active and accepting new investments
• Have at least $50 Million in assets under management or have been actively trading for at least 24 months
• Funds are grouped by strategy and indices are formulaically calculated on an asset-weighted basis
• Cluster and correlation analyses are performed to group managers by true strategy categories and to eliminate outliers.
Monte Carlo Simulation helps determine the adequate number of managers to replicate each strategy. Selected managers
must provide daily transparency and pass extensive qualitative screening
• Manager investments are then weighted to maximize representation with their group
Source: HFR
Potential Biases
• Survivorship bias as poor performing funds can discontinue posting returns if they so please
• Selection bias due to not including closed funds, the $50 Million AUM restriction and required two year track record
• Small universe of eligible managers due to restrictive inclusion characteristics
• HFR claims that it does not allow data to be back-filled by hedge funds. Additionally, the effects of the back fill bias are reduced with
asset-weighted indices
• Valuation bias is not a concern since side-pockets are excluded from the database
• The investabilty requirement is a better representation of performance accessible to investors in the hedge fund universe than other
hedge fund indices without this requirement

Aon Hewitt | Retirement and Investment
Proprietary & Confidential
Investment advice and consulting services provided by Aon Hewitt Investment Consulting, Inc., an Aon Company. 47
HFRX Indices
Index Biases
• Selection bias refers to the lower likelihood that managers with poor performance will choose to report their returns to index
providers, and that each of the many hedge fund indices includes a small sample of managers in the universe
• Backfill bias refers to the inclusion of managers' historical performance in an index once they decide to report their returns, which
typically doesn't happen until after the track record looks good
• Survivorship bias refers to the fact that hedge funds tend to stop reporting before they close their doors or "blow up" since only
managers with ongoing operations continue to report returns. However, conversely, well performing managers may choose to no
longer report returns once they stop accepting capital, which is may be indicative of asset growth from strong performance

Aon Hewitt | Retirement and Investment
Proprietary & Confidential
Investment advice and consulting services provided by Aon Hewitt Investment Consulting, Inc., an Aon Company. 48
Legal Disclosures and Disclaimers
Investment advice and consulting services provided by Aon Hewitt Investment Consulting, Inc. (“AHIC”).
The information contained herein is given as of the date hereof and does not purport to give information
as of any other date. The delivery at any time shall not, under any circumstances, create any implication
that there has been a change in the information set forth herein since the date hereof or any obligation to
update or provide amendments hereto.
This document is not intended to provide, and shall not be relied upon for, accounting, legal or tax advice
or investment recommendations. Any accounting, legal, or taxation position described in this
presentation is a general statement and shall only be used as a guide. It does not constitute accounting,
legal, and tax advice and is based on AHIC’s understanding of current laws and interpretation.
This document is intended for general information purposes only and should not be construed as advice
or opinions on any specific facts or circumstances. The comments in this summary are based upon
AHIC’s preliminary analysis of publicly available information. The content of this document is made
available on an “as is” basis, without warranty of any kind. AHIC disclaims any legal liability to any
person or organization for loss or damage caused by or resulting from any reliance placed on that
content. AHIC. reserves all rights to the content of this document. No part of this document may be
reproduced, stored, or transmitted by any means without the express written consent of AHIC.
© Aon plc 2015. All rights reserved.

Aon Hewitt | Retirement and Investment
Proprietary & Confidential
Investment advice and consulting services provided by Aon Hewitt Investment Consulting, Inc., an Aon Company. 49
About Aon Hewitt
Aon Hewitt empowers organizations and individuals to secure a better future through innovative talent,
retirement and health solutions. We advise, design and execute a wide range of solutions that enable
clients to cultivate talent to drive organizational and personal performance and growth, navigate
retirement risk while providing new levels of financial security, and redefine health solutions for greater
choice, affordability and wellness. Aon Hewitt is the global leader in human resource solutions, with over
30,000 professionals in 90 countries serving more than 20,000 clients worldwide. For more information,
please visit aonhewitt.com.

Aon Hewitt | Retirement and Investment
Proprietary & Confidential
Investment advice and consulting services provided by Aon Hewitt Investment Consulting, Inc., an Aon Company. 50
(This page left blank intentionally)