asset management of mechanical plant components … · to maintenance station using assetm...
TRANSCRIPT

A white paper issued by: Siemens. © Siemens AG 2013. All rights reserved.
Up to now plant asset management in process industries is fo-cused on monitoring the state of field devices and automation components in context of maintenance management. Much higher economic benefits can be expected from expanding this concept to the monitoring of mechanical assets like pumps, valves, heat exchangers or turbo compressors. This whitepaper gives a survey of functions for condition and per-formance monitoring of mechanical plant assets offered by SIMATIC PCS 7.
Asset Management of Mechanical Plant Components with SIMATIC PCS 7
White Paper Which benefits with respect to operational efficiency, plant availability and maintenance management can be achieved by condition and performance monitoring of mechanical as-sets in SIMATIC PCS 7?

A white paper issued by: Siemens, Sector Industry, IA AS S SM. © Siemens AG 2013. All rights reserved.
White Paper | Asset Management of mechanical plant components in SIMATIC PCS 7 | 2
Contents
1 Introduction ................................................................................................. 4
1.1 Condition Monitoring and Performance Monitoring ........................................ 4
1.2 SIMATIC PCS 7 Maintenance Station .............................................................. 4
1.3 Electrical and Mechanical Assets .................................................................. 5
1.4 Integration of Assets into Maintenance Station using AssetMon ....................... 5
2 Monitoring of Centrifugal Pumps by PumpMon .................................................. 6
2.1 Area of Application ..................................................................................... 6
2.2 Functional Range ....................................................................................... 6
2.2.1 Calculation of Performance Indicators ................................................................. 6
2.2.2 Characteristic Lines .............................................................................................. 6
2.2.3 Alarming .............................................................................................................. 7
2.3 Sensors ..................................................................................................... 8
2.4 Benefit...................................................................................................... 8
3 Monitoring of Control Valves by ValveMon ........................................................ 9
3.1 Area of Application ..................................................................................... 9
3.2 Functional Range ....................................................................................... 9
3.2.1 Characteristic Lines .............................................................................................. 9
3.2.2 Diagnostic Functions ......................................................................................... 10
3.3 Sensors ................................................................................................... 10
3.4 Benefit.................................................................................................... 10
4 Monitoring of Heat Exchangers by HeatXchMon .............................................. 11
4.1 Area of Application ................................................................................... 11
4.2 Functional Range ..................................................................................... 11
4.2.1 Calculation of Performance Indicators ............................................................... 11
4.2.2 Characteristic Surfaces....................................................................................... 12
4.3 Sensors ................................................................................................... 12
4.4 Benefit.................................................................................................... 12
5 Monitoring of Pressure Drop at Plant Components by PressDropMon .................. 13
5.1 Area of Application ................................................................................... 13

A white paper issued by: Siemens, Sector Industry, IA AS S SM. © Siemens AG 2013. All rights reserved.
White Paper | Asset Management of mechanical plant components in SIMATIC PCS 7 | 3
5.2 Functional Range ..................................................................................... 13
5.2.1 Characteristic Lines ............................................................................................ 13
5.2.2 Calculation of Performance Indicators ............................................................... 13
5.2.3 Teach-Function .................................................................................................. 13
5.3 Sensors ................................................................................................... 14
5.4 Benefit.................................................................................................... 14
6 Monitoring of Compressors by CompMon ........................................................ 15
6.1 Area of Application ................................................................................... 15
6.2 Functional Range ..................................................................................... 15
6.2.1 Calculation of Performance Indicators ............................................................... 15
6.2.2 Characteristic Surfaces ("Compressor Maps") ..................................................... 15
6.2.3 Alarming ............................................................................................................ 17
6.3 Sensors ................................................................................................... 17
6.4 Benefit.................................................................................................... 17
7 Extrapolation of Wear Trends and Estimation of Remaining Service Life by TrendMon ............................................................................................................ 18
7.1 Area of Application ................................................................................... 18
7.2 Functional Range ..................................................................................... 18
7.3 Benefit.................................................................................................... 18
8 Monitoring of Typical Process Plant Unit Operations ......................................... 20
8.1 Continuously Stirred Tank Reactors ............................................................. 20
8.2 Rectification- and Distillation-Columns ........................................................ 21
9 Summary .................................................................................................... 22
10 Literature ................................................................................................... 22
A white paper issued by: Siemens, Sector Industry, IA AS S SM. © Siemens AG 2013. All rights reserved.
White Paper | Asset Management of mechanical plant components in SIMATIC PCS 7 | 4
Facing highly competitive markets and intensive global competition no production plant operat-ing companies can afford production downtimes due to defective plant components. Unexpected plant shutdowns cause double financial losses: the costs for corrective maintenance are by far exceeded by the losses due to production down-time [3.]. Increasing plant availability by hard-ware redundancy e.g. of pump systems is quite expensive. The so called B-pumps take space in plants or inventories and are activated or ex-changed in case of pump failures. However this does not guarantee that the substitute pump will not become damaged and fails as well due to operation outside specification limits e.g. caused by wrong dimensioning.
Early problem detection and predictive mainte-nance are therefore very important especially in complex, capital-intensive process plants: they contribute to keep plant availability as high as possible and have a positive influence on prod-uct quality, plant safety and plant lifetime.
Functions for plant asset management today are available in many distributed control systems. Integrated condition and performance monitor-ing allows for state-oriented, predictive mainte-nance.
1.1 Condition Monitoring and Performance Moni-toring
Two different approaches with respect to meth-odology and goals can be distinguished [4.]: Condition Monitoring: determination and
monitoring of plant and component states. Signal source is component behaviour; goal is to maintain availability and protect com-ponents.
Performance Monitoring: determination of plant and component performance (signal source) and monitoring of process opera-tion. Goal is to maximize production per-formance; abnormal component behaviour is a disturbance and reduces performance.
Strategies and software tools are similar. Typical-ly the same measurement values are evaluated. Actually condition and performance monitoring are two different views of the same objects. The following example of a human being shows the
relation between condition and performance monitoring:
Condition monitoring for human being, e.g. to take somebody's temperature: an addi-tional information source (e.g. sensor, here: clinical thermometer, otherwise: process model) delivers information on health sta-tus. This allows for indirect implications on performance, because a sick person suffer-ing from fever typically does not achieve its optimal performance any more.
Performance Monitoring for human being, e.g. 100m sprint. The performance (here: running speed) is measured directly during "operation". This allows for indirect implica-tions on health state (condition) if there is reference information on performance in good (healthy) state. If performance falls significantly below optimum, bad condition can be presumed to be the reason (cause) for that.
1.2 SIMATIC PCS 7 Mainte-nance Station
The Maintenance Station [2.] integrated in SI-MATIC PCS 7 distributed process control system provides a complete status overview of all plant components and offers effective diagnostics, service and maintenance of the plant. The SI-MATIC PCS 7 Maintenance Station maximizes the economic value of the plant assets and reduces total cost of ownership by helping you reduce unplanned downtime and efficiently use maintenance investment
The Maintenance Station is focused on Plant Asset Management and enables preventive and predictive diagnostics, maintenance, and service of the production plant. In parallel to process control, the Maintenance Station makes availa-ble consistent maintenance information and functions for all system components (assets). While the plant operator obtains all relevant information that is necessary for active interven-tion in a process via the operator system, maintenance and service personnel can check the hardware components of the automation system and process their diagnostic messages and maintenance requests
1 Introduction

A white paper issued by: Siemens, Sector Industry, IA AS S SM. © Siemens AG 2013. All rights reserved.
White Paper | Asset Management of mechanical plant components in SIMATIC PCS 7 | 5
1.3 Electrical and Mechani-cal Assets
The Maintenance Station provides the mainte-nance engineer access to electrical or electronic components in the plant, such as intelligent field devices and I/O modules, field bus, controllers, network components, and plant bus, as well as servers and clients of the operator systems. Intelligent field devices boost comprehensive self-diagnostic functions informing the user if the device is completely operative or if there is a deviation from normal state.
Besides electrical assets, mechanical assets and rotating machines are important components of each process plant: pumps, valves, heat ex-changers, compressors etc. In relation to the electrical assets of process measuring and con-trol technology, mechanical assets and plant components are typically more valuable for the plant owner, but they are more vulnerable to wear and tear due to high mechanical stress.
However they are typically not yet integrated into Plant Asset Management systems - in con-trast to intelligent field devices, "non-intelligent" mechanical assets without their own electronic and communication interface do not appear by themselves as active objects in a distributed control system (DCS). Only a few very large and valuable mechanical assets (e.g. compressor stations) feature their own dedicated diagnostic systems. The subsequent installation of dedicat-ed sensors for condition monitoring only, like structure-borne sound sensors, vibration sensors or temperature sensors is cost intensive. Now - how to achieve a cost-efficient monitoring of mechanical assets in a DCS?
The answer: ready-made function blocks for certain classes of common mechanical assets provide reliable condition and performance monitoring via intelligent evaluation of sensor signals already available in the DCS. An installa-tion of additional dedicated condition monitor-ing sensors is therefore not required.
These ready-made function blocks can evaluate several analog and digital values and draw logi-cal conclusions from the combination of several measurement variables. The blocks themselves are designed purely for diagnostic purposes and generate warnings in case of unfavourable oper-ation conditions or violation of wear limits. If desired, an active intervention into plant opera-tion can be realized by wiring of function block output variables, but is not implemented com-pulsory inside the function blocks. This means
that they can be deployed, or even retrofitted, without the risk of affecting the process.
The whitepaper at hand offers a broad survey on monitoring of mechanical assets. More detailed information can be found in the literature cited in the text, e.g. dedicated application notes on special topics like pump monitoring.
1.4 Integration of Assets in-to Maintenance Station using AssetM
Mechanical assets like pumps, motors, centrifu-gals or heat exchangers are represented in the SIMATIC PCS 7 Maintenance Station via proxy objects wherein logical rules for generation of maintenance requests are implemented.
The AssetM (APL-Version of AssetMon from Standard Library) is a universal proxy function block for mechanic and process assets in the Maintenance Station of Simatic PCS 7. It is locat-ed in the hierarchy folder of the Maintenance Station and not in the normal plant hierarchy. Its faceplate therefore appears in the Maintenance Station and not in the Operator Station. The AssetM function block generates maintenance requests (messages) for maintenance personal, no alarms or warnings for the plant operator.
The Electronic Device Description (EDD) contain-ing the master data of the plant component is attached to the AssetM function block, allowing to access the mechanical asset like an intelligent field device in the context of asset management.

A white paper issued by: Siemens, Sector Industry, IA AS S SM. © Siemens AG 2013. All rights reserved.
White Paper | Asset Management of mechanical plant components in SIMATIC PCS 7 | 6
Pumps are one of the most common rotating machines in process plants. The PCS 7 Add-on product PumpMon [7.] offers a cost-effective solution for monitoring and diagnosis of centrif-ugal pumps. It is based on an intelligent combi-nation and logical interpretation of measured process values which are (mostly) already avail-able in the DCS, in contrast to high-end condi-tion monitoring systems based on dedicated additional sensors, e.g. vibration sensors or structure-borne sound sensors.
2.1 Area of Application
The function block PumpMon can be used for electrically driven centrifugal pumps with both constant and variable speed.
Typical application examples:
Pumps that fail more frequently than the average,
Pumps that are in danger of cavitation, e.g. in water/wastewater sector,
Pumps where chemical fouling occurs,
Pumps that are operated in another way than initially planned,
Pumps that show unaccountable variations in power consumption,
Applications where the designated behav-iour and performance of pumps is to be proven.
2.2 Functional Range
2.2.1 Calculation of Performance Indicators
Delivery height (pump head),
Mechanic and hydraulic power,
Hydraulic efficiency,
Net Positive Suction Head (NPSH-value),
„Load distribution“: statistic distribution of flow values.
2.2.2 Characteristic Lines
Figure 2-1: PumpMon faceplate, delivery height losses e.g. due to gas conveyance
2 Monitoring of Centrifugal Pumps by PumpMon

A white paper issued by: Siemens, Sector Industry, IA AS S SM. © Siemens AG 2013. All rights reserved.
White Paper | Asset Management of mechanical plant components in SIMATIC PCS 7 | 7
Figure 2-2: Power and efficiency characteristic. Electric power is still a the olive green characteristic line, but hydraulic power is less than expected, i.e. the actual efficiency (in transformation from mechanic shaft power to hydraulic delivery power) is below the respective or-ange line.
Figure 2-3: Npsh-characteristic during intended operation of the pump
Delivery height characteristic: display of expected delivery height as a function of flow (in case of speed-controlled pumps converted via the current speed), with min-imum and rated flow, „live“ actual operating point and relative/absolute deviation of op-erating point from characteristic line.
Power characteristic: display of required (mechanical) pump power as a function of flow, with „live“ operating point und relative deviation; in addition display of the ex-pected hydraulic pump efficiency as a func-tion of flow with calculated actual efficien-cy.
NPSH characteristic: logarithmic display of the NPSHr value required for cavitation-free operation as a function of flow, with actual NPSHa value.
Histograms: statistical evaluation of pump operating states with respect to flow (pump load) and cavitation reserve.
2.2.3 Alarming
The function block offers the following diagnos-tic functions for warning operators in case of unfavourable operating states:
Limit violations of power values,
Flow lower than minimal flow - extreme turndown, danger of overheating,
Flow higher than nominal flow - overload,
Deviation of operating point from delivery height characteristic, i.e. loss of delivery height - indicates gas conveyance, cavitation or blockage,
Deviation of operating point from power characteristic,
Deviation of operating point from efficiency characteristic,
NPSH actual value approaching the NPSH required characteristic - early warning with respect to cavitation.
Different results of the calculations performed by PumpMon are relevant for different target groups working in a process plant, and differ with respect to urgency.
Diagnoses like actual blockage or dry run have to be immediately announced as an alarm to the operator, because these operating conditions will destroy the pump in a short time. An auto-matic emergency stop of the pump is normally not initiated by PumpMon, but rather by binary interlock logics, e.g. in case of closed valves. In principle, the interlocks can be augmented by evaluation of binary output variables of Pump-Mon.
Other operating conditions like e.g. cavitation will result in pump damage after some time - however it is advisable to react promptly any-way. In this case diagnosis information has to be announced to the plant operator and to mainte-nance personal.
Hints like "Pump efficiency is more than 10% below characteristic line" do not call for immedi-ate action, but are helpful to find optimization potential or can be used for predictive mainte-nance planning.
Following these considerations, it is reasonable to evaluate the information created by PumpMon in a target group oriented way.
A maintenance request announced by a mainte-nance message is not generated by the Pump-Mon function block itself, but by the associated AssetM function block [6.], c.f. section 1.4.

A white paper issued by: Siemens, Sector Industry, IA AS S SM. © Siemens AG 2013. All rights reserved.
White Paper | Asset Management of mechanical plant components in SIMATIC PCS 7 | 8
2.3 Sensors Relevant process sensors for monitoring of cen-trifugal pumps:
Effective electrical power intake of motor
Flow rate of pumped medium
Pump intake pressure and pump delivery pressure.
For cavitation monitoring additionally:
Temperature of pumped medium.
For variable speed pumps additionally:
Pump speed.
These signals have to be provided by signal links or specified in case of constant values (e.g. air pressure, often also intake pressure or tempera-ture of pumped medium). If the frequency con-verter delivers the mechanical (shaft) power of the motor, this value is also linked to PumpMon.
2.4 Benefit The diagnostic logic of PumpMon can detect the following unfavourable operating states:
Blockage
Dry run
Delivery height losses e.g. due to gas con-veyance
Wear of crack
Overload
Overheating, wear and pump damage caused by such operating states can be avoided by warning the plant operator in time. Monitoring of intake pressure and boiling point of pumped medium provides an early warning with respect to danger of cavitation, even before cavitation has reached a strength that is acoustically audible and al-ready causes a lot of wear and tear.
Figure 2-4: Centrifugal pump rotor damaged by cavitation.
Cavitation is the formation and collapse of vapor bubbles of a flowing liquid. During the operation of centrifugal pumps, such vapor bubbles can appear due to (locally) excessive flow velocities: higher velocity causes lower pressure in the fluid. If the pressure of the liquid falls below its vapor pressure, vapor bubbles will emerge. If the pressure rises again in flow direction, the bub-bles collapse: the gas inside the bubble suddenly condenses. During this implosion, so called „jet-impacts“ will occur, causing pressure and tem-perature shock waves, that usually are much higher than tolerable by the materials of pump rotor or pump housing. The surface of pump rotor or pump housing are damaged permanent-ly and finally destroyed. Even a small amount of cavitation reduces the efficiency (the delivery height) of the pump. Full cavitation can even cause the pump delivery to crash completely.
Moreover, PumpMon is helpful for optimization of pump dimensioning by providing statistic evaluation of operation data (load distribution histogram) and supports the discovery of energy saving potentials.

A white paper issued by: Siemens, Sector Industry, IA AS S SM. © Siemens AG 2013. All rights reserved.
White Paper | Asset Management of mechanical plant components in SIMATIC PCS 7 | 9
Valves just like pumps are one of the most com-mon actuators in process plants. The condition of the valves has a significant influence on the availability and safety of the complete plant. Valves are affected by different signs of wear and tear, such as wear of valve cone and/or valve seat (abrasion, cavitation, corrosion) or fouling (material caking, build-up).
The PCS 7 function block ValveMon offers a cost-effective solution for monitoring and diagnosis of control valves, i.e. valves that can be fully or partially opened or closed by continuous valve position control. Valve monitoring is based on an intelligent combination and logical interpreta-tion of measured process values which are al-ready available in the DCS. The ValveMon com-plements the self-diagnosis of an electro-pneumatic positioner, such as Sipart PS, or com-pletely replaces this if the positioner does not offer any self-diagnosis, or the self-diagnosis is not integrated into the DCS.
3.1 Area of Application The ValveMon function block can be applied for any control valve which can be opened / closed continuously. Binary switching valves (fully open/close only) are not subject of this consider-ation. Only the basic condition monitoring (mon-itoring of operating hours, valve still-stand, etc.) is performed if the valve can not read back the actual valve position (valve position feedback). Control valves with position feed-back permit detecting valve movement errors (wear, material caking etc.). If there are additional process val-ues available which are typically measured in the environment of valves, an extended valve diag-nosis can be performed (monitoring of the valve characteristic, the supply pressure etc.).
Typical application examples:
Control valves that show malfunctions and signs of wear more frequently than the av-erage.
Control valves that are in danger of cavita-tion.
Control valves where chemical fouling oc-curs.
Control valves that show unaccountable variations with respect to reference flow characteristics and response time.
3.2 Functional Range
3.2.1 Characteristic Lines
Figure 3-1: ValveMon faceplate, flow characteristic in case of material caking at valve body
Flow characteristic as a function of valve position, where flow is converted to norm difference pressure. The reference charac-teristic is specified with constant values, while the actual characteristic is learned from measured data during plant operation, and is adapted automatically (permanently).
Response time characteristic: display of actual valve response time and reference re-sponse time as a function of step height for positive setpoint steps.
Histograms: statistical evaluation of valve operating states with respect to valve posi-tions.
3 Monitoring of Control Valves by ValveMon

A white paper issued by: Siemens, Sector Industry, IA AS S SM. © Siemens AG 2013. All rights reserved.
White Paper | Asset Management of mechanical plant components in SIMATIC PCS 7 | 10
3.2.2 Diagnostic Functions
The function block offers the following diagnos-tic functions for warning operators in case of unfavourable operating states or reaching of wear limits:
.
Monitoring of maximal operating hours in permanent standstill without any valve movement material caking, deposits, build-up.
Monitoring of maximal operating hours in permanent operation without valve stand-still overload.
Monitoring of maximal number of strokes maintenance.
Monitoring of maximal shifts in directions maintenance.
The function block detects faulty valve move-ments by the following diagnostic methods. The setpoint provided by the positioner is compared to the real position feedback of the valve.
Detection of valve movements without set-point demand compressed air leakage.
Displacement of upper and lower end posi-tion damage to valve cone, zero offset displacement.
Detecting of a steady state control error after end of valve movement indication of drive problems or supply voltage prob-lems.
Monitoring of valve response time with respect to reference response time charac-teristic stiffness, damage of valve drive.
Monitoring of time period (dead time) which is needed by control valve to leave a specified tolerance band (dead zone) cak-ing, stiffness.
The function block offers the following extended diagnostic functions if additional sensors are available, which are already installed in the envi-ronment of valves in many cases:
Monitoring of flow operating point with respect to a reference flow characteristic as a function of valve position indication of variation of valve cross-sectional area (flow capacity) due to material caking or abrasion.
Comparison of actual flow characteristic with reference flow characteristic for a long-term drift detection mechanical damage at the valve cone, material caking, abrasion.
Monitoring of air pressure leakage in compressed air supply.
3.3 Sensors Required sensor signals for control valves with position feedback:
flow rate of medium
valve intake and outlet pressure
valve position setpoint and position feed-back (actual position)
3.4 Benefit ValveMon provides condition monitoring of con-trol valves based on several process values. Valve malfunctions and developing future valve fail-ures can be detected early by this approach. This allows for an improved maintenance planning and contributes to increase the availability of the overall plant.
The function block ValveMon is applied to
provide warnings against potential valve damage due to unfavourable operating con-ditions or reaching wear limits: permanent operation without valve standstill, perma-nent standstill, violation of maximal number of shifts in directions, violation of operating hours limit.
provide early detection of developing valve degradation: material caking or deposits, abrasion, wear.
optimize valve dimensioning in the long term by means of statistical analysis of op-erating data.

A white paper issued by: Siemens, Sector Industry, IA AS S SM. © Siemens AG 2013. All rights reserved.
White Paper | Asset Management of mechanical plant components in SIMATIC PCS 7 | 11
Heat exchangers are technical components, wherein warmer material flows give away some part of their thermal energy that is taken over by colder material flows. A product medium is to be heated or cooled using a service medium (e.g. hot steam, cooling water). Heat exchangers are consuming significant amounts of energy and need frequent maintenance or cleaning. Heat exchanger performance can be reduced signifi-cantly by fouling. Fouling is a general term for all sorts of contaminations in heat exchangers, e.g. sedimentation, corrosion, reaction fouling, bio fouling.
The PCS 7 function block HeatXchMon offers a cost effective solution for monitoring and analy-sis of heat exchangers. Monitoring is based on intelligent evaluation of measured values and comparison with characteristic surfaces of the heat exchanger. These characteristic surfaces are calculated beforehand via simulations of clean and dirty state of the heat exchanger, using technical data of the heat exchanger. Simula-tions are performed as part of a service package by Siemens I IA AS PA EC, Frankfurt.
4.1 Area of Application The preferred application area of HeatXchMon is fluid-fluid tube bundle heat ex-changers. Plate heat exchangers can be monitored if there is a sufficiently precise simulation program for the given type of heat exchanger. Heat exchangers involving a change of aggregate state (reboilers, condensers) can only be monitored by applica-tion specific versions of the HeatXchMon func-tion block.
Typical application examples:
Heat exchangers that tend to corrosion or sedimentation.
Heat exchangers that are contaminated by micro organisms (bio fouling).
Heat exchangers where fouling is caused by chemical reactions or reaction products (re-action fouling).
Heat exchangers with bad or heavily fluctu-ating efficiency.
4.2 Functional Range
4.2.1 Calculation of Performance Indicators
Calculation of heat flow Q for actual
("act"), clean ("clean") and maximal contam-inated ("dirty") state from characteristic sur-faces. "Maximal contaminated" refers to a heat exchanger state that requires cleaning immediately.
Calculation of key performance indicator HeatPerf for heat transfer as an indicator of fouling:
%100dirtyclean
dirtyact
QQQQ
HeatPerf
This performance indicator is calculated from the heat flows mentioned above, and can be interpreted as wear out reserve. It is defined such that it will show the value 100% in clean reference state and 0% in maximal contaminated state
Calculation of energy losses per day, with reference to heat flow in clean state waste of energy.
Monitoring of financial losses per day, caused by energy losses waste of money.
4 Monitoring of Heat Exchangers by HeatXchMon
A white paper issued by: Siemens, Sector Industry, IA AS S SM. © Siemens AG 2013. All rights reserved.
White Paper | Asset Management of mechanical plant components in SIMATIC PCS 7 | 12
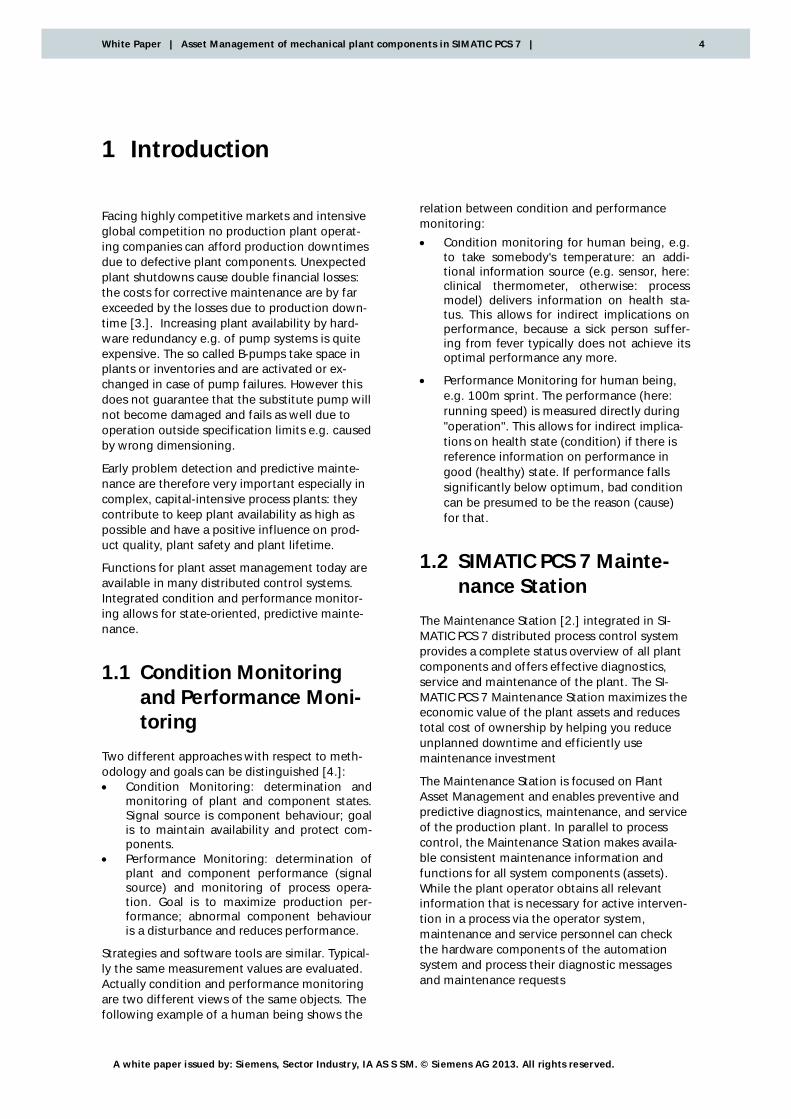
4.2.2 Characteristic Surfaces
Figure 4-1: HeatXchMon faceplate in nearly clean state, i.e. the actual heat flow (green dot) is close the reference characteristic (blue)
Display of reference heat flow (heat flow in clean reference state) depending on mass flow of service medium, displayed as two dimensional cut through the five-dimensional characteristic surface. Display of actual heat flow at operating point and in maximal contaminated state.
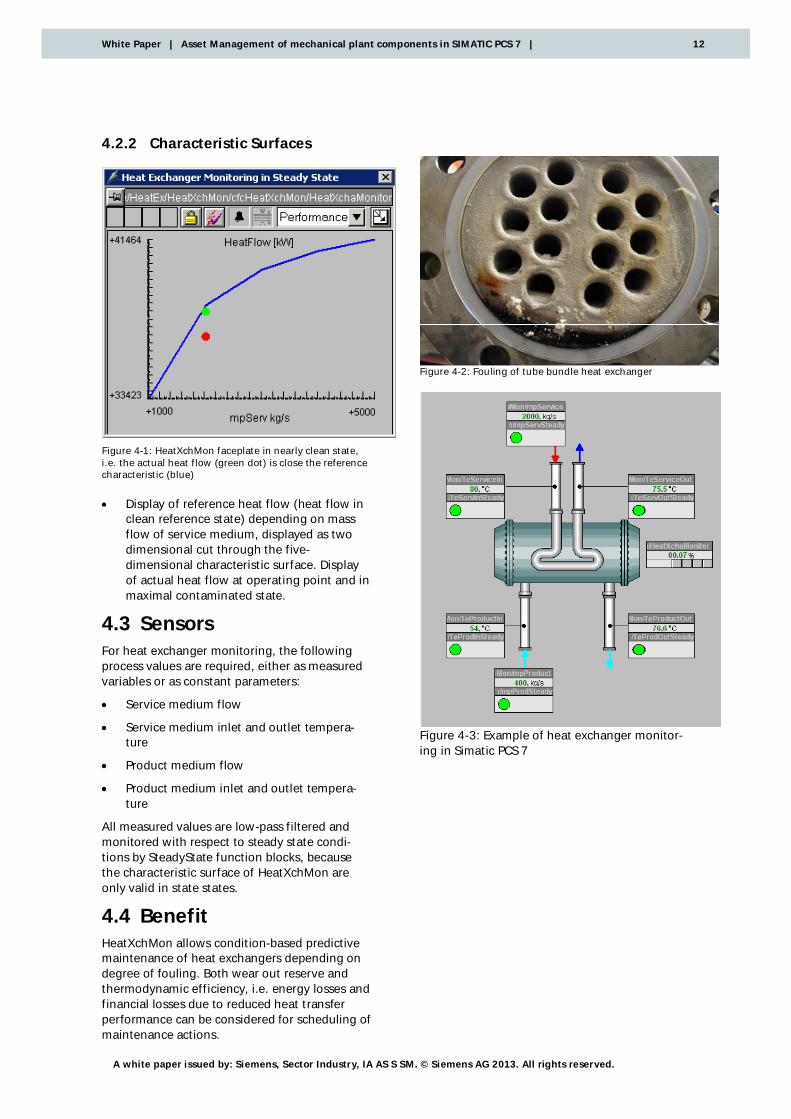
4.3 Sensors For heat exchanger monitoring, the following process values are required, either as measured variables or as constant parameters:
Service medium flow
Service medium inlet and outlet tempera-ture
Product medium flow
Product medium inlet and outlet tempera-ture
All measured values are low-pass filtered and monitored with respect to steady state condi-tions by SteadyState function blocks, because the characteristic surface of HeatXchMon are only valid in state states.
4.4 Benefit HeatXchMon allows condition-based predictive maintenance of heat exchangers depending on degree of fouling. Both wear out reserve and thermodynamic efficiency, i.e. energy losses and financial losses due to reduced heat transfer performance can be considered for scheduling of maintenance actions.
Figure 4-2: Fouling of tube bundle heat exchanger
Figure 4-3: Example of heat exchanger monitor-ing in Simatic PCS 7

A white paper issued by: Siemens, Sector Industry, IA AS S SM. © Siemens AG 2013. All rights reserved.
White Paper | Asset Management of mechanical plant components in SIMATIC PCS 7 | 13
In many mechanical assets process plants there is the danger that deposits, material caking or fouling are generated during plant operation which increase the flow resistance of plant com-ponents and consequently the pressure drop. This can cause increased energy consumption or reduced throughput, but also disturbances of plant operation or even plant shutdown.
5.1 Area of Application The PCS 7 functions block PressDropMon [11.] detects such adverse effects and provides
monitoring of pressure drop at any plant component, and
early detection of developing blockages.
The block can be used for any flow net compo-nents with flow dependent pressure drop. Typi-cal examples:
Filters
Precipitators Heat exchangers Long tubes, pipelines etc.
5.2 Functional Range 5.2.1 Characteristic Lines
Graphical visualization of pressure drop depending on flow and (if relevant) on vis-cosity (alternatively temperature) as a refer-ence pressure drop characteristic curve.
Visualization of actual operation point.
Calculation of absolute and relative devia-tion of operation point from the reference characteristic: DevPres und RelDev.
Figure 5-1: Pressure drop characteristic in PressDropMon faceplate, green: actual operating point
5.2.2 Calculation of Performance Indicators
In order to calculate wear out reserve WearRe-serve, the user has to specify a "critical" relative deviation CriticDev from the reference character-istic line marking the component state that re-quires maintenance action immediately, because functional capability of the plant component is in danger.
The wear out reserve is calculated based on the deviations from the reference characteristic as follows:
WearReserve = 1 – (RelDev / CriticDev).
5.2.3 Teach-Function
The teach function provides point wise teaching of the reference characteristic by clicking the teach button. The actual operating point then becomes an interpolation point of the reference characteristic. This way a characteristic surface of pressure drop depending on flow and viscosity can be generated step by step.
Characteristic lines can be specified for up to five different viscosity ranges, i.e. actually the behav-iour is defined by a family of characteristic lines where viscosity is the parameter.
5 Monitoring of Pressure Drop at Plant Components by PressDropMon

A white paper issued by: Siemens, Sector Industry, IA AS S SM. © Siemens AG 2013. All rights reserved.
White Paper | Asset Management of mechanical plant components in SIMATIC PCS 7 | 14
5.3 Sensors Application of PressDropMon requires measure-ments of flow through the plant component, inlet and outlet pressure. If medium viscosity is varying significantly during plant operation, a measurement representative for viscosity has to be provided, typically the temperature.
5.4 Benefit The actual operating point is compared to the pressure drop reference characteristic to detect material caking or danger of conges-tion/blockage inside the plant component. If the deviation of the operating point from the refer-ence curve stays within the parameterized toler-ances the operating point is displayed in green. Otherwise a large deviation is visualized by switching the point colour to red.
Deviations from the reference characteristic can be explained by variations of the flow resistance or the cross section available for flow. Mechani-cal damages or caking inside the monitored component lead to a variation of the cross sec-tion of the pipe opening. This results in a modi-fied flow value at constant pressure difference or modified pressure drop at constant flow (de-pending on whether the pressure or the flow is kept constant by a controller). If the operating point is above the reference characteristic, i.e. if the pressure drop is too high, there is possibly fouling, caking of material or beginning conges-tion or possibly leakage inside the component. (Remark: leakages between the flow sensor and the component distort the flow measurement and therefore the whole monitoring approach.) If the operation point is below the reference characteristic, perhaps an abrasion or a loss of filtering material is the reason, or a measure-ment error with respect to one of the three pro-cess variables.
Warnings and alarms for the operator can be created using the binary output signals of Press-DropMon using e.g. the function block DIG_MON.
A maintenance request announced by genera-tion of a maintenance alarm is not created by the PressDropMon block, but by an associated AssetM block.

A white paper issued by: Siemens, Sector Industry, IA AS S SM. © Siemens AG 2013. All rights reserved.
White Paper | Asset Management of mechanical plant components in SIMATIC PCS 7 | 15
The PCS 7 function block CompMon [10.] offers a cost-effective solution for monitoring and diagnosis of turbo compressors. Condition and performance monitoring are based on the intel-ligent combination and logical interpretation of measured process values which are (mostly) already available in the DCS, in contrast to high-end vibration monitoring systems based on ded-icated additional sensors.
6.1 Area of Application Only continuously operated, rotating flow ma-chines, i.e. turbo compressors are examined. These are frequently used for the conveying or compression of process gasses in process plants. Piston compressors or screw compressors are usually applied for compressed air production for pneumatic valve drives etc. (http://en.wikipedia.org/wiki/Compressed_air). These compressors belong to the class of dis-placement compressors and displacement com-pressors are generally not considered for the application of CompMon.
A comprehensive monitoring of compressors with high diagnosis depth can only be developed by the manufacturer of the compressor itself. This is offered for example by Siemens Sector Energy as a "Compressor Awareness system" (CAS) in the context of a service business for the compressors which are designed and sold by Siemens. These compressors are costly individual machines which are designed for special re-quirements and fabricated in make-to-order production.
A simple performance monitoring based on characteristic curves however is feasible, in the context of PCS 7 asset management and attrac-tive for many customers. Smaller compressors (100kW-2MW) in the industry sectors Chemistry and Oil&Gas are in focus, not the big compres-sors which anyway bring along a dedicated con-dition monitoring system.
Instabilities in compressor operation ("surge") have to be avoided absolutely, since pressure shocks appearing can lead to damage or even destruction of the compressor.
Surge (pumping) appears when the compressor does not produce enough pressure to overcome the outflow sided flow resistance. This means that the compressor produces a lower pressure than there is at the compressor outflow. This can
lead to a temporary reverse flow into the com-pressor.
A properly working anti-surge control and a safety instrumented system for surge protection are pre-requisites for the application of Comp-Mon.
Typical application examples:
Compressors that tend to instabilities in compressor operation (surge).
Compressors where fouling is caused by chemical reactions or reaction products (re-action fouling).
Compressors with bad or heavily fluctuating efficiency.
6.2 Functional Range 6.2.1 Calculation of Performance
Indicators
The function block CompMon calculates the following aerodynamic performance indicators: Specific isentropic and polytropic delivery
work, Isentropic and polytropic efficiency.
6.2.2 Characteristic Surfaces ("Com-pressor Maps")
The CompMon faceplate shows four different characteristic surfaces ("compressor maps"). The first and the second are approximately inde-pendent of suction side pressure and tempera-ture, and are edited with parameters taken from technical documentation supplied by the com-pressor manufacturer. Polytropic head (delivery work) as a function
of volume flow, with the surge line in red colour. The characteristics start on the left side at the surge line. The right end of each characteristic represents the so-called "suc-tion limit".
Polytropic efficiency as a function of volume flow.
6 Monitoring of Compressors by CompMon

A white paper issued by: Siemens, Sector Industry, IA AS S SM. © Siemens AG 2013. All rights reserved.
White Paper | Asset Management of mechanical plant components in SIMATIC PCS 7 | 16
Figure 6-1: Compressor map for polytropic head (delivery height) in CompMon faceplate
Figure 6-2: Characteristic lines for polytropic efficiency
The other two compressor maps are derived from the first two by thermodynamic calcula-tions inside the function block, such that no separate source data have to be specified for them. Discharge (outlet) pressure as a function of
mass flow. Hydraulic power as a function of mass flow.
In relation to this characteristic, the actual mechanic shaft power is displayed. The max-imal rated drive power is shown as a hori-zontal line.
Figure 6-3: Compressor map for discharge pressure
Figure 6-4: Characteristic line of hydraulic power and mechanic shaft power
All characteristic lines of a family depend on a parameter, in this case the manipulated variable of the pressure controller, namely rotation speed or IGV (Inlet Guide Vane).
The delivery height of flow compressors depends on the spin increase of the gas in the compres-sor. The delivery height can be adjusted by suc-tion sided (inlet) guide vanes such that the guide vanes apply a spin to the intake gas flow in the same or contrary to the rotation direction of the rotor and the circumferential speed of the intake gas flow increases (concurrent spin, reduces delivery height) or degrades with that (counter-current spin, increases delivery height).

A white paper issued by: Siemens, Sector Industry, IA AS S SM. © Siemens AG 2013. All rights reserved.
White Paper | Asset Management of mechanical plant components in SIMATIC PCS 7 | 17
Three characteristic lines of the family are stored as source data, namely for maximal speed (typi-cally 105%), minimal speed (typically 70%) and nominal speed (100%). The characteristic line for actual speed is calculated from these by interpo-lation.
6.2.3 Alarming
Messages can be generated by deviations of the actual operating point from one of the four characteristic lines for the reference state. Viola-tions of tolerances trigger generation of mes-saged by CompMon and are offered as binary output variables for linking to further function blocks.
6.3 Sensors Relevant process measurements for compressor monitoring:
Compressor intake pressure
Compressor outlet pressure
Compressor intake flow rate
Compressor intake temperature
Compressor outlet temperature
Bypass-valve position (setpoint and position feedback)
Mechanical shaft power of the compressor drive
Speed or IGV-position
In multistage compressors each "stage group" is considered separately, which requires a conver-sion of the volume flow and sufficient instru-mentation also in between the stage groups. Instrumentation between stages is typically not available in multistage compressors for com-pressed air production of processing plants so that the CompMon function block is not suitable for such applications.
6.4 Benefit The compressor typically belongs to the particu-larly critical and cost-intensive components of a plant. The protection of the compressor from surge damages by monitoring the actual operat-ing point in the compressor map, the detection of slow fouling or damages developing suddenly or slowly at the vanes can be improved by appli-cation of CompMon. This way the operational availability of the complete plant is also in-creased.
Compressor damages that can be detected by CompMon also include problems caused by cak-ing of dust particles at the rotor or rotor erosion by fluid hammer.
Long term optimization of compressor dimen-sioning is supported by statistical evaluation of operating data, namely a histogram of operation in different load ranges.

A white paper issued by: Siemens, Sector Industry, IA AS S SM. © Siemens AG 2013. All rights reserved.
White Paper | Asset Management of mechanical plant components in SIMATIC PCS 7 | 18
7.1 Area of Application Using the PCS 7 block TrendMon, the wear re-serves calculated by PressDropMon or other XxxMon asset management function blocks can be processed such that the time trend is extrapo-lated into the future. This way the remaining service life of the monitored component can be estimated. To avoid a plant shutdown, the re-spective plant component must be cleaned, maintained or exchanged during this remaining service time.
Typical application examples for TrendMon are all plant components which are monitored with respect to wear and for which an estimation of remaining life time (service time) is important for the plant operator:
Monitoring of flow resistances with Press-DropMon function block: The output varia-ble WearReserve is calculated from the devi-ation of actual operating point and refer-ence operating characteristic curve, and can be linked to TrendMon.
Monitoring of heat exchangers with HeatXchMon function block: The output variable HeatPerformance (0...100) de-scribes the performance of heat transfer. It can be divided by 100 and interpreted as wear reserve. Therefore it can be directly connected to the TrendMon block. At HeatPerformance=0 the heat exchanger fouling has reached a state where cleaning is mandatory.
Monitoring of valves with ValveMon func-tion block: The output variables Strokes and SID describe the number of strokes and the number of shifts in direction. If the valve manufacturer declares a maximum life cycle of “MaxStrokes”, then you can calculate the wear reserve in the following way: WearReserve= 1 - Strokes/MaxStrokes The deviation of the actual operating point from the expected flow characteristic can be used to calculate a wear reserve in an appli-cation specific way if it is known at which deviation cleaning is mandatory.
Monitoring of centrifugal pumps with PumpMon function block: The output varia-ble DevDelHi describes the relative deviation from the delivery height characteristic and provides an indicator of potential wear. Ac-cording to application specific know-how it
can be decided which loss of delivery height requires maintenance action. Wear reserve for the TrendMon block is calculated in CFC using elementary arithmetic function blocks.
Monitoring of compressors with CompMon function block: According to the type of pumped medium pollution, caking and abra-sion can appear which affect hydraulic per-formance. It can be decided in an applica-tion specific way which deviation from hy-draulic performance characteristic requires maintenance, and wear reserve for the TrendMon block is calculated accordingly in CFC.
7.2 Functional Range Graphical visualization of the time trend of the input variable WearReserve in the past and linear extrapolation of this trend into the future.
Figure 7-1: Extrapolation of wear reserve from the past to the future in TrendMon faceplate
7.3 Benefit The estimated value for the remaining service life time is compared to a "minimal requested remaining life time"; the result is a value called “criticality”:
Criticality = RestTimeMin / RestTimeEstim
If the remaining life time becomes smaller than "minimal remaining time" the criticality becomes greater than 1 and the corresponding binary output RestTimeUnderrun of TrendMon is set to true. The criticality can be used to generate a maintenance request (maintenance alarm) if this output is connected to an AssetM function block.
7 Extrapolation of Wear Trends and Estimation of Re-maining Service Life by TrendMon

A white paper issued by: Siemens, Sector Industry, IA AS S SM. © Siemens AG 2013. All rights reserved.
White Paper | Asset Management of mechanical plant components in SIMATIC PCS 7 | 19
Figure 7-2: Symbols for status of assets in PCS 7 Mainte-nance Station
For this, the criticality of asset state is linked to an analog value monitoring input of the associ-ated AssetM function block. The maintenance alarm limits are set e.g. to
0.7 for maintenance request (green screw wrench),
0.9 for maintenance demand (yellow screw wrench),
1 for maintenance alarm (red screw wrench).

A white paper issued by: Siemens, Sector Industry, IA AS S SM. © Siemens AG 2013. All rights reserved.
White Paper | Asset Management of mechanical plant components in SIMATIC PCS 7 | 20
Figure 8-1: Key Performance Indicators (KPI) for monitoring of distillation columns, from left to right: relative energy consumption, pressure loss, reflux ratio, throughput and product quality
Specific unit operations are typically performed in specific types of process plant units (appa-ratus) like e.g. continuously stirred tank reactors (CSTR) or distillation columns.
Pre-fabricated solution templates for the auto-mation of such plant units allow integrating asset management functions. These include instances of universal asset management func-tions:
Monitoring of centrifugal pumps, valve and heat exchangers belonging to the unit by XxxMon function blocks.
Monitoring of all control loops by ConPer-Mon function blocks (Control Performance Monitoring, [5.])
Moreover, solution templates allow defining specific functions for calculation of unit-oriented KPIs (Key Performance Indicators), as shown in the following examples.
8.1 Continuously Stirred Tank Reactors
A chemical reactor is applied to generate one or more products from several reactants. Inside of a reactor there can be one or several phases (fluid, solid, gaseous) and one or several reaction kinet-ics. The following key performance indicators are generally valid for all chemical reactors [4.]:
Product quality with specifications like purity (e.g. minimal required concentration of one or more product components, maxi-mal allowed concentration of one or more by-products / impurities) or other product properties (e.g. molar mass distribution, vis-cosity, melt-index, colour, aroma).
The conversion rate in batch-processing is the amount of converted reactant (limiting reaction stoichiometry) related to the reac-tant provided at starting time t=0. In con-tinuous processing the conversion rate is the ratio of reactant converted (from inflow to outflow) and reactant inflow.
Yield is the ratio of generated product (mo-lar amount) and provided reactant (molar
8 Monitoring of Typical Process Plant Unit Operations

A white paper issued by: Siemens, Sector Industry, IA AS S SM. © Siemens AG 2013. All rights reserved.
White Paper | Asset Management of mechanical plant components in SIMATIC PCS 7 | 21
amount) which is limiting reaction stoichi-ometry.
Selectivity is the ratio of generated product [mol] to consumed reactant [mol] which is limiting reaction stoichiometry.
Specific energy consumption: chemical reactions consume energy or generate heat. The specific reaction enthalpy is theoretical-ly known and can be compared via thermal energy balances to the amount of heat gen-erated or consumed by the production.
Specific catalyst consumption: ratio of catalyst mass flow and product mass flow.
Space-Time-Yield or reactor capacity: pro-duction performance (product mass flow) per reactor volume unit.
Off-Spec production (mass or mass flow)
Hold-up time or hold-up time distribution.
Mixing quality, mixing time, dead volume.
8.2 Rectification- and Distil-lation-Columns
Rectification (counter flow distillation) is a ther-mal separation process used on a liquid mixture for separating different substances soluble in each other by means of their different relative evaporation and different boiling points. The low boilers ("tops") are drawn off at the head (top) of the rectification column and the high boilers ("bottoms") are drawn off at the bottom. The performance is generally evaluated using the following key performance indicators: Purities of head and bottom product, even-
tually intermediate side outlet. Specific energy consumption (heating
vapor) per feed flow or per product outflow. Reflux ratio, i.e. ratio of reflux and head
product outflow.
Higher reflux ratios can achieve higher product purities of head and/or bottom product. Reflux ratio and specific energy consumption depend on each other, i.e. higher reflux ratio requires higher energy consumption. If those values do not correspond to the nominal or specified val-ues, the column is not operated optimally, or there is a problem with the trays inside the col-umn. Pressure loss (pressure drop) of the whole
column or parts of it.
If pressure loss is higher than expected, this is an indicator of damages or pollution (corrosion, fouling) of column trays, plates or packing mate-rial.
In the PCS 7 solution template for automation of distillation columns ( [12.], [13.]) ready-made functions for calculation and monitoring of these key performance indicators are integrated. Further solution templates for typical unit opera-tions have been developed as prototypes and are prepared for download: Continuously stirred tank reactor with cool-
ing jacket, Bioethanol fermenter, Polymerisation reactor with advanced pro-
cess control, Fluidized bed dryer with advanced process
control.

A white paper issued by: Siemens, Sector Industry, IA AS S SM. © Siemens AG 2013. All rights reserved.
White Paper | Asset Management of mechanical plant components in SIMATIC PCS 7 | 22
Automation by SIMATIC PCS 7 significantly con-tributes to minimizing plant operation and maintenance costs.
The enhancement of plant asset management to include mechanical plant components like pumps, control valves, heat exchangers or com-pressors is a promising approach. Benefits with respect to plant availability, maintenance costs and plant performance can be achieved by con-dition-based predictive maintenance, extension of maintenance intervals, prevention of un-planned plant-shutdowns and increased energy efficiency.
10 Literature
[1.] Internet-Portal SIMATIC PCS 7 www.siemens.com/simatic-pcs7 -->
https://www.automation.siemens.com/mcms/process-control-systems/en/simatic-pcs-7/Pages/simatic-pcs-7.aspx
[2.] PCS 7 Maintenance Station
https://www.automation.siemens.com/mcms/process-control-systems/en/simatic-pcs-7/simatic-pcs-7-systemkomponenten/maintenance-station/Pages/maintenance-station.aspx
[3.] Schmitt, S.: Bausteine für optimalen Durch-blick - Condition Monitoring mechanischer As-sets in der Prozessindustrie. VERFAHRENSTECH-NIK 11/2010.
https://www.automation.siemens.com/mcms/process-control-systems/de/simatic-pcs-7/simatic-pcs-7-systemkomponenten/maintenance-stati-on/Documents/236_10_schmitt_verfahrenstechnik_11_2010.pdf
[4.] Pfeiffer, B-M., Grieb, H., Bettenhausen, K. D.: Prozessnahes Performance-Management - vom Plant Assel-Management zur optimierten Be-triebsführung. VDE-Kongress, Aachen, Okt. 2006. Tagungsband 2, VDE-Verlag, Berlin, S. 325-330.
[5.] Application Note: Control Performance Mon-itoring (CPM) for Monitoring Control Loops http://support.automation.siemens.com/WW/llisapi.dll?func=cslib.csinfo&aktprim=4&siteid=csius&lang=en&siteid=csius&groupid=4000002&extranet=standard&viewreg=WW&nodeid4=20806759 [6.] Online-Help Function block AssetMon, PCS 7 ES V7.0.1, I IA AS RD Karlsruhe, 2008. [7.] Application Note: Monitoring of Centrifugal Pumps using the PumpMon Function Block. http://support.automation.siemens.com/WW/llisapi.dll?aktprim=4&lang=en&referer=%2fWW%2f&func=cslib.csinfo&siteid=csius&groupid=4000002&extranet=standard&viewreg=WW&nodeid4=20806759&objaction=csopen [8.] Application Note: Monitoring and Diagnos-tics of Control Valves Using the ValveMon Func-tion Block. https://intranet.automation.siemens.com/mcms/process-control-sys-tems/en/intranet/simaticpcs7/Documents/application_note/AN_ValveMon_EN_2010_05.pdf [9.] Application Note: Monitoring of Heat Ex-changers using the HeatXchMon Function Block. https://intranet.automation.siemens.com/mcms/process-control-sys-tems/en/intranet/simaticpcs7/Documents/application_note/AN_HeatXchMon_EN_2010_05.pdf [10.] Application Note: Monitoring of Turbo Compressors using the CompMon Function Block. https://intranet.automation.siemens.com/mcms/process-control-sys-tems/en/intranet/simaticpcs7/Documents/Application%20Note_CompMon_2011_04_EN.pdf [11.] Application Note: Monitoring of Pressure Drop at Plant Components and Extrapolation of Wear Trends https://intranet.automation.siemens.com/mcms/process-control-sys-tems/en/intranet/Documents/SIMATIC_PCS_7/applica-tion_note/AN_PressdropeMon_EN_2010_10.pdf
[12.] Pfeiffer, B-M., Lorenz, O.: Unit-oriented Solution Templates for Advanced Process Control
9 Summary

A white paper issued by: Siemens, Sector Industry, IA AS S SM. © Siemens AG 2013. All rights reserved.
White Paper | Asset Management of mechanical plant components in SIMATIC PCS 7 | 23
- Exploiting the Rationalization Potential: Exam-ple Distillation Column. Ideas Singapore – The magazine for industrial innovations. May 2009. [13.] Unit Template for the Chemical Industry - Distillation Column.
http://support.automation.siemens.com/WW/llisapi.dll?aktprim=4&lang=en&referer=%2fWW%2f&func=cslib.csinfo&siteid=csius&groupid=4000002&extranet=standard&viewreg=WW&nodeid4=20806759&objaction=csopen

A white paper issued by: Siemens, Sector Industry, IA AS S SM. © Siemens AG 2013. All rights reserved.
White Paper | Asset Management of mechanical plant components in SIMATIC PCS 7 | 24
www.siemens.com All rights reserved. All trademarks used are owned by Siemens or their respective owners. © Siemens AG 2008
Siemens AG Sektor Industry, IA AS SM MP7 Östliche Rheinbrückenstr. 50 D-76181 Karlsruhe