asset revaluations, price gouging, and barriers to entry ... · source for electricity revenue:...
TRANSCRIPT

Asset revaluations, price gouging, and barriers to entry: the state of
play in electricity sector non-regulation
Geoff Bertram
Institute for Governance and Policy Studies
Victoria University of Wellington
24 May 2013
1

Regulatory risk overhangs the value of electricity company shares
• The shareholders’ equity in the five big gentailers rests on the book valuation of their fixed assets (mainly generation plant and equipment – dams, turbines, control gear etc)
• The assets are
– specific (no or limited alternative uses)
– lumpy (not readily broken into smaller chunks – though windfarms a potential exception)
– pre-emptively occupying the prime generation sites (new entry is at the Ricardian extensive margin)
• The value at which those fixed assets are carried is completely divorced from their cost – most were built long ago and their investment costs are sunk
• The book valuations are “fair value” i.e. the discounted present value of expected future earnings
• Future earnings depend on whether pricing behaviour will be regulated
• The opposition parties’ “New Zealand Power” policy will, if implemented, drastically reduce the asset values and the average price of electricity
2

The key plank in the Labour policy is bringing asset values back down to historic cost – that is, to the sums that the companies have actually spent to
acquire or install the physical capital assets
“NZ Power will act as a single buyer of wholesale electricity. Each generator will be paid a fair return for their actual costs. The fair return will be calculated by NZ Power on the basis of their historic capital costs, possibly adjusted by inflation, plus operating costs like fuel, depreciation and maintenance”
Energising New Zealand: Policy Document, NZ Labour Party, April 2013. pp.9-10.
3

Outline of the paper
1. Quantify the regulatory risk company by company if North-American-style historic-cost-based regulation is implemented
2. Apply the simple economic theory of rent to show how excess profits have been secured, and why the “functionless rents” that underpin the asset revaluations are not defensible in principle
3. Ask whether any “regulatory compact” could provide a defence for the companies
4

Three sets of headline numbers from this paper
5
Book Value
($mill) Historic Cost
($mill)
Write-down required ($mill)
Percentage Reduction
Mighty River 5,064 2,225 2,839 56
Genesis 2,581 1,703 878 34
Meridian 7,964 3,552 4,412 55
Contact 5,164 3,156 2,007 39
Trustpower (2013) 2,717 1,425 1,291 48
Total 23,489 12,061 11,428 49
Change in Book Values Under Historic-Cost Regulation
Source for book value and historic cost: Companies’ Annual Reports
The book value of the industry’s fixed assets would be halved

Change in Revenues Under Historic-Cost Regulation
6
2012 Electricity Revenue
($mill)
Revenue Reduction
($mill, @13%)
Revenue Reduction
(%)
Mighty River 1,521 369 24
Genesis 1,929 114 6
Meridian 2,570 574 22
Contact 2,451 261 11
Trustpower (2013) 765 168 22
Total 9,236 1,486 16
Source for electricity revenue: Companies’ Annual Reports
Regulation would knock $1.5 billion per year off the cost of electricity for consumers

Percentage of shareholders’ equity eliminated
7
2012 Shareholder
equity ($mill)
Write-down ($mill)
Equity remaining
after write-down ($mill)
Reduction (%)
Mighty River 3,014 2,839 175 94
Genesis 1,800 878 922 49
Meridian 4,826 4,412 414 91
Contact 3,418 2,007 1,410 59
Trustpower (2013) 1,552 1,291 261 83
Total 14,610 11,428 3,182 78
Source for shareholders’ equity: Companies’ Annual Reports
Three-quarters of shareholder equity is exposed

Note following the seminar:
The assumption in the preceding slide, that 100% of a write-down in fixed asset values would fall on shareholder equity, overlooked the extent to which deferred tax liability would soften the impact on equity. This is to be addressed in future work - GB
8

Comment
With three-quarters of their equity depending on so-called “fair value” revaluations, and consequently exposed to adoption of a standard, internationally-common form of price regulation, New Zealand electricity generator-retailers are quite unlike “utilities” as commonly understood.
They are more reminiscent of pre-2008 finance companies (Hanover, Blue Chip, South Canterbury…) or pre-1987 “investment” vehicles (BIL, Ariadne, Robert Jones Investments…).
Inflated US and European financial-sector balance sheets based on “fair value” were central to the Global Financial Crisis
The downside risk on the shares of electricity generator-retailers is of similar type and magnitude
9

Methodology for estimating that regulatory risk
• This work repeats what Dan Twaddle and I did to measure lines company excess profits in our 2006 Journal of Regulatory Economics paper
• I compare actual financial performance against what a US-type public-utility regulator would have allowed:
– An assured fair return on (profits) and of (depreciation) all cash prudently spent on investment in useful new capacity
– Full recovery of all legitimate operating costs
– Regulatory support of the resulting prices as the tradeoff for limiting the exercise of market power
• The extent of “fair value” revaluation of fixed assets provides the key indicator of excess profits relative to that regulatory benchmark
• This is because the revaluations are simply the discounted present value of the amount by which revenues (hence prices) are in excess of what would have been allowable under an historic-cost pricing ratebase (assuming that company vesting values are accepted as establishing initial historic cost)
10

Aide-memoire: how NZ lines company profits were successfully gold-plated
• Our 2006 paper showed that electricity lines companies had revalued their fixed assets upward by $2 billion 1994-2004, laying the basis for the unnecessary (functionless) charging of over $200 million per year to consumers, relative to the regulatory counterfactual
• Those revaluations remain in place and have been indexed to inflation, raising the continuing excess charges well over the $200 million p.a. level
• It is likely to be decades before the lines industry can claim a genuine historic-cost basis for its asset values
• But in 2004 the Commerce Commission, having been given the job of regulating - with no clear mandate or guidance from Parliament to protect consumers - opted to rubberstamp the revaluations, effectively locking-in the excess profit-taking
• The lines industry, thus, succeeded in getting itself political cover against consumer protest by capturing the regulator
• New Zealand consumers are substantially poorer as a result, but lines company revenues are safe with a regulatory and political underwrite
11

The “Optimised Deprival Value”
boom 1994-2003
Counterfactual historic-cost benchmark
The 2011 Regulatory Asset Base (RAB)
12
Commerce Commission regulation commences

The path of asset values in generation and retail
“Fair value” revaluations since 1999 = $11.4 billion
wealth transfers from consumers
Historic-cost benchmark: $12.1 billion
$23.5 billion book value currently defended by the industry, the Government,
Business NZ and the Electricity Authority
13
ECNZ pre-divestment was $4.5 billion

Company-by-company detail
• First I constructed my own estimate of “historic cost”, starting from the amount paid to acquire the fixed assets at the time each of the companies was set up in the 1990s.
• That meant adopting a starting value generally far higher than the true historic cost of the plant and equipment if one were to start from the time those assets were actually constructed
• Going back to the original construction cost and allowing for depreciation would often mean assigning a zero historic-cost value at the late 1990s
• The rationale for the “vesting date” start is twofold:
1. the government of the day explicitly signed off on those values when ECNZ was broken up
2. the companies have based their own calculations of historic cost on their vesting values
• That means there is some (admittedly pretty thin!) basis for claiming a “regulatory compact” underpinning those values – but they’re only “deemed historic cost”, not truly the real thing 14

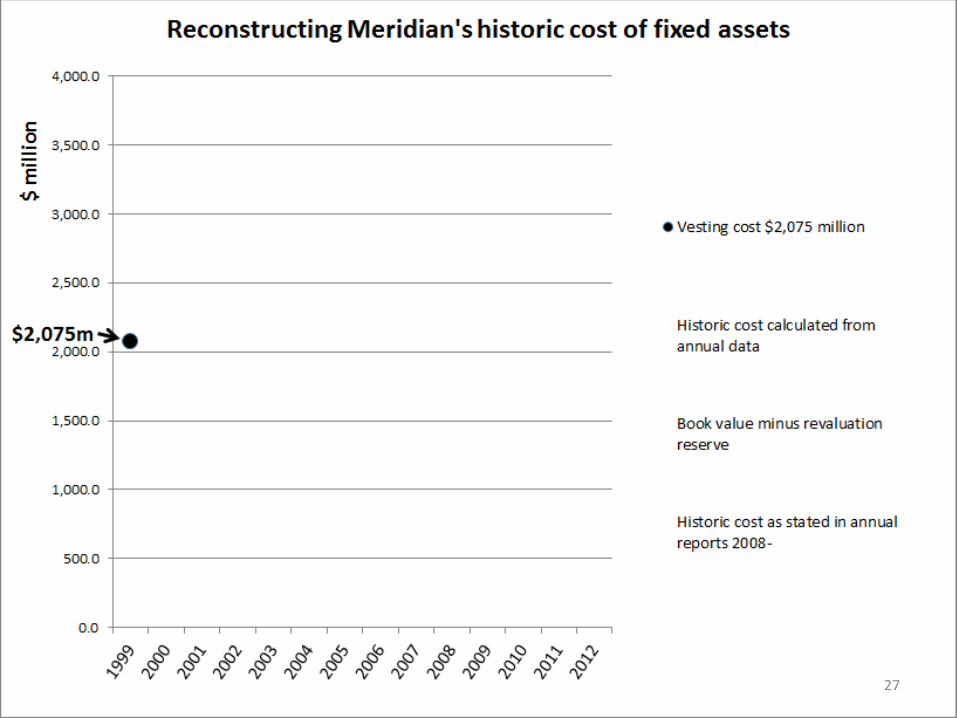
“Vesting values” for Meridian, Mighty River and Genesis
• The fixed assets “sold” to the three new SOEs in 1999 fetched $3,444 million (ECNZ Annual Report 1999 p.20) which corresponded to their book value at that time (no gains or losses on these sales appeared in ECNZ’s P&L account)
• [Coleridge, Highbank and Matahina were sold to other buyers for $235 million, a gain of $137 million on book value (ECNZ Annual Report 1999 pp.11, 18, 20 and 37).]
• The amounts paid by the three new SOEs were:
15

ECNZ sales of fixed assets to Genesis, Meridian and MRP, April 1999
$ million
Genesis purchase of fixed assets 632
Meridian purchase of fixed assets 2,075
Mighty River purchase of fixed assets 721
Residual (unaccounted for) 16
Total ECNZ cash from disposal of fixed assets to new SOEs 3,444
Sources: SOE 1999 Annual Reports
16

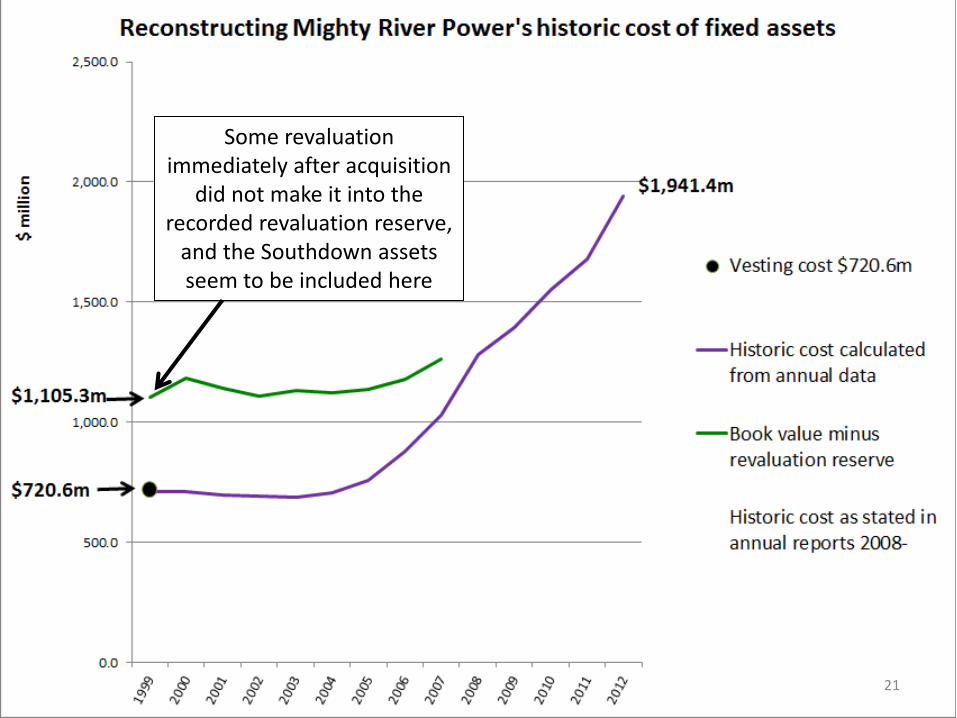
Take first Mighty River Power
• Starting from the $720.6 million vesting price, I have added for each year the recorded new acquisitions of fixed assets, subtracted disposals of fixed assets, and allowed for depreciation
• Depreciation has been charged at the company’s actual average rate of depreciation
• I made no allowance for impairments other than depreciation [what is sometimes called asset stranding]
17

18

19

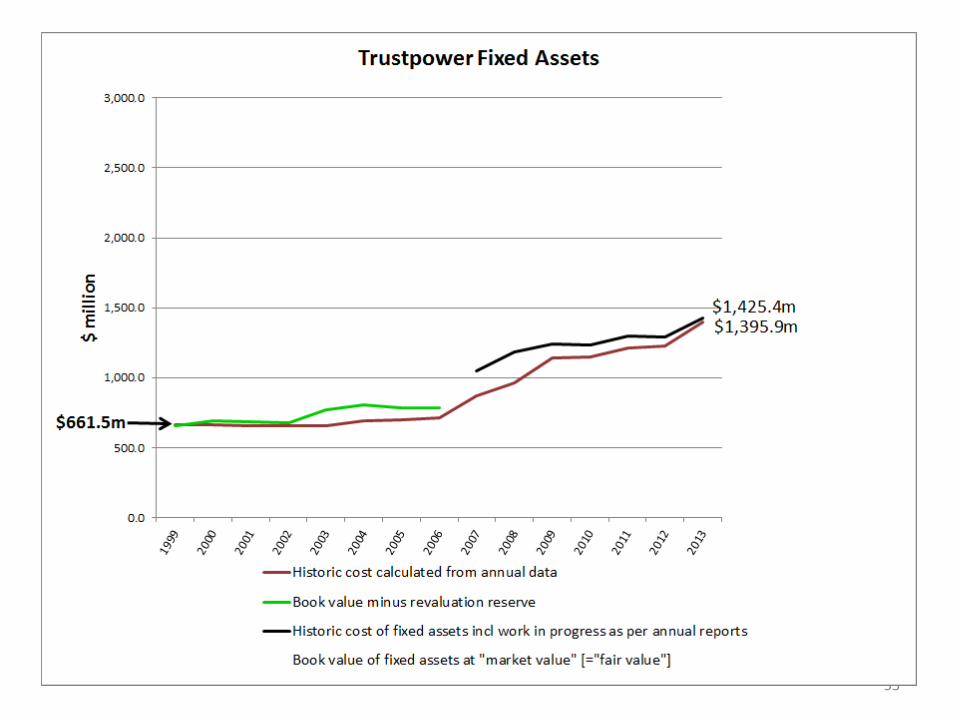
• To check the order of magnitude, I compared my historic cost series with
– Book value minus the revaluation reserve from annual financial statements prepared under pre-NZ IFRS GAAP (under NZ IFRS the revaluation reserve is no longer cumulative actual revaluations because of inclusion of tax adjustments and other accounting innovations)
– Historic cost as disclosed in annual financial statements under NZ IFRS
20
21
Some revaluation immediately after acquisition
did not make it into the recorded revaluation reserve,
and the Southdown assets seem to be included here

22

• So the series don’t match perfectly, but the ballpark is clear
• I opted to proceed by using the company’s own declared historic-cost rather than my lower figure
• The next step was to compare historic cost with the path of actual book value inclusive of revaluations
23

24

25
“Fair-value” revaluations by PricewaterhouseCoopers

26
This is the figure I use as my estimate of the required write-down
27

28
Tekapo A and B sold to Genesis

29

30

31

32
“Fair-value” revaluations by PricewaterhouseCoopers

33
This is the figure I use as my estimate of the required write-down

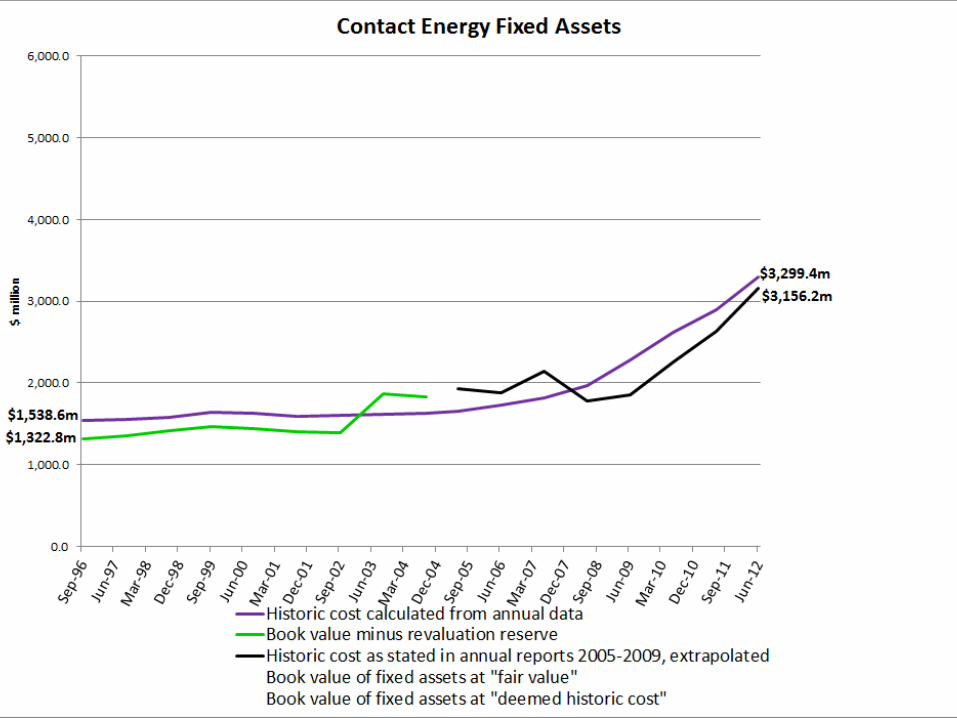
Contact Energy Ltd • Contact was the first SOE to be carved out of ECNZ, in
February 1996, and the first to be privatised, in April 1999
• Its first “fair value” exercise, in 1996, actually produced a write-down of $204 million, reflecting the widespread expectation in the industry at that time that Government would not allow price gouging to run unchecked
• By 2004, however, no regulation had materialised and Contact had added $2 billion of “fair-value” capital gains to its books - and had raised its prices to recover capital charges on this
• [Recall that the ability to raise prices was the basis on which the fair-value exercise rested, so the process was circular]
• Again our first step is to trace the historic-cost path that a US-style regulated ratebase would have followed.
34

35

36

37

38

39

Key conclusion: a consistent series for historic cost can be constructed,
and replicated using various methodologies, right back to
February 1996, using Contact’s own financial statements.
This will be important shortly.
40
41

42
“Fair value” revaluations by Deloitte But then in 2010 Contact decided to
change its valuation methodology, with retrospective effect back to 2004

The 2007 revaluation was reversed. Here’s the new series
The 2004 valuation was declared to be “deemed
historic cost” and all subsequent years were valued on a cost basis
starting from that base.
43

Contact’s stated reason for making the switch from fair value to historic cost:
“The cost valuation basis is considered a reliable basis for measurement of
generation plant and equipment. Cost also provides relevant information
about the long-term cash-generating performance of the core generation
plant and equipment, which is the primary objective for Contact in owning
the plant and equipment. For example, core metrics such as return on capital
invested in plant and equipment can be calculated without adjustment to the
return, or the investment, for the impact of asset revaluations. Cost aligns
with global industry practice for similar long life core operating assets. Cost
also aligns with the policy of Contact’s ultimate parent Origin Energy Limited
(Origin).”
44
Contact Energy Annual Report 2010 p.60 Note 1

So why did Contact start its “cost-based” calculation from 2004
rather than 1996?
45

Contact Energy Ltd Annual Report 2010 p.60 Note 1 to the accounts [emphasis added]:
“Contact has elected to make a voluntary change in accounting policy
in relation to the measurement basis for generation plant and
equipment and move to a cost basis as it is reliable and more relevant.
The change in accounting policy has been applied retrospectively to 1
October 2004, the date of Contact’s transition to NZ IFRS and the date
of acquisition of 51.4 per cent of the shares in Contact by Origin. Fair
value at 1 October 2004 is considered deemed historical cost owing
to the impracticability of determining actual cost back to the original
asset purchase date.”
46

The decision to use the 2004 valuations as “deemed historic cost” was transparent opportunism
• By 2004 Contact had carried through its major revaluations, bringing book value to $3.9 billion against actual historic cost of $1.6 billion.
• By switching (in its 2010 financial statements) to the so-called “cost basis”, Contact basically sought the same outcome that the lines companies had secured from the Commerce Commission in 2004
• But we have just seen that historic cost can be consistently calculated right back to vesting date in February 1996.
• The alleged “impracticability” of doing this was nothing of the sort – it was simple unwillingness to give up the big revaluation gains.
• Reversing the 2007 revaluation of $400 million was a small price to pay for being ready to capture any regulator that might appear
• The Commerce Commission’s 2004 surrender to lines companies’ lobbying would have served as a vital precedent
• Prediction: this will be the basis on which Contact will be lobbying Labour and the Greens to keep their hands off its “deemed historic cost” of fixed assets
47

48
This is the figure I use as my estimate of the required write-down
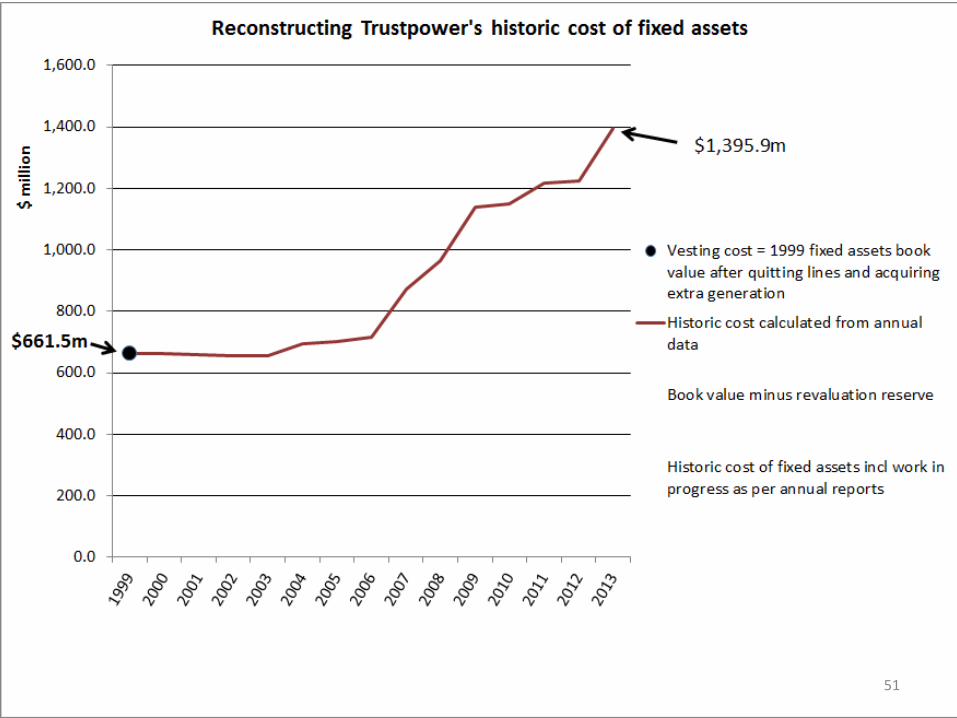
Trustpower
• Trustpower started out as a distributor and shifted into the gentailer camp only in 1999 when it opted to divest its lines business, retain its generation, and expand by buying-up a number of smaller-scale generation assets
• As at March 1999, the lines had been divested and the $621 million of generation assets were carried at acquisition cost (apart from $6 million of residual revaluations from the company’s 1998 market-value exercise on the limited generation it had then owned).
• So my analysis treats March 1999 as the start date
49

50
51

52

53

So a US regulator would have allowed Trustpower to recover, through its
revenue, a “fair return” on and of a 2013 ratebase of $1.4 billion
What has Trustpower charged
consumers for under its “market value” [= fair-value] approach?
54
55

56
“Market value” revaluations by Deloitte
“Market value” revaluation
by Beca Valuations
“Market value” revaluation
by ANZ Securities

57
This is the figure I use as my estimate of the required write-down

58

59

60

61

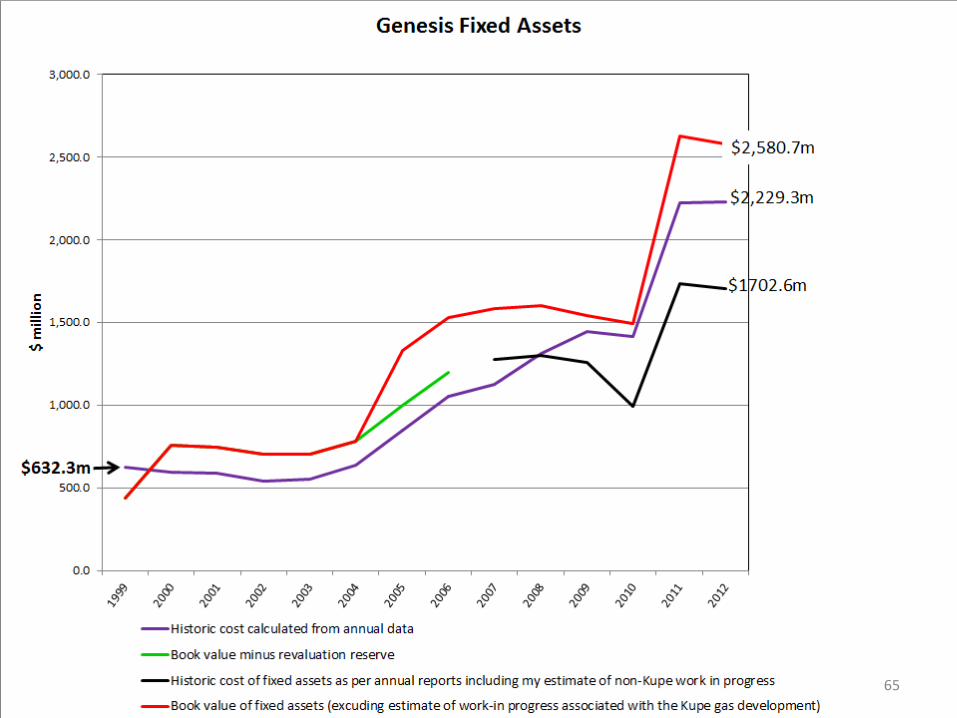
Tekapo A and B purchase 2011 Is entered at cost, without the $96.8 m
write-down on acquisition
Only regular depreciation is charged here on Huntly in 2009; this excludes the $264.1m
write-down taken to the P&L
Hence $361m of the $527m discrepancy here
relates to impairments that were evidently accounted for in the company's historic-cost figures
62

Those two write-downs might or might not have been recognised by a regulator
• A regulator might well have required a higher depreciation rate on Huntly from the outset
• A regulator would probably have objected to Genesis purchasing the Tekapo A & B assets at a price that exceeded their fair value
• So I’m inclined to take the company’s own $1.7 billion figure as the counterfactual regulatory asset base
• Now to compare this with the declared book value:
63

64
65

66
This is the figure I use as my estimate of the required write-down

Conclusion: Genesis is the least exposed to regulatory risk of the five gentailers
• The reason is its relatively small hydro portfolio combined with the cost of running Huntly
• A write-down of $878 million would take only 49% out of the 2012 shareholder equity of $1.8 billion
67

Recall: Percentage of shareholders’ equity at risk
68
2012 Shareholder
equity ($mill)
Write-down ($mill)
Equity remaining
after write-down ($mill)
Reduction (%)
Mighty River 3,014 2,839 175 94
Genesis 1,800 878 922 49
Meridian 4,826 4,412 414 91
Contact 3,418 2,007 1,410 59
Trustpower (2013) 1,552 1,291 261 83
Total 14,610 11,428 3,182 78
Source for shareholders’ equity: Companies’ Annual Reports
Three-quarters of shareholder equity is exposed
Wealth transfers and the market • The revaluations I have been tracing are in no sense a
necessary part of the electricity market. They were not required to enable the market to operate, and reversing them would not cause the market to fail
• We are dealing here with lump-sum transfers of wealth which have no immediate efficiency implications in terms of the neoliberal “public benefits test”
• Price-gouging is an issue of public morality, not market efficiency
• The gentailers have secured their wealth transfers ($11.4 billion, 5% of GDP) by gouging defenceless small consumers – households and small businesses (MEUG members and Rio Tinto have protected their interests successfully)
• This brings us to the economic theory of rent
69

RENT • Rent accrues to whoever happens to be the owner of a
productive resource which lies “inside the margin” of a market
• Rent is not a cost – it is a demand-determined flow of revenue that accrues as a reward to ownership
• There are major ethical issues around the collection of rents because they are bound up with the nature and extent of property rights
• Nozick’s “Lockean proviso”, for example, states that property rights do not legitimately extend to extortionate wealth transfers (Robert Nozick, Anarchy, State and Society 1986 pp.176-182.)
• The common-law ideas of ‘prime necessity’ and ‘essential facilities’ embody this notion that charges must be “fair and reasonable”
• [Are the NZ courts a “price-fixing authority” or not? (Transpower v Vector says no; merits appeals from Commerce Commission decisions say yes)] 70

A competitive industry with an upward-sloping long-run supply curve (a “rising-cost industry”) and growing demand
71 Quantity
Price
Long-run supply
Q1
D1
P1 At each point on this curve the marginal supplier is covering all its
costs, including cost of required capital investment and the transfer
earnings of land
When demand is D1 the price is P1

A competitive industry with an upward-sloping long-run supply curve (a “rising-cost industry”) and growing demand
72 Quantity
Price
Long-run supply
D5
Q1 Q2 Q3 Q4 Q5
D2
D3
D4
D1
P1
P2
P3
P4
P5
As demand grows over time, the competitive price is driven up as volume rises

“Ricardian rent” is secured by the owners of infra-marginal production as the price is driven up at the margin:
73 Quantity
Price
Long-run supply
D5
Q1 Q2 Q3 Q4 Q5
D2
D3
D4
D1
P1
P2
P3
P4
P5

Rent per unit sold
When demand is D5, market quantity is Q5, and “competitive price” is P5, total Ricardian rent is the yellow triangle.
74 Quantity
Price
Long-run supply
D5
Q1 Q5
P1
P5
The producer at Q1 collects rent per unit sold of (P5-P1)

The historic-cost [sometimes called “least-cost”] regulatory model that has prevailed in the USA since 1944 requires all such rent to be
passed through to consumers as a condition of allowing private firms to operate the supply system
75 Quantity
Price
Long-run supply
Q5 Q5
P5
All costs of supply, including return on historic cost of
investments, are recovered by suppliers
All potential rents are passed through to
consumers

The US Supreme Court's Hope decision set the basis for subsequent utility regulation in the USA: Federal Power
Commission v Hope Natural Gas Company, 320 U.S. 591 (1944).
“Rates which enable the company to operate
successfully, to maintain its financial integrity, to
attract capital, and to compensate its investors for the
risks assumed certainly cannot be condemned as
invalid, even though they might produce only a
meager return on the so-called 'fair value' rate base."
76 Federal Power Commission v Hope Natural Gas Company, 320 U.S. 591 (1944), page 605.

This means that price is set equal to average cost => the regulated firm supports its high-cost marginal plant out of total allowed revenues and just breaks even (including fair return on capital)
77 Quantity
Price
Long-run supply
Q
Demand
P
are dissipated as losses on marginal plant
Rents on low-cost plant
Price = average
cost

(Some New Zealand SOEs still price on this basis)
78
Source: NZ Post Group, Access Pricing Review Report and Proposal for Industry Consultation, October 2009, p.23, http://www.nzpost.co.nz/sites/default/files/uploads/shared/industryconsultation_19october.pdf

Revenue
from Comalco/RTZ
contract
Returning to the supply/demand diagram, what happens if long-term contracts can be signed?
79 Quantity
Price
Long-run supply
Q1
D1
P1
Call this hyothetical
contract “Comalco/Rio
Tinto” and lock it in
When demand is D1, a single buyer would be able
to secure a long-term contract for Q1 at price P1

Revenue from
MEUG contract
Revenue
from Comalco/RTZ
contract
80 Quantity
Price
Long-run supply
Q1 Q2
D2
P1
P2
Now demand grows to D2 and a large buyer could get a long-term contract for the extra volume (Q2-Q1) at price P2
Call this hypothetical
contract “MEUG” and
lock it in
What happens if long-term contracts can be signed?

Revenue from Kiwipower contract
Revenue from
MEUG contract
Revenue
from Comalco/RTZ
contract
81 Quantity
Price
Long-run supply
Q1 Q2 Q4 Q5
P1
P2
Now demand grows to D4 and a single large buyer could get a long-term contract for the extra volume (Q4-Q2) at price P4
D4
Q4
P4
Call this hypothetical
contract “Kiwipower” and lock it in
What happens if long-term contracts can be signed?
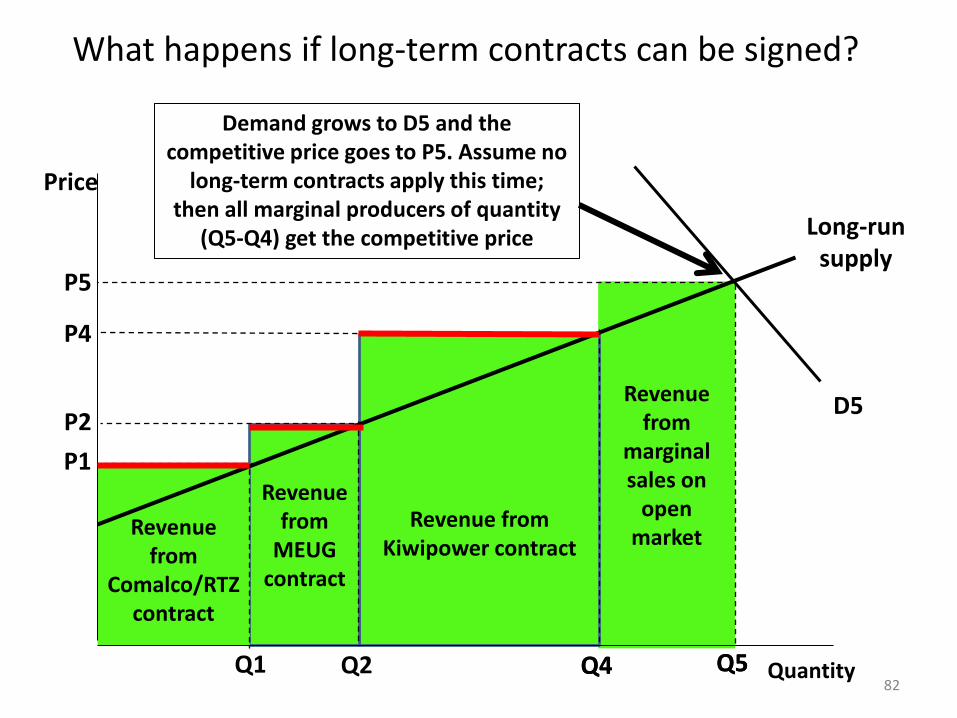
Revenue from
marginal sales on
open market
Revenue from Kiwipower contract
Revenue from
MEUG contract
Revenue
from Comalco/RTZ
contract
82 Quantity
Price
Long-run supply
Q1 Q2 Q4 Q5
P1
P2
Demand grows to D5 and the competitive price goes to P5. Assume no
long-term contracts apply this time; then all marginal producers of quantity
(Q5-Q4) get the competitive price
Q4
P4
D5
Q5
P5
What happens if long-term contracts can be signed?

Revenue from
marginal sales on
open market
Revenue from Kiwipower contract
Revenue from
MEUG contract
Revenue
from Comalco/RTZ
contract
What you notice about this outcome is that much of the rent (the blue area) goes to buyers (via lower prices) rather than to suppliers
83 Quantity
Price
Long-run supply
Q1 Q2 Q4 Q5
P1
P2
Q4
P4
D5
Q5
P5

Revenue from
marginal sales on
open market
Revenue from Kiwipower contract
Revenue from
MEUG contract
Revenue
from Comalco/RTZ
contract
This is fully consistent with the operation of a competitive market in which each investor gets a full commercial return on their investment
84 Quantity
Price
Long-run supply
Q1 Q2 Q4 Q5
P1
P2
Q4
P4
D5
Q5
P5
None of this revenue was or is required to sustain supply of Q5. The market can operate
just as efficiently at the margin with rents passed through to consumers as it can when
all rents are captured by suppliers

So who gets the rent is not an issue for economic efficiency. It’s simply an equity question
85 Quantity
Price
Long-run supply
Q5
D5
Q5
P5
To suppliers? To producers?
Or to consumers?

The textbook story so far has assumed:
• competitive conditions: at the margin only “normal profit” is secured and no excess (unnecessary) costs are incurred
• no carbon charges
• transferable non-specific assets: if demand were to shrink back down the long-run supply curve, the fixed assets (including land) could be simply reallocated to other economic activities
86

Uncompetitive conditions at the margin with barriers to entry:
87 87 Quantity
Price
Long-run competitive
supply
Demand
Q6
Price
Ricardian rent
Monopolistic rent
Q5

How about a carbon tax [or ETS] ?
88 88 Quantity
Price
Q5
Demand
Q5
P5
Long-run supply+ carbon charge
Carbon rent
Renewables-based supply
Fossil fuelled supply
Q7
Ricardian rent
Long-run competitive
supply
P6

Monopolistic rent
With both a carbon charge on non-renewable generation and monopolistic pricing:
89 89 Quantity
Price
Demand
Long-run supply+ carbon charge
Carbon rent
Renewables-based supply
Q7
Ricardian rent
Long-run competitive
supply
P6
P7
Q8

Monopolistic rent
With both a carbon charge on non-renewable generation and monopolistic pricing:
90 90 Quantity
Price
Demand
Long-run supply+ carbon charge
Carbon rent
Renewables-based supply
Q7
Ricardian rent
Long-run competitive
supply
P6
P7
Q8
Discounting all of this to present value gives the $11.4 billion of revaluations in the
gentailer balance sheets

Finally, transferability • The competitive long-run supply curve is an ex ante construction:
it shows the supply price at which new producers will enter the market
• But once firms have entered and their investment costs have been sunk, the cost/supply price calculus changes
• In an established industry, the long-run supply curve shows the transfer earnings of al inputs including land and other fixed assets
• Hydroelectric dams and geothermal generating plants and gas turbines are “specific assets” which mean they don’t have very lucrative alternative uses => their transfer earnings are basically their scrap value
• So we can identify how far the price can be driven down before the various suppliers would actually exit the industry, and this gives a supply curve that looks much more like this:
91

92
Source: New Zealand Power: Energising New Zealand, Labour Party policy document April 2013, p.7.

93
Source: Empowering New Zealand: Greens Discussion Paper, April 2013, p.5

Or, if we cast our minds back twenty years:
94

Ironically, the Electricity Authority has no role in this debate over rents
• “[T]he Authority’s focus is on promoting competition, reliable supply and efficiency in the electricity industry for the long-term benefit of consumers. Consideration of fairness or equity issues is the responsibility of the MED [Ministry of Economic Development].”
Ministry of Economic Development (2011) Memorandum of Understanding between the Electricity Authority and the Ministry of Economic Development, January 2011, http://www.med.govt.nz/sectors-industries/energy/pdf-docs-
library/electricity-market/electricity-industry/specific-legislation/mou-electricity-authority-MED.pdf, p.6 paragraph 6. .
95
So to the big question: did the industry and the Government have a regulatory compact back in 1999 that opened the way for
the price-gouging/rent-collection since?
• In other words, did the transfer of ownership to the five gentailers come with an unrestricted right to exploit their market power?
• This is the crux of “light-handed regulation”: promises of responsible behaviour are accepted up front in return for government withholding its regulatory hand
• But after the event, if the industry has broken its promises, what is the regulatory comeback?
• If not retrospective clawback, then the initial policy was time-inconsistent
96

Max Bradford didn’t think he was opening the door to massive price increases
“Power prices will not rise under proposed energy reforms unless power companies make them, Energy Minister Max Bradford said... Mr Bradford said yesterday there was `no reason at all why electricity prices should rise for domestic or rural consumers under the Coalition Government's proposed reforms. If these prices do rise, it will only be because of explicit decisions by the power companies themselves and not because of the effect of the bill
The Press 23 June 1998 During debate on [electricity] legislation [in June 1998], Mr Bradford, Mr Luxton and Treasurer Bill Birch all claimed power prices in general would fall. Mr Luxton himself predicted "... power prices will be lower for ordinary New Zealanders.“ And two weeks ago, in response to TransAlta's price rise announcement, Mr Bradford said he had staked his reputation on bringing prices down for all customers.
NZ Herald 21 April 1999 “We promised consumers choice and lower power prices.”
(http://www.maxbradford.co.nz/national_news/electricity/2001-10-15_electricity_brad.htm )
97

Then came the Labour Government’s Energy Policy Framework Oct 2000:
• “Costs and prices to consumers which are as low as possible, while ensuring that prices reflect the full costs of supply including environmental costs”, and
• “Fairness in pricing so that the least advantaged in the community have access to energy services at reasonable prices.”
No signal there that price-gouging and ‘fair-value’ revaluations will be OK … On the contrary, the first point is flatly incompatible with subsequent industry behaviour

So unless Government was acting in bad faith, average prices ought not to have risen as they have done
• If we take “light-handed regulation” at face value, the correct policy response to the past decade is to roll back the revaluations by requiring write-downs
• How the resulting revenue reductions are distributed to consumers is a matter of detailed tariff-setting
– I and the Greens argue for progressive pricing
– Labour has foreshadowed US-style flat average-cost tariffs but is “open to progressive pricing”
99