assignment form 6
TRANSCRIPT
1.0 Definition
There are several types of area bounded by a curve and the x-
axis. As examples; area bounded by the curve and the x-axis, area
bounded by the curve and the y-axis, the area between two functions
and area bounded by a function whose sign changes.
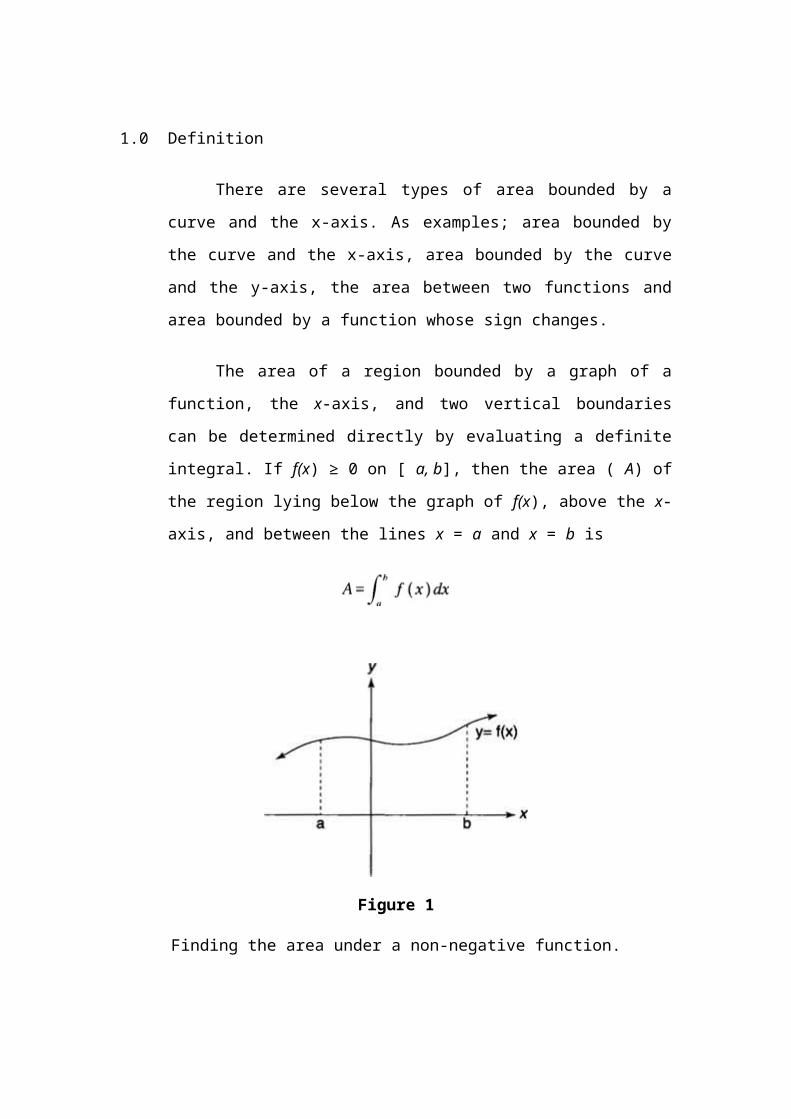
The area of a region bounded by a graph of a function, the x-
axis, and two vertical boundaries can be determined directly by
evaluating a definite integral. If f(x) ≥ 0 on [ a, b], then the area ( A) of
the region lying below the graph of f(x), above the x-axis, and between
the lines x = a and x = b is
Figure 1
Finding the area under a non-negative function.
If f(x) ≤ 0 on [ a, b], then the area ( A) of the region lying above the
graph of f(x), below the x-axis, and between the lines x = a and x = b is

Figure 2
Finding the area above a negative function.
If f(x) ≥ 0 on [ a, c] and f(x) ≤ 0 on [ c, b], then the area ( A) of the
region bounded by the graph of f(x), the x-axis, and the lines x = a and
x = b would be determined by the following definite integrals:

Figure 3
The area bounded by a function whose sign changes.
Note that in this situation it would be necessary to determine all
points where the graph f(x) crosses the x-axis and the sign of f(x) on
each corresponding interval.
For some problems that ask for the area of regions bounded by
the graphs of two or more functions, it is necessary to determine the
position of each graph relative to the graphs of the other functions of
the region. The points of intersection of the graphs might need to be
found in order to identify the limits of integration. As an example, if f(x)
≥ g( x) on [ a, b], then the area ( A) of the region between the graphs of
f(x) and g( x) and the lines x = a and x = b is
Figure 4
The area between two functions

Note that an analogous discussion could be given for areas
determined by graphs of functions of y, the y-axis, and the lines y = a
and y = b.
Example 1: Find the area of the region bounded by y = x2, the x-axis, x
= –2, and x = 3.
Because f(x) ≥ 0 on [–2,3], the area ( A) is
Example 2: Find the area of the region bounded by y = x3 + x2 – 6 x
and the x-axis.
Setting y = 0 to determine where the graph intersects the x-axis, you
find that
Because f ( x) ≥ 0 on [–3,0] and f ( x) ≤ 0 on [0,2] (see Figure 5 ), the
area ( A) of the region is

Figure 5
Diagram for Example 2.
Example 3: Find the area bounded by y = x2 and y = 8 – x2.
Because y = x2 and y = 8 – x2, you find that

Hence, the curves intersect at (–2,4) and (2,4). Because 8 – x2 ≥ x2 on
[–2,2] (see Figure 6 ), the area ( A) of the region is
Figure 6
Diagram for Example 3.

2.0 Lesson plan for form 6 secondary school in order to find the area
bounded by a curve and the x-axis.
Find the area bounded by the curve and the x-axis.
Learning outcomes: At the end of this unit students will be able to;
Find the area bounded by a curve, the x-axis and the ordinates x = a
and x = b when the area is on one side of the x-axis.
Prior knowledge:
Understand the relationship between the area under a curve and the
definite integral.
Teaching aids: Graph paper.
Procedure:
1. Teacher will explain roughly about area bounded by showing
examples with the aid of slide show of Microsoft power point
software.
a. Sketch the curve.
b. Find the two pints where the curve cuts the x-axis.
c. Apply the area.
2. Teacher will divide students in the group of 5.
3. Students are asked to find the area bounded by the curve
from the given questions by using correct steps.
4. Students will discuss the questions in class.
5. Exercises regarding the topic will be given individually.
6. The teacher will make conclusion of the topic.

Name: ____________________________ Class: ____________
1. Find the area underneath the curve y = x2 + 2 from x = 1 to x = 2.
.
Appendix 1SMK BANDAR BARU SUNGAI BULOH47000 SUNGAI BULOH, SELANGOR.

1. Name: ____________________________
Class: ____________2. Find the area bounded by y = x2 −
4, the x-axis and the lines x = -1 and x =2. .
Name: ____________________________
Class: ____________ 3. What is the area bounded by the
curve y = x3, x = -2 and x = 1? Question
1Solution

Question 2Solution

Question
3SolutionNOTE: In each of Case (1), (2) and (3), the curves
are easy to deal with by summing elements L to R:
We are
(effectively) finding the area by horizontally adding the
areas of the rectangles, width dx and heights y (which we
find by substituting values of x into f(x)).So
(with absolute value signs where
necessary).. Name:
____________________________ Class:
____________Area function1a define A(x) to be the area
bounded by the x-axis and the function f(x) = 3 between the
y-axis and the vertical line at x. ( see the diagram )A(1) =
_________________________A(2) =

_________________________A(3) =
_________________________A(4) =
_________________________And, in general,A(x)
=_______________________________ ( a formula )
Example 1:Step 1:Define A (x) to be the area bounded by
the x-axis and the function f(x) = 1/r between the liner x = 1
and the vertical line at x.Based on your work in problem
1A’(x) = ____________________Computer A(1) =
_______________________Computer A (x) =
______________________Step 2:So the area under f(x) =
1/x between x=1 and x =2 equal to in (2). Outline this area o
the graph. Well use estimates of this area to computer
approximations of In(2).Step 3: Slice the area up in to 4
pieces by drawing 3 evenly spaced vertical lines from the x-
axis up to the curve.Step 4 :Using the left side of each slice
as the height, sketch in 4 rectangles in your graph. What are
the x-coordinates of the sides of the rectangle? Plug these
x-coordinates into f(x) =1/x to computer the heights of the
rectangles. Find the areas of the 4 rectangles and add them
up. This is your first approximation of the area under the
curve, and In(2). Is it an over-estimate or an under-
estimate? Step 5:Using the right side of each slice as the
height, sketch in 4 rectangles in your graph. Find the area of
these rectangles and add them up. This your second
approximation of the area under the curve, and In(2). Is it an
over-estimate or an under-estimate? Step 6:Take the
average of your two estimate to get a new estimate of In(2).
How does it computer with the value given by your
calculator?Step 7:Use the midpoint of each slice to
determine the height and sketch in the resulting 4
rectangles. Use them to approximate In(2). Can you tell if
you are getting an over-estimate or and under-estimate?
Which of your four estimate gives you the closest answers
to the value given by your calculator?3.0 Conduct the

tutorial class to week students on the topic learning
programming. A factory manufactured two types of
souvenirs: toy and key chain, which are made of plastic and
rubber. To make 1 unit of toy, 1 unit plastic and 1 unit of
rubber are needed. For 1 unit of key chain, 5 units of plastic
and 2 units of rubber are needed. The daily amount of
plastic and rubber available for production are 400 and 1100
units respectively. The daily production capacity of factory
for toys and key chains are 150 and 360 respectively. The
net profit obtained from toys and key chains are RM5 and
RM4 per unit respectively. How many of toys and key chains
should be produced by the manufacturer in order to obtain
maximum profit? Formulate this problem as a linear program
to maximized the profits obtained.Solution:Step 1
Understanding the problemStudent
must read the questions carefully until they understand what is the
requirement of questions given.The problem is to determine the
number of toys and key chains to be produced by the manufacturer
in order to obtain maximum profit.Step 2
Identifying all the variablesStudents need to identify or
observe the information given and find the related
information in simple sentences to understand.Consider x as
the number of units of toy to produce and y as the number of
units of key chain to produce.Step 3 Identifying the
objective function and all the constraintsFrom the
information given, x units of plastic will be required to
produce x units of toy and y units of plastic will be required
to produce y units of key chain. So, the total amount of
plastic used to produced to produce x units of toy and y units
of key chain is (x + y) units. The maximum amount of plastic
used per day cannot exceed 400 units.This condition can
expressed algebraically as the inequality x + y 400. This
inequality is known as a constraint for the plastic
resource.Similarly, to produce x units of toy and y units of

key chains, where profit obtained from the sales of toys and
key chains are RM5 and RM4 per unit respectively, the total
amount of rubber required is (5x + 2y) units and this quantity
cannot exceed 1100 units per day. So, the constraint for the
rubber resource is (5x + 2y) 1100.The production capacity
of toys is 150 units per day. This means the factory cannot
manufacture more than 150 units of toy daily. This
requirement is represented by the inequality x
150.Similarly, the production capacity for key chain is
represented by the inequality y 360.The total amount of
profit obtained from selling x units of toy and y units of key
chain is RM (5x + 4y), and this amount is to be
maximized.The variables x and y cannot be negative values
since the represented quantities to be produced. This is
represented by the inequalities x 0 and y 0.Therefore,
the mathematical formulation of the problem is given as
follows:Maximize z = 5x + 4y objective
functionSubject to x + y 400 5x + 2y
1100 x 150
constraint y 360
x 0 , y 0 CI These inequality formulas will
ease the students to clarify the questions
given.REFERENCESAisah Ali, Nor Hayati Md. Yusof,
HBMT4403, Teaching of Mathematics for Form Six
Secondary School, July 2009, Open University Malaysia,
Kuala Lumpur.David F Treagust, Reinders Devit, Barry J
Fraser, (1996). Improving Teaching and Learning in
Sciences and Mathematics, Teachers College Press, New
York.Lilian C M c Dermott, In Electronic Journal Of
Mathematics Education, Vol 2, No 2,- December 1997.Tey
Kim Soon, Goh Choon Booy, Tan Ah Geok, Matematik STPM,
Sukatan S & T, 1995, Penerbitan Pelangi Sdn. Bhd, Johor
Bahru.http://www.cliffsnotes.com/WileyCDA/CliffsReviewTopic/
topicArticleId-39909,articleId-39905.html>.http://

www.intmath.com/Applications-integration/2_Area-under-
curve.php