assisted reverse electrodialysis: a novel technique … · 1 assisted reverse electrodialysis: a...
TRANSCRIPT

1
ASSISTED REVERSE ELECTRODIALYSIS: A NOVEL TECHNIQUE TO
DECREASE REVERSE OSMOSIS ENERGY DEMAND
Marjolein Vanoppen, PaInT, Ghent University, Coupure Links 653, 9000 Ghent, Belgium
[email protected], www.paint.ugent.be, Ph: +32 (0)9 264 99 11
Ella Criel, PaInT, Ghent University, Ghent, Belgium
Stephen Andersen, LabMET, Ghent University, Ghent, Belgium
Antonin Prévoteau, LabMET, Ghent University, Ghent, Belgium
Arne R. D. Verliefde, PaInT, Ghent University, Ghent, Belgium
Abstract
Assisted reverse electrodialysis (ARED) was introduced as a pre-desalination technique for
seawater reverse osmosis (RO) for drinking water production. ARED is comparable to an
additional applied pressure along the osmotic pressure in pressure assisted osmosis; a small
voltage is applied in the same direction as the open cell voltage to increase the desalination speed
compared to reverse electrodialysis (RED). This decreases the required membrane area. The
concentration of the dilute compartment increases significantly during ARED operation due to
the increased speed of desalination. This results in an overall decrease in total cell resistance.
Although the energy demand for ARED is higher than for RED, the ARED-RO process still
achieves a decrease in overall energy requirements at higher RO recoveries when compared to
stand-alone RO. However, ion-exchange membrane prices will have to come down to 1-10 €/m²
for the ARED-RO hybrid to become economically viable at current energy prices.
Introduction
In recent years, the water-energy nexus has become increasingly studied, as the global population
and environmental challenges increase. Not only are traditional fossil energy-sources running out,
a shortage of potable water is also imminent (Postel et al. 1996). Seawater is attracting more and
more attention as a source of potable water, but its high salt content entails a high energy demand
in production of potable water using water-salt separation processes such as reverse osmosis
(RO). With this technology, 2-3 kWh/m³ is required to overcome the osmotic pressure of up to 60
bar in the concentrate at a water recovery of 50% (Kalogirou 2005; Elimelech & Phillip 2011;
Greenlee et al. 2009). Furthermore, the salt concentration in the produced brine is double that of
the original seawater, which can cause severe ecological problems when discharged back into the
sea (Latorre 2005).
Some pilot plants have shown RO operation at as low as 1.8 kWh/m³ (Semiat 2008; Schiermeier
2008), but further improvements are limited as the thermodynamic limit of specific energy
consumption for seawater desalination is 1.06 kWh/m³ (considering 35 g/l total dissolved solids
and 50% RO recovery) (Elimelech & Phillip 2011; Semiat 2008). Energy represents about a third
of the overall operational costs of RO desalination plants, the other two thirds being attributed to
capital costs and all other operational costs (maintenance, labour, etc.) (Blandin et al. 2014).
Decreasing the RO energy demand is an important step to increase the economic viability of
application of seawater desalination and increase its sustainability.

2
In 2011, Elimelech and Philip concluded that future savings in seawater RO need to focus on pre-
and post-treatment, as current RO operations are already so close to the thermodynamic energy
limit (Elimelech & Phillip 2011). Salinity gradient power and osmotic dilution represent a new
opportunity to reduce energy needs in seawater desalination. In previous research, we showed
that implementing reverse electrodialysis (RED) as a pre-treatment before RO significantly
impacts the RO energy demand in two ways: energy is produced in RED based on the salinity
gradient between seawater and a low concentration stream (e.g. treated wastewater) and the
seawater concentration decreases, entailing a lower energy demand in the RO system itself
(Vanoppen et al. 2014; Vanoppen et al. 2016). The hybrid scheme with RED as a pre-treatment is
shown in
Figure 1. The downside of RED is the relatively high membrane area required for desalination, as
the desalination is rather slow. This has an important impact on the economic viability of such a
hybrid scheme.
Figure 1. Envisioned hybrid RED-RO process for the decrease in RO energy demand
To overcome this limitation of RED and increase the salt transport rate, a similar approach as in
pressure retarded osmosis (PRO) or forward osmosis (FO) can be designed. In these processes
water is transported (rather than ions) to produce energy (PRO) or extract water from a
concentrated stream (FO). Limited desalination speeds in these processes entail a high membrane
requirement. Pressure assisted osmosis (PAO) was therefore designed, in which a small
additional pressure is applied to the diluted water stream to increase the water flux across the
membrane and decrease the required membrane area. Blandin et al. (2014) showed that the
hybrid PAO-RO process can be economically favourable over an FO-RO hybrid (Blandin et al.
2014). In RED, a similar process can be developed, where a small additional potential is applied
across the membranes along with the concentration gradient, to increase the rate of salt transport
from the seawater to the diluted stream. This process was called assisted RED (ARED)
(Vanoppen et al. 2014; Vanoppen et al. 2016), and may decrease RO energy demand to as low as
1.2 kWh/m³.
In this study, the fundamentals of the ARED process are tested on a lab-scale set-up. The ARED
process was simulated using synthetic feed and the performance was compared to theoretical
expectations. The ARED-RO and RED-RO processes were modelled and a basic economic
assessment performed.
3
Theoretical considerations
Theoretically, a curve as shown in Figure 2 (full line) is expected for the current-voltage relation
in electrochemical membrane processes. This relation is based on the relationship between the
voltage over the membrane stack and the current:
Estack = EOCV + i ∙ Rstack (1)
With EOCV the open circuit voltage (V), i the applied current (A) and Rstack the total stack
resistance (Ω). The open circuit voltage and total stack resistance are given by equations 2 and 3:
Rstack =N
Am(
RAEM
1−β+
RCEM
1−β+ (
hC
κc ∙ ε2) + (
hD
κd ∙ ε2)) (2)
EOCV = N ∙ αRT
zFln (
CC
CD) (3)
With N the number of cell pairs, Am the active membrane surface for one membrane (m²), RAEM
and RCEM the membrane resistances (Ω.m²) for the anion-exchange membranes (AEM) and
cation-exchange membanes (CEM), β the spacer shadow factor (-), h the compartment thickness
(m, with C the concentrate compartment and D the dilute compartment), κ the conductivity of the
solutions (S/m) and ε the spacer porosity (-). In equation 3, α is the membrane permselectivity (-),
R is the universal gas constant (8.314 J/(mol.K)), T is the temperature (K), z is the ion valence, F
is the Faraday constant (96485 C/mol) and C is the concentration (mol/m³).
The full line in Figure 2 shows the ideal case, the striped line shows what is expected in reality
due to concentration polarisation (CP). CP arises due to a difference in transport rate in the bulk
and in the membrane, resulting in a concentration difference across the membrane as shown in
Figure 3. In the electrodialysis (ED, positive current and potential) region, CP causes the
resistance to increase because of a concentration increase at the membrane surface on the dilute
side and a concentration decrease at the membrane surface at the concentrate side. In RED, CP is
expected to be less severe because a low current is produced by the spontaneous transport of ions
from the high to the low concentration side. In ARED, an additional potential difference across
the membranes increases the current in the stack and thus the transport of ions. This is expected
to have a bigger impact on the concentrations at the membrane interfaces, resulting in a lower
driving force for ion transport. Current is increased in the system by adding a small external
potential difference which results in a more severe CP and a less efficient system when compared
to RED, as shown by the striped line.

4
Figure 2. Schematic representation of the theoretical and expected current-voltage curve in electrochemical membrane processes
Figure 3. Schematic representation of the ion transport and corresponding concentrations in dilute and concentrate in ARED,
RED and ED
Materials and methods
In this study, the behaviour of ARED was investigated and modelled based on continuous
experiments with synthetic salt streams.
Continuous experiments
A plexiglas cell including 5 cell pairs was used for all experiments. Fujifilm type II (Fujifilm, the
Netherlands) AEM and CEM with an active surface area of (7.8 × 11.2) cm² were used. The 11
membranes were enclosed by a stretched titanium anode with an iridium mixed metal oxide
coating and a stretched titanium cathode with a ruthenium mixed metal oxide coating (Magneto,
the Netherlands). In both end plates, close to the electrodes, a Ag/AgCl reference electrode was

5
inserted (RE-5B, BASi, USA), to measure the potential difference over the membrane stack
excluding losses associated with redox reactions at the electrodes.
Different concentrations and flow velocities were compared, which will be specified when
discussing the results. In each experiment, the current was adjusted step-wise, between 0 and
−1.2 A (− 137 A/m²) and the corresponding potential difference was recorded after stabilisation
of the signal. The current was applied in the direction of the ion-transport according to the
concentration gradient, from the dilute to the concentrate, denoted in this study as a negative
current. In ED, the current applied is positive. The goal of these experiments was to compare the
theoretically expected curve as shown in Figure 2 with the experimentally obtained current-
voltage relation.
Economic analysis
A preliminary estimation of the economic viability of the hybrid system was performed
assuming that the model fitted to the experimental data is valid for full-scale systems. The total
cost was based only on membrane costs (CAPEX) and energy costs (OPEX) which allows for a
comparison between stand-alone RO, RED-RO and ARED-RO and can give an indication of the
viability of the hybrid systems, despite the simplification. A membrane size of (0.5 × 0.5) m² was
assumed, with the same properties as previously discussed. The power production/requirement
was estimated based on the assumed current and modelled stack voltage. The influence of the
current density and degree of pre-desalination were investigated. A membrane lifetime of 7 years
and cost of €100/m² (Daniilidis et al. 2014) were assumed for the ion-exchange membranes. For
RO, a membrane lifetime of 5 years and cost of €10/m² were assumed. A feed flow rate of 5 m³/h
was assessed, with a conventional RO flux of 0.02 m³/(m²h).
Results and discussion
Continuous experiments: comparing theory to practice
Artificial sea- and wastewater (0.5 M and 0.01 M NaCl respectively) were run through the ARED
system at a flow velocity of 100 ml/min. The corresponding current-voltage curve, compared to
the theoretical straight line (not including CP), is shown in Figure 4. The theoretical straight line
curve is based on equations 1-3, assuming a permselectivity of 0.95 (as given by the
manufacturer). The ohmic resistance is based on a constant feed solution concentration and
assuming a constant membrane resistance.
6
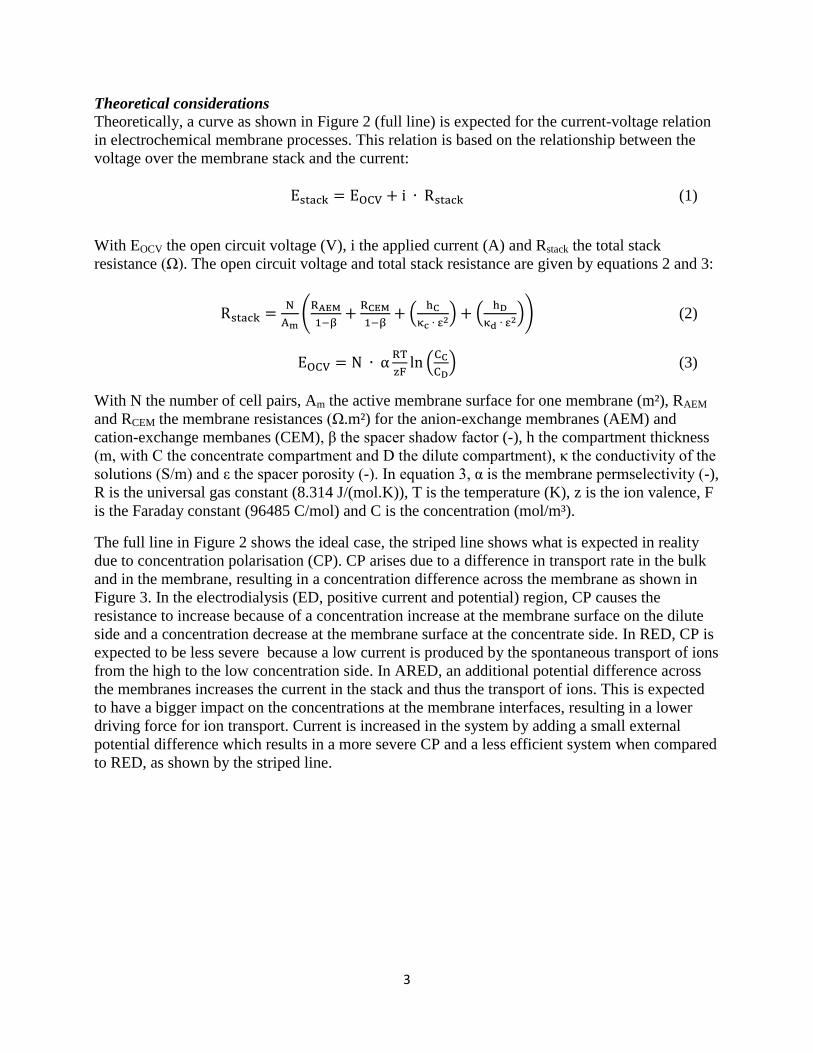
Figure 4. Exploratory experiment comparing the theoretically expected current-voltage relation and the measured data points
The current density levels off at an increasing potential difference in the ED region, due to CP
effects. The measured points in the RED region are positioned slightly higher than the theoretical
curve, resulting in a lower current density than expected in the ideal case. In the ARED region,
the measured data points are positioned below the theoretically expected curve, contrary to what
is expected from the CP effects. The obtained current at a certain potential difference is higher
than what would be expected and the required energy to obtain a certain desalination degree is
thus less than theoretically calculated. A detail of the ARED region is shown in Figure 5.
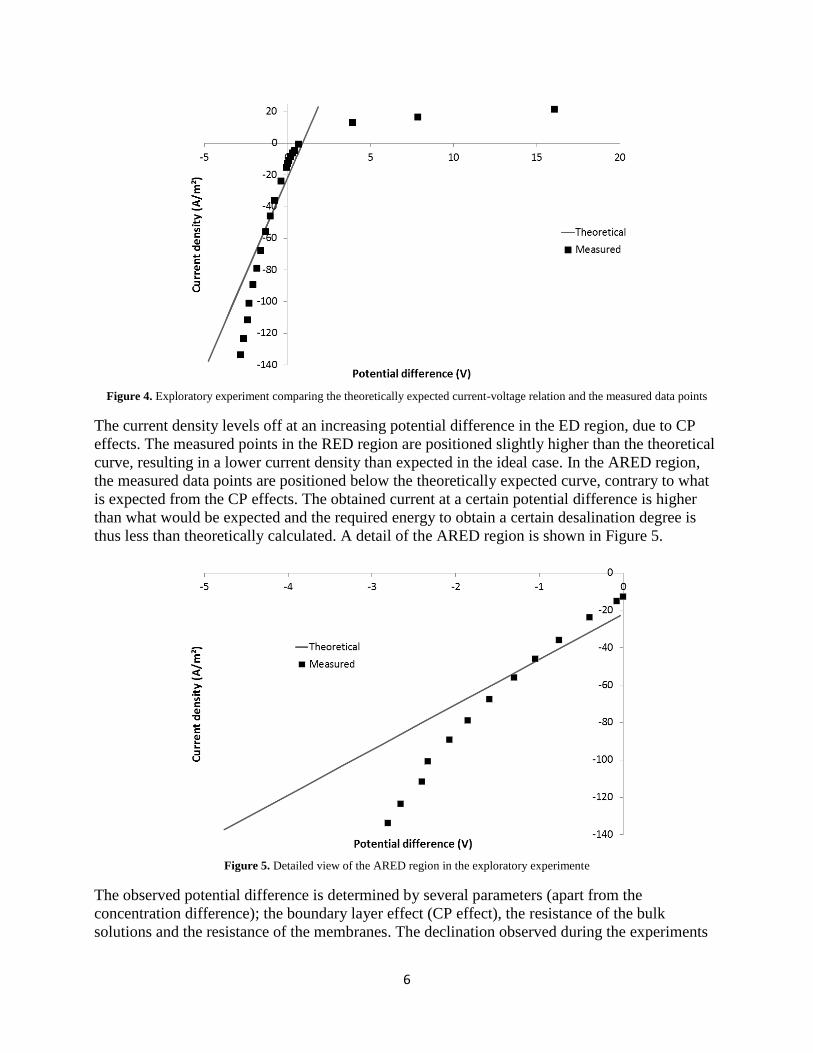
Figure 5. Detailed view of the ARED region in the exploratory experimente
The observed potential difference is determined by several parameters (apart from the
concentration difference); the boundary layer effect (CP effect), the resistance of the bulk
solutions and the resistance of the membranes. The declination observed during the experiments

7
indicates that there are phenomena occurring which counter the negative impact of the CP, which
is expected to play a significant role here because of the applied potential difference. A drop in
solution and/or membrane resistance has to occur to explain the observed decline in potential
difference. It is hypothesised that because of the faster desalination (caused by the added external
potential difference), the increase in bulk concentration for the low salinity compartment causes
the resistance of the compartment to decrease significantly. Galama et al. (2014) showed that the
concentration of the low salinity compartment determines the membrane resistance (Galama et al.
2014). Both the solution and the membrane resistance should decrease because of the increase in
concentration due to desalination in ARED. As shown in Figure 6, the decrease in solution
resistance (and thus total stack resistance) at increasing concentrations shows an exponential
relation at low concentrations. The membrane resistance is expected to behave in a similar way.
This indicates that the decrease in resistance counteracts the negative effects of concentration
polarisation, resulting in the observed declination in the potential difference.
Figure 6. Relation of the solution resistance to the NaCl concentration
Figure 7 shows the effect of changing the concentration of the dilute solution (Cd, with a constant
concentrate concentration Cc of 0.5 M). At a Cd of 0.005 M and 0.01 M, the curves show the
same downward inflection as discussed before, indicated here by the negative second order
coefficient in the polynomial fit. At 0.05 M, the curve becomes linear, with no distinguishable
inflection. The effects from CP and changes in the resistances seem to balance each other out,
resulting in a nearly theoretical line. An upward inflection arises when the dilute concentration is
increased even further, indicated by a positive second order coefficient in the polynomial fit in
that case. The CP effect overtakes the effect of the decreasing resistance at this point. The latter is
explained by the relationship between the bulk concentration and its resistance, which is not
linear; at low concentrations, the resistance decreases rapidly with increasing concentrations,
while the decrease in resistance is negligible at higher concentrations. At a Cd of 0.1M NaCl, the
change in resistance due to desalination, both of the solution and the membrane, is sufficiently
small for the CP effect to take over here.

8
Figure 7. Current-voltage diagram for different dilute concentrations (Cd) and a constant concentrate concentration of 0.5M NaCl
(cross-flow velocity = 4.4∙10-3 m/s). Equations of best linear/polynomial fit are shown with their respective correlation coefficient
Economic cost of the ARED system: influence of current density and degree of pre-desalintion
Permselectivity and the membrane resistance parameters were fit to Equations 2 and 3
(Introduction) to perform an economic analysis. In Figure 8, the energy and membrane cost and
total cost are compared in euro per m³ of desalinated seawater. A membrane price of 100 €/m²
(Daniilidis et al. 2014) was assumed with a desalination degree of 40%, a flow-rate of 5 m³/h and
a fixed energy price of 0.1 €/kWh. Figure 8 shows the energy cost increases with an increasing
current density, as the CP effect increases and the efficiency of the process thus decreases. The
membrane cost decreases, as the required membrane area to reach 40% desalination decreases
with an increasing current density. The optimal current density at these conditions is 88 A/m².
Figure 8. Influence of the applied current density on the energy, membrane and total ARED cost at a flow rate of 5m³/h and a pre-
desalination degree of 40%
9
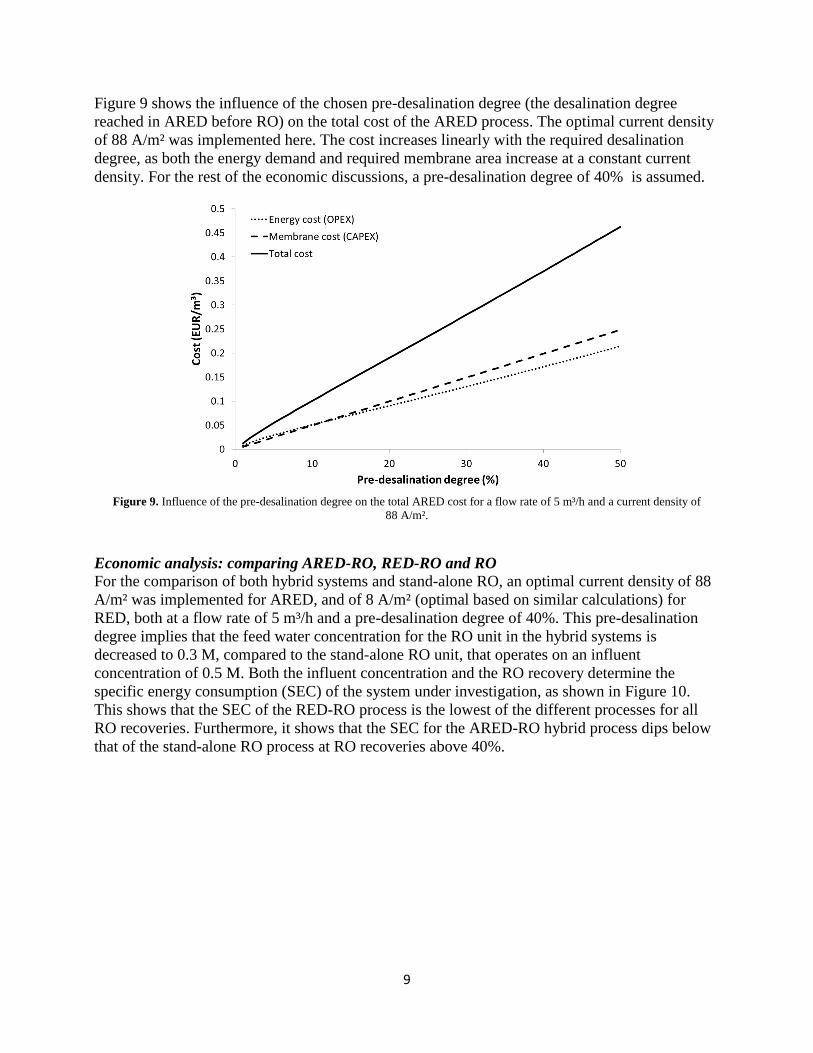
Figure 9 shows the influence of the chosen pre-desalination degree (the desalination degree
reached in ARED before RO) on the total cost of the ARED process. The optimal current density
of 88 A/m² was implemented here. The cost increases linearly with the required desalination
degree, as both the energy demand and required membrane area increase at a constant current
density. For the rest of the economic discussions, a pre-desalination degree of 40% is assumed.
Figure 9. Influence of the pre-desalination degree on the total ARED cost for a flow rate of 5 m³/h and a current density of
88 A/m².
Economic analysis: comparing ARED-RO, RED-RO and RO
For the comparison of both hybrid systems and stand-alone RO, an optimal current density of 88
A/m² was implemented for ARED, and of 8 A/m² (optimal based on similar calculations) for
RED, both at a flow rate of 5 m³/h and a pre-desalination degree of 40%. This pre-desalination
degree implies that the feed water concentration for the RO unit in the hybrid systems is
decreased to 0.3 M, compared to the stand-alone RO unit, that operates on an influent
concentration of 0.5 M. Both the influent concentration and the RO recovery determine the
specific energy consumption (SEC) of the system under investigation, as shown in Figure 10.
This shows that the SEC of the RED-RO process is the lowest of the different processes for all
RO recoveries. Furthermore, it shows that the SEC for the ARED-RO hybrid process dips below
that of the stand-alone RO process at RO recoveries above 40%.
10
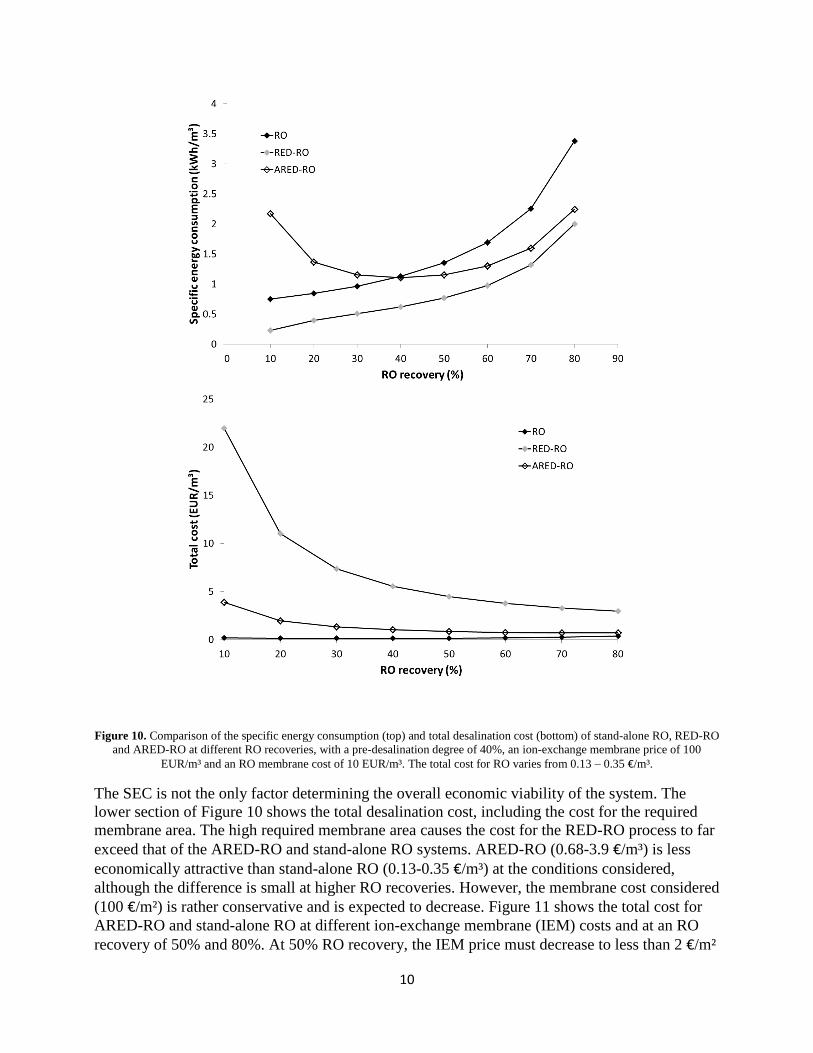
Figure 10. Comparison of the specific energy consumption (top) and total desalination cost (bottom) of stand-alone RO, RED-RO
and ARED-RO at different RO recoveries, with a pre-desalination degree of 40%, an ion-exchange membrane price of 100
EUR/m³ and an RO membrane cost of 10 EUR/m³. The total cost for RO varies from 0.13 – 0.35 €/m³.
The SEC is not the only factor determining the overall economic viability of the system. The
lower section of Figure 10 shows the total desalination cost, including the cost for the required
membrane area. The high required membrane area causes the cost for the RED-RO process to far
exceed that of the ARED-RO and stand-alone RO systems. ARED-RO (0.68-3.9 €/m³) is less
economically attractive than stand-alone RO (0.13-0.35 €/m³) at the conditions considered,
although the difference is small at higher RO recoveries. However, the membrane cost considered
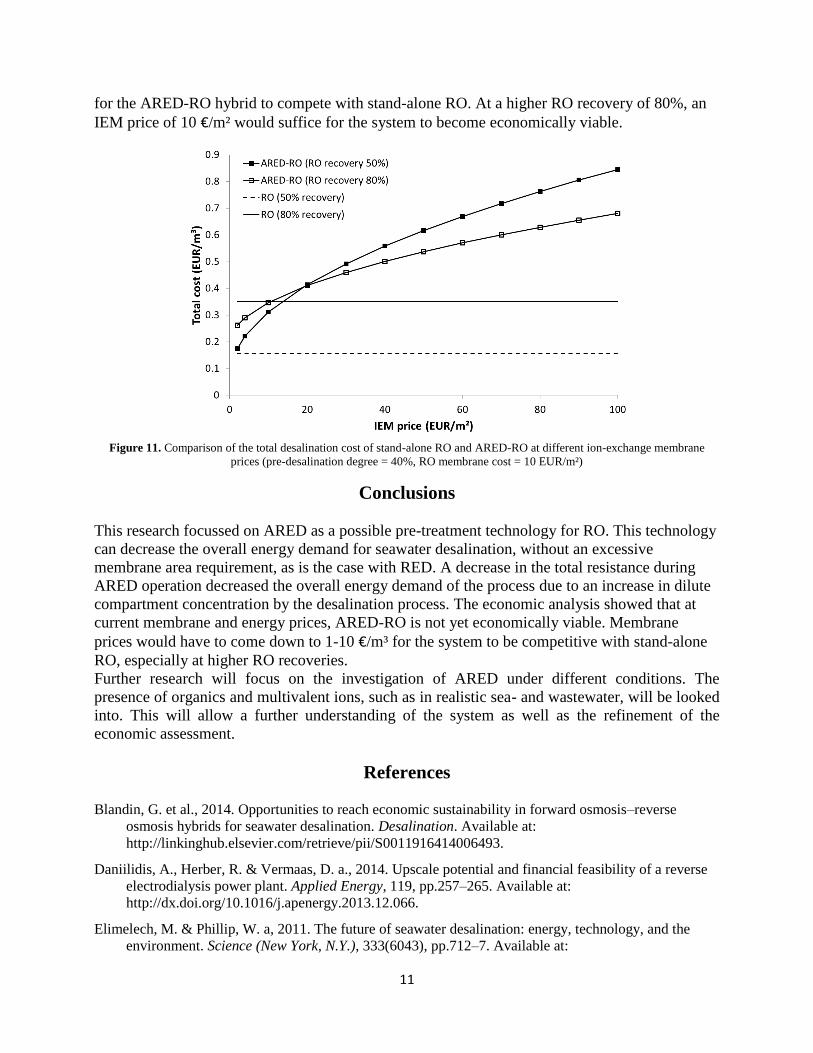
(100 €/m²) is rather conservative and is expected to decrease. Figure 11 shows the total cost for
ARED-RO and stand-alone RO at different ion-exchange membrane (IEM) costs and at an RO
recovery of 50% and 80%. At 50% RO recovery, the IEM price must decrease to less than 2 €/m²
11
for the ARED-RO hybrid to compete with stand-alone RO. At a higher RO recovery of 80%, an
IEM price of 10 €/m² would suffice for the system to become economically viable.
Figure 11. Comparison of the total desalination cost of stand-alone RO and ARED-RO at different ion-exchange membrane
prices (pre-desalination degree = 40%, RO membrane cost = 10 EUR/m²)
Conclusions
This research focussed on ARED as a possible pre-treatment technology for RO. This technology
can decrease the overall energy demand for seawater desalination, without an excessive
membrane area requirement, as is the case with RED. A decrease in the total resistance during
ARED operation decreased the overall energy demand of the process due to an increase in dilute
compartment concentration by the desalination process. The economic analysis showed that at
current membrane and energy prices, ARED-RO is not yet economically viable. Membrane
prices would have to come down to 1-10 €/m³ for the system to be competitive with stand-alone
RO, especially at higher RO recoveries.
Further research will focus on the investigation of ARED under different conditions. The
presence of organics and multivalent ions, such as in realistic sea- and wastewater, will be looked
into. This will allow a further understanding of the system as well as the refinement of the
economic assessment.
References
Blandin, G. et al., 2014. Opportunities to reach economic sustainability in forward osmosis–reverse
osmosis hybrids for seawater desalination. Desalination. Available at:
http://linkinghub.elsevier.com/retrieve/pii/S0011916414006493.
Daniilidis, A., Herber, R. & Vermaas, D. a., 2014. Upscale potential and financial feasibility of a reverse
electrodialysis power plant. Applied Energy, 119, pp.257–265. Available at:
http://dx.doi.org/10.1016/j.apenergy.2013.12.066.
Elimelech, M. & Phillip, W. a, 2011. The future of seawater desalination: energy, technology, and the
environment. Science (New York, N.Y.), 333(6043), pp.712–7. Available at:
12
http://www.ncbi.nlm.nih.gov/pubmed/21817042 [Accessed November 3, 2012].
Galama, a. H. et al., 2014. Membrane resistance: The effect of salinity gradients over a cation exchange
membrane. Journal of Membrane Science, 467, pp.279–291. Available at:
http://dx.doi.org/10.1016/j.memsci.2014.05.046.
Greenlee, L.F. et al., 2009. Reverse osmosis desalination: water sources, technology, and today’s
challenges. Water research, 43(9), pp.2317–48. Available at:
http://www.ncbi.nlm.nih.gov/pubmed/19371922 [Accessed March 3, 2013].
Kalogirou, S., 2005. Seawater desalination using renewable energy sources. Progress in Energy and
Combustion Science, 31(3), pp.242–281. Available at:
http://linkinghub.elsevier.com/retrieve/pii/S0360128505000146 [Accessed October 26, 2012].
Latorre, M., 2005. Environmental impact of brine disposal on Posidonia seagrasses. Desalination, 182(1-
3), pp.517–524. Available at: http://linkinghub.elsevier.com/retrieve/pii/S0011916405004662
[Accessed November 7, 2012].
Postel, S.L., Daily, G.C. & Ehrlich, P.R., 1996. Human appropriation of renewable fresh water. Science
(New York, N.Y.), 271(5250), pp.785–788.
Schiermeier, Q., 2008. Water: purification with a pinch of salt. Nature, 452(7185), pp.260–261.
Semiat, R., 2008. Energy issues in desalination processes. Environmental Science and Technology, 42(22),
pp.8193–8201.
Vanoppen, M. et al., 2014. Reduction of specific energy demand of seawater RO by osmotic
dilution/osmotic energy recovery - realistic modelling approach. In Desalination for the Environment:
Clean Water and Energy.
Vanoppen, M. et al., 2016. Salinity gradient power and desalination. In A. Cipollina & G. Micale, eds.
Sustainable energy from salinity gradients. London: Woodhead Publishing-Elsevier.