associated petroleum gas flaring study for russia ... · increased markedly from new production...
TRANSCRIPT

Associated Petroleum Gas Flaring Study for Russia,
Kazakhstan, Turkmenistan and Azerbaijan
Final Report

Associated Petroleum Gas Flaring Study for Russia, Kazakhstan, Turkmenistan and Azerbaijan
Page 2 of 80
This report was prepared by Carbon Limits AS in fulfilment of the requirements of the relevant study that was funded by the EBRD Shareholders Special Fund
Project title: Associated Petroleum Gas Flaring Study for Russia, Kazakhstan,
Turkmenistan, and Azerbaijan
Client: European Bank for Reconstruction and Development Project leader: Torleif Haugland Project members: Stephanie Saunier, Anders Pederstad, Tore Holm, Hesam Darani, Aigul
Kertesheva Subcontracted companies: Astus Engineering, Hamworthy Gas Systems, Petroleum Technologies
(Russia), Azerbaijan Energy Engineering and Consulting, Aidyn Tumyshev (Kazakhstan)
Report title: Associated Petroleum Gas Flaring Study for Russia, Kazakhstan, Turkmenistan, and Azerbaijan – Final Report
Report number: CL-13-28 Finalized: November 2013
This report has been prepared under the auspices of the European Bank for Reconstruction and Development (EBRD) and the Global Gas Flaring Reduction Partnership (GGFR). The authors are grateful for all guidance and the continuous support they have received throughout the assignment. In particular, we wish to thank Ioannis Papaioannou and Cristian Carraretto of the EBRD and Bent Svensson and Bakhtiyar Karimov of the GGFR. The view and conclusions presented in this report are those of Carbon Limits AS and are not necessarily shared by the EBRD and the GGFR. Carbon Limits AS accept no responsibility for the consequences of this document being relied upon by any other party, or being used for any other purpose, or containing any error or omission which is due to an error or omission in data supplied to us by other parties. Reproduction is authorized provided the source is acknowledged.
About Carbon Limits AS Øvre Vollgate 6 NO-0158 Oslo Norway www.carbonlimits.no Registration/VAT no.: NO 988 457 930
Carbon Limits is a consulting company with long standing experience in supporting energy efficiency measures in the petroleum industry. In particular, our team works in close collaboration with industries, government, and public bodies to identify and address inefficiencies in the use of natural gas and through this achieve reductions in greenhouse gas emissions and other air pollutants.
Associated Petroleum Gas Flaring Study for Russia, Kazakhstan, Turkmenistan and Azerbaijan
Page 3 of 80
Table of contents
EXECUTIVE SUMMARY ........................................................................................................................................... 5
1. INTRODUCTION ............................................................................................................................................. 9
1.1 PURPOSE, FOCUS AND ANALYTICAL APPROACH ........................................................................................................ 9 1.2 OVERVIEW OF FLARING LEVELS AND TRENDS ......................................................................................................... 12 1.3 INVESTMENTS IN APG UTILIZATION BY 2020 ........................................................................................................ 15
2. REVIEW OF FLARING SITUATION IN TARGET COUNTRIES ............................................................................. 17
2.1 RUSSIA .......................................................................................................................................................... 17 2.2 KAZAKHSTAN .................................................................................................................................................. 25 2.3 TURKMENISTAN .............................................................................................................................................. 33 2.4 AZERBAIJAN ................................................................................................................................................... 39
3. ECONOMIC VIABILITY OF APG UTILIZATION OPTIONS ................................................................................. 44
3.1 CHARACTERISTICS OF FLARED GAS ....................................................................................................................... 45 3.2 TECHNOLOGY COMPONENTS OF APG UTILIZATION OPTIONS .................................................................................... 46 3.3 ATTRACTIVENESS OF INVESTMENTS IN APG UTILIZATION ......................................................................................... 55 3.4 SUMMARY ..................................................................................................................................................... 65
4. HOW TO FURTHER IMPROVE APG UTILIZATION .......................................................................................... 67
4.1 SCALE AND CHARACTER OF THE PROBLEM ............................................................................................................. 67 4.2 DO “BEST PRACTICE” REGULATIONS AND POLICIES EXIST? ........................................................................................ 69 4.3 NEW TECHNOLOGIES AND COMMERCIAL APPROACHES ............................................................................................ 70 4.4 CAPITAL REQUIREMENTS FOR APG UTILIZATION INVESTMENTS ................................................................................. 73 4.5 OPTIMIZATION OF GAS UTILIZATION RATES ........................................................................................................... 75 4.6 CONCLUDING REMARKS .................................................................................................................................... 77
GLOSSARY ............................................................................................................................................................ 78
UNITS ................................................................................................................................................................... 79

Associated Petroleum Gas Flaring Study for Russia, Kazakhstan, Turkmenistan and Azerbaijan
Page 4 of 80
Table of figures FIGURE 1: OVERVIEW OF “100 SITES” ..................................................................................................................................................................... 10
FIGURE 2: ATTRACTIVENESS OF CONCEPTUAL GAS UTILIZATION OPTIONS VIS-À-VIS RECOVERABLE GAS VOLUMES............................................. 11
FIGURE 3: FLARE VOLUME AND FLARE INTENSITIES ................................................................................................................................................ 12
FIGURE 4: FLARE VOLUMES IN RUSSIA, NATIONAL STATISTICS AND SATELLITE ESTIMATES, BCM/YEAR ................................................................ 13
FIGURE 5: FLARE INTENSITIES IN RUSSIA, KAZAKHSTAN AND AZERBAIJAN, IN 𝑚3 GAS PER 𝑚3 OIL ...................................................................... 14
FIGURE 6: APG UTILIZATION RATES IN THE FOUR TARGET COUNTRIES, 2006-2012 ............................................................................................... 15
FIGURE 7: CAPITAL EXPENDITURES FOR APG UTILIZATION TILL 2020 IN RUSSIA, BILLION USD............................................................................... 16
FIGURE 8: FLARING OF APG BY REGION IN BCM, 2010-2012................................................................................................................................... 18
FIGURE 9: SHARE OF APG FLARING BY REGION IN 2012 .......................................................................................................................................... 19
FIGURE 10: FLARE VOLUMES IN KAZAKHSTAN ACCORDING TO NATIONAL STATISTICS AND SATELLITE IMAGE ESTIMATES ................................... 26
FIGURE 11: KAZAKHSTAN - OVERVIEW OF THE MAIN FLARING AREAS ................................................................................................................... 27
FIGURE 12: MAIN REGIONAL PIPELINES PROJECTS ................................................................................................................................................. 32
FIGURE 13: GAS FLARING ESTIMATES FROM NOAA OVER TIME COMPARED TO PRODUCTION DATA .................................................................... 34
FIGURE 14: OVERVIEW OF THE GAS PIPELINES PROJECTS IN THE REGION .............................................................................................................. 37
FIGURE 15: FLARING OF ASSOCIATED GAS AND GAS UTILIZATION RATE AT THE ACG BLOC AND THE SANGACHAL TERMINAL (ST)....................... 40
FIGURE 16: VENTED APG IN AZERBAIJAN ................................................................................................................................................................ 42
FIGURE 17: LONG-TERM DEVELOPMENT IN APG PRODUCTION AT AN ACTUAL OIL FIELD (1,000 M3/DAY) ........................................................... 46
FIGURE 18: TYPICAL REACTION ROUTES FOR GTL TECHNOLOGIES.......................................................................................................................... 52
FIGURE 19: OVERVIEW OF THE FOUR UTILIZATION OPTIONS EVALUATED ............................................................................................................. 56
FIGURE 20: SPLIT OF CAPEX FOR OPTION 1 DEPENDING ON THE REQUIRED PIPELINE LENGTH (0.1 BCM/YEAR) ................................................... 58
FIGURE 21: NETBACK VALUE OF THE GAS DEPENDING ON THE PIPELINE LENGTH AND THE VOLUME OF GAS TRANSPORTED .............................. 58
FIGURE 22: UNIT CAPEX FOR GPPS WITH DIFFERENT FEED GAS RATES, QUE$TOR AND PUBLICLY AVAILABLE ESTIMATES .................................... 59
FIGURE 23: DRY GAS NET-BACK VALUE FOR 0.1 BCM/YEAR (OPTION 2) ................................................................................................................. 60
FIGURE 24: SENSITIVITY ANALYSIS (0.5 BCM/YEAR AND 50 KM OF GAS PIPELINE FOR DRY GAS EXPORT).............................................................. 60
FIGURE 25: SENSITIVITY ANALYSIS - IMPACT OF A 10% CHANGE OF KEY ASSUMPTIONS ON PROJECT IRR (NOMINAL, POST-TAX) ........................ 61
FIGURE 26: CAPEX FOR OPTION 3 DEPENDING ON THE LENGTH OF THE INTERMEDIARY GAS PIPELINE (FOR SUPPLY OF FUEL GAS) .................... 62
FIGURE 27: CAPEX, OPEX AND ELECTRICITY NET-BACK VALUE FOR 0.5 BCM OF APG (OPTION 3) .......................................................................... 62
FIGURE 28: SENSITIVITY ANALYSIS FOR OPTION 3 (BASE CASE: 0.5 BCM/YEAR AND 50 KM PIPELINE) ................................................................... 63
FIGURE 29: REQUIRED DIESEL NET-BACK VALUES (USD/TON) FOR INVESTMENTS IN OPTION 4 WITH 7 DIFFERENT GAS SUPPLY SCENARIOS ...... 64
FIGURE 30: OVERVIEW OF APG UTILIZATION OPTIONS ........................................................................................................................................... 65
FIGURE 31: SIZE DISTRIBUTION OF FLARE SITES IN TARGET COUNTRIES ................................................................................................................. 67
FIGURE 32: PARTNERSHIPS FOR APG INVESTMENTS ............................................................................................................................................... 70
FIGURE 33: CLUSTERING OF APG SUPPLIES FROM MULTIPLE FIELDS ...................................................................................................................... 71
FIGURE 35: CAPITAL EXPENDITURES FOR SMALL FLARE SITES (< 0.1 BCM/YEAR) TILL 2020 IN RUSSIA, MILLION USD ........................................... 74
FIGURE 36: CAPITAL EXPENDITURES FOR MEDIUM AND LARGE FLARE SITES (> 0.1 BCM/YEAR) TILL 2020 IN RUSSIA, MILLION USD .................... 74
FIGURE 37: CAUSES OF OPERATIONAL FLARING AND POTENTIAL MEASURES FOR REDUCTION ............................................................................. 76

Associated Petroleum Gas Flaring Study for Russia, Kazakhstan, Turkmenistan and Azerbaijan
Page 5 of 80
Executive Summary
The European Bank for Reconstruction and Development in cooperation with the Global Gas Flaring
Reduction Partnership of the World Bank initiated in September 2011 a study on flaring of associated gas
in Russia, Kazakhstan, Turkmenistan and Azerbaijan. The aim of the study was to review the flare situation
and analyze appropriate technical solutions for the use of the associated petroleum gas, and to identify
bankable projects in the four countries covered (“target countries”).
The study consisted of four parts: i) a review of the flare situation, policies and regulations and flare
reduction actions in the target countries ii) identification of flare sites and dialogue with companies on
possible assistance in the analysis of flare reduction efforts iii) technical and economic analysis of specific
investment cases iv) dissemination of project results.
The flare situation
Flaring of associated gas is a major resource waste and causes large emissions of greenhouse gases and
air pollutants. Although the total volume of flaring is uncertain, the target countries combined currently
flare more than 20 billion cubic meters per year, of which almost 85% by Russia. Russia, unlike the other
countries in the study, has not managed to reduce the flaring over the past 5-6 years; flaring remains at
24-25% of total associated gas production. A flaring rate of 5% (gas utilization rate 95%), indicative of
elimination of routine flaring, is commonly set as a policy target for flaring, also in the four countries of
this study.
According to official national data, Kazakhstan has over the past 4-5 years made substantial progress
towards a 5% flare rate. Flaring in Azerbaijan is also close to that level, having oscillated around 6% since
2008. Azerbaijan has made large investments in gas utilization in parallel with the expansion of oil
production. This contrasts with the developments in Russia where investments in associated gas
utilization typically lag behind investments in new oil production capacity. As a result, flaring has
increased markedly from new production regions in Eastern Siberia, counterweighting the progress made
in flare reduction in mature oil regions such as Khanty Mansyisk.
Companies operating in Turkmenistan have made significant investments in flare reduction, but no
information is available on the overall impacts on flaring for the country.
Flare sites and flare reduction efforts
In order to select flare reduction cases for further scrutiny a screening process was initiated. Some 400
flare sites were identified using satellite images from the National Oceanic and Atmospheric
Administration (NOAA) and “on the ground data” from other data sources. Some 80% of the identified
sites had relatively modest flare volumes (each less than 100 million cubic meters annually), while less
than 10 sites (2.5%) flared more than one billion cubic meters. A review of ongoing flare reduction efforts

Associated Petroleum Gas Flaring Study for Russia, Kazakhstan, Turkmenistan and Azerbaijan
Page 6 of 80
indicate that many of the large flare sites have reduction solutions underway implying that small and
medium size flares site become even more important. Improving the economic attractiveness of gas
utilization investments from such sites should be the focus of future flare reduction policies and action.
It will require new ways of cooperation between political authorities and those companies taking on the
commercial risks of investments.
There will continue to be large flare sites, primarily connected to new production sites in Russia, but
flaring from these sites will typically be temporary as gas utilization solutions lag behind in field
development and commissioning. Eliminating this time lag is also important in order to bring flaring to a
minimum.
Gas utilization options and investment cases
A number of technology components (suitable for gas gathering, treatment and processing and transport
of products) can be used and alternative value chains can be established to avoid flaring. A
comprehensive review of the costs and benefit of gas utilization options, reflecting local and national
circumstances, have been reviewed as part of this study. It shows that they are highly case specific with
differences in costs of bringing gas to markets, and with differences in the quality of gas being supplied
and the local willingness to pay for the gas. Detailed results from the investment cases of this study
cannot (for commercial sensitivity reasons) be presented in this report, but some general conclusions can
be drawn:
Many flare reduction projects are economic (internal rate of return above seven percent) but are still
not being implemented. Since flare reduction investments on an everyday basis must compete with
oil production expansion for financial and human resources they are often not prioritized even if
awareness of the flaring problem has improved. One approach to spur flare reduction investments
with proven results (as shown in this study) is to invite external parties to purchase the associated
gas and to take on the commercial risks and financing of gas utilization projects.
Economies-of-scale is a key driver for the financial viability of flare reduction investments. Typically
small and medium size production sites cannot offer stable and large enough quantities of gas.
Therefore integrated solutions where gas from multiple sites are gathered and processed in
centralized facilities can improve considerably the economic return on investments. In one specific
case studied in Kazakhstan, supplies from three fields controlled by one company gave a twelve
percent rate of return on the investment. This was improved to eighteen percent when four more
fields were added.
Several investment cases with gas-to-liquids technologies were studied. Technology costs have come
down substantially but the financial viability of such investments is often still marginal at “normal
market prices”. In certain cases local prices for liquids are high for logistic or other reasons hence
improving the economic returns on gas-to-liquids as a gas utilization option. Manufacturers of such
technologies are increasingly active in pursuing business opportunities in Russia, e.g for small and
medium scale application in remote areas. No full-scale investments have been implemented yet, but
a few pilot schemes are underway.
Associated Petroleum Gas Flaring Study for Russia, Kazakhstan, Turkmenistan and Azerbaijan
Page 7 of 80
Dissemination of project results
The last part of this study included workshops in Moscow, Astana and Baku attended by (in total 200)
experts from oil companies, national authorities, technology providers and research institutions. Project
results were presented and investment barriers and regulatory and commercial challenges were
discussed. The authors of this report consider the following to be the main issues addressed at the
workshops:
There is a gradual shift in the composition of flare sites with a larger part being small and medium
size, often with difficult access to markets. Associated gas utilization investments from these sites
are often uneconomic. Regulatory approaches and commercial solutions must in a better way
than until now adapt to this reality.
Authorities in the target countries have typically set ambitious flare reduction targets, while
regulatory approaches and enforcement mechanisms often have been adequate. Given the great
diversity in the economics of flare reduction investment more flexibility in regulation is needed.
A regulatory approach based on dialogue and cooperation with companies, but still with credible
and predicable enforcement mechanisms intact, can contribute considerably to the cost-
effectiveness of flare reduction. Further, regulators have an important role to play in facilitating
new and innovative commercial approaches to flare reduction investments (see below).
Economic unattractive standalone investments, pursued by one oil producer, may become viable
through a productive partnership involving companies with different expertise and willingness to
take on risks. Some legal and regulatory reforms have recently been implemented in Russia and
Kazakhstan in support of “clustering” of projects with supplies of associated gas from multiple
fields, but there are still few signs of active engagement from authorities in clustering and
partnership arrangements for flare reduction investments.
With the continued technology advances and cost reductions for small-scale gas-to-liquids
technologies this is increasingly becoming an interesting option in the case of stranded associated
gas in remote small and medium-sized fields. Technology providers, finance institutions and
other commercial actors have shown interest in taking part in such investments. Again, political
authorities, regulators and institutions such as the European Bank for Reconstruction and
Development and the World Bank can play a role in bringing together various industrial partners
so as to find viable investment solutions with acceptable allocation of risks and rewards among
commercial partners.
Carbon market may eventually resurrect from its current low and become additional economic
stimulus to flaring reduction investments. A number of projects have already been developed in
the target countries under Joint-Implementation and Clean Development Mechanism (CDM).
Flare reduction project are well suited for these mechanisms since they can offer relatively large
emission reductions at low costs. In addition Kazakhstan is implementing its Emissions Trading
Scheme. Russia is at an early stage of considering the establishment of a domestic carbon pricing
scheme.

Associated Petroleum Gas Flaring Study for Russia, Kazakhstan, Turkmenistan and Azerbaijan
Page 8 of 80
New investments in associated gas utilization
This study has shown that many financially viable associated gas utilization projects are not pursued due
to lack of priority given by oil companies and/or lack of adequate regulatory pressures. This situation can
be improved, but not necessarily by more prescriptive regulations. New commercial players should be
encouraged to enter this field. Innovative commercial approaches, helped by technological progress, can
also improve the financial returns on projects which at the outset are seen as uneconomic. A critical factor
for this to be realized is active and flexible participation from political and regulatory authorities.
Considerable investments are required in order to reach the 95% gas utilization target, especially in
Russia. Estimates made as part of this study indicate that Russia would need to invest USD 8 billion to
reach the 95% target for existing production sites and an additional USD 16 billion to achieve 95%
associated gas utilization from new production. This is yet another indication of the need for more
institutions to engage in flare reduction efforts. The obvious and considerable resource conservation and
environmental benefits should be for the European Bank for Reconstruction and Development and the
World Bank Group an additional impetus for providing support and co-financing.

Associated Petroleum Gas Flaring Study for Russia, Kazakhstan, Turkmenistan and Azerbaijan
Page 9 of 80
1. Introduction
1.1 Purpose, focus and analytical approach
This report summarizes the findings of the “Associated Petroleum Gas Flaring Study for Russia,
Kazakhstan, Turkmenistan and Azerbaijan” (the Study) which was initiated by the European Bank for
Reconstruction and Development (EBRD) and co-managed by EBRD and the Global Gas Flaring Reduction
Partnership (GGFR). The aim of the Study has been to review and analyze appropriate technical solutions
for the use of the associated petroleum gas (APG) and to identify bankable projects in the four countries
covered (“target countries”).
EBRD considers expanding its financial engagements in associated petroleum gas (APG) projects through
the Sustainable Energy Initiative (SEI). SEI was launched in 2006 as a specific contribution to address the
climate change challenge, with a particular focus on energy efficiency. Until the end of 2012 SEI had
invested EUR 11 billion, of which 10% were allocated to oil and gas sector projects and only a small share
to APG utilization. This Study concludes that investments in productive use of APG could be an important
target area for SEI financing, for two reasons:
(i) The significance of capital requirements for APG investments. Bringing the current flaring down to
the level set by political authorities in the four target countries (about 95% APG utilization rate) is
estimated to require some USD 7.5 billion in capital expenditures. In addition, avoiding flaring from
new production sites until 2020 might require some additional USD 15.5 billion in investment funds.
(ii) A good match with SEI objectives. While APG investment by international oil companies typically
would be financed outside the multilateral development banks, there are projects that are hindered
or delayed by lack of financing. Small and medium size sites represent a growing share of remaining
flare sites, and SEI co-financing and other support (e.g. project facilitation where various actors are
involved) could accelerate flare reduction investments. In addition flaring of APG is a significant
contributor to greenhouse gas emissions in the target countries and as climate mitigation actions
they are in many instances “low hanging fruits”.
In order to explore appropriate gas utilization options and identify bankable projects in the four target
countries the Study was carried out in four phases:
Phase 1: A review of the flare situation, flare reduction efforts and relevant regulations and policies
in each of the four countries covered.
Phase 2: Identification of flare sites and dialogue with companies on possible assistance in the review
and analysis of APG investment cases.
Phase 3: Technical and economic analysis of specific investment cases.
Phase 4: Dissemination of project results.
Main results from Phase 1 are summarized in Chapter 2 with separate presentations made for each of
the four target countries. The characteristics of flaring differ substantially between the countries as does

Associated Petroleum Gas Flaring Study for Russia, Kazakhstan, Turkmenistan and Azerbaijan
Page 10 of 80
regulations and policies, but they have some challenges in common. All countries have considerable
unexploited reserves of oil and gas and they are building new supply chains to markets. Hence associated
gas production will increase, while new gas infrastructure opens the way for better market access. Still,
it should be noted that much of new oil production originate from remote locations bringing new
challenges in terms of APG utilization investments.
Identification of flare sites in Phase 2 has been a data intensive exercise where some 400 flare sites
initially were identified followed by a further screening process leading to some 100 flare sites being
selected for further scrutiny. For this work two sets of data sources have been used in combination:
a. Satellite images: the main source of information is the nighttime light satellite images provided by
National Oceanic and Atmospheric Administration (NOAA), which have been used in combination
with a Geographic Information System (GIS) software and Google Earth to identify the flares and
estimate the volume of gas combusted.
b. “On the ground data”. It describes relevant field specific characteristics required in order to estimate
flaring volumes. The most important source is a database compiled by the consultancy IHS which
includes, amongst other, the field geographical location and the produced gas characteristics.
By combining the satellite images from NOAA and the geographic information from IHS, the locations of
flares were determined. When required, the presence of the flares was confirmed with Google Earth.
The next step was to estimate flaring volumes per site. To do so, the sum of the light intensity (SOL) over
every flaring site was calculated and a factor applied to convert the SOL into a flaring volume. The
information compiled and analyzed as part of the site selection process was also used in the country
review work and summaries are presented in Chapter 21. In the site selection process for the Study it
was considered important to have a reasonable distribution with respect to applicable technologies and
1 Confidentiality clauses in some of the primary data sources used for the Study has restricted the level of detail that can be presented in this report.
Figure 1: Overview of “100 sites”
Source: IHS, Google Earth and Carbon Limits

Associated Petroleum Gas Flaring Study for Russia, Kazakhstan, Turkmenistan and Azerbaijan
Page 11 of 80
gas utilization options. Selecting a variety of gas utilization options created specific challenges since
applicable technologies cannot easily be determined in an early and high-level selection process. Still,
there is typically a correlation between the technology/gas utilization option and the total volume of gas
to be recovered, as illustrated in Figure 2. The selection, therefore, sought to have a balanced
distribution of sites in terms of flare volumes.
The further identification of investment cases and detailed technical and economic analyses of these
cases (Phase 3) had as its analytical basis a conceptual screening report prepared in order to describe
key characteristics, including economic attractiveness, of gas utilization options suitable in the four
target countries. Key conclusions from the conceptual screening report are summarized in Chapter 3.
This chapter also analyses the economic attractiveness of different technology choices and gas utilization
options with emphasis on how this is sensitive to site specific factors and variables such as: i) gas volumes
and qualities ii) distance to markets and transportation infrastructure iii) netback values of gas, LPG,
condensate, diesel and electricity. This analysis is based on the case studies, however again with the
restriction that commercially and company specific information cannot be published.
Results from the Study show that the scope and character of the flare reduction challenges are changing,
with a larger part of flaring being from small and medium size flare sites often far from existing gas
infrastructure and markets. This represents specific challenges for design and implementation of policies
and regulations. Policies and regulations should recognize the great diversity in costs of flare reduction
efforts and actively promote application of new technological advances and innovative commercial
approaches, with sharing of risks. New opportunities for economically viable investments in small and
medium scale gas utilization cases are briefly addressed in Chapter 4.
Figure 2: Attractiveness of conceptual gas utilization options vis-à-vis recoverable gas volumes
Source: Carbon Limits

Associated Petroleum Gas Flaring Study for Russia, Kazakhstan, Turkmenistan and Azerbaijan
Page 12 of 80
1.2 Overview of flaring levels and trends
Associated Petroleum Gas (APG) flaring takes place when gas produced in association with crude oil is not
used for productive/energy purposes, due to lack of market outlets or for safety reasons. Estimates
calculated from satellite images of flares (NOAA data, reported by GGFR) suggest that global gas flaring in
2012 was 144 billion cubic meters (BCM). This represents a massive resource waste and a considerable
environmental problem, representing some 400 million tons in CO2 emissions and being at the level of
one third of EUs gas consumption. In addition gas flares emit methane and black carbon, which as so-
called short lived climate pollutants are particularly powerful as precursors of climate change.
Policies and regulations to tackle the problem have been stepped up considerably over the past 10 to 15
years and oil and gas companies have taken active steps to plan and implement flare reduction measures.
On a global scale this resulted in a decline is flaring volumes from 2005 to 2010 of about 20%.
Estimates from satellite data, however, indicate a rebound in flaring from after 2010
Russian remains the largest flaring country in the world, both based on national statistics and satellite
estimates. However, the two sources show major discrepancies in flare levels and in trends from 2005
and onwards, see Figure 4.
Detailed empirical examinations under this Study suggest that three causes contribute to the
discrepancies:
Uncertainties in converting “sums of light” from satellite images to flare volumes. Analyses done
as part of this Study suggest that the global conversion factors used by NOAA, in the case of Russia
and Kazakhstan, overstate flare volumes. The fact that satellite images are not continuous
measurements but “snapshots” represents a possible source of error, in particular for the
northern hemisphere in presence of seasonal variations in flaring.
Satellite images include more than flaring of associated gas. Although considerable efforts
exclude light that are not from oil production flaring sites, such sources may in some cases be
included. Most importantly flaring of non-associated gas from gas processing plants or refineries
are often included in the satellite data but may be excluded from the national statistical sources
used for this Study.
Figure 3: Flare volume and flare intensities
Source: GGFR/NOAA

Associated Petroleum Gas Flaring Study for Russia, Kazakhstan, Turkmenistan and Azerbaijan
Page 13 of 80
Uncertainties in national statistics. National statistics are based on reports from oil and gas
companies which not always measure gas that goes to flares, but rather makes estimates of
associated gas production and flaring, based on gas-to-oil rations and other (indirect) parameters.
Given that flaring is subject to regulations and penalties, there may also be a tendency that flaring
is systematically underreported.
Data for Kazakhstan show similar discrepancies between satellite estimates and national statistics; with
the latter being at less than half the level of satellite estimates, and with a clearer downward trend in
national statistics but not in satellite estimates (see Section 2.2).
Country 2006 2007 2008 2009 2010 2011 2012
Russia 14.1 16.7 15.1 13.5 15.5 16.7 17.1
Kazakhstan 3.1 2.7 1.8 1.7 1.4 1.2 1.0
Turkmenistan 0.9 0.9 1.2 1.1 1.0 NA NA
Azerbaijan 0.8 0.7 1.1 1.0 0.8 0.8 0.7
Total – Target Countries 18.9 21.0 19.2 17.0 18.7 NA NA
Figure 4: Flare volumes in Russia, national statistics and satellite estimates, BCM/year
(*) Central Dispatch Office of the Russian Fuel and Energy Industry (CDU TEK).
Source: Satellite estimates are from NOAA/GGFR
Table 1: Flaring of associated gas in target countries based on official statistics, 2006-2012, Billion cubic meters (BCM)
Data sources/estimates. Russia: Central Dispatch Office of the Russian Fuel and Energy Industry. Kazakhstan: Ministry of Oil and
Gas. Turkmenistan: NOAA/GGFR and Carbon Limits estimates based on IHS data sources. Azerbaijan: BP in Azerbaijan
sustainability reports (includes flaring from Azeri-Chirag- Deepwater Gunashli and the Sangachal terminal). Data for Azerbaijan
include venting of associated gas as reported by SOCAR (see Figure 16). NA = Not Available

Associated Petroleum Gas Flaring Study for Russia, Kazakhstan, Turkmenistan and Azerbaijan
Page 14 of 80
Flaring of associated gas in the four target countries, based on national statistics2, for the four target
countries, is shown in Table 1. Russia has by far the largest flaring level and has unlike Kazakhstan not
managed to reduce the level over the past seven years.
Considering flaring per unit of crude oil production (flare intensities) Kazakhstan and Azerbaijan have
shown progress since 2006 and had a flare intensity level in 2012 less than half the level in Russia. Russia
and Kazakhstan were at about the same level in 2006 but Russia has not managed to reduce the flaring,
due to major new flaring sites appearing from new production sites in Eastern Siberia (see Section 2.1).
The relative importance of flaring can also be displayed as the share of total APG production being flared
(APG utilization rate). Commonly a target is set for 95% of the APG being used for energy purposes or
being re-injected. All new license agreements in Russia have a 95% utilization obligation and such a
threshold is often referred to as a target in political statements.
According to national statistics Azerbaijan and Kazakhstan are closest to this target, while Russia lacks
almost 20 percentage points short of the, which in the case of Russia initially was announced in 2007, for
achievement by end of 2012. As noted above, there may be a certain underreporting of flaring in the
national statistics which implies that both Russia and Kazakhstan are somewhat further away from the
95% target relative to what is shown in Figure 1.6. In Turkmenistan the situation is less clear since no
national statistics of APG production and flaring are available. Satellite estimates suggest that flaring of
APG was about 1 BCM in 2010. With crude oil production at 0.2 million barrels per day APG utilization in
Turkmenistan would have been well below 50%. As presented Section 2.3 some major APG investments
2 There does not exist national statistics from flaring in Turkmenistan, estimates are therefore based on NOAA data.
0
5
10
15
20
25
30
35
2006 2007 2008 2009 2010 2011 2012
Flar
e in
ten
sity
(m
3 g
as/m
3 o
il)
Russia Kazkahstan Azerbaijan
Figure 5: Flare intensities in Russia, Kazakhstan and Azerbaijan, in 𝑚3 gas per 𝑚3 oil
Source: Flare data see Table 1, oil production BP Statistical Review

Associated Petroleum Gas Flaring Study for Russia, Kazakhstan, Turkmenistan and Azerbaijan
Page 15 of 80
have been launched in Turkmenistan over the past few year, but it is yet unknown to what degree these
have increased the utilization rate.
1.3 Investments in APG utilization by 2020
Considerable investment funds are required for Russia to reach the 95% utilization target from existing
production sites; approximately USD 8 billion according to estimates done in this Study3. Judged from the
national statistics costs for reduction of current flaring in Kazakhstan and Azerbaijan are modest.
All the target countries have large programs for exploration and development of new oil fields, see Table
2 and investments for avoiding flaring from these fields will be considerable. This Study has estimated
such investments to amount to about USD 16 billion to 2020 in the case of Russia.
3 The estimates of investments required to establish infrastructure to meet APG utilization targets for existing and new production sites by 2020 are uncertain and qualitative by nature. Estimates are based on a large number of assumptions, including the development of Russian oil production, the share of total APG production in 2020 from new developments, the effects of projects under implementation at existing flare sites, the “remoteness” of existing and new APG production sites and new infrastructure (GPPs and GTPPs), the required installed capacity relative to actual APG recovery, the cost synergies associated with designing integrated APG solutions for new developments, the size distribution of APG volumes to be recovered at existing and new production sites, the optimal technology mix to utilize gas from existing and new production sites and the unit cost of new infrastructure to utilize APG using alternative technologies at different scales. The estimates presented in this report are made for an assumed mix of technological solutions that take into account locations of APG volumes in 2020 and the size distribution of these APG sources. These technologies would yield products with different market values (ranging from unprocessed APG delivered to GPPs to diesel produced using GTL technologies). In general, capital intensive utilization options generally yield products that would attract higher values in the market. The market value of the products resulting from the estimated capital investments have not been estimated in this study.
0%
10%
20%
30%
40%
50%
60%
70%
80%
90%
100%
Russia Kazakhstan Azerbaijan
2006
2007
2008
2009
2010
2011
2012
Figure 6: APG utilization rates in the four target countries, 2006-2012
Source: Same as for Table 1

Associated Petroleum Gas Flaring Study for Russia, Kazakhstan, Turkmenistan and Azerbaijan
Page 16 of 80
Actual Forecasts
Country 2010 2011 2012 2015 2020
Russia (*) 10.1 10.2 10.3 10.5 10.8
Kazakhstan (*) 1.6 1.6 1.6 2.1 2.5
Turkmenistan (**) 0.2 0.2 0.2 0.2 0.3
Azerbaijan (**) 1.0 0.9 0.9 0.9 0.9
Total – Target Countries 12.9 12.9 13.0 14.2 15.4
In addition to Russia, Kazakhstan expects a marked increase in production, but a large part of this will be
from the Kashagan field where development started in 2001 and production started in 2013. In this case,
therefore, APG utilization investments have already been made.
A specification of investment expenditures by APG utilization option is given in Figure 7. The estimates
are based on typical costs for different APG supply options shown in more detail in Chapter 3. Such
estimates are highly uncertain, partly because solutions and costs for APG investments are site specific
and also because of the uncertainty that exist around current flare levels and where new APG production
will appear over the next 7-10 years period. Still, the numbers indicate that considerable investment funds
will be needed for reduction of flaring from exiting production sites and in order to avoid flaring from new
fields.
0 5 10 15
Existing infrastructure
Gas export newinfrastructure
Power generation
GTL (dry gas portion)
Injection
Existing
New
Table 2: Oil production in target countries, 2010-2020, million barrels per day
(*) EIA World Energy Outlook, 2013 (**) Carbon Limits estimates based on different sources
Figure 7: Capital expenditures for APG utilization till 2020 in Russia, billion USD
Source: Carbon Limits analysis

Associated Petroleum Gas Flaring Study for Russia, Kazakhstan, Turkmenistan and Azerbaijan
Page 17 of 80
2. Review of flaring situation in target countries
2.1 Russia
2.1.1 Flare levels and trends
It is generally accepted that Russia is the largest contributor to global gas flaring. However, there is
significant uncertainty regarding actual volumes, as data even vary between Russian official sources. For
example, the Central Dispatch Office of the Russian Fuel and Energy Industry historically has reported a
larger volume of APG flared than the Federal Service for State Statistics. Moreover, President Vladimir
Putin in his 2007 State of the Union address quoted an annual APG flaring figure (20 BCM) that was some
20% greater than the figure of the Central Dispatch Office. Reasons for such discrepancies likely include
differences in estimation methodologies employed by the different sources.
2003 2004 2005 2006 2007 2008 2009 2010 2011 2012
APG production 48.5 54.9 57.6 57.9 61.2 60.3 61.4 65.3 68.4 71.9
Flaring of APG 11.1 14.7 15.0 14.1 16.7 15.1 13.5 15.5 16.8 17.1
Utilization rate (%) 77.2 73.3 74.0 75.6 72.6 75.2 78.0 76.3 75.5 76.2
As noted in Chapter 1, most Russian sources report much lower flare volumes than does the GGFR, which
uses estimates from satellite data provided by the National Oceanic and Atmospheric Administration
(NOAA). Part of the difference can be attributed to inclusion of non-associated gas flaring in the satellite
data, but most probably the major part is caused by a combination of overestimates from satellite-based
data sources and underreporting in national statistics.
The largest volumes of APG historically have been produced in Western Siberia, which accounts for the
majority of past and current oil production in Russia. However, APG production has increased in other
regions due to oil field developments, particularly in Eastern Siberia. Limited flaring occurs in the other
traditional oil producing regions, most notably in Orenburg, but flaring levels there are decreasing along
with oil production.
The majority of the APG produced in Western Siberia originates from oil fields in the Khanty-Mansisk
Autonomous Okrug, which contains more than 220 active fields and produces about 57% of Russian oil.
Almost 40% of the APG flaring in this region is estimated to occur at only 3 fields: Priobskoye, Samotlor
and Krasnoleningskoye, which are among the largest in Russia.
Most flaring in Western Siberia is located within an area of less than 500 x 500 km. This area contains
significant infrastructure for gas processing and transportation and is located less than 300 km from the
main transmission pipelines serving the Western part of Russia and export markets.
Table 3: APG production and flaring data from official Russian sources, BCM
Source: Central Dispatch Office of the Russian Fuel and Energy Industry

Associated Petroleum Gas Flaring Study for Russia, Kazakhstan, Turkmenistan and Azerbaijan
Page 18 of 80
Eastern Siberia has become the key new frontier in the Russian oil and gas sector. It has significant
undeveloped reserves and is relatively close to Asian-Pacific markets. However, it covers a large
geographical area and many of its fields are located far from other fields and existing infrastructure. In
2012, this region, which includes Tomsk, Krasnoyarsk and Irkutsk, for the first time flared more APG than
Western Siberia’s Khanty-Mansisk region, the previous leader – despite producing only one quarter the
amount of APG. According to satellite data, APG flaring in Eastern Siberia occurs at fewer than 30 oil fields,
and more than 80% of this comes from only eight fields. In Krasnoyarsk, the rise in flaring since 2009 is
primarily caused by the Vankorskoye field, developed by Rosneft. In Tomsk, flaring almost doubled
between 2006 and 2010, albeit from a comparatively low level.
In the Timan-Pechora region, which notably includes the Komi Republic and the Nenets Autonomous
District, funding for oil development and production significantly exceeds investments in gas processing,
particularly in the northern part of Nenets. Given the high reserve potential, sparse population and lack
of gas transportation options in this district, it is expected that the region as a whole will have a relatively
low APG utilization rate in coming years.
The bulk of the flaring in the Volga region takes place in Orenburg, a significant portion in oil fields with a
long production history. The area has significant gas infrastructure, including a number of gas processing
plants and connections to the main gas transmission system – factors that imply significant opportunities
to decrease flaring in coming years.
In summary, while flaring is showing a positive trend in some traditional oil-producing regions, due to
improvements in gas infrastructure availability and market access, this is offset by increased flaring in
“new” oil and gas provinces due to the growth in APG output and delays in introducing necessary
infrastructure for utilizing the gas. However, the split of flaring by region shown in Figure 9 may over-
estimate the dominant role of Eastern Siberia. Undoubtedly, there is a certain level of under-reporting of
flaring in Russia, and it is likely that most of this is at older flare sites such as those in Khanty-Mansisk,
Figure 8: Flaring of APG by region in BCM, 2010-2012
Source: WWF Russia

Associated Petroleum Gas Flaring Study for Russia, Kazakhstan, Turkmenistan and Azerbaijan
Page 19 of 80
rather than at new production sites, such as those in Eastern Siberia, which tend to have more modern
gas monitoring equipment.
2.1.2 Regulations and policies
In the past, lack of an effective legislative framework for dealing with APG, combined with inconsistent
enforcement, led to under-investment in infrastructure for APG utilization. In his April 2007 State of the
Union address, President Vladimir Putin announced his intent to make better APG utilization a national
priority. Since then, several national and regional government agencies have been investigating ways to
increase gas utilization and have drafted a series of proposals to reduce flaring. For example, a working
group on APG utilization was formed in the Ministry of Energy following a meeting chaired by President
Putin in November 2009. One of its tasks was to suggest improvements to the regulatory and legal
framework.
Government solutions have been largely punitive, e.g. licence requirements with a 95% utilization target
coupled with increased penalties for non-compliance. However, some incentives to reduce flaring also
have been introduced, including some market liberalization and preferential market access for flaring-
reduction projects, including use of APG in power production.
Oil and gas production activities are enabled through license agreements, usually signed by the Ministry
of Natural Resources and Environmental Protection, as well as relevant regional authorities. In some
regions, most notably in Khanty-Mansiysk and Yamalo-Nenets, it is mandatory to include an APG
Figure 9: Share of APG flaring by region in 2012
Eastern Siberia44 %
KhMAO25 %
YaNAO11 %
Komi6 %
Volga region 9 %
Far east 2 %
Ural2 %
South 1 %
Source: WWF Russia

Associated Petroleum Gas Flaring Study for Russia, Kazakhstan, Turkmenistan and Azerbaijan
Page 20 of 80
utilization percentage in the licence agreement. In theory, the right to use the subsoil can be withdrawn
if essential license conditions are violated (Article 20), though to date there have been no license
revocations due to failure to fulfil APG utilization rates, despite reported widespread non-compliance with
APG utilization conditions specified in licence agreements.
According to Article 16 of the 2002 Law “On environmental protection”, emissions to the atmosphere
should be compensated by the entities causing such pollution, and any activities harmful to the
environment must be authorized with a permit issued by regulatory authorities. Different payments apply
for different types of pollutants relevant to APG, depending on whether the operator stays within
“established emission limits”, within “temporarily agreed emission limits” or produces “above-limit
emissions”, according to thresholds established in individual permits. A basic rate is applied to emissions
within the limits, but if emissions exceed such limits, the payment rate is multiplied by a factor set by law.
Government Decree No. 1148 of 8 November 2012 sets the multiplier at 12 for penalties on emissions
greater than 5% of produced APG and raises the multiplier to 25 as of 2014 (Article 2). In the absence of
acceptable measuring equipment at a field, penalties are multiplied by a factor of 120 (Article 5), although
it is not clear how this is to be calculated in the absence of metering. The law does not apply the multiplier
in some cases for fields where cumulative production is less than or up to 5% of estimated recoverable
reserves (Article 3), and for fields where the annual volume of APG production is less than 5 million cubic
meters, or for which the volume of non-hydrocarbon components represents less than 50% of the gas
(Article 6). However, the new law apparently does not take into account remoteness of location as a factor
deserving special consideration.
Decree No. 1148 allows producers to subtract investment costs for APG utilization projects from the fines,
including for investments in gas pipelines, compressor stations, separation units, facilities producing
electricity and heat and for re-injection (Article 8). It also allows a company to reach the 95% utilization
target by aggregating production across all of a company’s fields. However, if the company is not able to
reach this rate through aggregation, fines are calculated for each field individually (Articles 11-15). While
this flexibility could lead to some economic efficiencies in targeting APG utilization investments, it could
disadvantage companies that have a small number of fields.
According to the Ministry of Natural Resources and Environment, Decree No. 1148 of 2012 is expected to
stimulate investments of around RUB 44.4 billion (EUR 1 billion) in APG utilisation projects.4
Additional economic incentives to increase utilization of APG include the liberalization of APG pricing in
February 2008. This has helped increase oil companies’ bargaining power with Sibur5, which has had a
quasi-monopoly on APG processing facilities. Amendments in December 2012 (No. 241-ФЗ) to the 1999
Law on Gas Supply give priority access to free capacity in gas transportation infrastructure to stripped dry
gas produced from APG. The Duma has also amended the Russian tax code to reduce the mineral
extraction tax rate for produced natural gas volumes re-injected to maintain reservoir pressure. (See
below for incentives related to APG use in the power sector.)
4 WWF webpage http://www.wwf.ru/resources/publ/book/837 5 SIBUR Holding OJSC (Sibur) is a 100% subsidiary of Gazprom

Associated Petroleum Gas Flaring Study for Russia, Kazakhstan, Turkmenistan and Azerbaijan
Page 21 of 80
2.1.3 Investments and barriers
While flaring in Russia is perceived to represent a socio-economic loss of billions of dollars each year6, it
has remained the most economically rational way to dispose of APG for many oilfield operators. Until
recently at least, the risk of penalties for non-compliance with license obligations (up to license
revocation) has been perceived as limited, and the economic attractiveness of investments in necessary
infrastructure to utilize APG has been insufficient, due to limited cost savings from avoided payments for
emissions of pollutants and the significant capital expenditures required.
Many oil fields are located far from markets and/or infrastructure and have been developed without
infrastructure necessary to productively utilize the APG. Moreover, most Russian oil-producing regions
have sparse populations and little local demand. As a result, the utilization of associated gas has been
relatively low in Russia compared to the situation in many other oil-producing countries.
Below is a brief review of investments in some of the most important APG utilization options.
Gas processing
In 2010, 48% of produced APG was supplied to gas processing plants, where it was used as feedstock for
production of marketable hydrocarbon products such as dry stripped gas, liquefied petroleum gas and
stable gas condensate. Due to the high liquid content of many APG streams, expanding gas gathering
networks and increasing the available gas processing capacity represents one of the most promising
options to reduce flaring in many oil-producing regions in Russia, particularly in areas with significant
existing infrastructure.
While gas processing has been a profitable business in Russia, regulated prices for APG supplied to third-
party gas processing plants historically have been too low to encourage producers to invest in APG
gathering and transport facilities. Despite price liberalization in 2008, prices from the sale of APG
feedstock have not increased enough to justify recovery in many regions. This is partly due to lack of
available processing capacity, which weakens the negotiating position of upstream suppliers. In 2010, 56%
of processed APG was supplied to GPPs controlled by Sibur. Some upstream operators have entered into
joint ventures with Sibur to secure long-term contracts for access to the latter’s processing capacity and
for sales of processed products.
Sibur has been implementing a corporate investment program to increase APG processing to 22.5 BCM
by 2012, up from 15.2 BCM in 2008. This includes a number of joint projects with Russian oil companies.
For example, Rosneft and Sibur have launched a joint-venture to process APG from the Priobskoye field
at the Yuzhno-Balyk gas processing plant (owned by Sibur), and TNK and Sibur have jointly invested in the
Yugragazpererabotka gas processing plant.
Other investments in gas processing facilities conducted by the Russian oil companies themselves include
the following:
6 According to Russia’s Natural Resources Ministry the companies’ inappropriate use of APG costs Russia’s USD 13 billion each year (http://www.oilandgaseurasia.com/articles/p/115/article/1143 ).

Associated Petroleum Gas Flaring Study for Russia, Kazakhstan, Turkmenistan and Azerbaijan
Page 22 of 80
Surgutneftegaz completed the construction and commissioning of its third APG treatment unit in
Surgut in 2006. (In the 1990s, the company had acquired the Surgut gas processing plant, which
today has a total processing capacity of 7.2 BCM.)
Rosneft has invested in construction of three APG treatment units in Yamalo-Nenets: at the
Komsomolskoye Severnoye field, at the Kharampur group of fields7, and at the Tarasovskoye field.
TNK-BP has started construction of the Pokrovskaya gas treatment unit in Orenburg.
Upon completion, processing capacity will be made available at Rosneft’s Otradnevsky gas
processing plant in Samara8. In 2012, construction, assembly activities and equipment supply for
the second stage of the Zaykinskoye gas processing plant in Orenburg was also planned.9
JSC Yugra Gas Processing has constructed a mini gas processing plant at the Zapadno-Salymskoye
oil field.
In combination, these investments have over the past few years added processing capacity of more than
5 BCM/year.
Sale of dry stripped gas
Gazprom has a de facto monopoly on gas exports10, and oil producers are obliged to sell dried stripped
gas (from processing APG) in the domestic market. With the emergence of new players in the gas sector,
a two-tier market has been created: Gazprom has been forced to sell gas at low regulated prices, while
non-Gazprom players are able to charge higher prices. However, access to gas transportation pipelines
historically has been a problem.
Transport of dry stripped gas in Russia is primarily performed through the Unified Gas Supply System,11
which is under the control of Gazprom. The Federal Tariff Service oversees a third-party access regime,
which has been in place since 1998. (The amount of gas transported on behalf of non-Gazprom entities
was 86.5 BCM in 2012, up from 64.5 BCM in 2010.12) In principle, Gazprom satisfies requests for access
except where it is prevented from doing so for technical reasons. As noted above, amendments in
December 2012 to the Gas Supply law give dry stripped gas from APG priority to available capacity in the
Unified Gas Supply System. Unfortunately, the system operates at near full capacity, particularly the
pipelines of the southern corridor running south from Yamalo-Nenets Autonomous Okrug, while pipelines
running south from Nizhnevartovsk suffer capacity restrictions during winter. Major capacity increases
7 Comprising Festivalnoye, Kharampurskoye and Ust-Kharampurskoye (field names as defined by IHS) 8 http://www.gulfoilandgas.com/webpro1/main/mainnews.asp?id=8762 9 http://annual-report-2010.tnk-bp.ru/en/exploration_and_production/production_at_mature_fields/ Currently inaccessible due to integration of TNK-BP into Rosneft http://www.bp.com/sectiongenericarticle.do?categoryId=9009631&contentId=7018796 . New source: http://ir.tnk-bp.ru/~/media/Files/T/Tnk-BP-IR/documents/annual-reports/ar-tbh-2010-eng.pdf 10 Confirmed by the Gas Export Law adopted in 2006 11 UGSS is the largest gas transportation system in the world, linking the production fields to customers throughout Russia, and represents a processing complex including gas production-, processing, transportation-, and storage- and distribution facilities. The total length of the UGSS exceeds 160,000 km. 12 http://gazpromquestions.ru

Associated Petroleum Gas Flaring Study for Russia, Kazakhstan, Turkmenistan and Azerbaijan
Page 23 of 80
will only be possible following significant reconstruction of the gas transportation system, although
building more underground gas storage facilities near consumption centres would help reduce the
problem.
In practice, many potential APG utilization projects initiated by oil companies have not been implemented
due to the inability to ensure access to the transport infrastructure necessary to market dry stripped gas,
including because of capacity problems. Moreover, Gazprom’s control of information relative to gas
transport and capacity bottlenecks has led to a lack of predictability and has inhibited independent
producers’ ability to envisage long-term contracts.
Electricity generation and sales
Amendments to the Federal Law “On Electricity” were adopted in 2010, facilitating priority access to the
Unified National Electricity Grid for power produced from APG and its derivatives. Due to the extensive
scale of the Russian grid network, there are significant opportunities for the export of the energy inherent
in APG in the form of electricity.
For oil fields far from the interconnected grid, local power generation may represent the most attractive
way to beneficially utilize APG. Fields in areas such as Timan-Pechora, the western parts of Khanty-
Mansisk, Tyumen and Eastern Siberia cannot be supplied with electricity from the centralized power grid,
at least not without significant investments in new power infrastructure. In these cases, the traditional
solution has been to use localised diesel-powered plants. During the past five years, a large number of oil
fields have installed small-scale gas turbine power plants to increase APG utilization, in part to avoid costs
related to investments in (or the leasing of) diesel-fired power plants and the fuel to run them.
In the traditional oil-producing regions of Russia, power needs for oil-field operations are commonly met
from electricity purchased from the grid. For example, in Khanty-Mansisk, many fields are supplied with
electricity by the Urals branch of the United Energy System. Historically, this has provided for reliable and
flexible power supply at modest costs. With the gradual liberalization of the power sector, however, the
cost of purchased electricity has increased by as much as 20% annually in some areas. Several captive
power plants burning APG have been installed to partly or fully offset purchased electricity, ensure
sufficient power supplies to sustain/expand oil production in areas with old or constrained distribution
systems and to increase APG utilization rates. For example, a 315-MW captive gas turbine power plant
(the largest of its kind in Russia) was recently commissioned at the Priobskoye field to meet on-site needs.
The field previously had been supplied with electricity from the grid. In addition to APG produced locally,
the plant relies on a back-up supply of non-associated gas from the gas transmission system, in order to
handle fluctuations in APG availability.
In areas with limited markets for dry stripped gas and non-existent or limited opportunities to export gas,
efficient large-scale power generation and export of electricity to the grid could represent an attractive
way of ensuring maximum APG utilization. For example, in 2008, TNK-BP established a joint venture with
the power generation company Oskarshamns verkets Kraftgrupp AB to operate and construct new power
plants in Nizhnevartovsk. In addition to 1,600 MW of existing capacity, the joint venture in July 2011
announced construction of an additional 400-MW power generation unit to be commissioned in mid-
Associated Petroleum Gas Flaring Study for Russia, Kazakhstan, Turkmenistan and Azerbaijan
Page 24 of 80
201313. This is the largest facility in Russia to be fuelled with dry stripped gas resulting from processing
APG. According to TNK-BP, it will ensure uninterrupted supply of electricity to the company’s production
assets during a period when electricity tariffs are increasing (the region currently has a power deficit) and
will provide a stable market for sale of the company’s APG. This project serves as a good example of a
situation where utilization of processed APG for grid-connected power generation is economically
attractive.
Despite the priority that power plants using APG or its derivatives may have, it is generally challenging to
manage such sales. This is because APG production fluctuates with oil production, making it difficult to
manage vis-à-vis load changes in the grid, especially if supplied by a single field. This can result in a lower
quality product than that supplied by a more conventional power plant. Moreover, decisions on capacity
investment are complicated by the fact that oil and APG production volumes generally decline over time.
Carbon credits
Following a protracted process and delays, Russian authorities established procedures to approve projects
developed under the so-called Joint Implementation mechanism of the Kyoto Protocol and to issue
Emission Reduction Units that can be sold in the international carbon markets. The first project approvals
were made in July 2010, and the first carbon credits were issued in December of the same year. Over 20
flaring-related Joint Implementation projects have been approved, and such projects now represent one
of the largest categories of approved Joint Implementation projects in Russia.14 However, since 2011, Joint
Implementation projects have become less important, partly because of a price collapse for carbon credits
and partly because Russia made the decision not to join the second commitment period under the Kyoto
Protocol, hence making new Russian carbon credits from such projects ineligible in carbon markets. It now
seems unlikely that the emission reduction benefits of new APG projects will have any economic value for
investors in the near future. However, there are processes internally in governmental institutions in Russia
to design a national emissions trading system (a cap-and-trade scheme)15.
Petrochemical industry
The development of the petrochemical industry in Russia could have important implications for APG
utilization. For example, according to one estimate, use of APG as a chemical feedstock in East Siberia
could produce revenues of about RUB 12 million, compared to RUB 4 million for APG use in electricity
generation.16 A company called “RusVinil” in Nizhegorodsk oblast is planning to open a polyvinylchloride
factory in 2014 with a capacity of 300,000 tons per year.17
13 http://www.tnk-bp.ru/en/center/releases/2011/07/8931/ Not available anymore due to the integration of TNK-BP into Rosneft 14 Despite the limited impact on investments per se, the interest in applying the JI mechanism has resulted in significant public awareness of what measures Russian oil companies have taken to address flaring in recent years, since project applications for JI eligibility are summarized in what is called Project Design Documents (PDDs), which have to be made public for stakeholder comments. PDDs include the technologies evaluated and applied to improve APG utilization and the economic and regulatory framework conditions for the investment. 15 http://www.themoscowtimes.com/special/environment/eng/russia-mulls-internal-carbon-trading.html 16 WWF webpage http://www.wwf.ru/resources/publ/book/837 17 WWF webpage http://www.wwf.ru/resources/publ/book/837 (page 68)

Associated Petroleum Gas Flaring Study for Russia, Kazakhstan, Turkmenistan and Azerbaijan
Page 25 of 80
Gas to liquids
Large oil companies in Russia, such as Rosneft, TNK-BP, Gazprom and GazpromNeft, are considering the
application of gas to liquids for APG investments. International technology providers such as
Velocys/Oxford Catalysts Group, CompactGTL and GasTechno are actively pursuing business opportunities
in the country. There are also a few domestic companies active, notably INFRA Technologies and
Energysyntop. For example, Rosneft, in partnership with the Russian firm Gazohim Techno, is building a
gas-to-liquids demonstration plant at Rosneft’s Angarsk Petrochemical Complex in Irkutsk Oblast. The
plant will utilize the APG from several remote small and medium-sized fields and have a throughput
capacity of 10 million cubic meters of gas per year, from which it will produce approximately 100 bbl/day
of synthetic crude. This demonstration project is envisioned as the first of many commercial gas-to-liquid
plants utilizing APG.18
2.2 Kazakhstan
2.2.1 Flare levels and trends
Kazakhstan has 30 billion barrels of proven oil reserves, the largest in the Caspian region. Oil production
was 1.7 million barrels per day in 201219. Proven gas reserves are 1.3 trillion cubic meters, and production
in 2012 was 19.7 BCM. A large part of this was associated gas.
There are currently 172 oil filed and 42 gas condensate fields20 in Kazakhstan, of which more than 80 are
fields under development. The largest oil filed is the offshore Kashagan field in the North Caspian Sea.
Operated by a consortium including ENI, Shell, Total, ExxonMobil and KazMunaiGas, ConocoPhillips,
INPEX21, the Kashagan started started production later in 2013 up to the design capacity from 180,000
bbl/day in the first stage to 370,000 bbl/day22 in the second stage and reach a plateau of 1.5 million barrels
per day by 2025. Tengiz, operated by the Tengizchevroil consortium, currently produces about 0.5 million
barrels per day and may reach 1 million barrels per day by 2020. Karachaganak is a gas condensate field
in northwest Kazakhstan that produced 140 million tons of oil equivalents in 2012 and is operated by a
consortium including ENI, BG, Chevron and Lukoil.
According to official data 1 BCM of APG was flared in 2012 down from 3.1 BCM in 2006. The decline in
flaring has happened despite a marked increase in crude oil and APG production over the same period.
The flare intensity (flaring per unit of oil production) was in 2012 only 1/3 of the level recorded in 2006
according to national statistics. It should be noted however that there are major discrepancies in reported
flare volumes between the official sources and flare estimates based on satellite images published by
18 Press release by Oxford Catalysts http://www.oxfordcatalysts.com/press/pr/ocgtpr20120516.php Not available anymore, but references to the deal at http://www.bloomberg.com/news/2013-01-04/billionaire-roman-abramovich-buys-3-5-stake-in-oxford-catalysts.html 19 BP statistical review 2011 20 http://www.encharter.org/fileadmin/user_upload/Publications/Kazakhstan_ICMS_2013_ENG.pdf, 21 http://www.offshore-technology.com/projects/kashagan/ 22 http://www.upi.com/Business_News/Energy-Resources/2013/07/18/Kashagan-oil-field-close-to-production-off-Kazakhstan/UPI-60921374150101/

Associated Petroleum Gas Flaring Study for Russia, Kazakhstan, Turkmenistan and Azerbaijan
Page 26 of 80
GGFR based on data provided by NOAA. The latter is three times higher and shows only a modest decline
and actually an increase from 2010 to 2011, see Figure 10.
As discussed in Section 1.2 discrepancies between official statistics and satellite estimates are caused by
three factors: i) errors and inaccuracies when converting “sum of light” from satellite images to flare
volumes ii) inclusion of flaring from non-associated gas in satellite estimates iii) underreporting in national
statistics. It is difficult to quantify the contribution of each factor, but it is likely that all play a significant
role.
Although data from satellites may not be suitable for statistical purposes they offer a good indication of
the location of flaring and broad estimation of flare sizes, however with the caveat that the satellite data
used for this Study are from 2011.
Some 37 oil fields with associated gas production have been identified as having flares. While most have
low flare volumes, about half of APG flaring comes from just 12 fields, and one field, Zhanazhol, accounts
for more than 20% of all flaring. The Karachaganak gas condensate field is the main source of non-
associated gas flaring.
About 95% of all flaring is clustered in four areas: Caspian Sea and Coast (referred to here as zone 1),
Aktobe (zone 2), the Kumkol basin (zone 3), and North West Kazakhstan near the border with Orenburg
(zone 4). Figure 11 shows the respective share of each zone in the 2010 flaring total.
Zone 1
Most of the flares in an around the Caspian Sea (zone 1) are midsize and primarily located at the Tengiz,
North Buzachi and Kalamkas fields. Important projects to decrease flaring in this region in recent years
include the following:
Figure 10: Flare volumes in Kazakhstan according to national statistics and satellite image estimates
Source: National statistics from Ministry of Oil and Gas Kazakhstan, satellite estimates from and NOAA/GGFR

Associated Petroleum Gas Flaring Study for Russia, Kazakhstan, Turkmenistan and Azerbaijan
Page 27 of 80
Tengiz field gas utilization: In January 2010, Tengizchevroil completed a 4-year USD 258 million gas
utilization project to eliminate routine flaring at Tengiz. Previously flared gas is being used as fuel on site,
processed and sold in the market or re-injected into the reservoir for enhanced oil recovery. The Tengiz
Gas Processing Plant is owned by LLP “Tengizchevroil” and has a design capacity of 12 BCM/year. When
the field reaches maximum production, it is expected that one third of the produced gas will be injected
into the reservoir and the remaining amount will be processed. Though routine flaring has stopped,
intermittent and emergency flaring still takes place.
North Buzachi: A new APG utilization complex opened in 2009 that includes gas collection systems and
furnaces for burning wet gas and for heating oil and water, which is injected back to the reservoir to
increase pressure and stimulate production.
Kalamkas: In September 2011, Mangystaumunaigas inaugurated a gas-fired power plant (90 MW) that
should utilize all the previously flared gas.
Zone 2
The Aktobe region (zone 2) includes a number of flares dispersed around the Zhanazhol field and GPP.
CNPC-Aktobemunaygaz (85.15% CNPC and 14.85% KazMunaiGas) is the main operator in this basin. The
largest flare volume has been identified in the Zhanazhol area, but another 0.6 BCM of gas is flared from
some 19-20 medium and smaller sized flares. Some of the flares are located up to 90 km from gas
pipelines.
Zhanazhol: The first train of a 2-BCM/year gas processing plant was commissioned in 2007 and the second
2-BCM train in 2009. The second stage of the Zhanazhol gas turbine power station was completed in 2010,
increasing capacity to 110 MW and making it one of the largest gas consumers in the area.
Figure 11: Kazakhstan - overview of the main flaring areas
Source: Carbon Limits based on NOAA and IHS data
Zone 329%
Zone 237%
Zone 121%
Zone 410%

Associated Petroleum Gas Flaring Study for Russia, Kazakhstan, Turkmenistan and Azerbaijan
Page 28 of 80
Zone 3
Key companies in the South Turgay Sub-basin (zone 3) include CNPC-Ay Dan Munay (CNPC); KazGerMunay
LLP (KazMunaiGas and CNPC); and PetroKazakhstan Kumkol Resources (KazMunaiGas and CNPC). A
number of gas utilization projects have been ongoing over the past few years in this area, including the
following:
PetroKazakhstan: Development of a gas utilization plan, which includes a 55-MW gas power plant
commissioned in 2004 and gas re-injection facilities at South Kumkol, Aryksum and Maybulak fields23.
Small power plants were also constructed at a number of fields in 2009, and another 55-MW power plant
was commissioned in 2010 using gas from the North Nurali field.
Kumkol gas processing: An associated gas processing plant was put into operation in October 2009 on the
Kumkol field. The plant has a designed capacity of 150 million cubic meters per year.
Akshabulak: Kazgermunai's Akshabulak gas processing plant has been in operation since 2004, providing
dry gas to the city of Kyzylorda. In December 2011, the first unit of a new gas turbine power plant began
using associated gas from the Akshabulak field. Early in 2012 two more turbines will be commissioned,
bringing total capacity to 87 MW.
Kenlyk: The Eurasian Development Bank financed a facility commissioned in 2010 to collect and process
associated gas at the Kenlyk field. It currently produces about 50,000 tons of LPG (commercial
propane/butane mix and stable gas condensate) from 100 million cubic meters of feedstock gas.24
Zone 4
North Kazakhstan (zone 4) includes only two flares, at Karachaganak and Chinarevskoye, both located
close to GPPs and gas pipelines.
Karachaganak: The Karachaganak gas condensate processing complex started production in 2003. A large
part of the sour gas produced by the Karachaganak field is re-injected, while remaining unstable
condensate and raw gas are delivered to Orenburg, Russia, for processing25.
Chinarevskoye, Zhaikmunay LLP: In October 2011, a gas treatment facility started operation to treat both
gas condensate and associated gas. It has two trains, each with a capacity of 850 million cubic meters per
year. Gas from this field can be exported, since Chinarevskoye is connected to the Soyuz Export pipeline
to Orenburg, Russia.
2.2.2 Regulations and policies
Amendments to the Law on Oil (1995) prohibited flaring of associated gas as of 1st July 2006. The
authorities initially sought strict enforcement of the new regulations with fines and threats to revoke
production licenses. While this helped shift oil companies’ focus toward APG utilisation, it soon became
apparent that more flexibility in the regulations would be needed. Planning and implementation time
23 Petrokazakhstan website http://www.petrokazakhstan.kz/eng, IHS database. 24 http://eabr.org/e/projects/edb/index.php?id_4=174 25 http://www.kpo.kz/index.php?id=80&L=1; http://www.kpo.kz/index.php?id=80&L=1

Associated Petroleum Gas Flaring Study for Russia, Kazakhstan, Turkmenistan and Azerbaijan
Page 29 of 80
required for APG utilization investments were not adequately catered for in the regulations and initial
enforcement practises. This was somewhat rectified in the new Law on Subsoil and Subsoil Use (“Subsoil
Law”), adopted in June 2010. The legal conditions for flaring and disposition of APG were changed and
technologically unavoidable gas flaring was allowed under certain conditions. Nevertheless, the Subsoil
Law continues to prohibit flaring unless the Ministry of Oil and Gas grants a permit to do so.
Prior to the new Subsoil law, large quantities of APG were re-injected. The Subsoil Law discouraged re-
injection by introducing an obligation to process the APG, with the aim of ensuring that more gas would
be brought to market. Subsoil users are obliged to develop a program to use APG with limited exceptions.
Such programs must be approved by the Ministry of Oil and Gas and updated every three years. Operators
must report annually on implementation. Permission to re-inject must be explicitly granted by the
relevant authority, though permission is subject to conditions less strict than those for flaring.
The Law on Gas and Gas Supply of 9 January 2012 (“Law on Gas”) further clarifies regulatory conditions
for APG utilization and the commercial framework conditions for supplying gas, establishing the pre-
emptive right of the State to purchase raw and commercial gas26. A Government Resolution of July 2012
designates KazTransGas, owner and operator of most of Kazakhstan’s gas infrastructure, as the National
Operator with pre-emptive purchasing rights. The Law on Gas obliges subsoil users to make an offer based
on i) the recovery cost of the raw gas, ii) the transport cost to the National Operator, iii) the cost of
producing commercial gas from the raw gas, and iv) a profitability margin of no more that 10%. After
approval of this offer by the “Authorized Body” (supposedly the Ministry of Oil and Gas), the National
Operator may accept or reject the offer. The law also gives the National Operator, KazTransGaz,
preferential rights to gas supply infrastructure27 and to sales of gas, effectively restricting other
companies’ commercial activities related to gas supplies.
The Subsoil Law and the Law on Gas also concern institutional roles and responsibilities for APG utilization
and flare reduction. It gives the Ministry of Oil and Gas and KazTransGas authority to instigate measures
to bring APG to productive use, including through fines. Flare-related payments are subject to complex
regulations involving the Environmental Code, the Tax Code and the Code on Administrative Violations.
Charges are paid for flaring and emissions within the authorized limits and for volumes above these limits,
the latter many times higher than the former. A large portion of charges and penalties are collected and
kept as revenues by the local authorities.
While the Ministry of Oil and Gas and KazTransGas have important instruments in place to spur
investments in APG utilization, the pace and economic efficiency at which such investments can be
achieved remains to be seen. Since APG production is spread over many oil and gas producers, a good
dialogue and cooperation with these companies would seem to be essential.
Introduction of an emission trading system for CO2 from 2014 may eventually also represent an incentive
for productive use of APG. The emission trading system will in effect penalize flaring, but the implicit fine
26 There are certain exemptions that apply, primarily related to the origin of the gas, e.g. gas from gas-condensate fields, LNG and certain categories of imported gas. 27 Referred to as «Gas Supply System» in the Law.

Associated Petroleum Gas Flaring Study for Russia, Kazakhstan, Turkmenistan and Azerbaijan
Page 30 of 80
(the price of emission allowances) will probably for the first few years be low and probably not make a
significant difference for the economics of APG investments.
2.2.3 Investments and barriers
Most projections indicate a steady increase in Kazakhstan’s domestic gas demand, e.g., the IEA forecasts
an 2.2% average annual growth rate through 2035. The domestic gas market in Kazakhstan is dominated
by the vertically integrated KazMunaiGaz through its subsidiary KazTransGas, though several large
independent producers are present in the market. However, Kazakhstan’s gas market is not open to
competition, and gas is currently sold on the domestic market and for export at prices well below the
international netback level.
The main barriers of the gas production in the Kazakh oil and gas sector, according to the Energy Charter
Secretariat (2013) are:
Lack of a developed gas transportation infrastructure for supply of gas to the northern and central
regional markets of the country;
Dependence on natural gas supplies from Uzbekistan and Russia;
Lack of individual capacities for the processing of Karachaganak gas”28.
Power generation is a key utilization option for associated gas. The power sector is expected to be the
biggest contributor to increased primary energy demand as the share of gas-fired power in total
generation increases from 11% in 2008 to an expected 34% in 203529. There is currently more than 2GW
of gas-fired plant installed, but more than ¾ of power generation still comes from coal. Private companies
have entered the power generation market and have the possibility to conduct bilateral contracts with
consumers, including 20 regional distribution companies with different forms of ownership. While
wholesale power prices currently cannot be set higher than a maximum tariff defined for each plant type,
this cap reportedly can be reviewed on a case-by-case basis.
Kazakhstan exports gas to Russia (Orenburg) from Karachaganak and via the Central Asia-Centre (CAC)
pipeline. Kazakhstan is also a major transit country for exports from Turkmenistan and Uzbekistan. All gas
transportation is carried out by “KazTransGaz” (100% owned by KazMunaiGaz) and its affiliated
companies.
As natural monopoly gas transport services charged with tariffs are to be approved by the Agency
regulating natural monopolies30. According to the Law on Natural Monopolies, tariffs should not be below
the cost of regulated services (goods, works) and shall ensure profit for an efficient provision of the
services by natural monopolies. Establishment of the Common Economic Space (CES) in Kazakhstan,
Russia and Belarus on 1 January 2012 will have implications to the tariffs for hydrocarbons transit as
28 http://www.encharter.org/fileadmin/user_upload/Publications/Kazakhstan_ICMS_2013_ENG.pdf 29 IEA WEO 2010 30 The tariff is defined according to the Methodology on calculation of tariffs on main pipeline transportation services, which is stated by the №500-ОД Decree of the Chairman of Agency from December 21st 2004.

Associated Petroleum Gas Flaring Study for Russia, Kazakhstan, Turkmenistan and Azerbaijan
Page 31 of 80
unification of tariffs and nondiscriminatory access to pipeline systems of member countries are one of the
main principles of the CES.
Historically, Kazakhstan has been dependent on Russia for gas export, however new pipeline projects will
open more options for the country. There are currently three main pipeline projects:
1. The construction of the 1,475-km Beiney-Shymkent pipeline will reduce dependency on the
supply of Uzbek gas by allowing gas to be transported from western to southern Kazakhstan,
where there is high demand, crossing Mangystau, Aktobe, Kyzylorda and Southern Kazakhstan
oblasts along the way. It will also allow another export option for Kazakhstan by connecting to the
Turkmenistan-China pipeline.
2. The construction of the 1,304-km Kazakhstan-China main pipeline will allow increased
transportation of gas from Central Asia to China, as well as the supply of gas to southern
Kazakhstan and the transit of Turkmen gas. The two first lines were commissioned in 2009 and
2011. The transit volume in 2009 was approximately 14.5 BCM, and by the end of 2012 is planned
to reach 30 BCM, with a future rise to 40 BCM.
3. The construction of Kartaly–Tobol–Kokshetau–Astana gas pipeline with a capacity of 1.5
BCM/year is aimed to provide gas supplies to the northern parts of Kazakhstan including the
capital Astana. The cost of the construction is estimated to be above KZT 200 billion (EUR 970
million); State welfare Fund Samruk-Kazyna will allocate KZT 120 billion in 201331. The design and
estimate documentation is reaching completion and, with availability of funds, the construction
of the pipeline should start in 2013.
In 2007, Russia and Kazakhstan signed an agreement on cooperation to construct the Caspian Coastal
pipeline, which would run along the Caspian coast from Turkmenistan via Kazakhstan to Russia.
Reportedly, “the gas pipeline is intended to provide transportation of 20 BCM of gas to world markets
annually, including up to 10 BCM of Kazakh gas and up to 10 BCM of Turkmen gas”32.The project is
currently postponed due to [suspended] negotiations between Russia and Turkmenistan.
31 http://www.kazenergy.com/ru/press/2011-04-21-10-24-20/6712-----2013------120--.html 32 http://www.encharter.org/fileadmin/user_upload/Publications/Kazakhstan_ICMS_2013_ENG.pdf

Associated Petroleum Gas Flaring Study for Russia, Kazakhstan, Turkmenistan and Azerbaijan
Page 32 of 80
A number of projects for gas utilization currently planned or under construction at particular fields
(presented according to the zones in Figure 11) are:
Zone 1
Kashagan/Bolashak GPP: During Phase I, around half of the gas produced at Kashagan will be re-injected
into the reservoir, while separated liquid and raw gas will be taken by pipeline to the Bolashak onshore
processing plant in Atyrau oblast. Some of the processed gas will be sent back offshore for use in power
generation and some will be used to generate power at the processing plant itself.34 The implementation
of the project will allow the company to process 400 million cubic meters of associated gas and produce
320 million cubic meters of dry commercial gas and 57,000 tons of liquefied gas (propane/butane mix)
per year35. The total investments in the Kashagan Project were estimated at USD 136 million.
Barankol GPP: The construction of the Barankol GPP started in 2005, but has been halted due to financial
difficulties.
Tengiz: Tengiz GPP has a design capacity of 2.55 BCM of gas per year. A 100-km gas export line is planned
from Tengiz to the Central Asia Center pipeline36. There has also been discussion of increasing gas-
powered generation capacity at the field.
33 IEA WEO 2010, Carbon Limits analysis 34 http://www.ncoc.kz/en/kashagan/development_strategy.aspx 35 http://kazworld.info/?p=18318 36 IHS midstream essentials
Figure 12: Main regional pipelines projects 33
Source: IEA World Energy Outlook 2010, Carbon Limits analysis

Associated Petroleum Gas Flaring Study for Russia, Kazakhstan, Turkmenistan and Azerbaijan
Page 33 of 80
Prorva group of fields (south of Tengiz): Different options for gas pipeline connections for the Prorva group
of fields were evaluated in 2011, but implementation is currently unclear.
Zone 2
Aktobe: In 2012, Kazakhoil Aktobe is planning to open a new complex capable of processing 400 million
cubic meters of APG per year, 320 million cubic meters of dry gas and 57,000 tons of LPG37.
Zhanazhol gas processing plant expansion: In 2013 there are plans to complete construction of the next
phase of a GPP, increasing capacity to 6 BCM/year.
Zone 3
Akshabulak Gas Power plant: The plan is to increase the capacity of this gas-fired power plant to 127 MW
by 2014.
2.3 Turkmenistan
2.3.1 Flare levels and trends
Turkmenistan’s proven oil reserves are roughly 600 million barrels38, considerably less than those in
neighboring Kazakhstan and Azerbaijan. Most of its 62 producing oilfields are situated in the South
Caspian Basin and the Garashyzlyk onshore region in the west of the country. Oil production has remained
around 200,000 bbl/day for the past ten years and about half is exported. Most of the growth in oil
production in recent years has been offshore, particularly from the Cheleken field operated by Dragon Oil.
Estimates of Turkmenistan's proven natural gas reserves vary from 8 trillion cubic meters to more than 20
trillion cubic meters39. The country has several of the world's largest gas fields, including the Galkynysh
(formerly known as South Yolotan), with potential reserves exceeding 13 trillion cubic meters40. The
expected capacity of the Galkynysh gas field from 2013 is 30 BCM of marketable gas per year41. Total gas
production in Turkmenistan peaked at about 66 billion cubic meters (BCM) in 2008, but fell to 36 BCM in
2009 following a blast on the Central Asia-Center gas pipeline. Production has since recovered and stood
at 64.4 BCM in 2012.42 Gas accounts for almost 80% of total primary energy demand. Some 50%43 of gas
production is exported and most incremental production will go to exports as supply recovers.
Contrary to the situation for the other countries of this study, there are no official published figures for
flaring or venting for Turkmenistan, though the country’s National Communication to the United Nations
Framework Convention on Climate Change suggests that some 2-2.5 BCM of gas was vented or flared in
37 http://www.oilcapital.ru/news/2011/07/270605_170262.shtml 38 BP statistical review 2011 39 IEA WEO 2010, BP statistical review 2011 and the Turkmen government 2006 40 Figure depends on the source 41 http://www.oilgas.gov.tm/publish25_4.html 42 BP statistical review 2013 43 BP statistical review 2013

Associated Petroleum Gas Flaring Study for Russia, Kazakhstan, Turkmenistan and Azerbaijan
Page 34 of 80
1998. According to the same document, in 2006 about 40% of previously flared gas was used for the
production of liquefied gas at the Turkmenbashi refinery and for gas lifting.
NOAA estimates from satellite images suggest that gas flaring has remained somewhat above 1 BCM/year
since 2005. According to this source, flaring has been falling since 2008, with a 10% drop between 2009
and 2010, despite the rebound in gas production and a moderate increase in oil production.
Some 57% of flaring in Turkmenistan concerns non-associated gas, e.g., from gas or condensate fields.
Individual flares of associated gas are mainly midsized, while flaring for non-associated is dominated by
one field, the Yashildepe (Kokdumalak). In terms of fields’ ages, most of the flares are at fields developed
before 1990.
Mary is the region with the highest gas reserves (15.5 trillion cubic meters recoverable44), though only
one small flare has been identified in this region. The development of the large Yolotan field may lead to
additional flaring in this region45.
Lebap is one of the principal gas regions in Turkmenistan, and flaring here concerns mostly non-associated
gas. The main flare in Lebap is close to the Yashildepe field, near the border with Uzbekistan (and may
actually be located just over the border). All flares in this region appear to be located in the vicinity of gas
pipelines.
The Caspian Basin is composed of the Balkan onshore region, dominated by the Turkmen government
operator, and the Caspian Sea offshore region, managed by foreign investors Petronas and Dragon Oil.
Some 90% of the flaring in this region comes from fields producing primarily oil, though almost all flares
44 IHS E&P copyright © IHS 2011. All right reserved 45 The current situation is quite uncertain at this field.
Figure 13: Gas flaring estimates from NOAA over time compared to production data
Source: NOAA

Associated Petroleum Gas Flaring Study for Russia, Kazakhstan, Turkmenistan and Azerbaijan
Page 35 of 80
are located in the vicinity of some gas infrastructure. About 2/3 of the flaring in this region is due to just
three fields: Akpatlavuk and Keymir, operated by Balkannebitgazsenagat, and Jeytun (LAM), operated by
Dragon Oil. The latter is the largest contributor to flaring in the region, and is responsible for most of the
increase between 2006 and 2008, when oil production from this field substantially increased. Gas re-
injection for pressure maintenance has been on-going in some of these fields.
2.3.2 Regulations and policies
Since March 2007, the State Agency for Managing and Using Hydrocarbon Resources (Agency) has been
given broad authority in oil and gas matters. The Agency took over many of the powers of the Ministry of
Oil and Gas Industry and Mineral Resources, including issuance of licenses. It is also responsible for all
matters related to the use of hydrocarbon resources, including gas exports and construction of gas
pipelines. The Agency is also in charge of environmental regulation vis-à-vis oil and gas companies,
including for flaring and venting. The Agency operates directly under the President, who nominates its
Director.
The “Rules for the Development of Hydrocarbon Fields” of 22 October 1999 states that, “an Operator may
flare or vent gas without receiving prior approval from the Competent Body only in the following situations:
(i) when gas is flared or vented in small volumes from storage vessels or other low-pressure production
vessels and cannot be economically recovered, and (ii) during an equipment failure or to relieve system
pressure.” The Competent Body is defined as the “State Body, to which the Cabinet of Ministers delegates
powers to issue Licenses and enter into the Contracts with the Contractors”.
In general, regulations specify that the operator must not flare or vent gas for more than 48 continuous
hours, more than 144 cumulative hours during any calendar month, or beyond the time required to
manage emergency risks, unless otherwise approved by the Competent Body. Gas flaring or venting can
be allowed for a “reasonable” period of time in compliance with “international oil field practice” for
certain operations, including the unloading or cleaning of a well, well testing, wireline intervention or well
stimulation. Moreover, the Competent Body may allow the operator to flare or vent gas for up to one
year if the action, when completed, is expected to eliminate flaring or venting. The Competent Body may
also allow flaring for up to one year if the operator has submitted an evaluation, supported by engineering,
geological, and economic data, indicating that the oil and gas produced from the well will not economically
support the facilities necessary to store or sell the gas, or that there is no commercially viable market for
the gas. According to the regulations, operators must prepare a report which is submitted every three
months to the Competent Body detailing gas flaring or venting and liquid hydrocarbon burning for each
facility. The reports must include: daily volumes, numbers of hours, reasons, and a list of the wells
involved, along with gas-oil ratio data.
The level of compliance with, [and enforcement of], regulations is unclear, however, and case-by-case
negotiation appears to be common.

Associated Petroleum Gas Flaring Study for Russia, Kazakhstan, Turkmenistan and Azerbaijan
Page 36 of 80
2.3.3 Investments and barriers
Although the country aims to produce 187 BCM of natural gas and 23 million tons of crude oil (about
500,000 bbl/day) annually by 202046, the IEA projects a more modest growth in Turkmenistan’s output,
reaching 290,000 bbl/day of oil and 104 BCM of gas per year, of which 73 BCM would be for export.47
Actual growth in oil and gas supplies will be highly sensitive to the country’s ability to attract foreign
capital and technologies.
Malaysia’s Petronas operates Block 1 in the West Turkmenia (South Caspian) Basin in the Caspian Sea. In
2011, Petronas commissioned a gas treatment plant and onshore gas terminal with a capacity of 5
BCM/year, upgradable to 10 BCM. This consists of two process trains and a 53-km pipeline linking the
terminal to the Central Asia Centre 3 export pipeline.48 The facility will treat gas produced by the offshore
assets of Petronas. In July 2011, Petronas signed a contract to sell 5 BCM/year to Turkmengas at a price
which has remained confidential.
Dragon Oil, a privately owned oil and gas company from the United Arab Emirates, has its main producing
assets in the Cheleken Contract Area. Based on analysis performed for this study, it is estimated that
Dragon Oil flared about 0.4 BCM of gas in 2010 from Cheleken and Jeytun (LAM) combined. Dragon Oil is
currently implementing a project to stop its flaring activities in Turkmenistan49. It has completed the
phase-2 expansion of its central processing facility, which allows it to handle 2 BCM of gas, and has
finalized the FEED study for a gas treatment plant. Since January 2011, Dragon Oil has been bringing a
substantial portion of unprocessed gas onshore together with crude oil via its new integrated pipeline
network. Petronas and Dragon Oil signed a MoU on gas utilization in 2003, but details are unknown.
In December 2009 Turkmengas signed service contracts to develop the Galkynysh field with CNPC, South
Korea's LG International and Hyundai Engineering and the UAE's Petrofac Emirates. As of May 2013, the
total investment project was estimated at USD 10 billion aimed at creating the infrastructure for a
production and processing of the gas with a capacity of 30 BCM per annum50. Reportedly, the companies
have drilled more than 20 wells51, constructed a pipeline system, four gas treatment units, three
desulphurisation plants and some residential buildings.
In September 2010, Turkmenistan gave public support to an ENI project that would transport compressed
natural gas via tanker across the Caspian Sea to Azerbaijan using the associated gas of Burun field.52
However the project currently seems to be on hold.
While Turkmenistan seeks foreign involvement in developing its offshore oil fields, it generally does not
give foreign access to onshore gas reserves. Turkmengas has exclusive rights to gas supplies, and as such
46 Turkmen government official statement November 2011 47 IEA World Energy Outlook 2010 48 http://mynewshub.my/2011/07/13/pm-launches-kiyanly-gas-treatment-plant/; http://www.oananews.org/node/194678 49 Dragon Oil website http://www.dragonoil.com and presentations 50 http://turkmenistan.gov.tm/?id=4079 51 http://caspianbarrel.org/index.php/en/component/content/category/53-turkmenistan?layout=blog&limitstart=0 52 http://www.staffettaonline.com/staffetta_news/articolo.aspx?ID=10097

Associated Petroleum Gas Flaring Study for Russia, Kazakhstan, Turkmenistan and Azerbaijan
Page 37 of 80
has responsibility for gas and condensate field development and production, natural gas processing, gas
transportation and gas sales to both domestic and export customers. There are currently no plans for
future privatization or liberalization of Turkmenistan’s gas sector.
In rare cases where a foreign company owns an onshore gas field (as in the case of CNPC), there is a
contract with Turkmengas under which the company is obliged to sell at least a portion of the produced
gas to Turkmengas. There is no wholesale gas market in Turkmenistan, and Turkmengas directly
negotiates with potential foreign gas buyers. The gas pipeline network, which is owned, operated and
controlled by Turkmengas, is characterized by old and inefficient equipment.
Since the end of 2009, Turkmenistan has exported natural gas to Russia, Iran and China. The "Central Asia-
Center" pipeline (CAC), built in the late 1960s, is still the most important export outlet, passing through
Uzbekistan and Kazakhstan before entering Russia. Annual gas exports to Russia have fluctuated
considerably, sometimes reaching over 20 BCM, though in recent years have been closer to 10 BCM.
Turkmen gas is exported to Iran through two pipelines: Korpeje-Kurtkuyi, built in 1997, and Dowletabat-
Sarakhs-Khangiran, built in 2009, with a combined annual capacity of 20 BCM. Gas exports to Iran
reportedly reached 8 BCM in 2010 and are expected to increase in the in the future.
Gas exports to China began in 2009 through the Turkmenistan-Uzbekistan-Kazakhstan-China gas pipeline.
Although volumes in 2010 were only around 3 - 4 BCM, annual supplies are expected to reach 40 BCM by
2014-2015, when the pipeline reaches full capacity. During a visit of the Turkmenistan president to China,
it was agreed that the annual supply volume of gas to China would be increased to 65 BCM by the end of
2015. Reportedly the corresponding agreements were signed during the visit of the President of the
People's Republic of China on 3-4 September 2013 in Turkmenistan.
Figure 14: Overview of the gas pipelines projects in the region
Source: IEA World Energy Outlook 2010

Associated Petroleum Gas Flaring Study for Russia, Kazakhstan, Turkmenistan and Azerbaijan
Page 38 of 80
Turkmenistan adheres to rigid rules and controls for export sales, and the government directly negotiates
all gas export contracts. The transportation tariff is set by state-owned Turkmentransgas, agreed with
Turkmengas SC, and approved by the Agency.
There are currently a number of new gas pipelines projects in Turkmenistan. The intention of
Turkmenistan to develop a policy on diversification of the transport-transit network of the pipelines was
highlighted by the President during the Non-Aligned Movement Summit on 30 August 201253. A proposed
East-West domestic gas pipeline is designed to give Turkmenistan the ability to connect all large gas fields
in Turkmenistan54 and send gas to multiple export points on its external borders. The designed capacity
of the 766 km long pipeline (with a diameter of 1420 mm) is 30 BCM/year. Reportedly, the costs of this
project were estimated at about USD 2 billion55.
A proposed Trans-Caspian sub-sea gas pipeline between Türkmenbaşy and Baku has been at various
stages of discussion and negotiation since the late 1990s, though this project is currently on hold, despite
support from both the US and European Union. Some experts state that if Turkmenistan and Azerbaijan
come to an agreement on economic and political issues concerning construction of the pipeline, the
project could be launched in 2018-201956. The Azerbaijan-Georgia-Romania Interconnector would provide
gas supplies to the Caspian region, as well as to Romania via the Black Sea coast of Georgia. Turkmenistan
may be involved in this project if the Trans-Caspian seabed gas pipeline is constructed.
In May 2012, the sales and purchase agreement on the natural gas was signed between Turkmenistan,
India and Pakistan. This agreement concluded the second phase of the project on construction of the
Turkmenistan-Afghanistan-Pakistan-India (TAPI) pipeline57. The parties of the Project also agreed to
establish a TAPI Ltd. consortium.
A Caspian Coastal Pipeline is planned to run along the coast from Turkmenistan via Kazakhstan to Russia,
though currently is on hold.
Since 1992, households have received free gas (600 cubic meters per person per year), though actual
supplies are reportedly irregular, particularly during winter. Other customers pay regulated prices.
Domestic gas demand in Turkmenistan is relatively high, which can be explained by a number of factors,
including the low gas price, large technical losses in electricity and gas supply infrastructure, and the low
thermal efficiency of the gas-fired power plants. The IEA58 forecasts an average annual gas demand growth
of 1.6% for the period 2008-2035 and further expects gas-fired electricity generation to increase from 15
TWh in 2008 to over 34 TWh in 2035.
Gas is the principal fuel for power generation, which is a major domestic outlet for gas supplies. Structural
reform is not currently on the policy agenda for this sector, which consists of a single vertically integrated
monopoly, Turkmenenergo. Electricity tariffs have changed very little since 1998 and do not cover costs.
There is currently 4,100 megawatt (MW) of generation capacity, of which 2,800 MW is gas-fired. However,
53 http://www.oilgas.gov.tm/publish4(2).html 54 http://www.oilgas.gov.tm/publish7.html 55 http://www.oilgas.gov.tm/publish7.html 56 http://www.chrono-tm.org/2013/05/rossiya-nedovolna-planami-po-stroitelstvu-transkaspiyskogo-gazoprovoda/ 57 http://www.oilgas.gov.tm/publish25.html 58 IEA WEO 2010

Associated Petroleum Gas Flaring Study for Russia, Kazakhstan, Turkmenistan and Azerbaijan
Page 39 of 80
the system is characterized by old and inefficient equipment, and the average thermal efficiency of
Turkmen gas-fired power plants is estimated at 25%, far below the world average59. The Ministry of Energy
and Industry plans the construction of four 125-MW units of gas-fired units at Gysyl-Atrek, near the Iranian
border.60
In 2010, Turkmenistan produced about 14.5 TWh, of which about 1.6 TWh was exported to Afghanistan,
Kazakhstan, Iran, and Turkey. Exports to Tajikistan ceased in December 2009 after Uzbekistan (used for
transit) withdrew from the Central Asia Unified Power Grid. The intention is to increase the power
production up to 35.5 TWh by 2030 through modernization of steam-turbine plants and construction of
new GTPP. In July 2013, a company "Çalik Enerji Sanayi ve Ticaret A.Ş." (Turkey) has signed two contracts
for building of two GTPP61.
Three plants produce liquefied petroleum gas (LPG) in Turkmenistan. The first was put into operation in
1998 at the Naip gas condensate field and has produced 15,000 tons of LPG per annum and a similar
quantity of gas condensate. In November 2002, the 2nd unit [at Naip] was put into operation with a
capacity to process 9 million cubic meters per day and to produce 65,000 tons of LPG annually. The
Turkmenbashi refinery on the Caspian Sea coast is the other main LNG producer. After modernization in
2002, its LPG production increased from 18 to 220,000 tons per year.
2.4 Azerbaijan
2.4.1 Flare levels and trends
Azerbaijan’s oil production grew rapidly from 0.3 million barrels per day in 2004 to 1 million barrels per
day in 2009, after which it has stagnated. Somewhat less than 80% of the production comes from the
offshore fields Azeri, Chirag and Deepwater Gunashli (ACG), operated by BP and with a consortium of 9
international oil companies and the State Oil Company of Azerbaijan, SOCAR, as partners. Other important
oil fields in terms of initial recoverable reserves are “Balakhany-Sabunchi-Ramany”, “Shallow Water
Guneshli”, ”Neft Dashlary” and “Bibiheibat” fields.
Gas production62, according to the BP Statistical Review, grew from 4.5 BCM in 2004 to 15.6 BCM in 2012.
The increase was primarily caused by the start-up of production from the Shah Deniz gas condensate field.
Gross production of APG from the ACG fields was 12 BCM, of which 60% was re-injected, some 25% was
brought to land for domestic consumption or exports and 15% was used as fuels at the installations or
was flared, flaring being somewhat less than fuel use.
The ACG fields account for the major part of flaring in Azerbaijan. Since 2009, when oil production reached
a plateau, flaring has been in the range 0.5 to 0.7 BCM per annum, and the gas utilization rate has
59 IEA WEO 2010 60 IHS midstream database 61 http://www.trend.az/capital/energy/2171188.html 62 Excluding re-injected and flared gas.

Associated Petroleum Gas Flaring Study for Russia, Kazakhstan, Turkmenistan and Azerbaijan
Page 40 of 80
oscillated around 94%63. By international standard this is a relatively high utilization rate, but the total
volume of flaring is still large reflecting the high production oil and gas produced at ACG.
SOCAR operates a number of fields that have had considerable venting of associated gas, the most
important being Shallow Water Guneshli, Neft Dashliari and Palchiiq Pilpiassi. Total venting from SOCAR
operated fields was 0.5 BCM in 2007 but has since been radically reduced (see below).
2.4.2 Regulations and policies
The Ministry of Industry and Energy is the governmental body in charge of policies and regulations for the
energy sector, and the Ministry of Ecology and Natural Resources is in charge of regulating environmental
protection and the use of natural resources. SOCAR exercises considerable influence on gas regulatory
and policy matters in practice.
A number of laws have clauses relevant to gas flaring. These notably include the Law on Environmental
Protection; the Law on the Use of Energy Resources; the Law on Ecological Safety; and the Law on Air
Protection. However, this legal basis is not supported by secondary legislation, such as specific
requirements, allowances or penalties for pollutants applicable to gas flaring and venting. As a result,
these laws have limited impacts on venting and flaring practises. For example, although the legislation
stipulates the application of penalties, it does not provide any mechanisms for its implementation in the
case of case flaring or venting.
In practise, the Production Sharing Agreements (PSAs) are the most important documents governing
associated gas use and flaring. The PSA for ACG partners stated that SOCAR shall take delivery of the
associated gas and that flaring is only allowed if SOCAR is unable to take such delivery or in cases of
emergencies, equipment failures, repairs or maintenance of any facilities, including delivery systems.
63 With re-injection being accounted for as gas utilization.
Figure 15: Flaring of associated gas and gas utilization rate at the ACG bloc and the Sangachal terminal (ST)
Source: BP in Azerbaijan Sustainability Report
Associated Petroleum Gas Flaring Study for Russia, Kazakhstan, Turkmenistan and Azerbaijan
Page 41 of 80
Under most PSA agreements, operators can use produced associate gas for their own use, but should
deliver the remaining part to SOCAR free of charge. They are not allowed to export or sell associated gas
domestically, which will tend to reduce the economic incentives to gather the gas.
In terms of reporting requirements, each company must report the volume of vented and flared
associated gas to the relevant statistics organization. While the PSA partners prepare their reports
according to contractual requirements, SOCAR’s subsidiaries use their own internal formats.
2.4.3 Investments and barriers
APG utilization is already relatively high in Azerbaijan by international standards. Challenges for further
flaring reductions include the fact that the volume of each source is generally low to very low and that
some fields currently venting are old oil deposits with declining production, reducing the incentives to
develop gas utilization plans. Moreover, economic conditions with relatively low market value for gas and
weak economic incentives in the PSAs, are not very conducive of additional efforts in reduced flaring and
venting.
Azerigaz (a SOCAR subsidiary) is in charge of gas transportation, distribution and storage for the domestic
market. There is no wholesale gas market, and no indication that the current gas market structure is likely
to change. The domestic transport tariff is regulated and set by the Tariff Council under the Ministry of
Economic Development. Internal [end-user] gas tariffs have been revised four times in the last decade
and may be raised again. SOCAR purchases gas from Shah Deniz Consortium at average price of 58
USD/1,000 m3 (including transportation), based on specific formula that changes periodically. Azerenerji
owns most of the country’s power plants (over 6,300 MW), including 11 gas-fired thermal plants. The
electricity price is indirectly subsidized through a special gas tariff for power generation facilities.
Given the progress already made and barriers for investments in APG utilization further improvements
will inevitably be more modest and costly than what has been achieved over the past 5-6 years.
Nevertheless, both SOCAR and BP appear to have ambitious plans for further reductions in wastage of
APG.
BP as operator of the ACG fields have analysed the causes of continued flaring and grouped tem into four
main categories:
i) The gas injection plant being off-line or with reduced capacity
ii) Technical problems with the flash gas compressors
iii) Down-time of the gas facilities at ACG, and
iv) Continuous flaring from pilot lights, purge gas and degassing of produced water.
The three first categories, being intermittent flaring, account for ¾ of the total. They can be reduced
through technical measures to reduce regularity of equipment. According to BP64, a number investments
have been made since 2009 to improve the reliability of existing equipment, resulting in flare reductions,
including improvements to the gas injection system at Central Azeri field and to a compressor at Chirag.
64 BP in Azerbaijan sustainability reports (2010 to 2012)
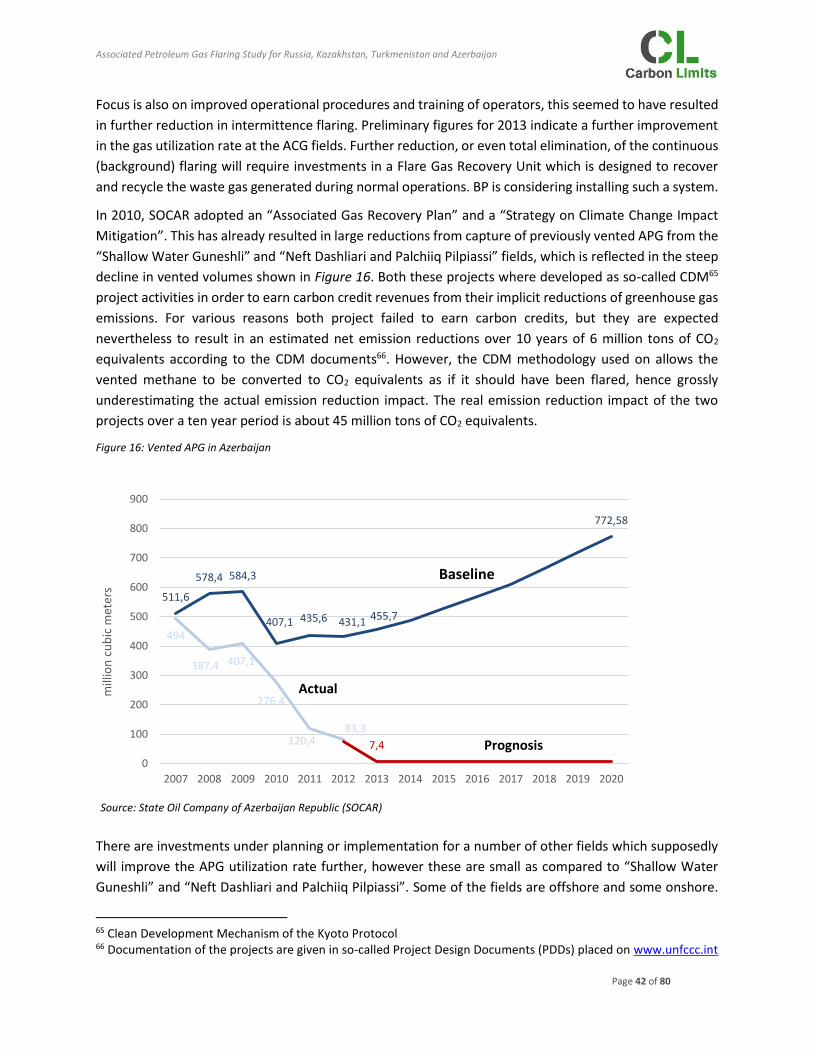
Associated Petroleum Gas Flaring Study for Russia, Kazakhstan, Turkmenistan and Azerbaijan
Page 42 of 80
Focus is also on improved operational procedures and training of operators, this seemed to have resulted
in further reduction in intermittence flaring. Preliminary figures for 2013 indicate a further improvement
in the gas utilization rate at the ACG fields. Further reduction, or even total elimination, of the continuous
(background) flaring will require investments in a Flare Gas Recovery Unit which is designed to recover
and recycle the waste gas generated during normal operations. BP is considering installing such a system.
In 2010, SOCAR adopted an “Associated Gas Recovery Plan” and a “Strategy on Climate Change Impact
Mitigation”. This has already resulted in large reductions from capture of previously vented APG from the
“Shallow Water Guneshli” and “Neft Dashliari and Palchiiq Pilpiassi” fields, which is reflected in the steep
decline in vented volumes shown in Figure 16. Both these projects where developed as so-called CDM65
project activities in order to earn carbon credit revenues from their implicit reductions of greenhouse gas
emissions. For various reasons both project failed to earn carbon credits, but they are expected
nevertheless to result in an estimated net emission reductions over 10 years of 6 million tons of CO2
equivalents according to the CDM documents66. However, the CDM methodology used on allows the
vented methane to be converted to CO2 equivalents as if it should have been flared, hence grossly
underestimating the actual emission reduction impact. The real emission reduction impact of the two
projects over a ten year period is about 45 million tons of CO2 equivalents.
There are investments under planning or implementation for a number of other fields which supposedly
will improve the APG utilization rate further, however these are small as compared to “Shallow Water
Guneshli” and “Neft Dashliari and Palchiiq Pilpiassi”. Some of the fields are offshore and some onshore.
65 Clean Development Mechanism of the Kyoto Protocol 66 Documentation of the projects are given in so-called Project Design Documents (PDDs) placed on www.unfccc.int
511,6
578,4 584,3
407,1 435,6 431,1455,7
772,58
494
387,4 407,1
276,4
120,483,3
7,4
0
100
200
300
400
500
600
700
800
900
2007 2008 2009 2010 2011 2012 2013 2014 2015 2016 2017 2018 2019 2020
mill
ion
cu
bic
met
ers
Baseline
Actual
Prognosis
Figure 16: Vented APG in Azerbaijan
Source: State Oil Company of Azerbaijan Republic (SOCAR)

Associated Petroleum Gas Flaring Study for Russia, Kazakhstan, Turkmenistan and Azerbaijan
Page 43 of 80
In addition to producing fields Azerbaijan has more than 20,000 abandoned wells, of which some leak
substantial volumes of methane. They represent an importance source of greenhouse gas emissions and
SOCAR is in the process of creating an inventory of air emissions from the wells. In 2012 more than 500
measurements of well leakages were performed and efforts are on-going to improve the understanding
of the scale of the problems and approaches that can be applied to reduce leakages.
Oil production in Azerbaijan is not expected to increase much from the current level but where will be
fields coming on stream to compensate for the decline from ACG and other existing oil fields and this will
require new investments in APG utilization.
Gas production made leap already in 2005 with start of production of Shan Deniz. This field will also be
the major source of further production increased. SOCAR forecasts gas production reach 50-55 BCM/year
by 2025, while the IEA forecasts peak production at 43 BCM per.67 Expansion of gas supplies also means
that the gas supply infrastructure within Azerbaijan is being further developed, including expanding the
processing capacity of the Sangachal Terminal and Garadang processing plant. This would facilitate market
outlets from whatever might be left of stranded associated gas.
67 SOCAR and IEA World Energy Outlook 2010

Associated Petroleum Gas Flaring Study for Russia, Kazakhstan, Turkmenistan and Azerbaijan
Page 44 of 80
3. Economic viability of APG utilization options
To increase utilization of APG, operational practices can be optimized and new infrastructure can be
established to recover otherwise flared gas for productive use. Given the context of this study, where the
focus has been to identify bankable investment projects, the objective of this chapter is to describe the
economic viability of investments in infrastructure to recover and utilize APG to reduce continuous
production flaring within the four target countries.
For each site where APG is flared, a number of alternative value chains may be established to recover and
utilize part of the gas. The economic viability of each of these APG utilization options is affected by a large
number of factors, e.g. gas characteristics, location and presence of existing infrastructure, market
conditions, etc. The optimal solution for a particular site is thus highly case specific. This chapter aims at
providing a high-level presentation of alternative APG utilization options that may be suitable for flare
sites within the four target countries, including technical components and their pros and cons.
This chapter is organized in four main sections. The characteristics of flared gas are presented in Section
3.1, as these characteristics (volume, pressure and composition) have a significant impact on suitability of
different gas utilization options and on the economic viability of gas utilization. Section 3.2 contains short
descriptions of different technical components which can be combined into solutions to reduce APG
flaring under the following headings:
(i) APG gathering systems: Technologies to collect, gather and compress different gas streams
(ii) Gas treatment and processing: Key components of gas treatment and processing facilities
(iii) On-site use: Gas injection, electricity and heat generation
(iv) Conversion processes: Conversion of (fractions of) APG into e.g. electricity and liquid fuels
(v) Transport options: Transport modes for APG and products that can be produced thereof
APG gathering systems and facilities for gas treatment and/or processing are presented first, as these
value chain components are required for many different APG utilization options. Different options for
productive utilization of gas on-site and off-site are then described, including possible conversions into
other products and options for transportation to relevant markets.
The different technical components can be combined together to form a multitude of gas utilization
options. The economic viability of investments in four “generic” APG utilization options are discussed in
Section 3.3. The selected options do not necessarily represent the most interesting options for any given
site, but are representative of solutions applied or considered in order to reduce APG flaring within the
four target countries. Cost estimates used for the assessments of economic viability of the “generic”
utilization options are primarily derived from QUE$TOR68, but estimates of costs and benefits provided
through the case studies conducted as part of this Study have also been considered where relevant.
68 QUE$TOR is a cost-estimation software provided by IHS. This chapter includes content supplied by IHS Global SA: copyright © IHS 2011. All right reserved

Associated Petroleum Gas Flaring Study for Russia, Kazakhstan, Turkmenistan and Azerbaijan
Page 45 of 80
Section 3.4 attempts to summarize the influence of key factors on the economic viability of key options
for APG utilization, e.g. the amount of recoverable APG (supply profile), gas composition and pressure,
distance to relevant markets and existing infrastructure, demand for energy on site or in close proximity
of the flaring site and relevant net-back values of APG and products that can be produced thereof.
3.1 Characteristics of flared gas
Flare gas streams can have largely different characteristics in terms of gas qualities and recoverable gas
quantities within the typical operational lifetime of new infrastructure established to productively utilize
the gas. As this can have major implications on the product yields, production costs and achievable net-
back prices, the economic attractiveness of APG utilization projects is largely dependent on the flare gas
characteristics. It should be noted that the assessments presented in this report do not take into account
all potential site specific variations in flare gas characteristics.
This study is focused on recovery and utilization of APG, which is gas that is associated with oil in the
reservoir. Theoretically the definition could include the gas cap (i.e. gas residing above oil in a reservoir),
but the term usually refers to gas dissolved within the oil (also referred to as solution gas). The amount
and composition of APG vary depending on the nature of the reservoir, the type of lift that is used, the
degree of depletion of the reservoir and other factors.
As the oil is brought to the surface, APG comes out of solution and is usually separated out before the oil
enters the transport pipeline. Typically the gas is separated from oil in a two-phase separation, or a three-
phase separation of oil and water using the density differences in the fluids. Multiple stage separation (up
to four) may also be required where the produced fluid is under high-pressure and has high gas-oil ratio
(GOR). The first stage separation is at a pressure less than the well pressure (which varies greatly between
fields). The dissolved gases flash to form a free gas which is still at elevated pressure and can be either
flared, used or sold. The remaining oil is transported to the second stage of separation which is at a lower
pressure, and the resulting flashed gas will thus also be at a lower pressure than at the first stage. A third
stage separation might be needed for very high GOR well streams. The final stage of separation occurs in
the stock tank which is at atmospheric pressure. Gas continues to evolve and is usually vented, but may
be captured, compressed and either flared, used or sold.
Different APG streams can have large variations in gas composition and impurities, and thus may require
different levels of treatment. The variation in composition also means that different APG streams will
provide different product yields and thus different economic values, even when applying the same
technological solutions. Some gas utilization options, such as processing into dry gas, LPG or natural
gasoline, have better returns when the recoverable gas stream is “rich”, i.e., when it contains a large
portion of heavier hydrocarbons. Other options for APG use, such as large-scale electricity generation,
generally work better when the gas is “lean”. An APG stream will always be more attractive when it
contains fewer impurities69 and is at an elevated pressure, due to reduced costs required for treatment
and compression.
69 In particular CO2 and H2S

Associated Petroleum Gas Flaring Study for Russia, Kazakhstan, Turkmenistan and Azerbaijan
Page 46 of 80
The APG composition is not stable, but tends to vary over time as a result of multiple factors, including
well depletion and changes in well stocks, recovery techniques and operating conditions. Future changes
in APG compositions are difficult to predict accurately, making it more challenging to design facilities for
APG than for natural gas.
APG quantities also tend to vary over time, making it difficult to ensure the optimum utilization of
infrastructure. The variation in quantity over time could also have a negative effect on the negotiable
price for products produced from APG if a customer has a preference for volume certainty, e.g., in the
case of using APG for electricity generation. APG production and recovery rates feature short-term
fluctuations due to operational changes, as well as longer-term variations due to changes in GORs,
depletion of hydrocarbon reservoirs, changes in recovery techniques, the drilling of new wells and the
shutting in of old wells, among other causes.
3.2 Technology components of APG utilization options
Technical components that can be used to establish value chains for APG are briefly presented below.
3.2.1 APG gathering systems
APG is usually separated from the oil using a number of consecutive pressure vessels, resulting in multiple
APG streams with different characteristics. When multiple APG streams are to be recovered, a system to
gather them into a comingled stream is often required prior to further handling. The technical design of
the gas gathering system will depend on the characteristics and locations of these APG streams, the
desired delivery conditions and the location of the common infrastructure to which they will be delivered
for further processing or use.
Figure 17: Long-term development in APG production at an actual oil field (1,000 m3/day)
Source: Norwegian Petroleum Directorate
1,0
00
m3/d
ay

Associated Petroleum Gas Flaring Study for Russia, Kazakhstan, Turkmenistan and Azerbaijan
Page 47 of 80
The APG gathering system typically consists of gas pipelines, dehydration and compression facilities to
allow comingling70. The gas gathering system normally consists of relatively low-diameter gas pipelines to
transport gas at limited pressure (<10 BarG). Pipelines can be made of steel or highly advanced plastic
depending on operating conditions. In addition to material and diameter, key cost drivers for gas pipelines
include the winterization of the pipeline and the terrain. Insulation of the pipeline, for example, can
increase CAPEX by more than 60%, while terrain factors can lead to a doubling of CAPEX. Costs can also
double if the gas is acidic and thus requires transport in pipes made of stainless steel or duplex.
In some cases it is favourable to transport gas comingled with oil to central processing facilities for
separation and recovery, e.g. in situations where there is a lack of compression facilities upstream. This
transport option is sometimes used to recover low-pressure gases from multiple sites, avoiding the cost
of small-scale distributed compressor units.
At a delivery pressure of 10 BarG at the outlet of a gas gathering system, the unit cost of APG recovery
can range from less than USD 5 per million cubic meter for partial recovery of high-pressure APG streams
requiring short distance pipeline transport to downstream facilities, to over USD 200 per million cubic
meter for complete recovery of very low-pressure gas streams and longer pipeline connections. As a
result, the desired recovery level is often optimized based on differences in unit recovery costs and gas
qualities.
3.2.2 Gas treatment and processing
APG will generally require treatment if it is to be utilized productively. The main gas treatment processes
are compression, dehydration, chilling, fractionation, liquefaction, desulphurization, and CO2-removal.
While gas treatment processes can be applied at various points along the gas value chain to increase
transportability, remove impurities and separate the APG stream into useful products (including
intermediary ones), these processes are often combined in a single facility; a gas processing plant (GPP71).
One of the most common ways to utilize APG within the four target countries is to gather it upstream and
supply it to large, centralized gas processing plants (GPPs) to produce dry stripped gas (DSG), LPG
(propane-butane mix) and natural gasoline (SNG).
Compression
Gas compression can be required to facilitate transportation and/or comingling of different raw APG
streams in a gas gathering system. It is also usually required to bring the recovered gas to a sufficiently
high pressure to be treated and/or used productively. A gas compression station typically consists of liquid
and particulate removal devices such as “scrubbers”, a number of compressor units, necessary auxiliary
systems and facilities, and process metering systems. In order to bring the gas to the desired pressure, it
70 The gathering system may or may not include basic treatment of APG streams prior to transportation and/or comingling, e.g. dehydration and compression. The relevant APG treatment technologies are further described in Section 3.2.2, as they may be applied at multiple stages of a full APG value chain. 71 GPPs typically consist of equipment for compression, dehydration, sweetening (if required), NGL extraction, fractionation and marketing of products, including storage and loading facilities for liquids. It also requires control systems, metering arrangements and utilities.

Associated Petroleum Gas Flaring Study for Russia, Kazakhstan, Turkmenistan and Azerbaijan
Page 48 of 80
is passed through one or multiple stages of compression. Unit compression costs of gas vary depending
on the suction and discharge pressure, gas flow rate, energy costs and the yield and value of drop-out
liquids. While the cost/net-back value of electricity/fuel gas varies between sites, the total, annual OPEX
related to compression typically amount to 6-7% of CAPEX for compression ratios ~10.
At lower suction pressures, the compression ratio is high and the energy required to reach the desired
discharge pressure is similarly high. Unit compression costs could be prohibitive for very low pressure APG
streams, essentially preventing economic recovery as part of a flare gas utilization project. This is one of
the reasons why second-stage (low-pressure) separation gas has been flared at many sites within the four
target countries, while first-stage separation gas has been (partly) recovered and utilized productively.
When constructing a gathering network for APG streams with different pressure levels, there is often a
trade-off between distributed and centralized compression facilities. In most cases where multiple gas
streams are gathered in the same system, a combination of distributed and centralized compression will
provide optimum economic results.
Dehydration
In most cases, gas must be dehydrated if it is to be transported in a pipeline. Dehydration is conducted to
prevent moisture in hydrocarbons from contaminating pipes and vessels downstream. Water can be
absorbed by passing the gas through a glycol/water solution in a separator, absorbed by a desiccant,
separated by electrical coalescence, or boiled off. The CAPEX related to dehydration is usually relatively
small.
Sweetening (desulphurization and CO2 removal)
If gas is “sour”, i.e. contains significant amounts of hydrogen sulphide (H2S), it usually must be treated to
remove the H2S before it is used or marketed. This is due to the toxicity of the gas and the corrosive nature
of the sulphur oxides that result from its burning. The most common processes for H2S removal are the
amine absorption process, the molecular sieve process and the iron-sponge process. The cost of
desulphurization is heavily dependent upon the H2S concentration.
If the gas contains significant amounts of CO2, which is acidic, this often needs to be removed in order to
increase the heating value and to prevent corrosion of the pipelines and gas processing equipment. The
selection of a CO2 removal process is often based on gas composition and operating conditions.
HC dew point control and/or NGL extraction
Rich APG streams can contain significant amounts of heavy hydrocarbons, which will condense at elevated
pressure as the gas cools, e.g. during pipeline transportation. The presence of heavy hydrocarbons can
represent significant added value if they are extracted from the raw gas stream and marketed separately.
It is often desirable to split the gas into a lean gas mixture with a controlled hydrocarbon (HC) dew point,
such as “dry stripped gas” (DSG), and a hydrocarbon mix consisting of natural gas liquids (NGLs). This can
be achieved through one of the following processes: absorption, modified absorption, or cryogenic
expansion. The optimal process design will depend on whether the goal is to produce lean gas complying
with specific quality requirements, maximize NGL (and ethane) extraction, or both.

Associated Petroleum Gas Flaring Study for Russia, Kazakhstan, Turkmenistan and Azerbaijan
Page 49 of 80
The lean gas resulting from extracting heavier hydrocarbons can be treated further (e.g., compressed)
before being marketed, utilized on site or used as fuel and/or feedstock to produce other marketable
products. The CAPEX required for dew point control represents a small portion of the overall costs related
to gas processing, and the per-unit cost drops significantly with volume.
Fractionation
A number of valuable products can be produced from the liquid part of the APG, which condense as a
result of HC dew point control and NGL extraction. Depending on the desired product specifications, a
number of fractionation towers/columns (typically 2-3) can be used to separate the inlet stream into
individual products for separate marketing or use, typically consisting of ethane, LPG and stable gas
condensate.
Liquefaction
In order to improve the transportability of natural gas, it can be condensed into Liquefied Natural Gas
(LNG), which takes up about 1/600th the volume of natural gas in its gaseous state. Following initial APG
treatment to remove water, H2S, CO2, heavier hydrocarbons and other components that might freeze
(often referred to as “purification” in the context of LNG production), the resultant dry gas can be fed to
a gas liquefaction unit (LNG train). In the LNG train, the gas is cooled down in stages until it is liquefied (at
approximately -162 0C). The LNG is then routed to storage tanks from where it can be periodically loaded
and shipped using suitable vessels or tanks.
Section 3.3 presents the attractiveness of four types of investment cases to improve APG utilization,
including a case comprising construction of a GPP.
3.2.3 On-site use
The share of produced APG which is used productively on-site will vary from field to field, essentially from
0% to 100%. The amount of excess gas on-site can be reduced by re-injection and additional electricity
and heat generation. Re-injection may eliminate all flaring on-site, while the last two gas options normally
will only offer a part solution due to limited demand for heat and power locally.
Re-injection
Flaring of APG typically occurs where natural gas has a limited value due to lack of access to wider gas
grids. In some cases, APG (after stripping useful liquids) could be re-injected into the producing reservoir
to increase production, or alternatively into a geological formation for temporary or permanent storage.
Re-injection of gas typically requires significant compression, which in turn implies substantial
investments, especially at brownfield sites.
APG is often flared rather than re-injected into producing reservoirs if there are limited economic benefits
associated with re-injection for improved oil recovery at a particular field. However, flaring instead of re-
injection can also be due to lack of knowledge about the optimization of producing reservoirs. On the
other hand, some reservoirs are not considered suitable for re-injection due to potential problems of gas
break-through that could affect oil production – the primary source of revenues. The benefits of re-

Associated Petroleum Gas Flaring Study for Russia, Kazakhstan, Turkmenistan and Azerbaijan
Page 50 of 80
injection for enhanced oil recovery will depend on a number of technical factors that must be assessed
through a detailed reservoir model.
Both depleted reservoirs and producing reservoirs can be appropriate for gas storage, as can other
formations such as salt caverns. The economic incentives related to re-injection for storage is limited to
the value of preserving the resource for potential use in the future (e.g. for use in power generation) and
any cost savings or reduced risks related to flaring avoidance. Since prospects for development of
attractive gas markets within the investment horizon of private companies could be low in many regions,
investments in re-injection for storage normally will only make sense in the face of high penalties for
flaring or other similarly strict regulations.
Onshore, well construction costs vary greatly depending on a number of factors, including target depth,
well profile and geological formation types.
Electricity and heat generation for local use
APG can be used as fuel to produce electricity for meeting local demand and/or supplying the grid. The
optimal generation technology and power plant design will depend on many factors, including fuel gas
quantity, quality and reliability of supply, electricity demand, load curve and desired fuel flexibility.
When considering APG for on-site power generation, it is critical to consider all variables that affect
stability and reliability of power supply, such as crude oil production, water cut, GOR and gas quality and
quantity. These variables are neither fully predictable nor stable, posing significant challenges to using
APG in an industry where reliability of electricity supply is of vital importance. Back-up fuel supplies and/or
generation capacity is vital, either in the form of additional (non-associated) gas supplies, a grid
connection or installation of dual-fuel generation units. Changing the operational practices of an oil
company to endorse a gas-to-power project can also be challenging, due to unconventional capital
expenditure requirements, potential loss of crude oil production during project implementation and
significant technical and operational barriers that need to be overcome for continuous use of associated
gas.
Gas-fired generation technologies include gas engines, gas turbine generators, and steam turbine
generators. Depending on which solution is applied, the APG may require treatment and processing
(conditioning) prior to use as a fuel.
The prefabrication, construction and material costs of small-scale power plants are highly variable and
depend on local conditions. The total CAPEX for small-scale power generation based on APG is estimated
to be in the range of 1.1 to 3.0 million USD per MW72 of installed capacity, including back-up power supply,
local grid connections, plant utilities and control system. In Russia, there are a couple of recent examples
of large-scale power plants using primarily (treated) APG as fuel. Rosneft has e.g. constructed a 345 MW
captive power plant to supply electricity for oilfield operations at the giant Priobskoye field.
72 JI PDDs in Russia and literature review.
Associated Petroleum Gas Flaring Study for Russia, Kazakhstan, Turkmenistan and Azerbaijan
Page 51 of 80
If there is a demand for heat in close proximity to suitable power plant locations, combined heat and
power (CHP) technologies can be used to produce both electricity and heat. For a combined production
of heat and power at a larger plant, energy efficiencies approaching 90% can be reached.
APG potentially can be used to produce heat for on-site oil treatment or (after transportation) as a fuel to
produce heat for industrial consumers or population centers, potentially replacing other costly fuel
sources. As long as APG transportation is not compromised, gas quality requirements for use of APG as a
fuel in boilers are less stringent than those for supplying gas transmission and distribution systems. In
some situations, it could thus be commercially viable to directly supply existing heat generation facilities
with APG fuel gas.
3.2.4 Using APG fractions as fuel or feedstock
A number of technologies are available to convert APG fractions resulting from gas treatment and/or
processing into potentially more valuable products, such as electricity, heat, petrochemicals and liquid
fuels, as well as various energy-intensive industrial products such as fertilizer and steel. A full overview of
all available options to utilize APG fractions as fuel or feedstock is not included here. Due to the main
objective of this study (i.e. identification of bankable investment projects in collaboration with potential
clients), the options of using (treated) APG for electricity generation and Gas-to-Liquids (GTL) have been
studied in more detail and are presented below.
Electricity generation for grid export
In many oil fields, the electricity demand is significantly lower than the amount of electricity that can be
generated by the APG. This implies that using the APG to generate electricity to meet the needs of the oil
field usually will only represent a partial solution in terms of flare avoidance. Electricity generation can
also be considered in larger scale to export the electricity to the regional or national markets.
A large-scale power plant may consume up to 1 BCM/year of gas. Due to significant capital expenditures,
ensuring optimal capacity utilization is the key to economic attractiveness. As a result, medium to large-
scale power plants would only be attractive in cases where sufficient volumes of APG could be aggregated
to provide the power plant with a reliable supply of fuel over time. The costs associated with establishing
gas gathering infrastructure and gas treatment and processing facilities to supply a large-scale power plant
can be substantial. This implies that the cost of electricity generation based on APG will only be lower
than electricity generation based on gas purchased at domestic prices under special circumstances, e.g.,
when there are shortages of generation capacity or a limited ability to export/sell treated gas.

Associated Petroleum Gas Flaring Study for Russia, Kazakhstan, Turkmenistan and Azerbaijan
Page 52 of 80
Gas to liquids
Gas-to-Liquids73 (GTL) is a term typically used to describe the conversion of natural gas into liquid fuels
(predominantly synthetic diesel) via the traditional “Fischer-Tropsch” route. However, the largest and
oldest gas-to-liquid technology is production of methanol74.
Gas conversion to liquid fuels and chemicals is a capital intensive industry, where economy of scale has
been critical. World scale methanol plants consume ~1.5 BCM of natural gas per year, while GTL Fischer-
Tropsch (FT) plants have a capacity exceeding 35,000 bbl/day liquid fuel production (consuming >3.5
BCM/year).
Typical reaction routes and product outputs for common GTL technologies are illustrated in Figure 18.
The 1st reaction step (reforming), the manufacture of “syngas” or synthesis gas, is common to all the
reaction routes shown in Figure 18. The 2nd reaction step (i.e. the Fischer-Tropsch (FT) step), is common
for solutions that produce syncrude or refined fuels, and involves a series of chemical reactions that
produce a variety of long-chained hydrocarbons. GTL plants comprising only the reforming and FT steps
yield syncrude, which can be marketed with crude oil (potentially following simple hydrocracking if
needed to meet specs). A hydrocracking unit can be installed to upgraded syncrude to diesel, naphtha or
lubes (3rd step shown in Figure 18). This step can be achieved using a range of conventional technologies,
and could yield products that sometimes can be marketed locally at a premium.
Methanol production provides an alternative to the 2 to 3 step FT reaction routes. Manufacturing of
methanol is the oldest and largest gas-to-liquids technology, and there are a large number of operating
73 Many acronyms are being used; from GTL and GTC to gas-to-fuels (GTF) and gas-to-gasoline (GTG). For simplicity, the most common term “GTL” will be used for all options covered in this report. 74 This branch of gas conversion is often referred to as “Gas-to-Chemicals” (GTC), since the major use of methanol has been as a feedstock for other chemicals. Increasing shares of methanol however end up in liquid transportation fuels such as MTBE, bio-diesel and DME (dimethyl ether). It has been predicted that within five years, more than half of the methanol supply will end up as a liquid energy carrier, eclipsing its use as a chemical.
Figure 18: Typical reaction routes for GTL technologies
Source: Carbon Limits

Associated Petroleum Gas Flaring Study for Russia, Kazakhstan, Turkmenistan and Azerbaijan
Page 53 of 80
plants worldwide. Some novel technologies to convert gas to methanol and other products are also under
development. Methanol can be further converted to e.g. DME75 or gasoline for potential use as liquid
energy carrier/transport fuel.
In general, there are little differences in the feed gas requirements between technologies; all technologies
can use DSG as feedstock, while higher carbon content gases can be accommodated with minor
modifications if gas fractionation is not feasible76. All technologies are sensitive to poisons, and sulphur
and mercury must be removed. Nitrogen and carbon dioxide are diluents and can be tolerated in
moderate concentrations. Due to GTL being a capital intensive option for monetization of gas, achieving
high capacity utilization is key to economic efficiency (i.e. having stable, long-term gas supplies or a
modular solution with good turn-down ratio). Higher pressure is generally an advantage since the 1st step
reformers of most FT reaction routes run at elevated pressures (> 20 bar).
GTL plants are relatively complex facilities, and transportability of equipment and site accessibility is
generally an important determinant for overall plant costs. This is particularly important in remote
locations. Harsh climate conditions can also provide a challenge that must be addressed in terms of site
access, construction/assembly and plant design (e.g. need for insulation, merits of water cooling, etc.).
So far there is no modern GTL synthetic motor fuels production on an industrial scale in the four target
countries. A number of companies are developing solutions suitable for smaller plants using innovative
technologies. With new approaches, the challenges typically posed by using APG as feedstock can be
overcome (e.g. limited and changing supply over time).
Other products
After treatment, APG could in theory be used as feedstock and/or fuel for production of fertilizers such as
ammonia and urea, or in the production of energy-intensive products such as steel. In practice, such
conversion is not commonly part of solutions adopted to reduce gas flaring, since the disadvantages of
relying on a variable source of fuel/feedstock supply and the importance of access to raw materials and
low-cost transportation options to relevant markets tend to be greater than the advantage of a relatively
cheap source of feedstock or fuel. A minimum reliability of gas supplies is required to ensure optimal
capacity utilization of new infrastructure, either in the form of aggregation of multiple APG supply sources
or through use of a combination of APG and a manageable backup supply of natural gas.
3.2.5 Transport options
APG can yield a large number of potential products, such as natural gas, LPG, stabilized gas condensate
and electricity, all of which would need further transportation to market. Transportation opportunities
and costs are key for the economic viability of investments in establishing APG value chains.
75 DME has physical properties similar to LPG, and can be a direct replacement of LPG (blended up to 100% in LPG) and use existing LPG infrastructure. 76 Economically it normally makes less sense to convert C3+ to syngas rather than separating it out as LPG/condensate.

Associated Petroleum Gas Flaring Study for Russia, Kazakhstan, Turkmenistan and Azerbaijan
Page 54 of 80
Natural gas
To facilitate cost-effective movement of natural gas, a suitable gas transportation system is required.
Natural gas at atmospheric pressure has a very low energy density and is difficult to store and transport.
Aspect Pipelines CNG LNG
Energy density77 ~<100x ~200x ~600x
Storage Difficult Limited Cryogenic
Transport Short-Medium Short Medium-Long
Energy losses 2-5% 5-10% 15-25%
Fuel flexibility Low High Medium
Capital costs Med-high Low High
Operating costs Low Relatively high Medium
Volume scale Any range Small Medium-Large
Options to address this problem include treatment of the APG into pressurized gas, CNG and LNG to
facilitate transport and storage. Table 4 gives a high-level overview of the different transport options.
Gas pipelines would normally provide the most economic transport option within the four target
countries, in particular for fields relatively close to existing infrastructure. However, capacity and access
to existing gas pipelines can be constrained in some regions. Increasing the capacity/extension of the gas
transmission network could facilitate increased APG utilization in some regions, but investment in large-
diameter transmission pipelines for long-distance transportation is typically not undertaken by upstream
producers flaring gas. The situation is particularly challenging for operators of small and medium sized
fields in remote locations. In some cases, there could be strong economic rationale for coordinating
investments to address flaring at multiple sites through “clustering” solutions, e.g. to provide resource
base to justify new gas trunklines.
LPG transport
LPG produced as a result of gas fractionation in a gas processing plant (GPP) can be stored on site in tanks
and transported by truck, rail or ship. A significant fleet of vehicles may be required for large LPG
quantities and/or long distances, resulting in complex logistical operations and high investment costs.
From a rail terminal, LPG containers or tanks can be loaded and transported to a designated market. A
new rail terminal or an upgrade of existing infrastructure is often required to handle the liquids,
potentially representing a significant investment. Once loaded, transport costs are dependent upon
tariffs, usually a function of transport distance and route complexity. In the marine transportation market,
77 Compared to natural gas at atmospheric pressure
Table 4: Options for taking recovered gas to market
Source: SCC Mena

Associated Petroleum Gas Flaring Study for Russia, Kazakhstan, Turkmenistan and Azerbaijan
Page 55 of 80
LPG is typically transported by dedicated vessels suitable for carrying pressurized, semi-pressurized or
refrigerated LPG.
Transport of stabilized gas condensate (natural gasoline)
Stabilized gas condensate can be transported via existing oil pipelines, dedicated pipelines, trucks or rail.
Its road or railway transport has a similar cost structure to that of LPG. NGLs recovered upstream are often
injected into an oil stream for export. “Spiking” the oil in this way increases its API gravity, potentially
increasing the oil’s net-back value per barrel, while also increasing its volume. If flow regimes and product
specifications are not compromised, hydrocarbon liquids from gas processing can be transported via
existing oil pipelines at limited costs.
Transport “trade-offs” and optimal location of new facilities
For many flare sites, APG utilization is facilitated by creating value chains that involve transportation of
multiple intermediary and marketable products. Due to differences in transport costs for different
products, new facilities and infrastructure established to productively utilize APG should be located such
that the economic returns of these investments are maximized. In practice, this often implies that GPPs
should be located as close to existing product markets and export infrastructure (railways or ports) as
possible, relying on long-distance pipeline transportation of APG upstream.
For a gas value chain consisting of gas gathering infrastructure and a new grid-connected power plant,
there is a trade-off between gas and electricity transportation costs. Generally, however, transportation
costs for gas are lower less than those for electricity78. Energy losses are also considerably lower for gas
pipeline transport compared to electricity transmission. Moreover, unlike electricity, gas can be
temporarily stored in pipelines as “linepack”, which tends to reduce the challenges associated with
temporary fluctuations in APG recovery rates.
3.3 Attractiveness of investments in APG utilization
The technology components presented in the previous section can be used to create a large number of
alternative value chains for APG. In reality, the realistic options for most sites where APG is flared are few.
This is primarily due to the presence of existing infrastructure, the organization of the industry and the
status of relevant markets for APG and products that can be produced from it.
The economic viability of investments in four “generic” APG utilization options is discussed below:
Option 1. Gas gathering and supply of APG to existing downstream infrastructure
Option 2. Gas gathering, processing and marketing of resulting DSG, LPG and natural gasoline
Option 3. Gas gathering, treatment and use in electricity generation for export off site
Option 4. GTL plant for production of diesel and naphtha
78 http://www.northwestchptap.org/NwChpDocs/Transmission_and_N_Gas_Comparing_Pipes_and_Wires_032304.pdf

Associated Petroleum Gas Flaring Study for Russia, Kazakhstan, Turkmenistan and Azerbaijan
Page 56 of 80
These four options do not necessarily represent the most interesting options for any given flare site, but
are representative of solutions applied or considered in order to reduce APG flaring within the four target
countries79. The economic attractiveness of each option has been evaluated for a range of conditions,
taking into account variations in physical conditions, costs (CAPEX and OPEX) and benefits. Cost estimates
used for the assessments of economic viability of the four utilization options are primarily derived from
QUE$TOR80, but estimates of costs and benefits provided through the case studies conducted as part of
this Study has also been considered where relevant.
In the following paragraphs, the economic attractiveness is expressed in terms of the required net-back
value of the main product in order to provide a potential investor a minimum return on the investment,
defined as 10% IRR for illustrative purposes. When calculating the net-back value of the main product,
“by-products” such as LPG and natural gasoline are valued at conservative market prices81. For each
option, the resulting net-back value can be compared to the relevant market value of the product in the
different regions covered by this study.
79 In remote areas, re-injection of gas is increasingly considered to be an attractive alternative to flaring. Since the attractiveness of this option depends on the reservoir where the gas is injected, however, it cannot be studied meaningfully without knowledge of site-specific geological characteristics. 80 QUE$TOR is a cost-estimation software provided by IHS. This chapter includes content supplied by IHS Global SA: copyright © IHS 2011. All right reserved. Cost data from QUE$TOR were extracted Q3 2011. 81 In the base case, the LPG net-back price has been assumed at 200 USD/ton at the exit of the GPP, while the gasoline price has been set to 25 USD/bbl (base case)
Figure 19: Overview of the four utilization options evaluated
Source: Carbon Limits analysis

Associated Petroleum Gas Flaring Study for Russia, Kazakhstan, Turkmenistan and Azerbaijan
Page 57 of 80
The base case scenario for the assessment of economic viability is based on the following assumptions
unless specified otherwise:
For simplicity, it is assumed that one single stream of APG is recovered. The gas is recovered at 8
bars and 10 degree C, and has a liquid content of 36 barrels per million standard cubic feet and a
molecular weight of 21;
The field costs (administration and lease) are not attributed to the additional investments in
APG utilization (covered by other operations);
The well facilities are assumed to be unchanged;
A decrease in gas volume of 2.5% per year is assumed, though short-term variations in gas
recovery rates have not been taken into account;
OPEX are fixed over time;
No monetary value is associated with the avoidance of flaring (due to differences in the
regulations between the four target countries);
All infrastructure is assumed to be onshore.
The country overviews have highlighted the great variety of flare characteristics across the four countries;
flare sizes vary from 0.001 to almost 2 BCM/year some flares are located a few kilometres away from
existing infrastructure, while others are located hundreds of kilometres away, gas compositions are highly
variable, etc. The results presented below thus do not provide a comprehensive overview covering all
potential variations in site-specific characteristics across the four target countries.
3.3.1 Option 1: Gas gathering and supply of APG to existing infrastructure
This option consists of investments in new infrastructure to gather APG to allow recovery and supply of
gas to existing downstream infrastructure, such as an existing gas system with downstream processing or
directly to an existing GPP or power plant. In the base case, the investments comprise a compressor
station and a new gas pipeline82. This represents an attractive gas utilization option in regions where there
is available capacity to process gas. Flare sites in the Zhanazhol area in Kazakhstan and the Khanty-
Mansiysk region in Russia may be good candidates for this type of gas utilization.
Figure 20 provides an overview of the CAPEX split between compressor and pipeline costs. As pipeline
length is reduced, so is the need for compression and hence required compressor CAPEX.
82 The economic assessment is done assuming one compressor at the point of recovery and a gas pipeline. The outlet pressure at the delivery point into existing infrastructure is set to 10 bars.

Associated Petroleum Gas Flaring Study for Russia, Kazakhstan, Turkmenistan and Azerbaijan
Page 58 of 80
Figure 21 shows the required net-back value of APG for this option. The assessment of economic viability
confirms that gas compression and gathering is relatively expensive compared to the net-back values that
can be achieved for supply of APG as feedstock to GPPs in the four target countries. These costs represent
one of the key barriers to gas utilization, particularly in the case of scattered small flares.
In some cases, low-pressure pipelines can be installed to gather and supply gas without compression. The
CAPEX of this solution would be much lower than the one presented above, but also leads to lower-quality
product, i.e. very low-pressure APG. However, this solution can represent a more attractive solution if
there is existing available compression capacity downstream.
It is important to note that hydrocarbons might drop out during compression, facilitating recovery of
valuable liquids in addition to the APG that can be supplied for further processing/use. This has not been
taken into account in the above economic analysis, since liquid drop-out depends on specific gas
characteristics. However, this could make this type of project much more attractive.
0
20
40
60
80
100
120
200 km 100 km 50 km 20 km 10 km
CA
PEX
(M
USD
)
Pipeline Lenght
Pipeline Compressor
Figure 20: Split of CAPEX for Option 1 depending on the required pipeline length (0.1 BCM/year)
Figure 21: Netback value of the gas depending on the pipeline length and the volume of gas transported
Source: Includes content supplied by IHS GLOBAL LIMITED; copyright© IHS GLOBAL LIMITED, 2011
Source: CAPEX includes equipment, material, construction, insurance, design and contingency costs.
Includes content supplied by IHS GLOBAL LIMITED; copyright© IHS GLOBAL LIMITED, 2011

Associated Petroleum Gas Flaring Study for Russia, Kazakhstan, Turkmenistan and Azerbaijan
Page 59 of 80
3.3.2 Option 2: Gas gathering, GPP and marketing of processed products
This option comprise the construction of (1) new infrastructure to gather gas, (2) a new GPP for processing
of APG into DSG, LPG and natural gasoline, and (3) transport infrastructure for supplying processed
products to markets83. This gas utilization option has been used in a number of cases within the four target
countries, e.g. at the Zapadnoe Salymskoye field (~0.4 BCM of APG inlet capacity).
The total costs of a simple GPP suitable for APG processing have been estimated using QUE$TOR and
compared with the costs reported from actual project in the region (see Figure 22)84.
As presented in Figure 23, this option requires recovery of relatively large volumes of APG to be
economically attractive when assuming a net-back value of DSG of around USD 90 per million cubic
meters. However, the total revenues for this gas utilization option are highly influenced by the sale of
liquids (LPG and gasoline). As a result, the liquid content (C3+) has an important effect on the economic
attractiveness.
83 In the base-case scenario, he investments cover a GPP located at the flare site that includes acid gas removal, dehydration, dew point control, fractionation, stabilization, compression and power generation; a 20-km LPG pipeline, an LPG terminal, a 5-km condensate pipeline and a gas export pipeline of variable length. 84 To review the quality of the cost estimates obtained from QUE$TOR, CL has compared the cost estimates to the published CAPEX for a few relatively similar GPPs in Russia in Kazakhstan and confirms that the CAPEX estimates obtained from QUE$TOR are reliable within a reasonable range of uncertainty. CL has also performed a number of sensitivities on the assumptions. These show that H2S content can have an important effect on the total CAPEX, as can terrain conditions, e.g., particularly swampy or mountainous terrain can result in much higher CAPEX.
Figure 22: Unit CAPEX for GPPs with different feed gas rates, QUE$TOR and publicly available estimates
Source: Includes content supplied by IHS GLOBAL LIMITED; copyright© IHS GLOBAL LIMITED, 2011

Associated Petroleum Gas Flaring Study for Russia, Kazakhstan, Turkmenistan and Azerbaijan
Page 60 of 80
An investment in recovery of large volumes of APG (>0.5 BCM/year) seems highly economical under the
base case scenario. However, the analysis done does not take into account the costs associated with
gathering of gas upstream of the GPP to secure a sufficiently large resource base from multiple smaller oil
field flares, which may increase costs significantly.
Figure 24 presents the results of a sensitivity analysis for a base case comprising a 50-km pipeline for dry
gas export and APG recovery of 0.5 BCM/year.
-40 -20 0 20 40 60 80 100
Central Case
Gas Volume (Central case: 0,5 bcm/year)
Pipeline lenght (Central case: 50km)
Gas flare volume decrease (Central case: -2.5% per year)
Oil price (Central case: 25 USD/bbl)
Liquid content (Central case: 36 bbl/MMscf)
Net back value of gas (USD/mcm)
26
46
20
40
-5%/year
0%/year
20 km
100 km
0.2 bcm/year
1 bcm/year
Figure 23: Dry gas net-back value for 0.1 BCM/year (Option 2)
Source: Includes content supplied by IHS GLOBAL LIMITED; copyright© IHS GLOBAL LIMITED, 2011
Figure 24: Sensitivity analysis (0.5 BCM/year and 50 km of gas pipeline for dry gas export)
Source: Carbon Limits analysis

Associated Petroleum Gas Flaring Study for Russia, Kazakhstan, Turkmenistan and Azerbaijan
Page 61 of 80
The economic attractiveness of investments in new gas processing capacity is highly site specific. Figure 25 presents the results of a sensitivity analysis performed for a small- to mid-size GPP in Russia in terms of impact on Project IRR.
This analysis shows that a 10% reduction in the expected LPG netback value has the biggest impact on the
economic viability for the investment studied. A 10% decrease of the volume of gas delivered to the GPP
can also reduce the Project IRR by almost 3 percentage points.
Overall, experience from a number of projects in the region has showed that the netback back value of
LPG and gasoline are important factors for the project economics. It is thus crucial during the assessment
of a project to understand the full LPG supply chain and review in details the difference source of CAPEX
and OPEX costs.
The LPG produced at such facility could be exported both to the national and to the international markets.
International LPG prices are increasingly correlated, even if large regional difference remains. As the
petrochemical industry remains an important international consumer of LPG, the LPG price is closely
related to the naphtha price. Russian LPG supplies from associated gas processing grow rapidly. This has
now resulted in a net surplus on the domestic market, with increased competition between suppliers as
a result. Purvin & Gertz have forecasted that the CIS region is long of LPG in 2014. The Europe-CIS region
as a whole, however, is still net short of LPG.
3.3.3 Option 3: Gas gathering, treatment and electricity generation
This option comprises investments in (1) new infrastructure to gather gas upstream, (2) a gas treatment
unit for separation of APG into dry stripped gas and liquid hydrocarbons (NGLs), (3) a gas-fired power
plant, and (4) infrastructure for supplying electricity and liquid hydrocarbons to markets. In the base case
scenario, the assumed investment costs cover a gas treatment unit (including compression) located at the
Figure 25: Sensitivity analysis - impact of a 10% change of key assumptions on Project IRR (Nominal, Post-Tax)
Source: Carbon Limits analysis
-3.5 -3 -2.5 -2 -1.5 -1 -0.5 0
LPG NET BACK VALUE
GAS INTAKE VOLUME
CAPEX
GAS PURCHASE PRICE
GASOLINE NET BACK VALUE
Change of IRR (in %)
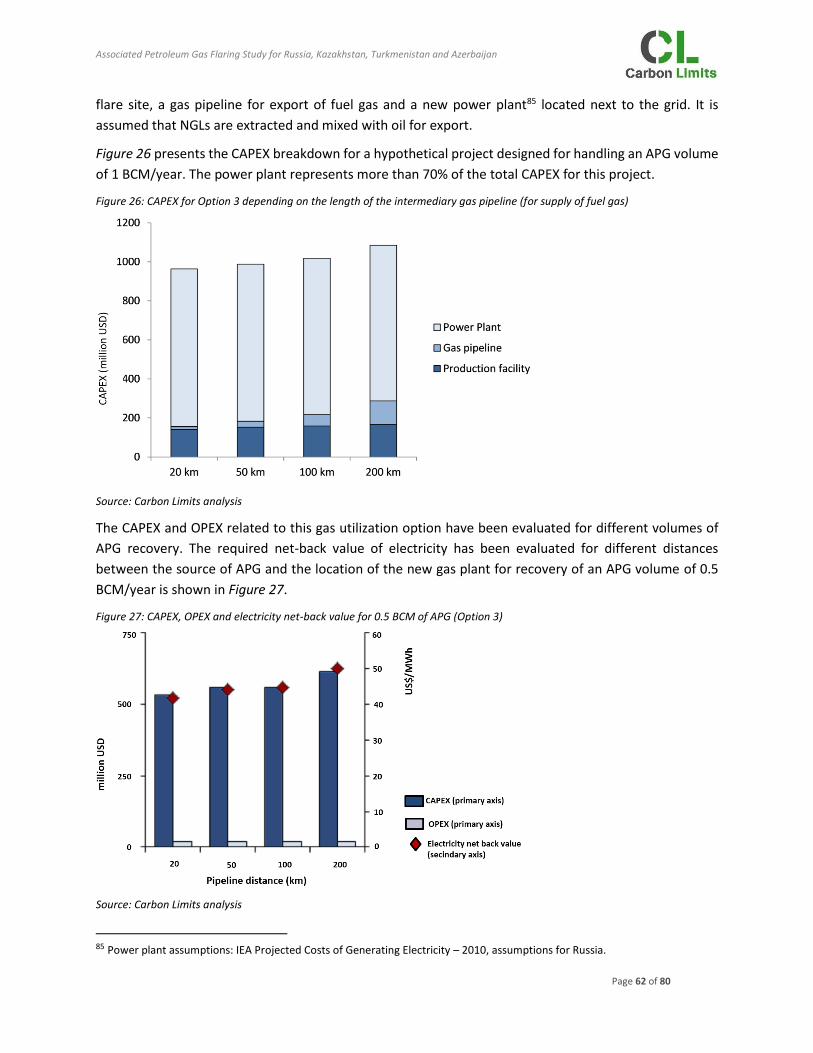
Associated Petroleum Gas Flaring Study for Russia, Kazakhstan, Turkmenistan and Azerbaijan
Page 62 of 80
flare site, a gas pipeline for export of fuel gas and a new power plant85 located next to the grid. It is
assumed that NGLs are extracted and mixed with oil for export.
Figure 26 presents the CAPEX breakdown for a hypothetical project designed for handling an APG volume
of 1 BCM/year. The power plant represents more than 70% of the total CAPEX for this project.
The CAPEX and OPEX related to this gas utilization option have been evaluated for different volumes of
APG recovery. The required net-back value of electricity has been evaluated for different distances
between the source of APG and the location of the new gas plant for recovery of an APG volume of 0.5
BCM/year is shown in Figure 27.
85 Power plant assumptions: IEA Projected Costs of Generating Electricity – 2010, assumptions for Russia.
Figure 26: CAPEX for Option 3 depending on the length of the intermediary gas pipeline (for supply of fuel gas)
Source: Carbon Limits analysis
Figure 27: CAPEX, OPEX and electricity net-back value for 0.5 BCM of APG (Option 3)
Source: Carbon Limits analysis

Associated Petroleum Gas Flaring Study for Russia, Kazakhstan, Turkmenistan and Azerbaijan
Page 63 of 80
The analysis shows that the required electricity net-back value to provide a minimum economic return on
investments is under many circumstances higher than the current wholesale electricity price in relevant
regions. However, the wholesale price for purchase of grid supplied electricity is in some regions of Russia
in the range of ~2,000 RUB/MWh (~70 USD/MWh), and the costs associated with captive diesel based
electricity generation can be a factor of four higher than this. For situations where this gas utilization
option has been found to be economically attractive, it is important to note that the base case scenario
contains an extremely simplified gas gathering network; recovery of the full APG volume at a single site.
In case recovery of multiple small, scattered APG streams is required to provide a sufficiently large
resource base to supply a new power plant, CAPEX could increase significantly.
Figure 28 presents the results of a sensitivity analysis for this gas utilization option, assuming an APG
recovery of 0.5 BCM/year. Large regional power plants using APG have complex economic drivers. The
sustainability of the gas supply86, the utilization rate (there can be important seasonal variation in power
demand within the four target countries, e.g. in Siberia), and to some extent the liquid content of the gas
are some of the key parameters influencing the ultimate viability of potential investments in this case.
3.3.4 Option 4: GTL plant for production of diesel and naphtha
This option differs from the options studied above in terms of the starting point for the assessment of
economic viability. This option comprises investments in a GTL plant to produce diesel and naphtha using
DSG as feedstock with local storage facilities for liquid products. Extraction of C3+ from APG through
processing (similar to Option 2 presented in Section 3.3.2) can be economically attractive due to
significant liquid content in the gas, while DSG in excess of what is used on-site/locally can have
86 Recoverable volumes of APG will change over time, and this is really challenging to forecast and has a significant impact on the attractiveness of investments.
0 10 20 30 40 50 60 70
Central Case
Gas Volume (Central case: 0,5 bcm/year)
Pipeline lenght (Central case: 50km)
Gas flare volume decrease (Central case: -2.5% per year)
Oil price (Central case: 25 USD/bbl)
Utilisation Rate (Central case: 60%)
Net back value of electricity (USD/MWh)
50%
70%
20
40
-5%/year
0%/year
20 km
100 km
1 bcm/year
0.2 bcm/year
Figure 28: Sensitivity analysis for Option 3 (Base case: 0.5 BCM/year and 50 km pipeline)
Source: Carbon Limits analysis

Associated Petroleum Gas Flaring Study for Russia, Kazakhstan, Turkmenistan and Azerbaijan
Page 64 of 80
limited/negative value (in a few instances DSG is known to be flared after processing, and re-injection of
excess gas after processing is becoming more common due to new regulatory requirements for APG
utilization). DSG resulting from processing is a highly suitable feedstock for GTL, and availability of stable
supplies of DSG with limited net-back value (e.g. either re-injected or flared alternatively) would provide
an attractive starting point for considering investments in GTL. DSG often has a low net-back value at
production/processing sites due to long transport distances to attractive market outlets, poor access to
existing infrastructure and unattractive pricing policies for gas locally. This is often the case in Russia, in
particular in remote areas. In some cases, GTL technologies can be applied to convert DSG into products
with significantly higher net-back values and easier logistics.
The CAPEX, OPEX and economic attractiveness related to this gas utilization option have been evaluated
for six different DSG supply profiles to the GTL plant; declining supply profiles (-2.5% per year) with peak
supply of 0.020, 0.060 and 0.070 BCM/year, and stable supplies of 0.5 BCM/year, 1.0 BCM/year and 1.5
BCM/year. Costs have been estimated based on literature review undertaken in Q2 2013. The GTL plant
is assumed to consume 10,000 standard cubic feet per barrel, with a product spread of 79% diesel, 19%
naphtha and 2% LPG. The required net-back value of diesel to provide 10% return on the overall
investment has been calculated, assuming net-back values of 500 USD/ton for naphtha and LPG and 0
USD per feed gas for the three declining profiles and USD 90 per million cubic meter for the three stable
supply profiles87. The results of the analysis are presented in Figure 29.
Due to GTL being a capital intensive option for monetization of gas, achieving high capacity utilization is
key to economic efficiency (i.e. having stable, long-term gas supplies or a modular solution with good turn-
down ratio). As can be seen from Figure 29, construction of a GTL plant including a hydrocracking unit to
87 The reason for including these latter three cases is that these feed gas profiles represent significant and stable supplies of gas, for which there would likely be alternative uses (i.e. not flared gas). Actual feed costs for monetization of DSG through GTL will depend on a number of site specific considerations, which have not been taken into account in this Study.
Figure 29: Required diesel net-back values (USD/ton) for investments in Option 4 with 7 different gas supply scenarios
Source: Carbon Limits analysis

Associated Petroleum Gas Flaring Study for Russia, Kazakhstan, Turkmenistan and Azerbaijan
Page 65 of 80
produce diesel, naphtha and minor quantities of LPG could be an attractive gas utilization option in cases
where these products can be marketed locally at a significant premium. While it has not been possible to
undertake market studies, such significant price premiums are not unrealistic in certain remote areas of
Russia.
Numerous GTL and GTC technologies are now available to add significant value to dry lean gas (DSG). As
technologies mature, GTL technologies can play a role in improving gas utilization in remote areas under
favourable local conditions. Where large and stable gas supplies can be secured and utilized at moderate
costs (e.g. in combination with a re-injection scheme at a remote site), GTL technologies can represent an
attractive alternative for monetization of the DSG at more moderate price premiums for refined products.
3.4 Summary
A number of technology components (suitable for gas gathering, gas treatment and processing, on-site
use, conversion processes and transport of products) can be used to establish various value chains to
increase utilization of APG (and reduce continuous flaring at production sites). Figure 30 provides an
overview of the most common APG utilization options.
The attractiveness of different gas utilization options are highly site specific, and mainly depend on:
(i) The flare gas volume and its expected variation over time
(ii) The gas composition (particularly the C3+ content)
(iii) The local demand and net-back prices for gas, power, heat, diesel, etc.
(iv) The distances to relevant markets
Table 5 summarizes the key factors influencing the economic viability of the main gas utilisation options
in the four target countries.
Figure 30: Overview of APG utilization options
Source: Carbon Limits analysis

For small volumes, the options for gas utilization apart from on-site use are often not economically attractive in the absence of incentives such as
a flaring fine. The economic attractiveness of APG utilization can in some situations be improved by finding integrated solutions, where gas volumes
from multiple sites is gathered to facilitate construction of large, centralized facilities and shared downstream infrastructure. However, this can
increase the commercial complexity and would require close cooperation among resource owners and investors.
Table 5: Key factors influencing the economic attractiveness of the main gas utilization options

Associated Petroleum Gas Flaring Study for Russia, Kazakhstan, Turkmenistan and Azerbaijan
Page 67 of 80
4. How to further improve APG utilization
4.1 Scale and character of the problem
Flaring reduction efforts have been stepped up and major investments have been made in gas utilization
over the past 5-6 years in the target countries. This has led to a marked reduction in flaring volumes in
Kazakhstan, while total volumes in Russia have stayed at the same level due to new flares in Eastern
Siberia having counterweighed substantial reductions in Khanty Mansiysk and other mature oil regions.
Azerbaijan has invested in gas utilization solutions so as to keep flaring at a relatively low level. Little
information is available about APG utilization investments in Turkmenistan, but there are indications that
companies operating oil fields offshore and at the coast of the Caspian Sea have implemented large gas
utilization projects since 2010.
For sound economic reasons, progress have been greatest at large flare sites. Already in 2011 some 80%
of the flare sites sent less than 100 million cubic meters per year to flare stacks, while less than 10 sites
have a flare volume higher than 1 BCM per year. With current corporate actions and regulatory pressures
this size distribution will most likely be even more skewed towards small and medium flare sites.
There will continue to be large flare sites, primarily connected to new production sites in Russia, but flaring
will typically be temporary as gas utilization solutions lag behind in field development and commissioning.
From a political and regulatory perspective therefore, elimination of routine flaring requires a particular
focus on medium and small size flare sites where the resource owners may be unable or unwilling to act
(on their own). The barriers to flare reduction are well known and recognized. Some barriers have been
reduced, among others through political action, while others now are more important with a large share
of flare sites being small and medium size often situated in remote locations.
Figure 31: Size distribution of flare sites in target countries
Source: Carbon Limits analysis

Associated Petroleum Gas Flaring Study for Russia, Kazakhstan, Turkmenistan and Azerbaijan
Page 68 of 80
Barriers can be grouped in four broad categories:
1. Technical and geographical barriers. This refers primarily to the location of flare sites and low
volume of APG production per field. In particular, scattered and small flare sites in remote
locations away from gas infrastructure represent a serious hindrance to APG investments.
2. Structural barriers. Production/flare sites are typically owned and operated by a variety of
companies while gas infrastructure, including processing facilities and transport lines, are owned
and/or controlled by large entities, often monopolies. In many cases APG investments have been
stalled due to lack of commercial agreement on terms for access of stranded gas into the
infrastructure. This problem has been given considerable political attention recently with reforms
being passed both in Russia and Kazakhstan. However, it remains to be seen to what extent and
how quickly processing and transportation access for APG producers will be improved.
3. Economic barriers. This refers to economies-of-scale and external economic parameters such as
gas and power prices, as well as taxes and other public schemes, which may impact on the
financial viability of APG investments. A common problem is that power and gas prices are kept
low for political reasons and hence reduces the “true economic value” of APG utilization
investment. This problem continues to be an important barrier in all target countries of this Study.
On the other hand it can be added that in the absence of good monitoring, companies may be
ignorant of the economic potential from productive use of the APG.
4. Regulatory barriers. As described on Section 2 the target countries have specific regulations of
flaring (albeit less direct in Azerbaijan), but despite some improvements in the regulatory practice
in past 3-4 years important deficiencies exist. Unrealistic and broad based targets and prescriptive
approaches coupled with weak and/or inconsistent enforcement mechanism have been
prevalent and become even less effective and efficient as more of flare reduction investments at
the outset will be uneconomic. A key to further flare reduction is therefore removal of regulatory
barriers (see next section).
In the past, associated gas was considered a waste product, or by-product, of crude oil production with
little economic value. Among industry executives the attitude has changed, due to higher value for the
gas, regulatory and political pressures and company-internal standards. Still, APG investments must on
compete with other projects for financial, human and managerial resources, and beating oil production
expansion investments is often difficult. Generally it is easier to have funds allocated for APG utilization
investments when they are part of new field developments than flare elimination investments from
existing producing fields, particularly if such fields are in decline and have limited remaining economic
lifetime. Regulations therefore play a particularly important role in relation to flare elimination from
existing fields where the economic return on investment may be uncertain or negative.
Associated Petroleum Gas Flaring Study for Russia, Kazakhstan, Turkmenistan and Azerbaijan
Page 69 of 80
4.2 Do “best practice” regulations and policies exist?
From this Study it can be concluded that regulatory structures and practices differ greatly among the four
target countries. Although there have been improvements, it can also be concluded that major regulatory
deficiencies persist. A natural question to be asked therefore is whether there exist a set of “best practice
regulations” that can be applied. The short answer is no; a blueprint for effective and cost efficient flare
reduction does not exist. Regulations and policies on flare reduction must be firmly rooted in the
legal/regularly structure and tradition of the country and its institutional capability. Nevertheless there
are some guiding principles drawn from international experiences that are highly relevant to apply, and
which only partially are incorporated in regulations in the target countries. These can be grouped into
three broad categories presented in the following.
4.2.1 Principles for effective regulation
It is important that policies and the primary or secondary legislation recognize that the costs of flare
reduction efforts vary by site and that cost efficiency is applied in regulatory practices. This means that
low cost cases should be taken before those with high costs, and that fiscal incentives may be offered
when flare reduction investments from a private perspective are clearly uneconomic.
Regulations normally entail an application for allowance to flare, which often are granted in special cases
(e.g. for safety reasons and in cases where investments have significant negative economic returns) and
based on specific criteria. It is important that rules and procedures for application and approval are clear
and transparent.
An impartial and predicable regulatory enforcement requires that clear rules and guidelines exist for
monitoring, reporting and verification of flaring. Data reporting requirements must also be attuned to
what realistically can be monitored. Creating trust in the sustainability and constancy of the regulation is
also essential to encourage compliance.
As with all regulations it is essential that there exist capable regulatory bodies that act independently, and
further that such bodies do not have overlapping and/or unclear functions.
4.2.2 Regulatory practices
In line with the principle of cost efficiency, regulatory bodies should set targets and requirements based
on site specific circumstances. This is of course a challenge given the inherent bias in access to information
between the resource owner and the regulator. In general the response to this is to have a regulation
where the resource owner has an incentive to reveal correct information. This will more often be the case
when companies are engaged in a dialogue with the regulator about targets and timetables to reach a
desired outcome than in the case that regulations are inflexible with punitive measures such as flare fines
or other penalties. Still, regulatory bodies need to have the opportunity to ultimately “use the stick” if the
“carrot” does not work.

Associated Petroleum Gas Flaring Study for Russia, Kazakhstan, Turkmenistan and Azerbaijan
Page 70 of 80
4.2.3 Supporting policies
As noted in Section 4.1 there are a number of barriers to flare reduction investment that can be removed
through policies and measures other than flare regulations. Imposing cost-based and non-discriminatory
power and gas prices are obvious examples as are legal reforms which give non-discriminatory access to
grids and gas infrastructure. Several countries have regulations which give APG preferential rights with
respect to pipeline/grid access. Most recently Russia imposed such a reform through amendment to the
law “On gas supply of the Russian Federation” (see Section 2.1). Other examples of supportive policies
applied in several countries are tax relief and investment grants in cases where the APG investments are
clearly uneconomic. Such measures becomes more and more important as countries progress to higher
APG utilization rates and remaining flare reductions become costly and difficult to achieve.
4.3 New technologies and commercial approaches
4.3.1 Partnerships
Given that important challenges remain for projects that at the outset do not benefit from economies-of-
scale there will be an important role to play for political and regulatory authorities; and the focus will have
to be on non-prescriptive approaches. The great variances in the economic attractiveness of APG
utilization investments call for flexibility on the hands of regulatory authorities and innovative commercial
solutions from companies. The small and medium size projects may be commercially unattractive as
standalone projects pursued by an oil producer, but can become viable through a productive partnership
involving companies with different expertise and willingness to take on project risks.
Figure 32: Partnerships for APG investments
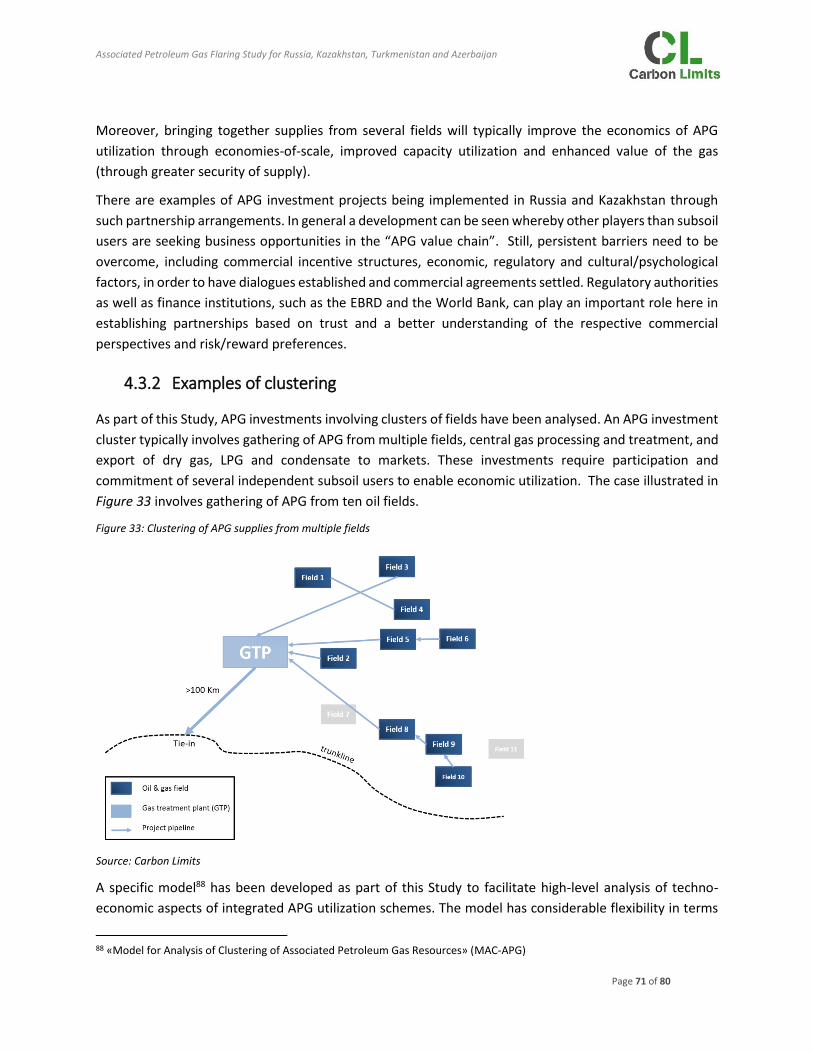
Associated Petroleum Gas Flaring Study for Russia, Kazakhstan, Turkmenistan and Azerbaijan
Page 71 of 80
Moreover, bringing together supplies from several fields will typically improve the economics of APG
utilization through economies-of-scale, improved capacity utilization and enhanced value of the gas
(through greater security of supply).
There are examples of APG investment projects being implemented in Russia and Kazakhstan through
such partnership arrangements. In general a development can be seen whereby other players than subsoil
users are seeking business opportunities in the “APG value chain”. Still, persistent barriers need to be
overcome, including commercial incentive structures, economic, regulatory and cultural/psychological
factors, in order to have dialogues established and commercial agreements settled. Regulatory authorities
as well as finance institutions, such as the EBRD and the World Bank, can play an important role here in
establishing partnerships based on trust and a better understanding of the respective commercial
perspectives and risk/reward preferences.
4.3.2 Examples of clustering
As part of this Study, APG investments involving clusters of fields have been analysed. An APG investment
cluster typically involves gathering of APG from multiple fields, central gas processing and treatment, and
export of dry gas, LPG and condensate to markets. These investments require participation and
commitment of several independent subsoil users to enable economic utilization. The case illustrated in
Figure 33 involves gathering of APG from ten oil fields.
A specific model88 has been developed as part of this Study to facilitate high-level analysis of techno-
economic aspects of integrated APG utilization schemes. The model has considerable flexibility in terms
88 «Model for Analysis of Clustering of Associated Petroleum Gas Resources» (MAC-APG)
Figure 33: Clustering of APG supplies from multiple fields
Source: Carbon Limits

Associated Petroleum Gas Flaring Study for Russia, Kazakhstan, Turkmenistan and Azerbaijan
Page 72 of 80
of adjustment to various physical and commercial/institutional configurations of a cluster. Using this
model, cases of clustering have been studied through the following steps:
1. Determination of physical project boundaries of a cluster and the institutions involved
2. Assessing the overall economic result of the investment
3. Identification of separate development stages and required sub-investments
4. Gathering of high quality input data from relevant potential investments partners
5. Techno-economic modeling of different sub-investments, including analysis of possible net-back
values and transaction prices for gas deliveries
6. Assessing sensitivities and risks of the sub-investments and the total cluster investments
In one specific case studied in Kazakhstan with APG supplies initially planned from three fields (one subsoil
user) the internal rate of return on the project was 12% but improved to 18% when four more fields were
included (involving further three subsoil users). In this case subsoil users, processing plant owners and a
pipeline company would take part in the investments, and the challenge would be to agree on terms for
delivery along the value chain of the gas. Typically there are risks upstream related to the total volume
and profile of APG production and downstream due to uncertain medium and long term value of the gas
in various market segments. How these risks are shared between the different players in a clustered
investment is inevitably closely linked to the regulatory regime and what can be expected in terms of
regulations and gas policies in the future. For clustering of investments to work therefore, activity
participation for regulatory and political authorities is an essential factor.
Small scale gas to liquids
Gas to liquids89, through the development of small and medium scale applications have increasingly
attracted attention as APG utilization options. Technology costs have come down and international
manufacturers, and in the case of Russia a few domestic companies, are pursuing business opportunities.
No full-scale investments have yet been implemented but many companies are seriously considering
investments and a few pilot schemes are under way. The rational for gas to liquids for APG is becoming
more interesting as more of the stranded APG will be in remote small and medium size fields (high local
value of liquids relative to gas, transportability, small and medium scale solutions with modular design).
The most important factor for the financial viability of GTL is the price differential between the liquids and
gas, which has increased substantially in recent years. As the analysis of this Study shows the economics
of gas to liquids based on “normal market prices” are often marginal, but local prices for liquids may are
often high for logistical, political or other reasons and hence can justify investments even without
regulatory measures.
Still, it will most likely take time for this technology to become an important part of APG investments. No
full scale projects have been developed in the target countries and technology risks are real and hence a
barrier. As noted above, political authorities, regulators can play a role in bringing together various
industrial partners, and possibly also clustering APG sources, so as to find viable investment solutions with
89 Including both the traditional «Fischer-Tropsch» gas-to-liquids and “gas-to-chemicals” (see Chapter 3).

Associated Petroleum Gas Flaring Study for Russia, Kazakhstan, Turkmenistan and Azerbaijan
Page 73 of 80
acceptable allocation of risks and rewards among commercial partners. The EBRD and GGFR may also be
able to play a role as facilitators. There are signs of broader partnership arrangements being discussed in
Russia and with technology providers and downstream market operators engaging in the commercial/risk
taking part of such investments.
4.4 Capital requirements for APG utilization investments
Considerable financial resources are needed both to reduce existing flares and to avoid or minimize flaring
from new production sites. High-level estimates made as part of this Study indicate that some USD 23
billion may be needed in APG utilization investments in Russia till 2020, of which 2/3 are for new field
developments and 1/3 is to bring to existing APG production to a utilization rate of 95%.
Size of site in BCM/year potentially flared
< 0.05 BCM 0.05 - 0.1 BCM 0.1 - 0.5 BCM > 0.5 BCM All
Existing/old flares 1.3 2.1 3.5 0.5 7.5
New fields/sites 0.8 4.5 8.2 1.9 15.5
Total 2.1 6.6 11.8 2.4 22.9
The estimates of investments required to establish infrastructure to meet APG utilization targets for
existing and new production sites by 2020 are uncertain and qualitative by nature. Estimates are based
on a large number of assumptions, including the development of Russian oil production, the share of total
APG production in 2020 from new developments, the effects of projects under implementation at existing
flare sites, the “remoteness” of existing and new APG production sites and new infrastructure (GPPs and
GTPPs), the required installed capacity relative to actual APG recovery, the cost synergies associated with
designing integrated APG solutions for new developments, the size distribution of APG volumes to be
recovered at existing and new production sites, the optimal technology mix to utilize gas from existing
and new production sites and the unit cost of new infrastructure to utilize APG using alternative
technologies at different scales. The estimates presented in this report are made for an assumed mix of
technological solutions that take into account locations of APG volumes in 2020 and the size distribution
of these APG sources. These technologies would yield products with different market values (ranging from
unprocessed APG delivered to GPPs to diesel produced using GTL technologies). In general, capital
intensive utilization options generally yield products that would attract higher values in the market. The
market value of the products resulting from the estimated capital investments have not been estimated
in this study.
The estimates only provide an indication of the magnitude of the required investment funds.
Figure 34 presents a breakdown of the estimated capital requirements for minimizing flaring at small flare
sites (< 0.1 BCM/year) till 2020, while Figure 35 shows a similar breakdown for medium and large flare
sites.
Table 6: Estimated capital expenditures for APG investments in the target countries in Billion USD
Source: Carbon Limits analysis
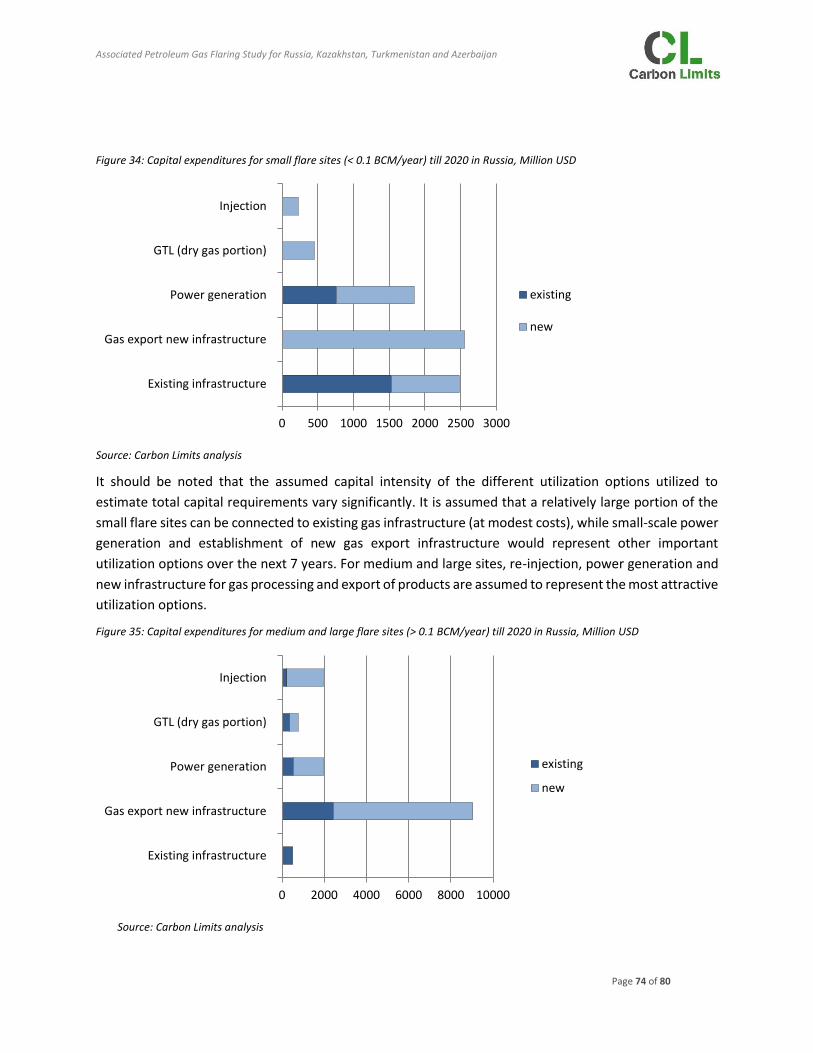
Associated Petroleum Gas Flaring Study for Russia, Kazakhstan, Turkmenistan and Azerbaijan
Page 74 of 80
It should be noted that the assumed capital intensity of the different utilization options utilized to
estimate total capital requirements vary significantly. It is assumed that a relatively large portion of the
small flare sites can be connected to existing gas infrastructure (at modest costs), while small-scale power
generation and establishment of new gas export infrastructure would represent other important
utilization options over the next 7 years. For medium and large sites, re-injection, power generation and
new infrastructure for gas processing and export of products are assumed to represent the most attractive
utilization options.
0 500 1000 1500 2000 2500 3000
Existing infrastructure
Gas export new infrastructure
Power generation
GTL (dry gas portion)
Injection
existing
new
0 2000 4000 6000 8000 10000
Existing infrastructure
Gas export new infrastructure
Power generation
GTL (dry gas portion)
Injection
existing
new
Figure 34: Capital expenditures for small flare sites (< 0.1 BCM/year) till 2020 in Russia, Million USD
Source: Carbon Limits analysis
Figure 35: Capital expenditures for medium and large flare sites (> 0.1 BCM/year) till 2020 in Russia, Million USD
Source: Carbon Limits analysis

Associated Petroleum Gas Flaring Study for Russia, Kazakhstan, Turkmenistan and Azerbaijan
Page 75 of 80
4.5 Optimization of gas utilization rates
The Study has had as one of the objectives to identify bankable investment projects within the four target
countries, and the focus of this Report has thus been on investments in infrastructure (including
processing capacity) to recover and utilize APG to reduce continuous production flaring. However, even
when infrastructure to facilitate recovery of APG has been successfully established, non-negligible
volumes of gas may still be flared during oil and gas operations due to a variety of reasons (e.g. during
maintenance or unexpected shutdown of an installation). Such flaring may account for a significant
portion of APG production, and potential measures to minimize operational flaring are briefly presented
below.
To minimize flaring, operators must develop a detailed understanding of the causes for the operational
flaring. Figure 36 shows common causes of operational flaring, divided into two groups:
Continuous flaring, which covers the flaring which take place during normal operations90. It
includes the gas from both the pilots and the purge gas, but also other continuous sources of
gas like produced water degasing or seal gas.
Intermittent flaring, which includes flaring due to maintenance, emergency shutdown, technical
failures, etc.
For each of the causes of flaring, potential options to minimize the flare volumes have been listed. These
options include some investment options, but also process measures. All measures listed in Figure 36
are based on mature technologies.
Optimizing the APG utilization rate require a continuous process, comprising a number of optimization
steps which together can result in utilisation rates above 95% or 98%91. Systematic recording of the root-
causes of gas flaring in an installation is central to identify the site specific cost effective measures to
minimize gas flaring:
For continuous flaring, pilot gas consumption and purge gas emissions can be reduced through
the implementation of purge reduction devices or the optimisation on the pilots used. . Further
reductions can be achieved through installation of a Flare Gas Recovery Unit. It is located
upstream of the flare to capture some or all of the waste gases and compress them to inject them
into the gas line. A Flare Gas Recovery Unit can be installed on both high-pressure and low-
pressure flares and presents the advantage of reducing up to 100% of the continuous flaring92.
However, the costs and the benefit of this measure vary depending on the local circumstances.
For intermittent flaring, we can distinguish between two categories of measures: i) improvement
in the regularity of operations, and ii) improvements in operational procedures. The first category
may typically include installation of spare capacity for gas injection and/or export, online washing
of gas compressors and turbines to reduce the maintenance and integrating power supply
between production units to improve the overall reliability. Often these are win-win options and
90 When primary gas utilisation routes are established to avoid production flaring. 91 Yearly average including routine and non-routine flaring. 92 If used in combination with a flare ignition system.

Associated Petroleum Gas Flaring Study for Russia, Kazakhstan, Turkmenistan and Azerbaijan
Page 76 of 80
are commonly pursued by operators. The second group of measures includes measures not
entailing large investments, but focuses rather on improving operational procedures. Examples
are planning of maintenance depending on the seasons and other related activities, the training
of personnel to improve awareness of the operators on flare reduction. These measures are
relatively cheap to implement and have variable impact on the volume of gas flared.
Though many of these measures provides some co-benefits (in terms of reliability for example),
regulations plays an important role in encouraging continuous improvement to keep the flaring as low as
possible.
Figure 36: Causes of operational flaring and potential measures for reduction

Associated Petroleum Gas Flaring Study for Russia, Kazakhstan, Turkmenistan and Azerbaijan
Page 77 of 80
4.6 Concluding remarks
The project team believes that due to corporate standards and policies and regulatory pressures oil
companies will continue and possibly step up their efforts to reduce and avoid flaring of associated gas.
Priority will be given to medium and large projects (greater than 0.1 BCM per annum). National political
and regulatory authorities have an important role to play in spurring investments in smaller size projects.
Given the great variability in the financial viability of small and medium size APG utilization investments,
regulations should be flexible both with respect to the application of the “carrot and stick” and with the
timing of flare reduction targets. Further, active steps should be taken in preparing the ground for new
and innovative commercial approaches to tackling of the flaring challenges. Clustering of APG supplies
into a centralized gas infrastructure may in many cases be the only option for financially viable
investments. Small scale technologies (such as GTL) are becoming interesting options for stranded
associated gas in remote small and medium size fields. In such cases, also, several commercial actors may
be involved (e.g. technology providers, gas processing companies, downstream fuel suppliers, finance
institution) and they may be interested in taking on commercial risks that traditionally have been carried
by oil companies. Again, political authorities, regulators and institutions such as the EBRD can play a role
in bringing together various industrial partners enabling clustering of associated gas sources, so as to find
viable investment solutions with acceptable allocation of risks and rewards among commercial partners.

Associated Petroleum Gas Flaring Study for Russia, Kazakhstan, Turkmenistan and Azerbaijan
Page 78 of 80
Glossary
ACG: Azeri–Chirag–Guneshli APG: Associated Produced Gas API: American Petroleum Institute BarG: Gauge pressure bbl: Barrel BCM: Billion Cubic Meters BCMA: Billion Cubic Meters per year BP: British Petroleum company C2H6: Ethane CAC: Central Asia Centre CAPEX: Capital Expenditure CDM: Clean Development Mechanism CDU TEK: Central Dispatch Office of the Russian Fuel and Energy Industry CES: Common Economic Space CH4: methane CHP: Combined Heat Power CIS: Commonwealth of Independent States CNG: Compressed Natural Gas CNPC: China National Petroleum Corporation CO: Carbon Oxide CO2: Carbon dioxide DME: dimethyl ether DSG: Dry Stripped Gas EBRD: European Bank for Reconstruction and Dvelopment EOR: Enhanced Oil Recovery EU: European Union FEED: Front End Engineering Design GGFR: Global Gas Flaring Reduction Partnership GIS: Geographic Information System GOR: Gas to Oil Ratio GPP: Gas Processing Plant GTC: Gas to Chemichal GTF: Gas-To-Fuel GTG. Gas-To-Gasoline GTL: Gas-To-Liquid GTPP: Gas Turbine Power Plant H2S: Hydrogen Sulphide HC: Hydrocarbon IEA: International Energy Agency INPEX: INternational PEtroleum EXploration Corporation IRR: Internal Rate of Return JI: Joint Implementation JSC: Joint-Stock Company KZT: Tenge Kazakh (currency of Kazakhstan) LLP: Limited Liability Partnership

Associated Petroleum Gas Flaring Study for Russia, Kazakhstan, Turkmenistan and Azerbaijan
Page 79 of 80
LNG: Liquefied natural Gas LPG: Liquefied Petroleum Gas MoU: Memorandum of Understanding MTBE: Methyl Tertiary Butyl Ether NGL: Natural Gas Liquid NOAA: National Oceanic and Atmospheric Administration OPEX: Operational Expenditure PSA: Production Sharing Agreement RUB: Russian Ruble SEI: Sustainable Energy Initiative SNG: Synthetic Natural Gas SOCAR: State Oil Company of Azerbaijan Republic SOL: Sum Of the Light intensity TAPI:Turkmenistan-Afghanistan-Pakistan-India UGSS: Unified Gas Supply System USA: United States of America USD: US Dollar WWF: World Wildlife Fund
Units
USD RUB KZT EUR Barrel (bbl) million (M) Cubic meter (m3) Billion cubic meters (BCM) Bar gauge (barG) Degree Celsius (0C)

Associated Petroleum Gas Flaring Study for Russia, Kazakhstan, Turkmenistan and Azerbaijan
Page 80 of 80
This page intentionally left blank