association between mould/dampness in the home and health status of the inhabitants p. rudnai 1,...
TRANSCRIPT

Association Between Mould/Dampness in the Home and Health Status of the Inhabitants
P. Rudnai1, M.J.Varró1, T. Málnási1, A. Páldy1, S. Nicol2, A. O’Dell2, M. Braubach3, X. Bonnefoy3
1National Institute of Environmental Health, Hungary
2Building Research Establishment, United Kingdom
3WHO ECEH Bonn Office
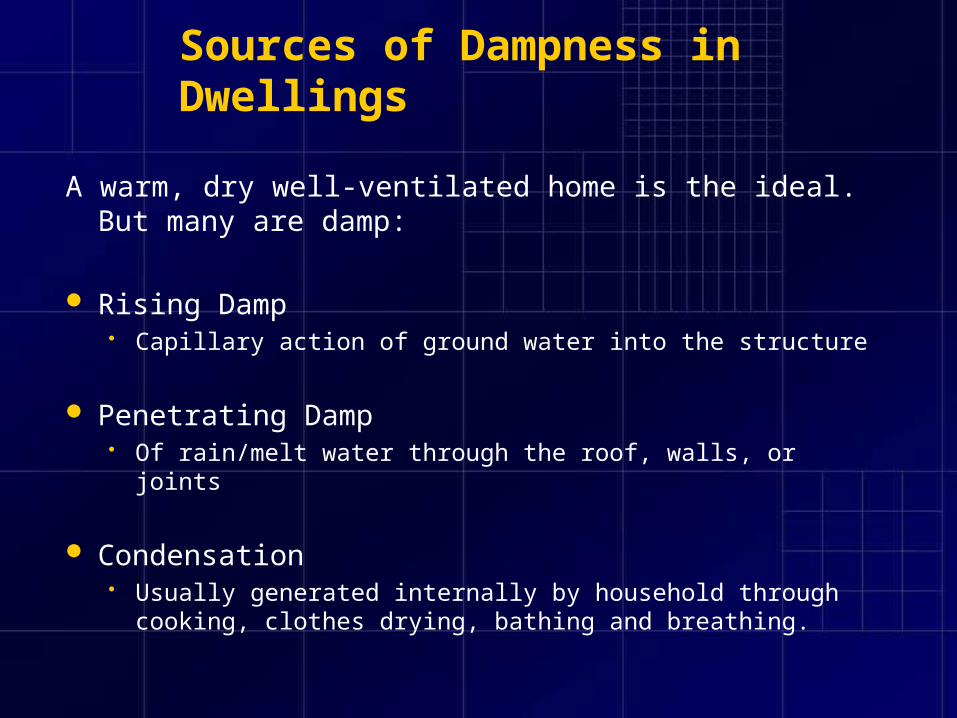
Sources of Dampness in Dwellings
A warm, dry well-ventilated home is the ideal. But many are damp:
Rising Damp Capillary action of ground water into the structure
Penetrating Damp Of rain/melt water through the roof, walls, or joints
Condensation Usually generated internally by household through cooking, clothes drying,
bathing and breathing.
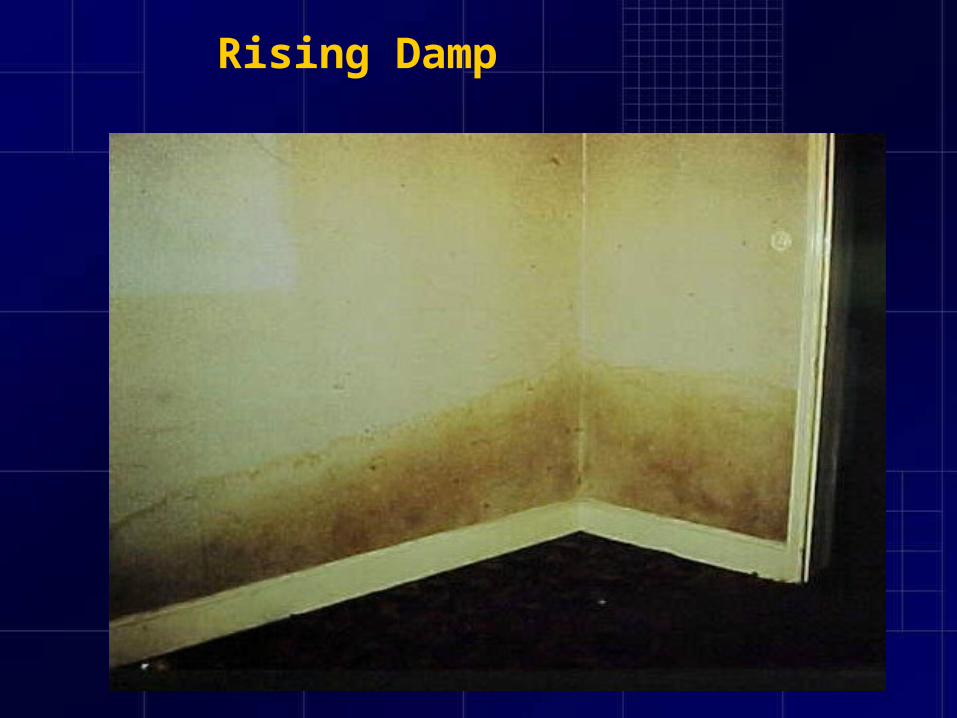
Rising Damp
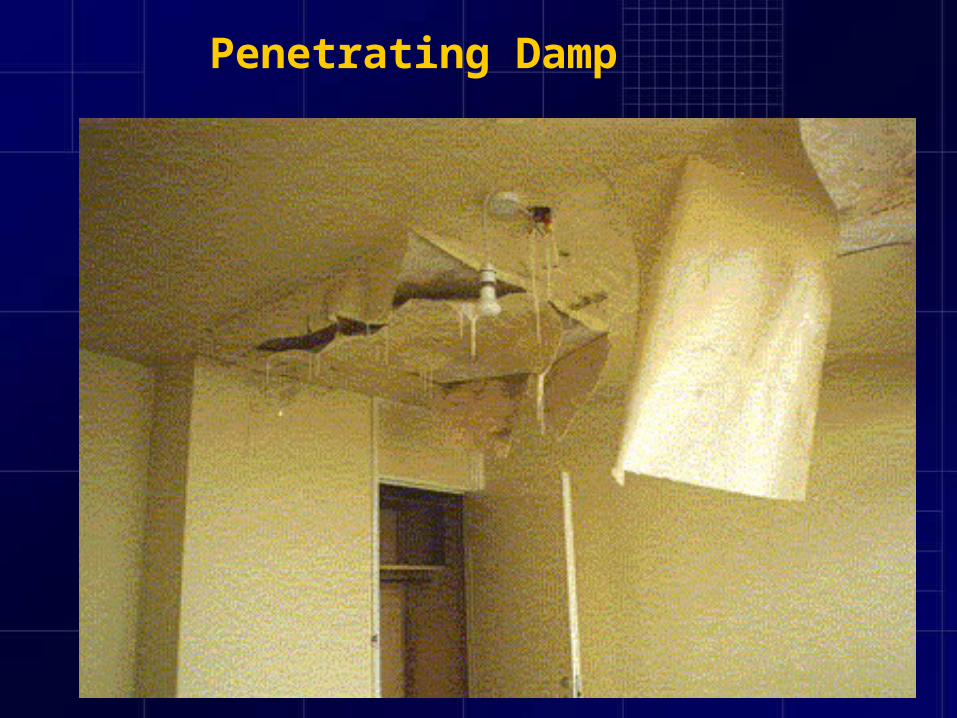
Penetrating Damp

Serious Condensation

THE „LARES” STUDY (2002-03) Angers 880 Bonn 946 Bratislava 892 Budapest 1086 Ferreira 1055 Forli 1157 Geneva 710 Vilnius 1793
Altogether 8519 persons interviewed
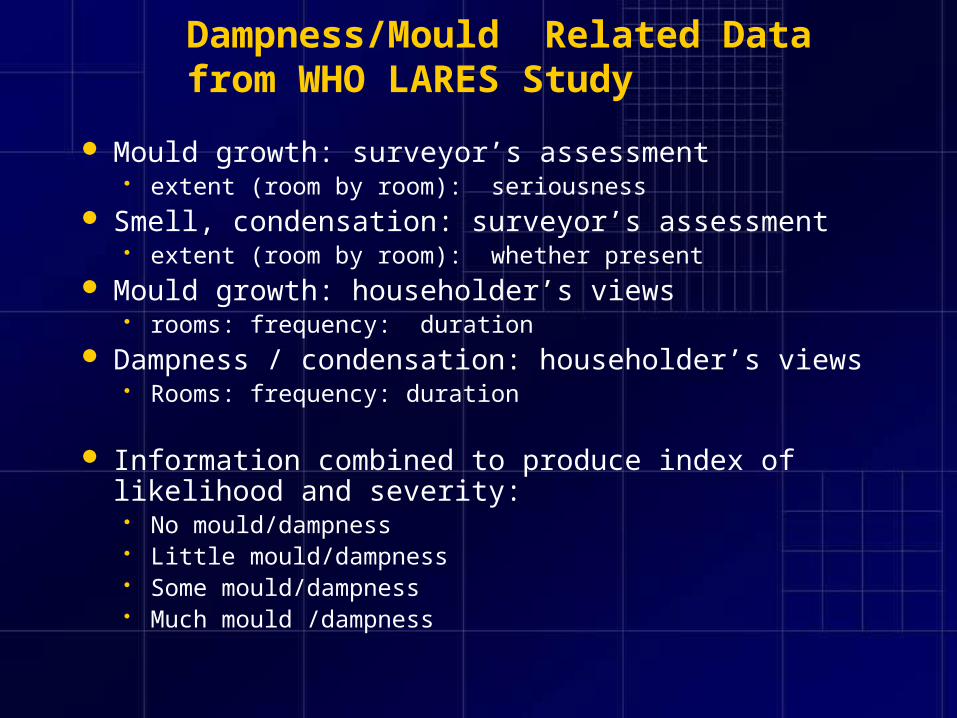
Dampness/Mould Related Data from WHO LARES Study
Mould growth: surveyor’s assessment extent (room by room): seriousness
Smell, condensation: surveyor’s assessment extent (room by room): whether present
Mould growth: householder’s views rooms: frequency: duration
Dampness / condensation: householder’s views Rooms: frequency: duration
Information combined to produce index of likelihood and severity: No mould/dampness Little mould/dampness Some mould/dampness Much mould /dampness
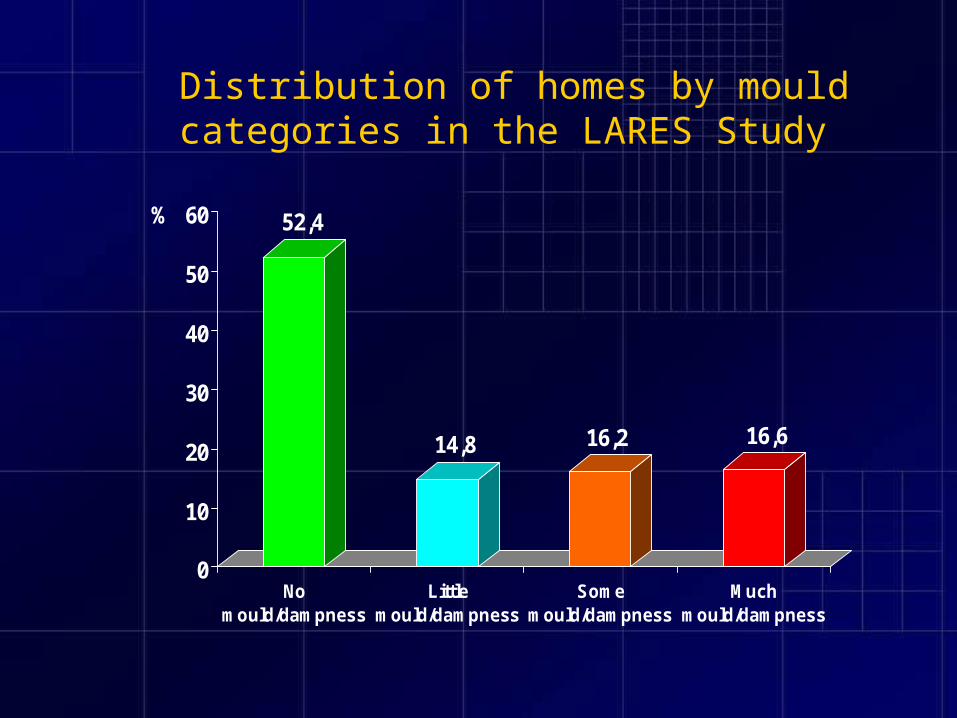
Distribution of homes by mould categories in the LARES Study
52,4
14,8 16,2 16,6
0
10
20
30
40
50
60%
Nomould/dampness
Littlemould/dampness
Somemould/dampness
Muchmould/dampness

‘Much mould / dampness’ by LARES cities
0,00 5,00 10,00 15,00 20,00 25,00 30,00 35,00 40,00 45,00 50,00
Angers
Bonn
Bratislava
Budapest
Ferreira
Forli
Geneva
Vilnius
Total
City
Percentage
Explanation for dampness
Wide variation in dampness between 8 LARES cities
Main factors: Disrepair, lack of central heating, home perceived as cold in winter.
These factors are good predictors of dampness in each city
Model predicts Geneva as best, Ferreira as worst, and most in-between.
‘City’ is still a factor.
The Relationship Between Illness and Dampness
Relationship explored by plotting persons affected by the different illnesses against the damp/mould index
Criterion for an association: Doctor diagnosed diseases and symptoms Significant association, using tabulation and logistic regression
(bi and multi-variant) using STATA 7.0 program.
Evidence of a dose effect
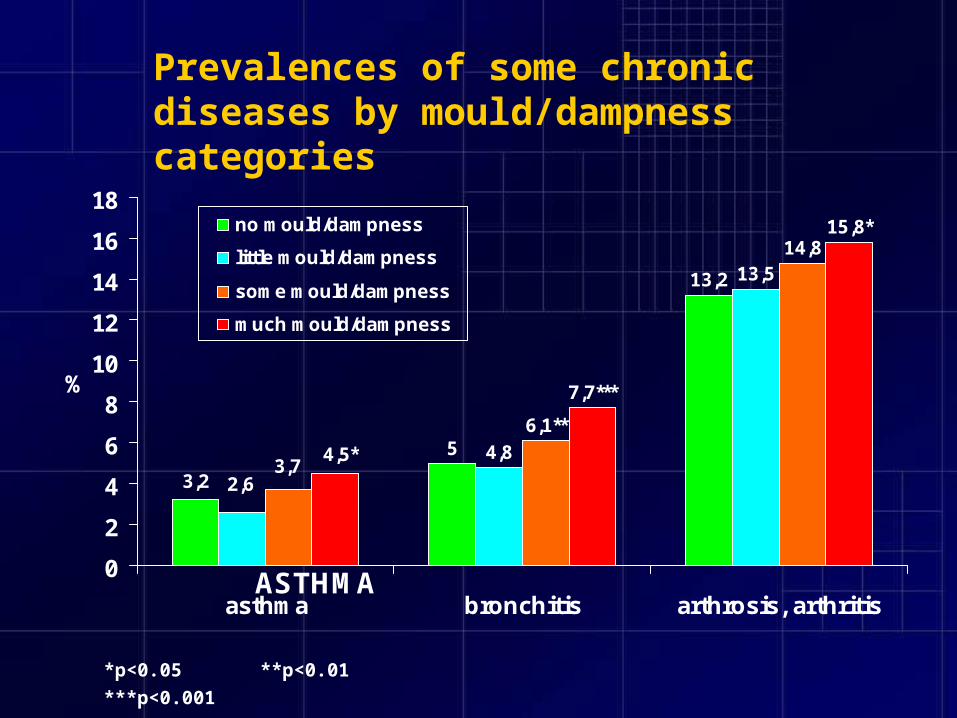
Prevalences of some chronic diseases by mould/dampness categories
5
13,2
4,8
13,514,8
3,2 2,6
6,1**
3,7
15,8*
7,7***
4,5*
0
2
4
6
8
10
12
14
16
18
asthma bronchitis arthrosis, arthritis
%
no mould/dampness
little mould/dampness
some mould/dampness
much mould/dampness
ASTHMA
*p<0.05 **p<0.01 ***p<0.001

Prevalences of some chronic diseases by mould/dampness categories
4,6
6,4
13,8
8,6**
18,1***
6*
11,2***
19,4***
6,9**
14,2***
23***
9,6***
0
5
10
15
20
25
Anxiety anddepression
Depression (Salsa) Migraine
%
no mould/dampness
little mould/dampness
some mould/dampness
much mould/dampness
*p<0.05 **p<0.01 ***p<0.001
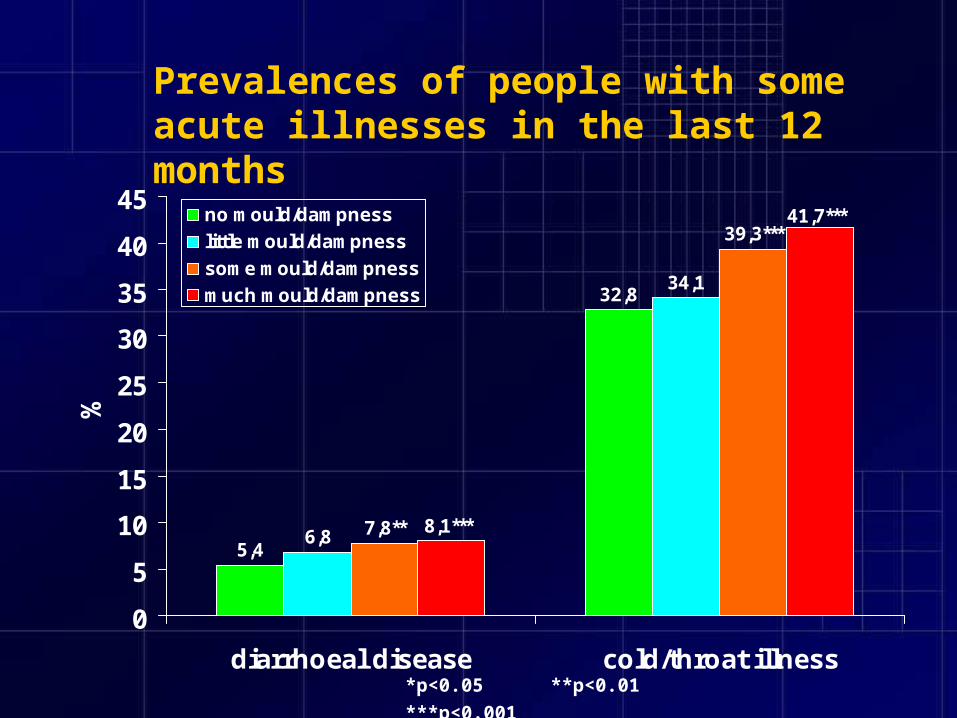
Prevalences of people with some acute illnesses in the last 12 months
5,4
32,8
6,8
34,1
7,8**
39,3***
8,1***
41,7***
0
5
10
15
20
25
30
35
40
45
diarrhoeal disease cold/throat illness
%
no mould/dampness
little mould/dampness
some mould/dampness
much mould/dampness
*p<0.05 **p<0.01 ***p<0.001

Prevalences of some symptoms during the last 12 months by mould/dampness categories
1,4
5,3
8,27,6
5,3
1,1
6,57,1*
10* 10,3**
8,6**
11,9*** 11,2***
7,6**
2,5**
11,9***
13,8***
15,5***
8,1***
2,7***
0
2
4
6
8
10
12
14
16
18
astma attack wheeze eczema wateryeyes/eye
inflammation
headache
%
no mould/dampness
Little mould/dampness
some mould/dampness
much mould/dampness
*p<0.05 **p<0.01 ***p<0.001
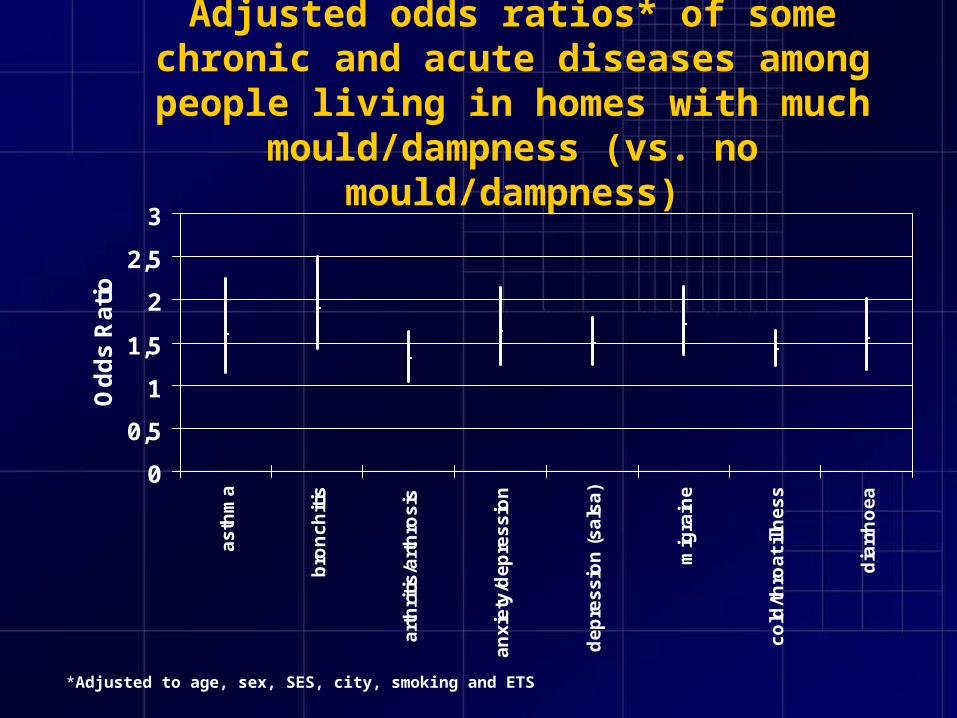
Adjusted odds ratios* of some chronic and acute diseases among people living in homes with much
mould/dampness (vs. no mould/dampness)
0
0,5
1
1,5
2
2,5
3a
sth
ma
bro
nc
hit
is
art
hri
tis
/art
hro
sis
an
xie
ty/d
ep
res
sio
n
de
pre
ss
ion
(s
als
a)
mig
rain
e
co
ld/t
hro
at
illn
es
s
dia
rrh
oe
a
Od
ds
Ra
tio
*Adjusted to age, sex, SES, city, smoking and ETS

Adjusted odds ratios* of the prevalence of some symptoms in the last 12 months among people living in homes with much
mould/dampness (vs. no mould/dampness)
0
0,5
1
1,5
2
2,5
3
3,5
4
asthma attack wheeze eczema conjunctivitis headache
Od
ds
Rat
io
*Adjusted to age, sex, SES, city, smoking and ETS
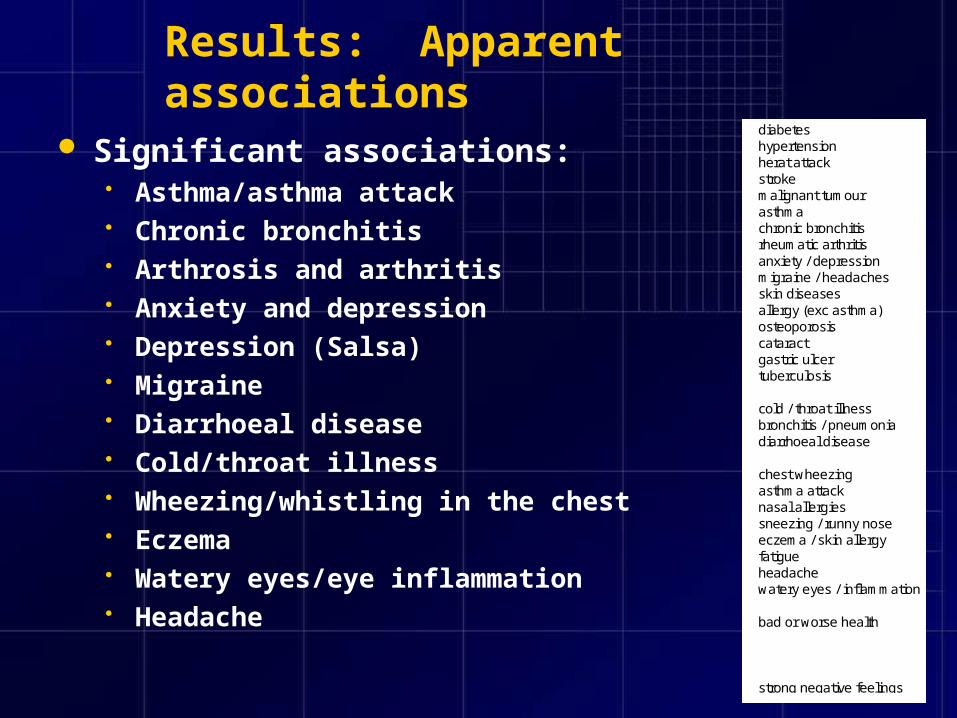
Results: Apparent associations
Significant associations: Asthma/asthma attack Chronic bronchitis Arthrosis and arthritis Anxiety and depression Depression (Salsa) Migraine Diarrhoeal disease Cold/throat illness Wheezing/whistling in the chest Eczema Watery eyes/eye inflammation Headache
diabeteshypertensionherat attackstrokemalignant tumourasthmachronic bronchitisrheumatic arthritisanxiety / depressionmigraine / headachesskin diseasesallergy (exc asthma)osteoporosiscataractgastric ulcertuberculosis
cold / throat illnessbronchitis / pneumoniadiarrhoeal disease
chest wheezingasthma attacknasal allergiessneezing / runny noseeczema / skin allergyfatigueheadachewatery eyes / inflammation
bad or worse health
strong negative feelings
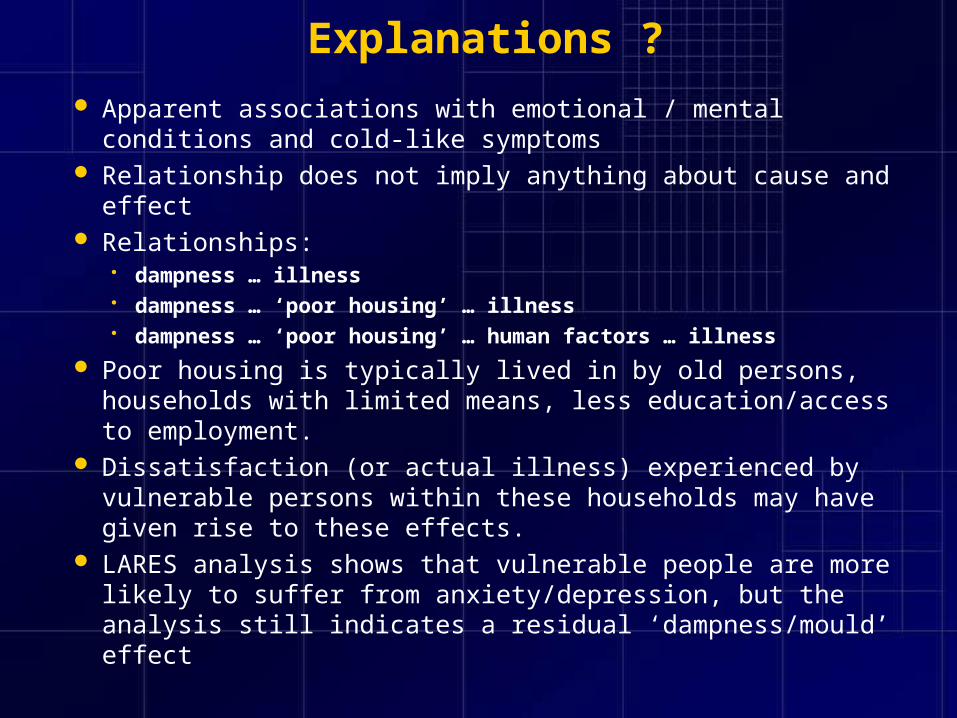
Explanations ?
Apparent associations with emotional / mental conditions and cold-like symptoms
Relationship does not imply anything about cause and effect Relationships:
dampness … illness dampness … ‘poor housing’ … illness dampness … ‘poor housing’ … human factors … illness
Poor housing is typically lived in by old persons, households with limited means, less education/access to employment.
Dissatisfaction (or actual illness) experienced by vulnerable persons within these households may have given rise to these effects.
LARES analysis shows that vulnerable people are more likely to suffer from anxiety/depression, but the analysis still indicates a residual ‘dampness/mould’ effect

Conclusions
LARES contains reasonable measures of dampness consistency between household / surveyor views and mould /
dampness
Dampness is a significant problem, although considerable city-to-city variations partially explainable some ‘city’ component remaining
Dampness / illness findings consistent with other studies, although difficult to quantify due to small sample sizes
‘Definite’ relationships: emotional / mental conditions and ‘cold-like’ symptoms - others not ruled out ‘poor housing’ and human factors may mediate LARES supports the view that people with poor health and negative
well being are more likely to live in poor housing.

Thank you for Thank you for
your attentionyour attention

Recommendations for Governments/Agencies
Governments have a responsibility to remove/reduce risk of dampness:
Sample house condition surveys – to measure and monitor the effect of dampness (and housing conditions generally)
Guidance for home owners/landlords on identifying and rectifying damp/mould.
Consider grants to improve homes of those who cannot afford work Building regulations should prevent dampness and the proliferation
of indoor allergens in new homes Education for households on the risks of living in damp/mouldy
homes and reducing humidity/condensation. Money spent on prevention will save lives/money