association law fall forum xi surface transportation board
TRANSCRIPT

Determining Revenues Adequate to Maintain and Improve Service and Capacity
Association of Transportation Law ProfessionalsFall Forum XI
Surface Transportation Board, Washington, D.C.November 10, 2014
Robert D. Rosenberg Timothy J. StraffordSlover & Loftus LLP Association of American
Railroads
1

Overview
• Overall topic is determining revenues adequate to maintain and improve service and capacity
• Embraces 2 proceedings pending at the STB– Cost of Capital, EP 624 (Sub‐No. 2)– Revenue Adequacy, EP 722
• Historical, statutory, regulatory, procedural, and policy overview
• Review of key concepts and areas of engagement
2

Cost and Adequacy of Capital are Important Concepts
• Railroading is capital‐intensive• Risk that railroads will shrink or even collapse if deprived of capital or if cost of capital is set too low to attract and retain investment, or if there is excessive regulation of rates
• Related risk that setting the cost of capital too high, or ignoring overall returns, will translate into excessive rates at the expense of captive shippers and cause misallocation of societal resources
• Challenge of mix of competitive and captive traffic• As with many regulatory/policy matters, objective is to strike a reasonable, healthy balance
3

Regulatory Significance
• Cost of capital is significant for determining variable costs, jurisdictional threshold, stand‐alone costs, revenue adequacy, and abandonments
• Annual determination of cost of capital in EP 558• Annual determination of revenue adequacy in EP 552 as required by statute, 49 USC 10704(a)(3)
• Revenue Adequacy is one of the four prongs of constrained market pricing under Coal Rate Guidelines
• Revenue Adequacy constraint not developed or applied as a separate constraint with one pipeline exception, but informs part of stand‐alone costs
4

49 USC 10704(a)(2)
“The Board shall maintain and revise as necessary standards and procedures for establishing revenue levels for rail carriers providing transportation subject to its jurisdiction under this part that are adequate, under honest, economical, and efficient management, to cover total operating expenses, including depreciation and obsolescence, plus a reasonable and economic profit or return (or both) on capital employed in the business.”
5

49 USC 10704(a)(2), cont’d
“Revenue levels established under this paragraph should—
(A) provide a flow of net income plus depreciation adequate to support prudent capital outlays, assure the repayment of a reasonable level of debt, permit the raising of needed equity capital, and cover the effects of inflation; and (B) attract and retain capital in amounts adequate to provide a sound transportation system in the United States.”
6

Revenue Adequacy‐‐The Very Old Days
• The statutory language dates from the 4‐R Act of 1976, so has accumulated some history
• Until the early 1980s, the ICC used a multi‐factor test for annual revenue adequacy determination
• Comparison of net return on investment to cost of capital was one factor, along with flow of funds and various financial ratios
• In 1978, applying earlier multi‐factor test, 11 of 31 Class I railroads were found to be revenue adequate
7
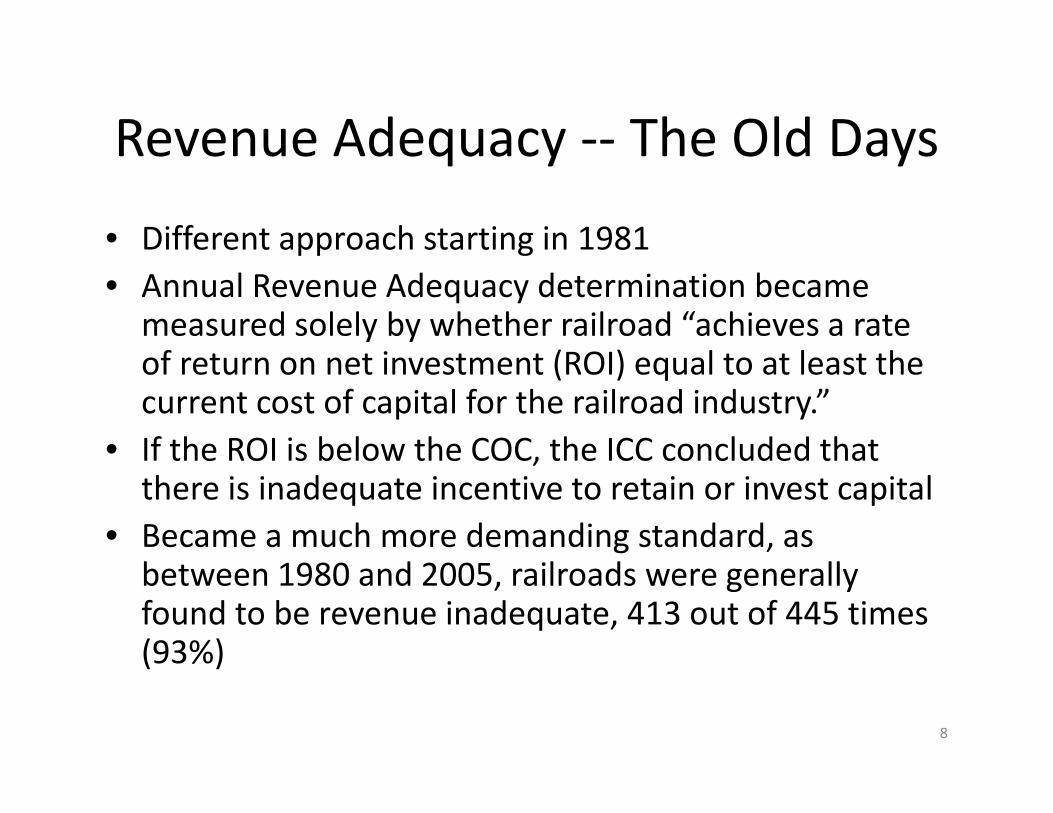
Revenue Adequacy ‐‐ The Old Days
• Different approach starting in 1981• Annual Revenue Adequacy determination became measured solely by whether railroad “achieves a rate of return on net investment (ROI) equal to at least the current cost of capital for the railroad industry.”
• If the ROI is below the COC, the ICC concluded that there is inadequate incentive to retain or invest capital
• Became a much more demanding standard, as between 1980 and 2005, railroads were generally found to be revenue inadequate, 413 out of 445 times (93%)
8

Railroad Financial Health Has Improved
• Burlington Northern acquired El Paso pipeline for $600 million in 1983
• CSX acquired Texas Gas Resources for $1.8 billion, also in 1983
• AAR touted the 1990s as the “Second Golden Age of Railroading,” with record profits and mergers
• In the 1990s, BN acquired ATSF for $4.1 billion, UP acquired SP for $4.1 billion, and CSX and NS acquired Conrail for $10 billion
• Berkshire Hathaway acquired BNSF in 2010 for $34 billion, 31% over market value
9

To Cost of Capital
• Capital consists of equity and debt, but equity has been 70%‐80%+ of total railroad capital and is the more expensive portion of weighted averaged cost of capital (WACC)
• The focus is on the opportunity cost of capital, what return is needed in order to attract or retain equity investment
• Investors make decisions based on expected returns
• Cost of Equity (COE) cannot be measured directly, even after the fact, and can only be inferred
10

Cost of Capital, cont’d
• “Inferred” requires using models• Models have simplifying assumptions and require selection of inputs
• Selection invites disagreement• Cost of equity and related matters involve corporate finance
• Corporate finance is an active, complicated area, often associated with economic turmoil, and sometimes resulting in Nobel Prizes
11
Discounted Cash Flow (DCF) Model
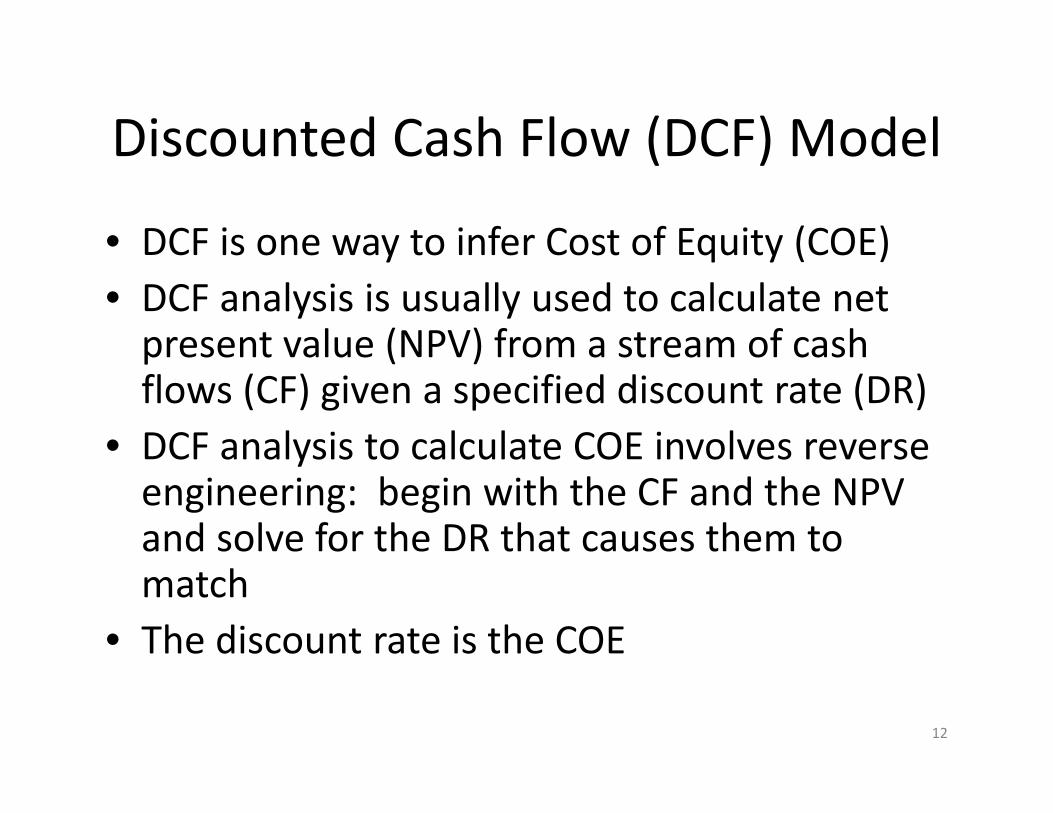
• DCF is one way to infer Cost of Equity (COE)• DCF analysis is usually used to calculate net present value (NPV) from a stream of cash flows (CF) given a specified discount rate (DR)
• DCF analysis to calculate COE involves reverse engineering: begin with the CF and the NPV and solve for the DR that causes them to match
• The discount rate is the COE
12
DCF Model, cont’d
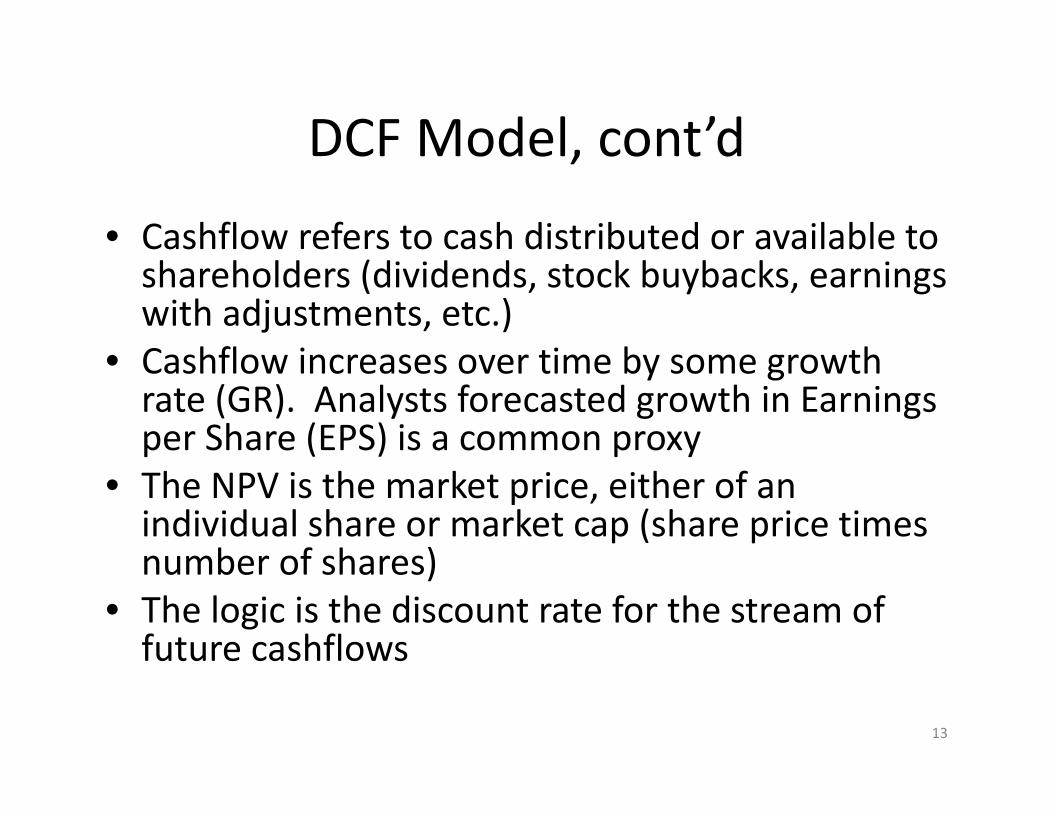
• Cashflow refers to cash distributed or available to shareholders (dividends, stock buybacks, earnings with adjustments, etc.)
• Cashflow increases over time by some growth rate (GR). Analysts forecasted growth in Earnings per Share (EPS) is a common proxy
• The NPV is the market price, either of an individual share or market cap (share price times number of shares)
• The logic is the discount rate for the stream of future cashflows
13
Single‐Stage DCF Model (SSDCF)
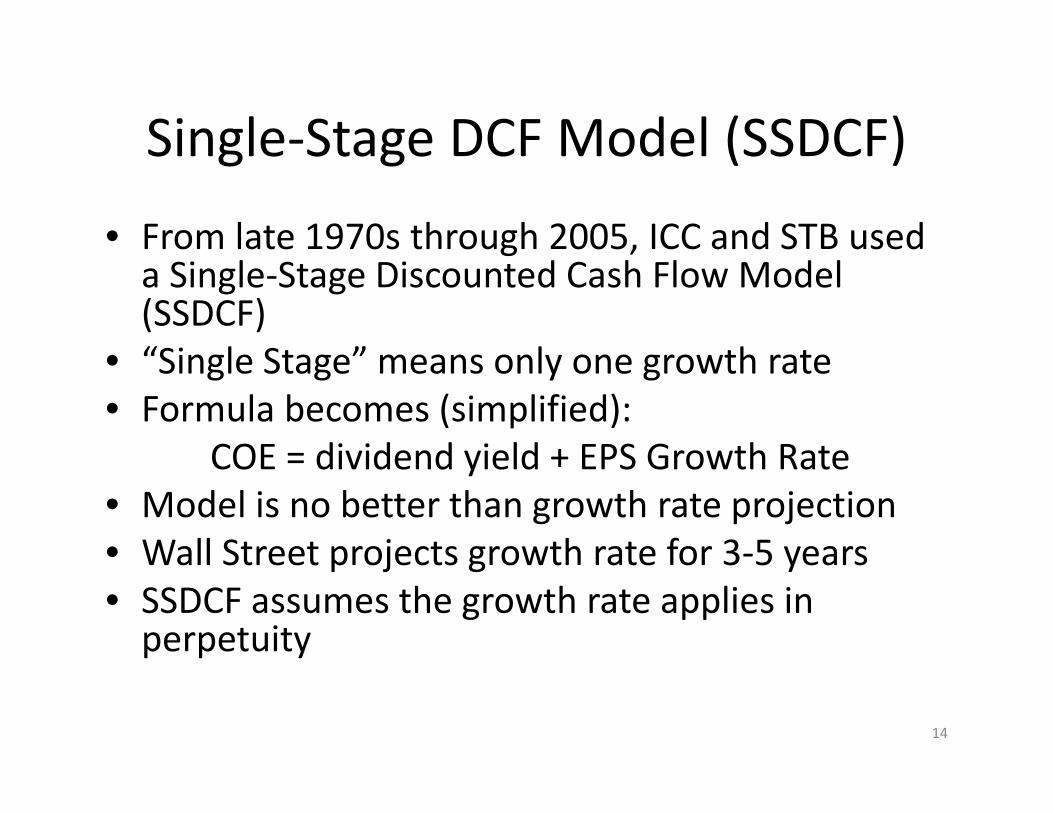
• From late 1970s through 2005, ICC and STB used a Single‐Stage Discounted Cash Flow Model (SSDCF)
• “Single Stage” means only one growth rate• Formula becomes (simplified):
COE = dividend yield + EPS Growth Rate• Model is no better than growth rate projection• Wall Street projects growth rate for 3‐5 years• SSDCF assumes the growth rate applies in perpetuity
14

SSDCF Problems
• By 2005, the EPS Growth Rate had grown to almost 14%, meaning CF nearly doubles every 5 years
• Wall Street analysts predicted doubling for next 5 years, not every 5 years
• Market doesn’t believe doubling every 5 years, and such doubling is impossible
• Low share price relative to high forecast cash flows results in high discount rate/COE
15

Capital Asset Pricing Model (CAPM)
• So, WCTL proposed CAPM as an alternative in 2005• STB adopted CAPM in 2008 for use starting with the 2006 calculation, but said there was merit in pairing it with a multi‐stage DCF
• CAPM uses historical data to develop expected return for market as a whole and adjusts for risk of individual firm or group of firms
• CAPM thus recognizes and builds upon risk‐reward relationship, as investors expect additional compensation for assuming additional risk
16

CAPM, continued• Under CAPM,• COE= Risk‐Free Rate (US Treasuries) +
Market Risk Premium MRP * RiskOr COE = RFR + (MRP * Beta)
• Market Risk Premium (MRP) is an estimate of the return on equities that an investor demands or expects in excess of Risk‐Free Rate (RFR)
• Beta is a narrow, technical measure of risk – sensitivity relative to market as a whole. Non‐systemic or individual risk is addressed through a diverse portfolio.
• 1990 Nobel Prize awarded for CAPM• Doesn’t mean that everyone agrees about CAPM or its inputs
17

Consequences of CAPM
• STB adoption of CAPM had a significant impact:– In 2005, SSDCF COE was 15.18%– In 2006, COE under CAPM is 11.13%
• AAR then proposes and STB adopts use of a Multi‐Stage DCF (MSDCF), with 3 stages, to be averaged with CAPM starting with 2008 calculation
• Rationales are that MSDCF addresses some SSDCF flaws and two models with different assumptions, data, and perspectives are better than one
• For 2008, MSDCF/CAPM COE is 13.17%, half way between 2005 (SSDCF) and 2006 (CAPM)
18

Post‐2008 Developments
• WCTL comments in annual EP 558 COC proceedings about various aspects of the COC calculations, especially the use of the MSDCF and the large disparity between it and the CAPM values
• In 2012, for example, CAPM was 10.27% and MSDCF was 16.53%
• Standard response was that WCTL instead needed to file a petition for rulemaking
• WCTL filed such a petition seeking elimination of MSDCF on August 27, 2013, and AAR opposed on September 16, 2013
19

Pending Rulemakings• STB granted WCTL’s petition on December 20, 2013• Also said it would institute a revenue adequacy proceeding
and the two proceedings would be coordinated• STB issued its notice requesting comments on April 2, 2014• The notice requested comments on cost of equity
methodology, not merely continued use of MSDCF• The notice also requested comments on revenue adequacy,
both measurement and application of concept• Opening comments were due September 5, 2014, and reply
comments were due November 4 – last Tuesday
20

Cost of Equity/EP 664 – Railroad View
• The Board got it right, as a simple average of CAPM and MSDCF is superior to a single model, which may be high or low given different and changing economic conditions
• 2 approaches are better than 1, and MSDCF adds useful information
• CAPM and MSDCF have different strengths and weaknesses, e.g., CAPM looks backward and MSDCF looks forward
• MSDCF weakness are overstated and are not weaknesses at all
• Adjusting for supposed weaknesses identified by WCTL shows they make little or no differences
• MSDCF and CAPM values are converging, at least in 201321

Cost of Equity/EP 552 – Shipper View
• MSDCF should not be used at all • CAPM should be improved with use of lower MRP and a “Blume” adjustment to the beta
• These revisions would conform to mainstream financial practice
• They would also create a substantial disparity in 2013• MSDCF generally not used by financial professionals• MSDCF assumptions are not reasonable• CAPM represents standard financial practice
22

Cost of Equity/EP 664 – Shipper View
• MSDCF has led to substantial overstatement• MSDCF and MSDCF/CAPM values are too high• CAPM is also overstated• MRP should be based on either more recent data or current survey data
• Blume adjustment reflects tendency of betas to return to 1.0 over time
• These adjustments would lower the COE by 2‐4%, or as much as a third
• Makes a big change in the annual revenue adequacy determination
23

Railroads’ Historical Revenue Adequacy, Using STB Cost of Capital
Year Cost of Capital BNSF UP NS CSX
2003 9.40% 6.20% 7.30% 9.10% 4.00%
2004 10.10% 5.84% 4.54% 11.64% 4.43%
2005 12.20% 10.32% 6.34% 13.21% 6.23%
2006 9.94% 11.43% 8.21% 14.36% 8.15%
2007 11.33% 9.97% 8.90% 13.55% 7.61%
2008 11.75% 10.51% 10.46% 13.75% 9.34%
2009 10.43% 8.67% 8.62% 7.69% 7.30%
2010 11.03% 10.28% 11.54% 10.96% 10.85%
2011 11.57% 12.39% 13.11% 12.87% 11.54%
2012 11.12% 13.47% 14.69% 11.48% 10.81%
24

Railroads’ Adequacy, Assuming CAPM‐Only Cost of Equity for 2008‐2012
Year Cost of Capital
BNSF UP NS CSX
2003 9.40% 6.20% 7.30% 9.10% 4.00%
2004 10.10% 5.84% 4.54% 11.64% 4.43%
2005 12.20% 10.32% 6.34% 13.21% 6.23%
2006 9.94% 11.43% 8.21% 14.36% 8.15%
2007 11.33% 9.97% 8.90% 13.55% 7.61%
2008 9.58% 10.51% 10.46% 13.75% 9.34%
2009 9.74% 8.67% 8.62% 7.69% 7.30%
2010 10.15% 10.28% 11.54% 10.96% 10.85%
2011 9.78% 12.39% 13.11% 12.87% 11.54%
2012 8.69% 13.47% 14.69% 11.48% 10.81%
25

EP 722/Revenue Adequacy• The revenue adequacy proceeding embraces two aspects– How to ascertain and measure revenue adequacy– What consequences flow if/when railroads are revenue adequate
• Revenue adequacy is one of the four prongs of constrained market pricing developed in Coal Rate Guidelines
• But revenue adequacy has never been applied, arguably because it has been in the future, except in an anhydrous ammonia pipeline case, CF Indus. v. Koch Pipeline
26

Measuring Adequacy/RR View• Use “replacement costs” instead of book values• Shift focus from returns earned to returns needed in future
to determine if there is appropriate incentive to invest• Measure revenue adequacy over an extended time period
reflecting economic life of rail assets• Railroad earnings do not reflect an abuse of market power• Railroad return on invested capital remains below other
comparable industries• Rate regulation must allow needed capital and support
investment, especially to handle growing volumes and demand
27

Measuring Adequacy/Shipper View
• Use CAPM, properly executed, to estimate the railroad cost of capital, consistent with mainstream financial practice
• Return to a “multiple indicators” approach (ROI, funds flow, ratios) to measuring revenue adequacy
• Measured over time, major railroads have been revenue adequate for several years, at least
• Use of replacement costs is contrary to statute, unnecessary, and impractical to implement properly
28

Revenue Adequacy Constraint
• As SAC cases have become more complex and expensive, STB members see potential for revenue adequacy as an effective alternative
• Only one precedent: CF Industries v. Koch Pipeline• Shippers challenged 20% rate increase under Revenue Adequacy Constraint; pipeline defended using SAC
• 2000 STB decision found pipeline’s ROI exceeded COC, and declared rate increases invalid
• STB reiterated previous holdings that shippers could select among constrained market pricing constraints
29

Revenue Adequacy/RR View
• Regulation of individual rates based on firm‐wide revenues has no economic basis
• Rate constraint based on revenue adequacy would threaten financial stability of industry, its ability to attract needed investment, and its financial incentives
• STB should judge captive rates using SAC• If SAC allows a higher rate than a Revenue Adequacy Constraint, higher rate should govern
• A relatively small number of SAC cases does not mean that the system needs changing (“regulatory contestability”)
30

Revenue Adequacy/Shipper View• Revenue Adequacy Constraint only applies to limited class of
market dominant traffic• SAC has become unwieldy and ineffective for
most captive shippers, and something better is needed, especially now
• SAC is only a ceiling, and not the gold standard• Revenue adequacy tempers the rationale for differential pricing• Rate increases by a revenue adequate carrier on captive traffic
should be limited to actual cost inflation (RCAF‐A)• STB should revisit elements of SAC test to allow recovery of excess
revenues contributed by captive shippers• Broad refunds of excess contribution to shippers with rates above
180% of variable costs
31