association paper final
TRANSCRIPT

8/9/2019 Association Paper Final
http://slidepdf.com/reader/full/association-paper-final 1/65
CONTRIBUTION OF THE AUTOMOTIVE INDUSTRY
TO THE ECONOMIES OF ALL FIFTY STATES
AND THE UNITED STATES
PREPARED FOR
THE ALLIANCE OF AUTOMOBILE MANUFACTURERS
THE ASSOCIATION OF INTERNATIONAL AUTOMOBILE MANUFACTURERS
THE MOTOR & EQUIPMENT MANUFACTURERS ASSOCIATION
THE NATIONAL AUTOMOBILE DEALERS ASSOCIATION
THE AMERICAN INTERNATIONAL AUTOMOBILE DEALERS ASSOCIATION
BY
THE SUSTAINABLE TRANSPORTATION AND COMMUNITIES GROUP CENTER FOR AUTOMOTIVE RESEARCH, ANN ARBOR, MI
MARCH 2010
The statements, findings, and conclusions herein are those of the authors and do not necessarily reflect the views of the project sponsors

8/9/2019 Association Paper Final
http://slidepdf.com/reader/full/association-paper-final 2/65

8/9/2019 Association Paper Final
http://slidepdf.com/reader/full/association-paper-final 3/65
© Center for Automotive Research 2010 i
TABLE OF CONTENTS
LIST OF TABLES ........................................................................................................................II
LIST OF FIGURES ..................................................................................................................... III
ACKNOWLEDGEMENTS ..........................................................................................................IV
EXECUTIVE SUMMARY .............................................................................................................V
INTRODUCTION ....................................................................................................................... 1
SECTION I – AUTOMOTIVE INDUSTRY OVERVIEW ......................................................................... 3
RESEARCH, DEVELOPMENT & INNOVATION ................................................................................ 9
U.S. MEDIUM AND HEAVY DUTY TRUCKS SECTOR ....................................................................11
U.S. AUTOMOTIVE AFTERMARKET SECTOR ..............................................................................14
THE INDUSTRY STRUGGLES IN AN ECONOMIC DOWNTURN.........................................................16
SUPPLIERS .............................................................................................................................19
DEALERS................................................................................................................................23
A LOOK INTO THE FUTURE: SALES REBOUND ...........................................................................25
SECTION II - ESTIMATES OF THE ECONOMIC CONTRIBUTION OF THE MOTOR VEHICLE INDUSTRY TO
THE ECONOMIES OF THE UNITED STATES AND INDIVIDUAL STATE ECONOMIES ................................28
VEHICLE MANUFACTURER ACTIVITIES ......................................................................................28
PARTS AND SUPPLIER ACTIVITIES ............................................................................................32AUTOMOBILE DEALERSHIPS .....................................................................................................37
STATE-LEVEL IMPACTS ............................................................................................................43
TOTAL CONTRIBUTION TO THE U.S. ECONOMY BY MOTOR VEHICLE ASSEMBLY AND
MANUFACTURING OPERATIONS, PARTS AND SYSTEMS SUPPLY, AND DEALERSHIP OPERATIONS..45
METHODOLOGY OVERVIEW .....................................................................................................46
APPENDIX A: STATE LEVEL EMPLOYMENT CONTRIBUTIONS ........................................................49
APPENDIX B: DETERMINATION OF DIRECT EMPLOYMENT FOR THE MOTOR VEHICLE PARTS
INDUSTRY...................................................................................................................................53
REFERENCES .............................................................................................................................55

8/9/2019 Association Paper Final
http://slidepdf.com/reader/full/association-paper-final 4/65
© Center for Automotive Research 2010 ii
LIST OF TABLES
TABLE 1.1: UNITED STATES RETAIL SALES OF TRUCKS, 2008 .......................................................13
TABLE 2.1: TOTAL CONTRIBUTION OF ORIGINAL EQUIPMENT MANUFACTURER-RELATED OPERATIONS
TO THE ECONOMY IN THE UNITED STATES...................................................................29
TABLE 2.2: INTERMEDIATE AND SPIN-OFF EMPLOYMENT CONTRIBUTION OF ORIGINAL EQUIPMENT
MANUFACTURER-RELATED OPERATIONS IN THE U.S. ...................................................30
TABLE 2.3: TOTAL CONTRIBUTION OF MOTOR VEHICLE SUPPLIERS AND PARTS MANUFACTURER-RELATED OPERATIONS TO THE ECONOMY IN THE UNITED STATES ................................34
TABLE 2.4: EMPLOYMENT BY PARTS MANUFACTURING AND SUPPLIER OPERATIONS, 2007 VS. 2009................................................................................................................................35
TABLE 2.5: INTERMEDIATE AND SPIN-OFF EMPLOYMENT FROM MOTOR VEHICLE SUPPLIERS AND
PARTS MANUFACTURER-RELATED OPERATIONS IN THE U.S. ........................................36
TABLE 2.6: TOTAL CONTRIBUTION OF NEW MOTOR VEHICLE DEALERSHIP OPERATIONS TO THEECONOMY IN THE UNITED STATES ..............................................................................39
TABLE 2.7: INTERMEDIATE AND SPIN-OFF EMPLOYMENT CONTRIBUTION OF NEW MOTOR VEHICLE
DEALERSHIP OPERATIONS IN THE U.S. .......................................................................40
TABLE 2.8: DEALERSHIP EMPLOYMENT BY STATE ........................................................................42
TABLE 2.9: TOTAL CONTRIBUTION OF ALL MOTOR VEHICLE MANUFACTURING AND DEALERSHIP
OPERATIONS TO THE ECONOMY OF THE UNITED STATES .............................................46
TABLE B.1 SECTORS COMPRISING AUTO PARTS MANUFACTURING INDUSTRY ................................53
8/9/2019 Association Paper Final
http://slidepdf.com/reader/full/association-paper-final 5/65
© Center for Automotive Research 2010 iii
LIST OF FIGURES
FIGURE 1.1: U.S. MOTOR VEHICLE MARKET SHARE, 1986-2011 ................................................... 3
FIGURE 1.2: PERCENT CONTRIBUTION TO GDP BY INDUSTRY, 2008 .............................................. 5
FIGURE 1.3: U.S. AUTOMOTIVE OUTPUT AS PERCENT OF GDP, 1995-2008 ................................... 6
FIGURE 1.4: VALUE-ADDED PER EMPLOYEE BY DETAILED MANUFACTURING INDUSTRY, 2006 ......... 7
FIGURE 1.5: EMPLOYEES BY SELECTED INDUSTRY........................................................................ 8
FIGURE 1.6: JOB MULTIPLIER BY SELECTED INDUSTRY.................................................................. 9
FIGURE 1.7: R&D FUNDING SOURCES BY INDUSTRY, 2007 ...........................................................10
FIGURE 1.8: U.S. AUTOMOTIVE SPENDING, 1999-2007 ................................................................11
FIGURE 1.9: WORLD MEDIUM AND HEAVY DUTY TRUCK MARKET...................................................12
FIGURE 1.10: ANNUAL VEHICLE MILES TRAVELED FOR MEDIUM AND HEAVY DUTY TRUCKS (IN
BILLIONS) ..............................................................................................................14 FIGURE 1.11: AFTERMARKET SHARE BY REVENUES ......................................................................16
FIGURE 1.12: U.S. SALES OF LIGHT VEHICLES, 1992-2009 ..........................................................18
FIGURE 1.13: CREDIT APPROVAL FOR AUTO LOANS, 2008 ...........................................................19
FIGURE 1.14: AUTOMOTIVE-RELATED R&D SPENDING BY OEMS AND SUPPLIERS, 2000-2007 .......21
FIGURE 1.15: MAJOR SUPPLIER BANKRUPTCIES, 2001-2009 .......................................................22
FIGURE 1.16: TOTAL U.S. NEW CAR DEALERSHIPS, 1988-2009 ...................................................24
FIGURE 1.17: NEW VEHICLE SALES BY MONTH, NOVEMBER 2008-NOVEMBER 2009 ......................26
FIGURE 2.1: OEM JOBS AS PERCENT OF POPULATION (TOP 10 STATES) ......................................43
FIGURE 2.2: AUTOMOTIVE INDUSTRY EMPLOYMENT BY STATE FOR DIRECT AND INDIRECT JOBS .....44
FIGURE 2.3: THREE STATE EXAMPLES – AUTOMOTIVE JOBS AS A PERCENT OF LABOR FORCE .......45

8/9/2019 Association Paper Final
http://slidepdf.com/reader/full/association-paper-final 6/65
© Center for Automotive Research 2010 iv
ACKNOWLEDGEMENTS
The authors would like to thank the associations of the motor vehicle industry for the opportunity
to carry out this study.
The Alliance of Automobile Manufacturers (AAM)The Association of International Automobile Manufacturers (AIAM)
The Motor and Equipment Manufacturers Association (MEMA)
The National Automobile Dealers Association (NADA)
The American International Automobile Dealers Association (AIADA)
This study is the result of a group effort. The authors would like to thank Joshua Cregger for his
assistance with content. The authors would also like to acknowledge the significant efforts of
Diana Douglass. Diana contributed greatly to the production of the document.
Kim Hill, MPP
Associate Director, Research
Director, Sustainable Transportation and Communities Group
Director, Automotive Communities Program
Debbie Maranger Menk
Project Manager
Adam Cooper
Research Associate
Center for Automotive Research
1000 Victors Way, Suite 200
Ann Arbor, MI 48108
734.662.1287
www.cargroup.org
8/9/2019 Association Paper Final
http://slidepdf.com/reader/full/association-paper-final 7/65
© Center for Automotive Research 2010 v
EXECUTIVE SUMMARY
• 8 million private sector jobs impacted by the U.S. auto manufacturers, suppliersand dealers
• $500 billion in annual compensation
• Vehicle manufacturer job creation multiplier of 10
• Entire industry multiplier of 4
The year 2008 was like no other in the U.S. automotive industry. Vehicle sales early in the year
appeared to be on track with expected volumes but quickly deteriorated as a recession took
hold and the bottom fell out of the financial sector ─ choking off credit to automakers, suppliers
and consumers. By the end of 2008, two of the Detroit-based companies’ long term
sustainability was threatened, and virtually the entire U.S.-based auto producing industry was
operating facilities at less than 50 percent capacity utilization. This ramp-down in productionaffected not only the OEMs, but the supplier sector quickly felt the pain as many suppliers
halted production and (along with the OEMs) laid off employees ─ some never to come back.
This situation of extremely low year-end employment made it very difficult to analyze the true
employment and economic impact of the auto industry—the purpose of this report. Performing
an economic and employment impact analysis of the auto industry requires the input of year-
end direct employment data for the original equipment vehicle manufacturers (OEM), supplier
and dealer sectors. This left the study authors in a predicament: what employment numbers to
use—the year end, depth-of-a-recession employment numbers which are not sustainable, the
high point of earlier in the summer of 2008, or something else? CAR researchers chose to use
an average employment (between the low and high ends) on the theory that the auto industry
would not remain in recession and the employment numbers at the bottom of a recession would
not be the real indicators of true employment. However, with the uncertainty about when the
industry would return to “normal” employment, the authors did not want to appear overly
optimistic, instead inputting numbers that roughly correlate with a 12 million unit sales year—the
expectation for 2010. As a result, this study represents the expected employment and
economic impact of the industry on the national and 50-states’ economies within the next year
or so.
For the study, the authors assumed:
• Vehicle manufacturers (OEM) directly employed 313,000 peopleIncludes manufacturing, research and development, headquarters, and all otheroperational activities

8/9/2019 Association Paper Final
http://slidepdf.com/reader/full/association-paper-final 8/65
© Center for Automotive Research 2010 vi
• 686,000 people were employed in the automotive parts sector.Includes a percentage employment from rubber, plastics, batteries, and other non-automotive sectors
• 737,000 people were employed in the dealer network selling and servicing new vehicles
•
1,736,000 people were employed in the entire industryThe study shows that these 1.7 million direct jobs contribute to an estimated:
• 8 million total private sector jobs
• more than $500 billion in annual compensation and
• more than $70 billion in personal tax revenues.
Therefore, the employment multiplier for OEM activities is 10, while the employment multiplier
for the entire industry is 4.
The employment multipliers derived from manufacturing vehicles, and from manufacturing and
selling vehicles are both higher than multipliers seen in previous studies. The authors believe
the recession is assisting in determining the true impact of the industry by not only calculating
marginal jobs affected by the industry, but also by estimating that entire companies would close,
taking many of the support jobs with them. It may be that the 10 multiplier is indeed a truer
indicator of the auto industry’s impact than previous studies had revealed.
Breakout of the employment and economic impacts by OEM, supplier, and dealer sector are as
follows:
•
Direct, intermediate, and spin-off employment from OEM activities estimated at 3.1million
• Total compensation of over $200 billion
• Estimated personal tax payments of nearly $30 billion
• Total employment generated by parts manufacturing is estimated to be 3.3 million
• Total compensation of over $200 billion
• Estimated personal tax payments of $30 billion
• Total employment generated by the dealership network is estimated to be 1.5 million
• Total compensation of $90 billion
• Estimated personal tax payments of roughly $10 billion

8/9/2019 Association Paper Final
http://slidepdf.com/reader/full/association-paper-final 9/65
© Center for Automotive Research 2010 vii
Further details of these impacts, and those regarding state-level employment and economic
impacts, can be found in the body of the study.
8/9/2019 Association Paper Final
http://slidepdf.com/reader/full/association-paper-final 10/65
© Center for Automotive Research 2010 1
INTRODUCTION
The United States automotive industry is a critical component of economic growth with
extensive interconnections across the industrial and cultural fabric of the U.S. This report
outlines many known elements and highlights tremendously important associations beyond the
market space of manufacturing. It touches on the following elements as they relate to the
automotive industry: national and regional employment; research, development and innovation;
state and local government revenues; foreign direct investment; education; health care; U.S.
trade; and quality of life.
The paper is organized into two sections: Section I provides qualitative context and current
market metrics for the automotive industry, both of which are needed to truly appreciate the
contributions of the industry to the broader economy and gauge where the sector may be
heading; Section II features an in-depth quantitative analysis of employment and personal
income associated with the automotive sector. Section II is subdivided into four primary
sections to capture the distinct contributions of suppliers, assemblers, and dealers to the
national economy with a final summary section that describes the state-level employment
associated with the automotive industry.
The auto industry is one of the most important industries in the United States. It historically has
contributed 3 – 3.5 percent to the overall Gross Domestic Product (GDP). The industry directly
employs over 1.7 million people engaged in designing, engineering, manufacturing, and
supplying parts and components to assemble, sell and service new motor vehicles. In addition,the industry is a huge consumer of goods and services from many other sectors, including raw
materials, construction, machinery, legal, computers and semi-conductors, financial, advertising,
and healthcare. The auto industry spends $16 to $18 billion every year on research and
product development – 99 percent of which is funded by the industry itself. Due to the industry’s
consumption of products from many other manufacturing sectors, it is a major driver of the
11.5% manufacturing contribution to GDP. Without the auto sector, it is difficult to imagine
manufacturing surviving in this country.
Recently, the auto industry has fallen on tough times. However, the U.S. market is still one of
the largest motor vehicle markets in the world; consequently, many automakers sell and
manufacture in the U.S. In fact, many automakers make the lion’s share of their profits in North
America. There has been a period of restructuring by the three U.S.-based companies in order
to right-size their operations and be able to respond to this fierce competition in the U.S. market.
In the latest restructuring, a bursting of the housing bubble and a collapse of the financial sector

8/9/2019 Association Paper Final
http://slidepdf.com/reader/full/association-paper-final 11/65
© Center for Automotive Research 2010 2
led to the current period of extremely tight credit, making it nearly impossible for companies and
consumers to make investments. During this period, many supplier companies, dealerships and
a couple of manufacturers found themselves fighting for survival and turning to the lender of last
resort–the federal government. This led to an amazing time of public introspection concerning
the value to the country of a U.S.-based auto industry.
In this paper, the authors touch on many of the factors that support the auto industry’s
importance and standing in the national economy, along with an estimate of the industry’s
employment and economic contribution to the national economy and to each of the 50 states
and the District of Columbia.
As previously mentioned, over 1.7 million people are employed by the auto industry. In addition,
the industry is a huge consumer of goods and services from many other sectors and contributes
to a net employment impact in the U.S. economy of nearly 8 million jobs. Approximately 4.5
percent of all U.S. jobs are supported by the strong presence of the auto industry in the U.S.
economy. People in these jobs collectively earn over $500 billion annually in compensation and
generate more than $70 billion in tax revenues.
8/9/2019 Association Paper Final
http://slidepdf.com/reader/full/association-paper-final 12/65
© Center for Automotive Research 2010 3
SECTION I – Automotive Industry Overview
National economies are defined by their ability to develop differentiated goods and services.
For roughly 100 years, the United States automotive industry has helped shape the identity of
the U.S. economy and has generated millions of jobs. Given the immense economic
uncertainties that accompany the current recession, it is important to understand the industry’s
characteristics and contributions to the broader economy. Section I of this report begins with
summary information on the overall size and composition of the industry.
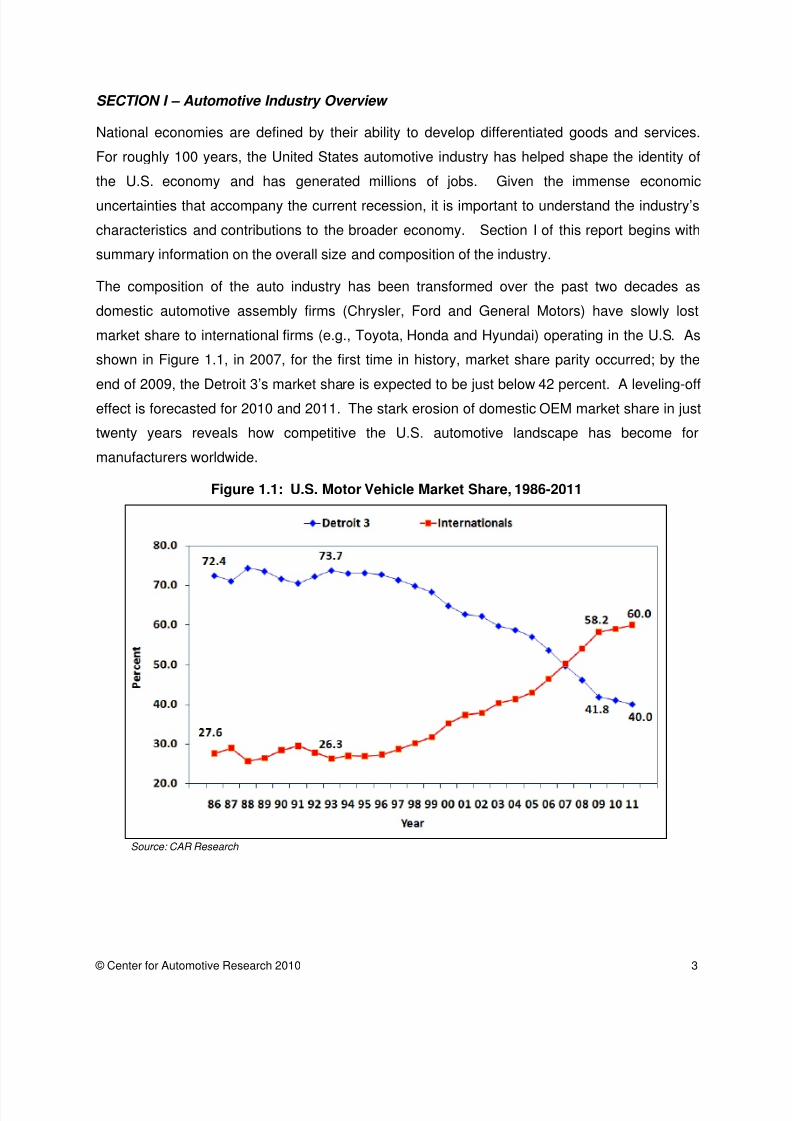
The composition of the auto industry has been transformed over the past two decades as
domestic automotive assembly firms (Chrysler, Ford and General Motors) have slowly lost
market share to international firms (e.g., Toyota, Honda and Hyundai) operating in the U.S. As
shown in Figure 1.1, in 2007, for the first time in history, market share parity occurred; by the
end of 2009, the Detroit 3’s market share is expected to be just below 42 percent. A leveling-off
effect is forecasted for 2010 and 2011. The stark erosion of domestic OEM market share in just
twenty years reveals how competitive the U.S. automotive landscape has become for
manufacturers worldwide.
Figure 1.1: U.S. Motor Vehicle Market Share, 1986-2011
Source: CAR Research
8/9/2019 Association Paper Final
http://slidepdf.com/reader/full/association-paper-final 13/65
© Center for Automotive Research 2010 4
The automotive industry is dynamic; over the past two decades, the U.S. industry has been
transformed by more than $25 billion in new direct investments from Asia and Europe1
The economic performance of the automotive sector, and the broader manufacturing sector, is
extremely important for the continued development and growth of the national and regional
economies, as it comprises a large share of total U.S. output (see Figures 1.2 and 1.3). At the
end of 2008, U.S. automotive output was 2.2% of GDP, and overall manufacturing contributed
11.5% to GDP. The sizeable contribution to economic output by the manufacturing industry is
attributable to several factors, including international trade opportunities that allow for the export
of highly specialized manufactured products. Many of these products are high value-added
goods that are made through the use of skilled laborers and advanced equipment. The
complexity of making these products contributes to the large job-creating multiplier effect of
manufacturing within the U.S.
. Much of
the foreign direct investment has gone to areas in the country that were not traditional locations
for automotive employment–in effect, stretching the footprint of the U.S. auto industry. This
transformation has been very important to suppliers throughout the U.S.; the density distribution
of jobs related to suppliers (as reported in Section II) shows both growth areas in the southern
U.S. in addition to the dense network of manufacturing found in the Great Lakes states.
1 Center for Automotive Research, Book of Deals

8/9/2019 Association Paper Final
http://slidepdf.com/reader/full/association-paper-final 14/65
© Center for Automotive Research 2010 5
Figure 1.2: Percent Contribution to GDP by Industry, 2008
Source: Bureau of Economic Analysis
Innovation and productivity by manufacturers allows for the development and delivery of
customized, durable, high quality goods to households. Maintaining and enhancing these
positive aspects of U.S.-manufactured goods requires a commitment to the research and
development process. Despite recent declines in the once booming manufacturing sector, the
important catalytic effect from these industries should be acknowledged.

8/9/2019 Association Paper Final
http://slidepdf.com/reader/full/association-paper-final 15/65
© Center for Automotive Research 2010 6
Figure 1.3: U.S. Automotive Output as Percent of GDP, 1995-2008
Source BEA All estimates Nominal
When people think of the automobile industry, they generally picture a very large assembly plant
staffed with thousands of people and equipped with conveyor belts and robots as far as the eye
can see. What these observers probably do not see are the many supplier companies that
design and manufacture the parts needed for the final assembly to occur. In the past, parts-
making operations were an integral function of the large motor vehicle assembly companies, but
as the industrial structure of the automotive industry evolved and the number of parts required
to fully assemble a vehicle grew, so too did the technical depth and geographic location of parts
manufacturers. A primary objective of this report is to illustrate just how important the diversity
and quality embodied in the parts sector is to the automotive sector value-chain.
The automotive industry is a very important industry in the U.S. economy; no other single
industry links as closely to the U.S. manufacturing sector or directly generates as much retail
business and overall employment. Manufacturing has been the backbone of the Americaneconomy, and the automotive industry is its heart. A look at the entire production and supply
chain provides a rich narrative of how a strong automotive industry historically supports the
growth and stability of many other industries, such as basic materials suppliers of steel, plastic,
rubber and glass, which are used for making bodies, interiors and trim, tires, gaskets and
windows. Figure 1.4 provides a comparison of the value added per employee (measured in
3.7% 3.7%3.8% 3.9%
4.0%
3.7%
3.4%
3.6%
3.4% 3.4% 3.3%
3.1%
2.9%
2.2%
0.0%
0.5%
1.0%
1.5%
2.0%
2.5%
3.0%
3.5%
4.0%
4.5%
1995 1996 1997 1998 1999 2000 2001 2002 2003 2004 2005 2006 2007 2008
8/9/2019 Association Paper Final
http://slidepdf.com/reader/full/association-paper-final 16/65
© Center for Automotive Research 2010 7
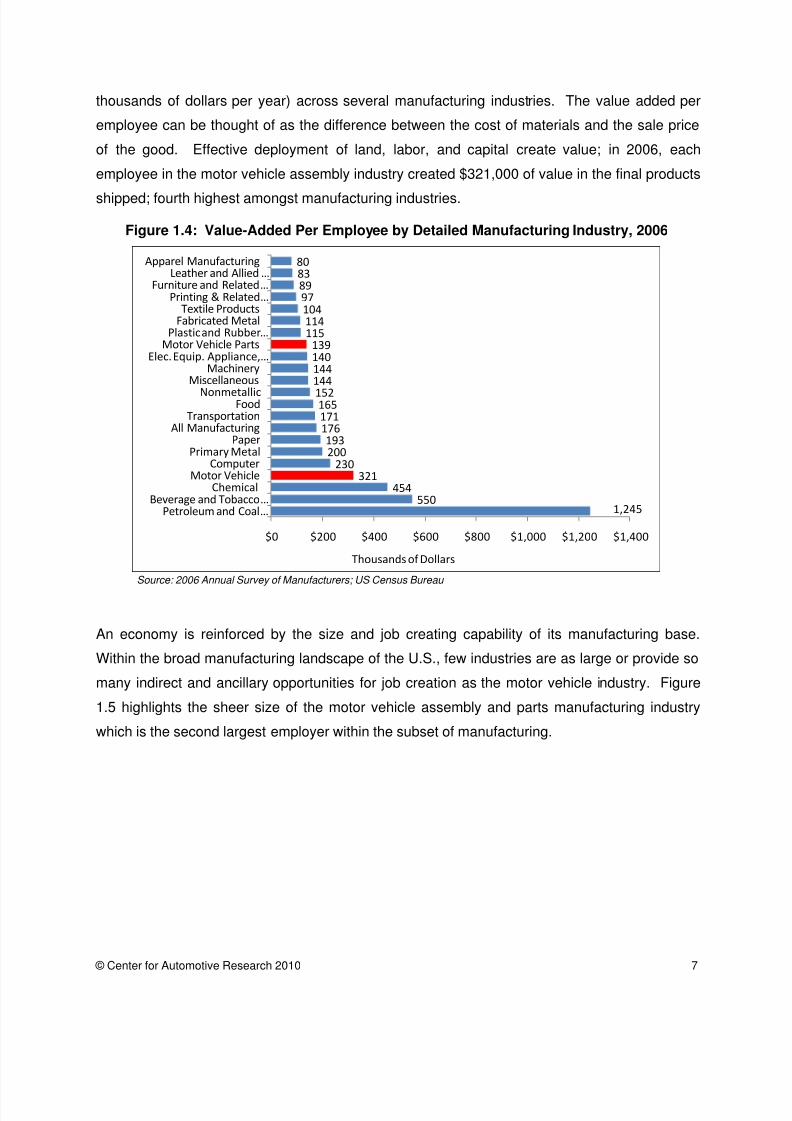
thousands of dollars per year) across several manufacturing industries. The value added per
employee can be thought of as the difference between the cost of materials and the sale price
of the good. Effective deployment of land, labor, and capital create value; in 2006, each
employee in the motor vehicle assembly industry created $321,000 of value in the final products
shipped; fourth highest amongst manufacturing industries.
Figure 1.4: Value-Added Per Employee by Detailed Manufacturing Industry, 2006
Source: 2006 Annual Survey of Manufacturers; US Census Bureau
An economy is reinforced by the size and job creating capability of its manufacturing base.
Within the broad manufacturing landscape of the U.S., few industries are as large or provide so
many indirect and ancillary opportunities for job creation as the motor vehicle industry. Figure
1.5 highlights the sheer size of the motor vehicle assembly and parts manufacturing industry
which is the second largest employer within the subset of manufacturing.
1,245550
454321
230200193
176171165
152
144144140139
11511410497898380
$0 $200 $400 $600 $800 $1,000 $1,200 $1,400
Petroleum and Coal …Beverage and Tobacco…
ChemicalMotor Vehicle
ComputerPrimary Metal
PaperAll Manufacturing
TransportationFood
Nonmetallic
MiscellaneousMachinery
Elec. Equip. Appliance, …Motor Vehicle Parts
Plastic and Rubber …Fabricated MetalTextile Products
Printing & Related…Furniture and Related …
Leather and Allied …Apparel Manufacturing
Thousands of Dollars

8/9/2019 Association Paper Final
http://slidepdf.com/reader/full/association-paper-final 17/65
© Center for Automotive Research 2010 8
Figure 1.5: Employees by Selected Industry
Some industries inherently create more jobs than other industries. A high jobs creation
multiplier tends to be associated with industries that require large amounts of inputs from other
industries, source inputs from industries that have a high regional purchase coefficient, or pay
above average wages. Figure 1.6 details the employment multiplier for a select set of
industries. The motor vehicle assembly industry, with its multiplier of 10, is an industry thatmeets all of the above criteria.

8/9/2019 Association Paper Final
http://slidepdf.com/reader/full/association-paper-final 18/65
© Center for Automotive Research 2010 9
Figure 1.6: Job Multiplier by Selected Industry
Research, Development & Innovation
The automotive industry invests heavily in research and development. Unlike other industries,
automotive research and development efforts are largely funded by the industry, rather than
through public sources. Only 1 percent of R&D in the automotive industry was funded through
the Federal government, leaving the industry to bear essentially the full cost of creating newtechnologies, engine and equipment designs, testing, and implementation (see Figure 1.7).
More recent developments in Federal funding ─ of automotive R&D specifically and the industry
in general ─ as a result of the economic downturn and a federal emphasis on increased fuel
efficiency will be detailed at the end of Section I.

8/9/2019 Association Paper Final
http://slidepdf.com/reader/full/association-paper-final 19/65
© Center for Automotive Research 2010 10
Figure 1.7: R&D Funding Sources by Industry, 2007
Source: National Science Foundation
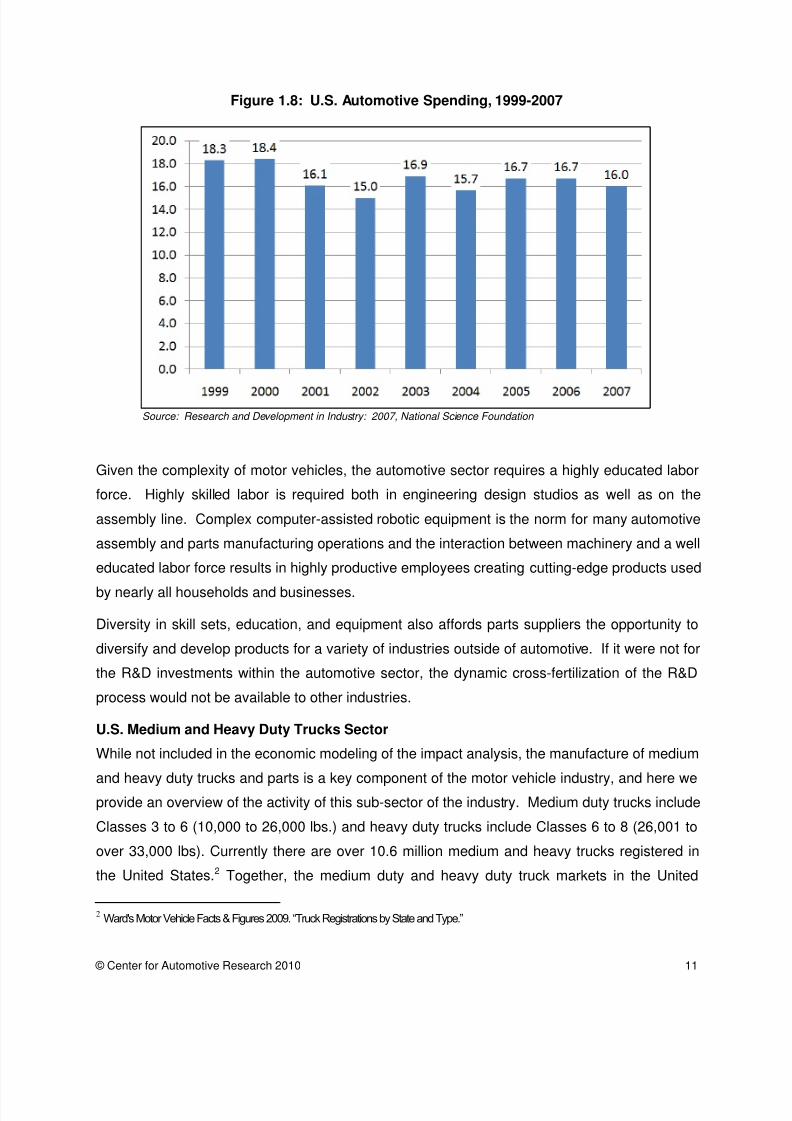
In 2007, the U.S. automotive sector, responding to: 1) the need to improve safety in vehicles, 2)
consumer demands for new model types with enhanced cosmetic and drive performance
characteristics, and 3) regulation of emissions, invested $16 billion into R&D. It should be
pointed out that several other industries, all of which comprise a smaller share of GDP and
national employment than automotive, often receive a substantial amount of R&D funding from
the Federal government. The need to constantly innovate and remain competitive drives both
domestic and international automotive manufacturers to focus on R&D.
8/9/2019 Association Paper Final
http://slidepdf.com/reader/full/association-paper-final 20/65
© Center for Automotive Research 2010 11
Figure 1.8: U.S. Automotive Spending, 1999-2007
Source: Research and Development in Industry: 2007, National Science Foundation
Given the complexity of motor vehicles, the automotive sector requires a highly educated labor
force. Highly skilled labor is required both in engineering design studios as well as on the
assembly line. Complex computer-assisted robotic equipment is the norm for many automotive
assembly and parts manufacturing operations and the interaction between machinery and a well
educated labor force results in highly productive employees creating cutting-edge products used
by nearly all households and businesses.
Diversity in skill sets, education, and equipment also affords parts suppliers the opportunity to
diversify and develop products for a variety of industries outside of automotive. If it were not for
the R&D investments within the automotive sector, the dynamic cross-fertilization of the R&D
process would not be available to other industries.
U.S. Medium and Heavy Duty Trucks Sector
While not included in the economic modeling of the impact analysis, the manufacture of medium
and heavy duty trucks and parts is a key component of the motor vehicle industry, and here weprovide an overview of the activity of this sub-sector of the industry. Medium duty trucks include
Classes 3 to 6 (10,000 to 26,000 lbs.) and heavy duty trucks include Classes 6 to 8 (26,001 to
over 33,000 lbs). Currently there are over 10.6 million medium and heavy trucks registered in
the United States.2
2 Ward's Motor Vehicle Facts & Figures 2009. “Truck Registrations by State and Type.”
Together, the medium duty and heavy duty truck markets in the United

8/9/2019 Association Paper Final
http://slidepdf.com/reader/full/association-paper-final 21/65
© Center for Automotive Research 2010 12
States sell 433,263 units annually3 and have a value of $125.5 billion. 4 Of the total U.S. sales,
over 420,000 are domestically produced vehicles and nearly 13,000 are imported vehicles. The
United States is the largest medium and heavy duty truck market in the world, accounting for
43.5% of the world market, followed by the Asia-Pacific region with 30.8% of the market and
Europe with 17.4% of the market.5
Figure 1.9 illustrates the distribution of the global medium
and heavy truck market.
Figure 1.9: World Medium and Heavy Duty Truck Market
The medium and heavy duty vehicles comprise slightly less than 6.5% of all motor vehicle sales,
with medium duty trucks accounting for over 250,000 sales and heavy duty trucks accounting
for over 180,000 sales annually.6 The medium duty vehicle market in the United States consists
primarily of class 3 vehicles (over 53% of units sold) while the heavy duty vehicle market
consists primarily of on-road interstate trucks in the Class 8 category (over 73% of units sold).7
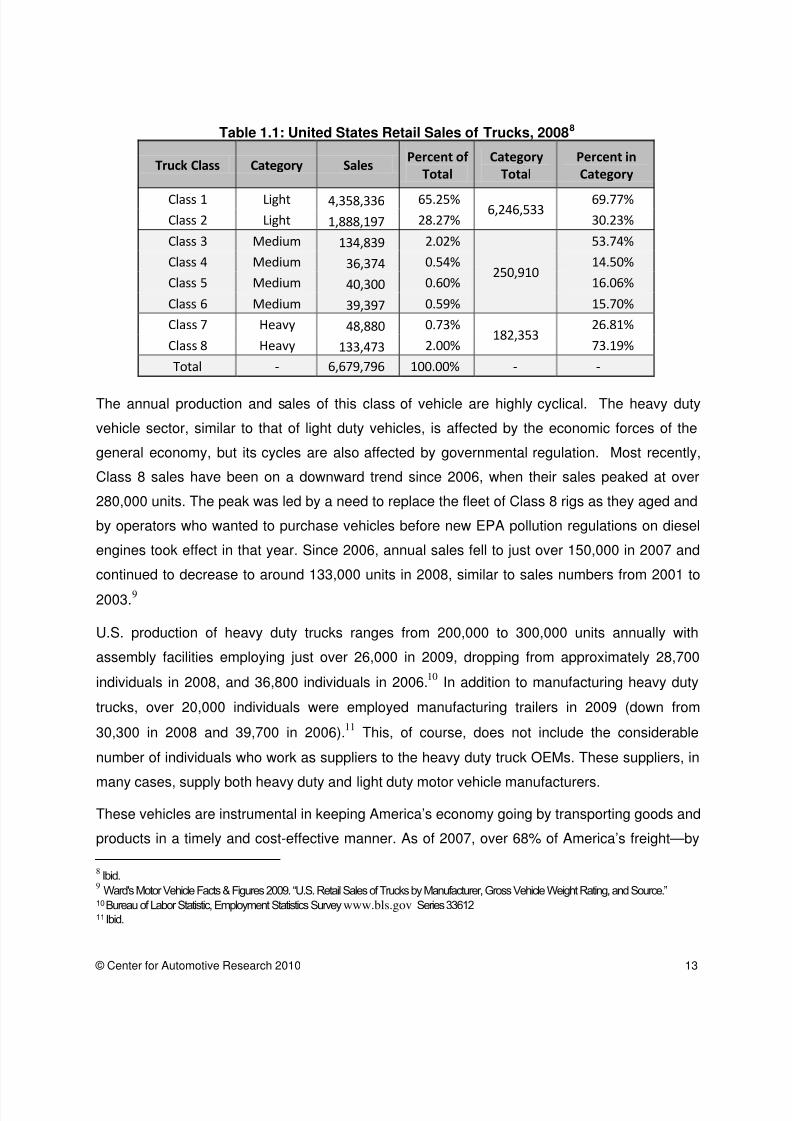
Table 1.1 contains sales data pertaining to the United States truck market.
3Ward's Motor Vehicle Facts & Figures 2009. “U.S. Retail Sales of Trucks by Manufacturer, Gross Vehicle Weight Rating, and Source.”
4Datamonitor. “Medium & Heavy Trucks in the United States.” Industry Profile. December 2008.
5Ibid.
6Ward's Motor Vehicle Facts & Figures 2009. “U.S. Retail Sales of Trucks by Manufacturer, Gross Vehicle Weight Rating, and Source.”
7Ibid.
8/9/2019 Association Paper Final
http://slidepdf.com/reader/full/association-paper-final 22/65
© Center for Automotive Research 2010 13
Table 1.1: United States Retail Sales of Trucks, 20088
Truck Class Category SalesPercent of
Total
Category
Total
Percent in
Category
Class 1 Light 4,358,336 65.25%6,246,533
69.77%
Class 2 Light 1,888,197 28.27% 30.23%
Class 3 Medium 134,839 2.02%
250,910
53.74%
Class 4 Medium 36,374 0.54% 14.50%
Class 5 Medium 40,300 0.60% 16.06%
Class 6 Medium 39,397 0.59% 15.70%
Class 7 Heavy 48,880 0.73%182,353
26.81%
Class 8 Heavy 133,473 2.00% 73.19%
Total - 6,679,796 100.00% - -
The annual production and sales of this class of vehicle are highly cyclical. The heavy duty
vehicle sector, similar to that of light duty vehicles, is affected by the economic forces of the
general economy, but its cycles are also affected by governmental regulation. Most recently,
Class 8 sales have been on a downward trend since 2006, when their sales peaked at over
280,000 units. The peak was led by a need to replace the fleet of Class 8 rigs as they aged and
by operators who wanted to purchase vehicles before new EPA pollution regulations on diesel
engines took effect in that year. Since 2006, annual sales fell to just over 150,000 in 2007 and
continued to decrease to around 133,000 units in 2008, similar to sales numbers from 2001 to
2003.9
U.S. production of heavy duty trucks ranges from 200,000 to 300,000 units annually with
assembly facilities employing just over 26,000 in 2009, dropping from approximately 28,700
individuals in 2008, and 36,800 individuals in 2006.
10In addition to manufacturing heavy duty
trucks, over 20,000 individuals were employed manufacturing trailers in 2009 (down from
30,300 in 2008 and 39,700 in 2006).11
These vehicles are instrumental in keeping America’s economy going by transporting goods and
products in a timely and cost-effective manner. As of 2007, over 68% of America’s freight—by
This, of course, does not include the considerable
number of individuals who work as suppliers to the heavy duty truck OEMs. These suppliers, in
many cases, supply both heavy duty and light duty motor vehicle manufacturers.
8Ibid.
9 Ward's Motor Vehicle Facts & Figures 2009. “U.S. Retail Sales of Trucks by Manufacturer, Gross Vehicle Weight Rating, and Source.”
10Bureau of Labor Statistic, Employment Statistics Survey www.bls.gov Series 3361211 Ibid.

8/9/2019 Association Paper Final
http://slidepdf.com/reader/full/association-paper-final 23/65
© Center for Automotive Research 2010 14
gross tonnage — is hauled by truck. When considering the value of shipments, this figure
climbs to around 70%.12
Between 1965 and the present, use of heavy duty trucks on the
highway has increased by a factor of nearly five ─ from almost 32 billion vehicle miles traveled
(VMT) in 1965 to over 145 billion VMT in 2007.13
Meanwhile, medium duty trucks have
increased their use by a factor of nearly four ─ from just over 27 billion VMT in 1970 to almost
82 billion VMT in 2007. Figure 1.10 displays the increases in total VMT for these two vehicle
classes.
Figure 1.10: Annual Vehicle Miles Traveled for Medium and Heavy Duty Trucks(in billions)14
U.S. Automotive Aftermarket Sector
While not explicitly detailed in the economic impact analysis (Section II), the aftermarket sector
is inherently included in the supplier totals. Here we highlight their economic contribution to the
12 Research and Innovative Technology Administration, Bureau of Transportation Statistics. Commodity Flow Survey. “Shipment
Characteristics by Mode of Transportation for the United States: 2007.” www.bts.gov 13 Research and Innovative Technology Administration, Bureau of Transportation Statistics. “National Transportation Statistics 2008.”
www.bts.gov 14 Research and Innovative Technology Administration, Bureau of Transportation Statistics. “National Transportation Statistics 2008.”
www.bts.gov
8/9/2019 Association Paper Final
http://slidepdf.com/reader/full/association-paper-final 24/65
© Center for Automotive Research 2010 15
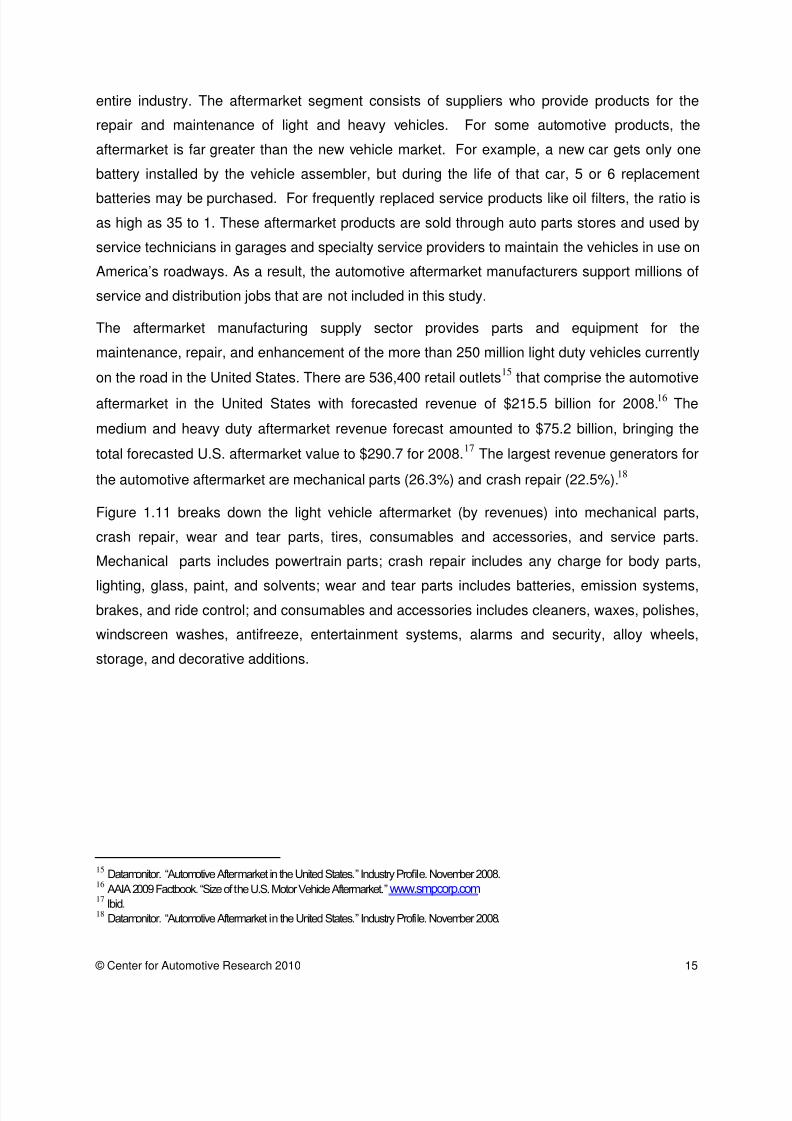
entire industry. The aftermarket segment consists of suppliers who provide products for the
repair and maintenance of light and heavy vehicles. For some automotive products, the
aftermarket is far greater than the new vehicle market. For example, a new car gets only one
battery installed by the vehicle assembler, but during the life of that car, 5 or 6 replacement
batteries may be purchased. For frequently replaced service products like oil filters, the ratio is
as high as 35 to 1. These aftermarket products are sold through auto parts stores and used by
service technicians in garages and specialty service providers to maintain the vehicles in use on
America’s roadways. As a result, the automotive aftermarket manufacturers support millions of
service and distribution jobs that are not included in this study.
The aftermarket manufacturing supply sector provides parts and equipment for the
maintenance, repair, and enhancement of the more than 250 million light duty vehicles currently
on the road in the United States. There are 536,400 retail outlets15
that comprise the automotive
aftermarket in the United States with forecasted revenue of $215.5 billion for 2008.16
The
medium and heavy duty aftermarket revenue forecast amounted to $75.2 billion, bringing the
total forecasted U.S. aftermarket value to $290.7 for 2008.17
The largest revenue generators for
the automotive aftermarket are mechanical parts (26.3%) and crash repair (22.5%).18
Figure 1.11 breaks down the light vehicle aftermarket (by revenues) into mechanical parts,
crash repair, wear and tear parts, tires, consumables and accessories, and service parts.
Mechanical parts includes powertrain parts; crash repair includes any charge for body parts,
lighting, glass, paint, and solvents; wear and tear parts includes batteries, emission systems,brakes, and ride control; and consumables and accessories includes cleaners, waxes, polishes,
windscreen washes, antifreeze, entertainment systems, alarms and security, alloy wheels,
storage, and decorative additions.
15 Datamonitor. “Automotive Aftermarket in the United States.” Industry Profile. November 2008.
16 AAIA 2009 Factbook. “Size of the U.S. Motor Vehicle Aftermarket.” www.smpcorp.com
17Ibid.
18 Datamonitor. “Automotive Aftermarket in the United States.” Industry Profile. November 2008.

8/9/2019 Association Paper Final
http://slidepdf.com/reader/full/association-paper-final 25/65

8/9/2019 Association Paper Final
http://slidepdf.com/reader/full/association-paper-final 26/65
© Center for Automotive Research 2010 17
Several contributing factors are responsible for the current anemic economic situation, yet the
primary culprit tends to be the American housing market and the risky operations that lead to its
growth. The growth of new home sales, boosted by a surge of sub-prime lending practices and
loose regulations, started to decline in some parts of the country by 2006, with widespread
acknowledgement that the previous record growth was unsustainable. In 2007, several leading
economists (including former Federal Reserve Chairman Alan Greenspan) acknowledged that
the end of the housing boom would create economic problems down the road. Yet, the current
issues in the automotive industry that rose from the ashes of the housing bubble are uniquely
two-fold and highly interrelated: a credit crunch and a surplus of vehicles purchased in the early
part of the decade.
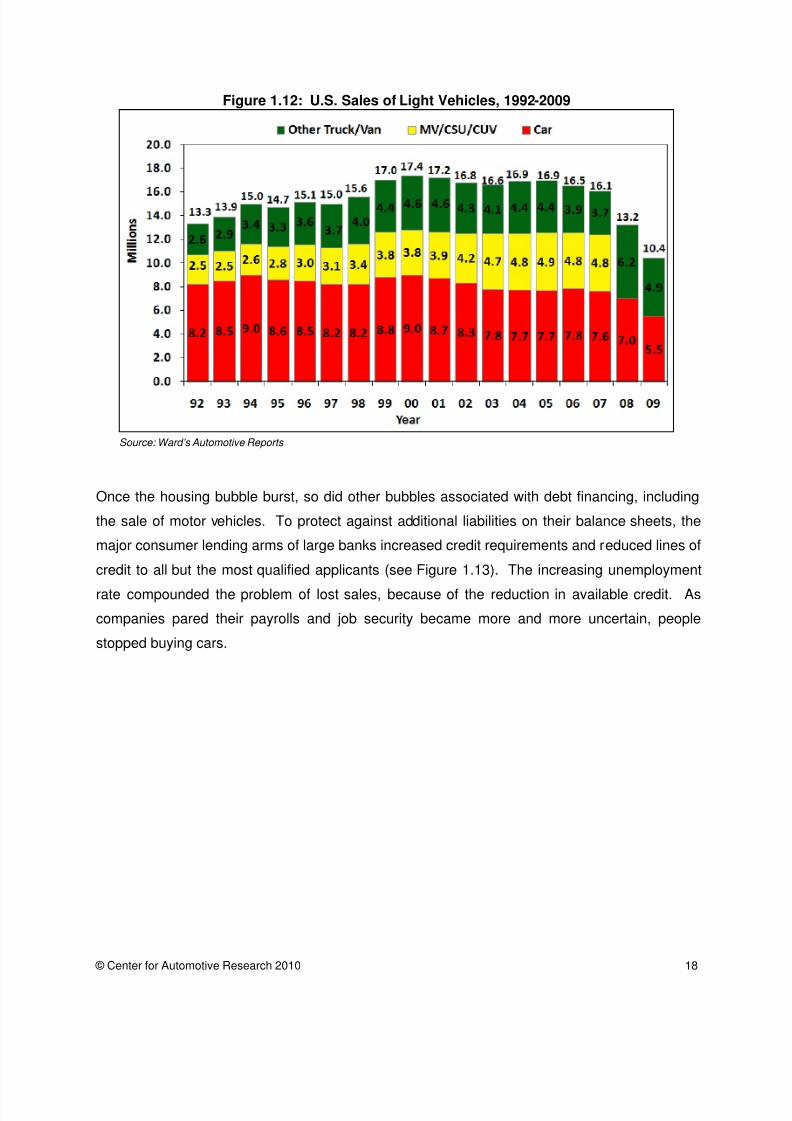
Throughout the early part of this decade, annual motor vehicle sales consistently surpassed 16
million units with a peak of 17.4 million in 2000 (see Figure 1.12). This sales volume enabled
suppliers, dealers, and assemblers to expand capacity into new geographic territory in the U.S.
and invest in new technologies at production facilities. This unprecedented sales activity was
largely supported by: easy access to low interest credit (often through draws on home equity);
an ex-urban housing development movement necessitating increased vehicle ownership; a
booming stock market; post- 9/11 manufacturer incentives; and an enhanced sense of personal
wealth.
It should also be noted that the expansion in production capacity by international and domestic
original equipment manufacturers (OEMs) in the 1990s and early 2000s created the need to
maintain high sales figures. The fixed costs of developing new infrastructure are significant, and
company management understood that long term viability required robust annual sales. Thus,
vehicle incentives were introduced and continued to move product at a brisk pace for many
years.
8/9/2019 Association Paper Final
http://slidepdf.com/reader/full/association-paper-final 27/65
© Center for Automotive Research 2010 18
Figure 1.12: U.S. Sales of Light Vehicles, 1992-2009
Source: Ward’s Automotive Reports
Once the housing bubble burst, so did other bubbles associated with debt financing, including
the sale of motor vehicles. To protect against additional liabilities on their balance sheets, the
major consumer lending arms of large banks increased credit requirements and reduced lines of
credit to all but the most qualified applicants (see Figure 1.13). The increasing unemployment
rate compounded the problem of lost sales, because of the reduction in available credit. As
companies pared their payrolls and job security became more and more uncertain, people
stopped buying cars.

8/9/2019 Association Paper Final
http://slidepdf.com/reader/full/association-paper-final 28/65
© Center for Automotive Research 2010 19
Figure 1.13: Credit Approval for Auto Loans, 2008
Source: CNW Market Research
The severity and permanence of the decline in vehicle sales weighed heavily on the
interconnected automotive chain of parts suppliers, assemblers, and dealerships. A surplus of
assembled vehicles and parts rapidly accumulated, leaving dealers with the problem of finding
buyers to clear these increasingly high levels of inventory. As consumer demands withered, theonce smooth network of accounts payable and receivable between the assemblers, suppliers
and dealers suddenly buckled, creating tremendous strain on the viability of all parties involved.
It is believed vehicle sales may plateau near the fifteen million mark in the foreseeable future;
return to the previous highs will only happen with an increase in the number of households.
Suppliers
In this report, the automotive supplier industry is defined as a large group of independent, non-
OEM, parts producers that sell their finished goods to both domestic and international OEMs, as
well as after-market parts replacement retailers. For the purpose of this study, the automotive
supplier group includes employees beyond NAICS 3363 (the industry classification code for
motor vehicle parts) to account for products developed by other manufacturing industries that
are used in the production of vehicles.
The total direct employment count for 2008 is 685,892 workers; this figure includes employees
associated with manufacturing tires, hoses, hardware, lighting, batteries, and plastics for motor
8/9/2019 Association Paper Final
http://slidepdf.com/reader/full/association-paper-final 29/65
© Center for Automotive Research 2010 20
vehicles. A breakout of the parts sector is available in the appendix and serves as a detailed
reference to illustrate the depth of the motor vehicle parts sector. It also indicates that, without
the inclusion of products like rubber hoses and tires, NAICS 3363 would not be sufficient to fully
describe all products used to manufacture a finished vehicle.
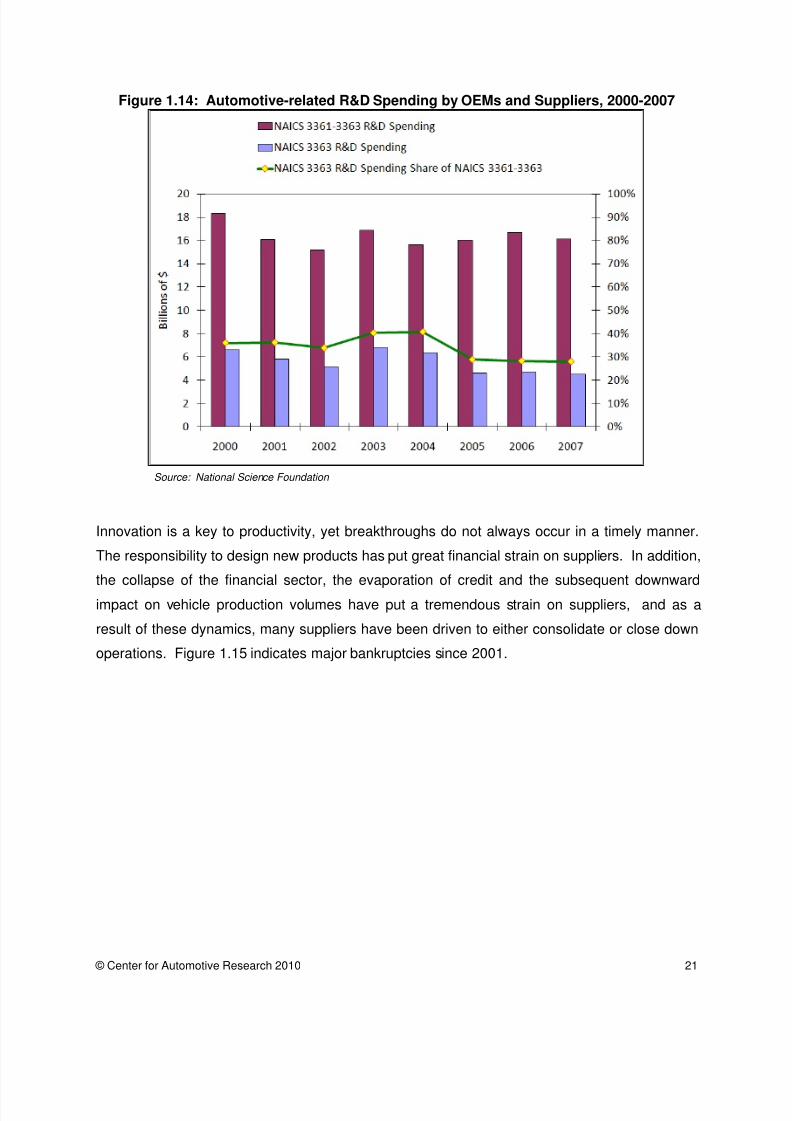
In recent years, the suppliers’ responsibility to add technology and value to the automobile has
grown. Parts R&D, production, and sub-assembly have been shifted onto suppliers, as OEMs ─
facing declining profits and other business operation issues ─have spun off many of their in-
house parts operations. This transition is significant for two reasons: 1) 25-40% of R&D
spending in the automotive industry is now undertaken by the suppliers, and 2) the cost of R&D
was transferred into an industry sector with a large proportion of small- to medium-sized
businesses. The combination of the added pressure to invest in research without an
immediately recognizable revenue stream and the size make-up of suppliers has had
substantial impact on the viability of the supplier sector. It should be noted that not all
automotive R&D has been transferred to the supplier sector; OEMs still largely fund vehicle
engine and transmission design, as well as parts integration R&D for the development of future
model lines.
8/9/2019 Association Paper Final
http://slidepdf.com/reader/full/association-paper-final 30/65
© Center for Automotive Research 2010 21
Figure 1.14: Automotive-related R&D Spending by OEMs and Suppliers, 2000-2007
Source: National Science Foundation
Innovation is a key to productivity, yet breakthroughs do not always occur in a timely manner.
The responsibility to design new products has put great financial strain on suppliers. In addition,
the collapse of the financial sector, the evaporation of credit and the subsequent downward
impact on vehicle production volumes have put a tremendous strain on suppliers, and as a
result of these dynamics, many suppliers have been driven to either consolidate or close down
operations. Figure 1.15 indicates major bankruptcies since 2001.

8/9/2019 Association Paper Final
http://slidepdf.com/reader/full/association-paper-final 31/65
© Center for Automotive Research 2010 22
Figure 1.15: Major Supplier Bankruptcies, 2001-2009
Source: IRN, Wall Street Journal, BankruptcyData.com
Competition from new OEM and supplier facilities owned by Japanese and European
companies operating within the U.S. led to large productivity jumps. According to CAR
research, between 1990 and 2008, motor vehicle parts labor productivity increased 20 percent
more than OEM labor productivity during the same period. Overall, each sector realized at least
a doubling of labor productivity, as measured by output per employee.
Large and expensive investments at both the older domestic facilities and newer supplier
“branch plants” in non-traditional geographic locations paralleled the development of new
foreign-funded facilities. Certainly, some of these investments were necessary and long
overdue; without the rapid improvement in facilities, spurred on by the competition of foreign
investments, the U.S. motor vehicle sector would be far less efficient. Even after accounting for
closures, consolidations and bankruptcies, the end result is a much more skilled and productive
parts sector that has embraced the challenge to innovate.
The diversity of products and occupations in the supplier sector represents robust inter-industry
connections. These connections allow the automotive sector to produce high quality vehicles
that improve the driving experience. In recent years, U.S. suppliers have faced tremendous
adversity in remaining cost competitive with foreign parts suppliers due to higher labor costs and
increases in the cost of metal commodities used to manufacture parts. Acknowledging that

8/9/2019 Association Paper Final
http://slidepdf.com/reader/full/association-paper-final 32/65
© Center for Automotive Research 2010 23
some of the parts operations are moving to low-wage regions across the globe, there still is a
very interesting story to be told regarding interstate expansion across the U.S. Section II will
provide details on the current geographic composition of the U.S. automotive parts sector and
related employment.
Dealers
To the lay person, the automobile dealership is the most visible and tangible component of the
sophisticated automotive manufacturing and distribution system. Dealerships are a perfect
reflection of the fabric of the U.S. ─ family-owned businesses operating in communities across
the nation, for generation after generation. Beyond their heartfelt “American Story” aspect, it is
important to understand the contribution of dealerships to the regional economies and
government revenues, especially given the decline in automobile sales and announced
dealership closures by OEMs.
Even though the bankruptcies of General Motors and Chrysler were structured, their occurrence
shook the foundation of the automotive industry to its core. As assembly facility operations
slowed and ultimately stopped, the fate of franchise dealerships was closely followed in
communities across the nation. According to company restructuring plans, during 2009-2010,
approximately 2,000-plus GM and Chrysler dealerships are scheduled to close. Industry
expectations are that some of the closed dealerships may pick up franchises from other OEMs,
offsetting the losses at GM and Chrysler and creating a smaller net closure effect. Yet, even the
most optimistic assumptions about offsets through new franchise expansion will not sufficiently
dampen the blow to many communities throughout the U.S. To gauge the magnitude of the
planned closures, Figure 1.16 below provides a new-car dealership count of 20,010 as of
January 1, 2009 ─ before the planned closure estimate was announced. A direct count of
736,952 workers, provided by the National Automobile Dealers Association (NADA), was used
to estimate the total employment effects associated with dealership operations in the U.S.

8/9/2019 Association Paper Final
http://slidepdf.com/reader/full/association-paper-final 33/65
© Center for Automotive Research 2010 24
Figure 1.16: Total U.S. New Car Dealerships, 1988-2009
Source: NADA DATA 2009
The abundant supply of dealerships within a very close proximity to one another, provided both
choice and variety for the consumer and permitted highly competitive pricing, as buyers would
routinely visit one dealer after another, haggling over prices and features, before ultimately
making a decision. This model has now become unsustainable, primarily due to the downturn
of the industry and a new topography of dealership locations.
A review of NADA’s volume of new-unit sales by dealership data indicates that the industry has
been trending away from smaller-volume dealerships (150 new vehicle sales per year or less) in
favor of larger-volume establishments (400-plus new vehicle sales per year). Based on GM and
Chrysler company announcements, CAR researchers estimate that the recent wave of closures
associated with the automakers’ restructuring plans now put the estimated number of remaining
automotive dealerships to be in the range of 17,500-18,500.
The plight of dealerships received extensive media coverage and generated a high level of
political activity in Washington D.C. The closure process is still ongoing; if industry sales levels
begin to increase, there is a real potential that some of the dealerships which were consolidated
or closed could be reopened. Congressional activity has also provided glimmers of hope for
some affected dealerships; an amendment has been inserted into an appropriations bill that will

8/9/2019 Association Paper Final
http://slidepdf.com/reader/full/association-paper-final 34/65
© Center for Automotive Research 2010 25
grant dealers a process of binding arbitration to determine whether dealership agreements
terminated by auto manufacturers receiving Federal assistance should be reinstated.
Every state in the nation has new car and used car dealerships operating in its communities.
Their contributions to charities, property tax, and sponsorship of local youth sports teams are
critical to maintaining a high quality of life in towns and cities across the nation. These
contributions should be considered when assessing the value of dealerships to regional
economies and communities.
A Look into the Future: Sales Rebound
High unemployment, at the current (November 2009) rate of 10%, continues to affect the
rebound of the auto industry. Employment, income stability and consumer confidence are major
determining factors in the purchase of durable goods like automobiles. Due to economic
concerns and more durable components, the natural rate of vehicle replacement is being
strained as households are stretching the useful life of a vehicle. The higher acquisition rate of
new vehicles ─ witnessed during the mid-2000s due to the stock market performance, draws on
home equity, and multiple workers in households necessitating multiple vehicles ─ may not return
for quite some time. Recovery will occur, but most economists and industry experts believe it
will be several years before the industry reaches 15 million units of sales. Current estimates for
2010 sales range from 12.0 to 13.2 million units.
Incentives
In addition to the bankruptcy and restructuring activity during the summer of 2009, the U.S.Federal government also intervened in the U.S. auto sales market by introducing the Car
Allowance Rebate System, commonly referred to as the Cash for Clunkers program. Congress
appropriated $3 billion for this program; the impact on new vehicle sales proved to be immediate
and significant. Roughly 690,000 eligible vehicles were turned in by consumers who then
received either a $3500 or a $4500 voucher to use towards the purchase or lease of a new,
fuel- efficient vehicle.

8/9/2019 Association Paper Final
http://slidepdf.com/reader/full/association-paper-final 35/65
© Center for Automotive Research 2010 26
Figure 1.17: New Vehicle Sales by Month, November 2008-November 2009
Source: Automotive News Data Center
The program ran during the months of July and August and generated new vehicle sales of
998,000 units and 1,262,000 units respectively. Cash for Clunkers had a large stimulating effect
on the industry as dealers sold hundreds of thousands of additional vehicles beyond the norm
for this time of year. The higher than anticipated new vehicle sales created a tax revenue boost
that helped states’ finances.
According to the most recent estimate released by the Bureau of Economic Analysis, the real
gross domestic product (the output of goods and services produced by labor and property
located in the U.S.) increased at an annual rate of 2.8 percent in the third quarter of 2009.
Motor vehicle output added a robust 1.45 percentage points to the third-quarter change in real
GDP. Although the program is no longer in effect, the positive ripple effects have lead to
companies revising their production plans upwards. Based upon company announcements and
additional research, it is CAR’s expectation that strong motor vehicle production and
employment figures will be observed in the fourth quarter of 2009 and first quarter of 2010.Whether an additional round of stimulus is needed remains to be determined, but it is clear that
the Cash for Clunkers program successfully boosted 2009 annual sales, added tax revenues to
states’ treasuries, contributed to the first positive GDP change since the second quarter of 2008,
and gave hope to an industry that was teetering on the edge of collapse.

8/9/2019 Association Paper Final
http://slidepdf.com/reader/full/association-paper-final 36/65

8/9/2019 Association Paper Final
http://slidepdf.com/reader/full/association-paper-final 37/65
© Center for Automotive Research 2010 28
SECTION II - Estimates of the Economic Contribution of the Motor Vehicle Industry to the Economies of the United States and Individual State Economies
The tables in this section detail the estimated employment contributions to the economies of
each of the 50 states, and the country as a whole, by the U.S. motor vehicle industry.
Employment estimates are broken out by direct employment (people employed directly by
automotive companies); intermediate employment (people employed by suppliers to the motor
vehicle industry); and spin-off employment (expenditure-induced employment resulting from
spending by direct and intermediate employees).
Employment and income estimates are derived from analyses using a regional economic model,
supplied by Regional Economic Models, Inc. (REMI), of Amherst, MA. The model and
methodology used will be further discussed in a later section. The employment and
compensation data used to perform the research were provided by motor vehicle companies or
gathered through publicly available data; the intermediate and spin-off effects were generated
by the model. The remaining data on the U.S. economy and the automotive industry were
collected by CAR from a wide variety of publicly available sources, listed in the Reference
section. Direct employment data include headquarters, office, research, design and
development, manufacturing, assembly and logistics job classifications. All employment
numbers cited below are rounded to the nearest thousand; income and tax receipt numbers are
also rounded.
Vehicle Manufacturer Activities
Complete U.S. automotive manufacturing and related operations employment and payroll data
supplied by the OEMs totaled 313,000 employees. Employment and payroll data was coded
(according to NAICS) into multiple job-type categories for input into the model — motor vehicle
and motor vehicle parts manufacturing (category numbers: NAICS 3361-3363); management of
companies (NAICS 551); professional, scientific and technical services (NAICS 541); securities,
commodity contracts and investments (NAICS 523); warehousing and storage (NAICS 493);
administrative services, facilities and support services (NAICS 521) and wholesale trade
(NAICS 42).
As can be seen in Table 2.1, there are 1,067,000 intermediate jobs that support the direct
employment in the industry (suppliers of goods and services). The spin-off jobs associated with
spending (from the people who work in the direct and intermediate jobs) add another 1,765,000
jobs, bringing the total jobs associated with motor vehicle manufacturing activities in the United
States (direct plus intermediate plus spin-off) to nearly 3,145,000 jobs. The ratio of total jobs

8/9/2019 Association Paper Final
http://slidepdf.com/reader/full/association-paper-final 38/65

8/9/2019 Association Paper Final
http://slidepdf.com/reader/full/association-paper-final 39/65
© Center for Automotive Research 2010 30
needed to design, produce and sell motor vehicles. This can be broadly considered the
automotive/supplier network. This supply network consists of the first tier suppliers who supply
parts and services directly to vehicle assemblers along with the lower tier suppliers who supply
the basic materials and services to the first tier group. Some of these companies supply basic
commodities and can be several steps removed from the vehicle design and manufacturing
process.
Table 2.2: Intermediate and Spin-off Employment Contribution of Original EquipmentManufacturer-related Operations in the U.S.
Economic Impact Intermediate Spin-off
Manufacturing 192,150 328,188
Primary metal mfg 15,798 26,692
Fabricated metal prod mfg 39,000 42,530
Motor vehicle parts mfg 79,973 130,966
Plastics, rubber prod mfg 14,751 15,789
Other Manufacturing 42,628 112,211
Non-Manufacturing 875,171 1,436,455
Professional and Technical Services 154,130 88,362
Administration and Services 159,400 35,485
Wholesale Trade 86,190 61,670
Retail Trade 110,090 214,710Transportation, Warehousing 50,920 82,399
Finance, Insurance 56,960 73,920
Management of Companies 30,623 14,534
Other Services (excluding Government) 90,615 106,166
Other Non-Manufacturing 136,243 759,209
Total 1,067,321 1,764,643
Note: Due to rounding, columns or rows may not sum exactly.
At the automotive manufacturing facility, primary assemblers require plastic and metallic parts,
electronic components, and other materials to produce vehicles; it is these intermediate
demands, satisfied by a vast area of specialized manufacturers, that form the basis of U.S.
intermediate employment impacts. As shown in Table 2.2, CAR finds 192,000 intermediate jobs
in the manufacturing sector, primarily in the industries necessary to produce automobiles—parts
manufacturing with 80,000 jobs (many, Tier 1 suppliers), 16,000 jobs in primary metal

8/9/2019 Association Paper Final
http://slidepdf.com/reader/full/association-paper-final 40/65
© Center for Automotive Research 2010 31
manufacturing, 39,000 in fabricated metal products manufacturing, and 15,000 in plastics and
rubber products manufacturing. These employees are manufacturing the parts and components
necessary to produce the services and material inputs at assembly operations; the numbers do
not include any of the 313,000 people directly employed by the OEMs. There are an additional
43,000 people employed in other manufacturing industries.
The bulk of employment in the intermediate category is in the non-manufacturing sector, totaling
875,000 jobs. Industries within this category are not normally thought to be associated with
automobile manufacturing in such high numbers. However, as a result of the separation of the
complete vehicle design and parts manufacturing processes (from the automobile
manufacturing company to the supplier sector), many more distinct industries have become
major suppliers to the automobile industry. Industries of note in the non-manufacturing category
are professional and technical services employing 154,000; administration and services,
159,000 jobs; wholesale trade, 86,000 jobs; and finance and insurance, 57,000 jobs.
Table 2.2 shows there are 1,765,000 total spin-off jobs associated with U.S. automobile
manufacturing operations. These are expenditure-induced jobs, created as a result of spending
by the people employed in the direct and intermediate categories. As could be expected, a
large portion of the spin-off jobs are in the non-manufacturing sector of retail trade, which
employs 215,000 people. When employees use their paychecks to purchase goods (including
electronics equipment, clothing, food, and even new automobiles), employment is created to
supply their demands. Table 2.2 shows there are 131,000 jobs related to manufacturing motor
vehicles and parts as a result of employee demand in the direct and intermediate sectors. This
employment number does not include any of the 313,000 jobs at the OEMs which have been
accounted for in the direct employment category.
8/9/2019 Association Paper Final
http://slidepdf.com/reader/full/association-paper-final 41/65
© Center for Automotive Research 2010 32
Parts and Supplier Activities
The motor vehicle parts manufacturing industry includes: light vehicle original equipment parts
manufacturers, medium and heavy duty original equipment parts manufacturers and aftermarket
parts manufacturers (NAICS 3363). Many of the suppliers in this industry group manufacture
parts for all three segments.
Employment estimates are broken out by direct employment (people employed directly by parts
manufacturers); intermediate employment (people employed by those who provide goods and
services to parts manufacturers); and spin-off employment (expenditure-induced employment
resulting from spending by direct and intermediate employees).
The aftermarket manufacturers’ direct employment data are included in this analysis only if the
industry group supplied parts necessary for the maintenance of the motor vehicle or the
replacement of original equipment on the motor vehicle. The suppliers of tools and other related
equipment needed to maintain motor vehicles are not included in the aftermarket segment for
this analysis.
The employment and compensation data used to perform the research were collected by CAR
from a wide variety of publicly available sources, listed in the Reference section. All
employment numbers cited below are rounded to the nearest thousand, while exact figures are
provided in detailed tables; income and tax receipts numbers are also rounded.
In addition to automotive parts manufacturers as defined by NAICS 3363, several other
industries classified by other NAICS codes manufacture parts and components for motor vehicle
assemblers. Direct employment by the subsectors of these industries that manufacture
exclusively for the motor vehicle industry is included in this analysis. These industries are:
• tire manufacturing (NAICS 32621);
• hose manufacturing for on- and off-highway motor vehicles (made of rubber and other
materials —including plastics and nylon) (NAICS 3262203);
• transportation fabricated plastics products manufacturing (excluding foam and reinforced
plastics) (NAICS 3261991);
• motor vehicle hardware manufacturing (lock units, door and window handles, window
regulators, hinges, license plate brackets, etc.) (NAICS 3325106);
• motor vehicle instruments manufacturing (NAICS 3345145);
• motor vehicle light bulbs manufacturing (NAICS 3351101);

8/9/2019 Association Paper Final
http://slidepdf.com/reader/full/association-paper-final 42/65
© Center for Automotive Research 2010 33
• motor vehicle batteries manufacturing (NAICS 3359111); and
• other truck and vehicle bodies for sale including dump truck mechanisms and kit cars
(NAICS 3362115).
For the purposes of this report, this aggregation of industries will be referred to as motor vehiclesuppliers.
The aggregate direct employment in this motor vehicle suppliers’ industry group is 686,000
people. Employees in the various industries used to compile the industry group are as follows:
• 522,000 in motor vehicle parts manufacturing,22
• 62,000 in motor vehicle plastics manufacturing,
• 52,000 in motor vehicle tires manufacturing,
• 7,000 in motor vehicle instrument manufacturing,
• 11,000 in motor vehicle battery manufacturing,
• 12,000 in other motor vehicle bodies manufacturing,
• 12,000 in motor vehicle hardware manufacturing,
• 6,000 in motor vehicle hose manufacturing, and
• 2,000 in motor vehicle light bulb manufacturing.
A great deal of attention was given to determining the direct employment numbers for each of
the 8 additional industries to avoid the possibility of double counting (1 job being counted twice
in the final employment estimates). The methodology section of this report provides greater
detail on calculation methods used to avoid double counting direct, indirect and spin-off
employment impacts.
As can be seen in Table 2.3, there are 899,000 intermediate jobs that support direct
employment in the industry (suppliers of goods and services to parts manufacturers). The spin-
off jobs associated with spending (from the people who work in the direct and intermediate jobs)add another 1,702,000 jobs, bringing the total jobs associated with motor vehicle parts
manufacturing activities in the United States (direct plus intermediate plus spin-off) to 3,286,000
22 This employment number does not include any captive parts suppliers within the automotive manufacturing operations —such as stamping,
transmissions, and engines manufacturing —at original equipment manufacturers (OEMs). These parts manufacturing employees at the OEMsare considered to be motor vehicle manufacturing employees.

8/9/2019 Association Paper Final
http://slidepdf.com/reader/full/association-paper-final 43/65
© Center for Automotive Research 2010 34
jobs. The ratio of total jobs created to direct employment produces an employment multiplier,
which for motor vehicle parts manufacturing is 4.8 (3,286,000 ÷ 686,000). This means there are
nearly 4 additional jobs in the U.S. economy for every 1 job in parts manufacturing operations.
Compensation in the private sector associated with total jobs (direct plus intermediate plus spin-
off) amounts to nearly $217 billion. Estimated personal taxes to be paid resulting from
employment in automotive manufacturing operations are $30 billion.
Table 2.3: Total Contribution of Motor Vehicle Suppliers and Parts Manufacturer-relatedOperations to the Economy in the United States
Economic Impact
Employment
Direct 685,892
Intermediate 898,614
Total (Direct + Intermediate) 1,584,506
Spin-off 1,701,816
Total (Direct + Intermediate + Spin-off) 3,286,322
Multiplier: (Direct + Intermediate + Spin-off)/Direct 4.8
Compensation ($billions nominal) 216.78
Less: transfer payments & social insurance contributions -28.10
Less: personal income taxes -30.46
Equals private disposable personal income ($billions
nominal) 158.20
Contribution as % of total private economy
Employment 1.8
Compensation 1.4
To put the compensation and employment numbers in context, the direct, intermediate, and
spin-off jobs associated with U.S. parts and supplier operations account for nearly 2 percent of
employment in the entire U.S. economy and nearly 1.5 percent of total U.S. compensation.
This section provides an update to an earlier study by CAR, “The Contribution of the Motor
Vehicle Supplier Sector to the Economies of the United States and Its Fifty States“, which in
2007, was the first comprehensive analysis of the estimated economic contribution associated
with the activities of the motor vehicle parts and supplier industries in the United States. The
tables in this section update the original analysis and provide further insight into this broad
industry.

8/9/2019 Association Paper Final
http://slidepdf.com/reader/full/association-paper-final 44/65
© Center for Automotive Research 2010 35
Since the 2007 study, parts and supplier companies have lost nearly 15% of their direct
employees. This is due to increases in productivity, off-shoring and outsourcing (often
overseas), and the often weaker (than OEMs) financial positions of supplier companies. The
most significant change, however, is in the number of intermediate jobs, which have been
reduced by more than half, as can be seen in Table 2.4. These are the suppliers to motor
vehicle parts supply operations, and can be thought of as lower tier automotive suppliers. Many
of these companies manufacture for other industries. However, many of them are likely very
small, local companies, disproportionately affected by the recession in 2008 and 2009.
Table 2.4: Employment by Parts Manufacturing and Supplier Operations, 2007 vs. 2009
2009
Results
2007
Results
Employment (1000s)
Direct 686 783Indirect 899 1,972
Expenditure-induced 1,702 1,705
Total (direct + indirect + expenditure-induced) 3,286 4,460
Multiplier 4.8 5.7
Contribution as % of total U.S. economy
Employment 1.8% 2.9%
Compensation (Personal Income) 1.4% 2.2%
These intermediate jobs have traditionally been the most vulnerable to pressures faced by the
motor vehicle industry because they are jobs located in smaller firms that have less access to
capital and government programs. To survive, these firms are the first and the fastest to cut
operations (e.g. jobs). These intermediate firms are highly likely to suffer job losses due to their
customers’ sourcing of products from overseas. Firms in this segment of the industry are also
prone to bankruptcy or acquisition by larger companies–suffering job losses in the process.
For those companies that have survived and maintained employment levels, compensationremains solid, as can be seen in the numbers of expenditure-induced jobs that remain in the
economy from the spending by direct and intermediate employees.
Intermediate and Spin-off Employment by Occupation
Table 2.5 below provides a more detailed look at the intermediate and spin-off employment
associated with parts and supplier operations. In the intermediate employment category, there

8/9/2019 Association Paper Final
http://slidepdf.com/reader/full/association-paper-final 45/65
© Center for Automotive Research 2010 36
are 899,000 jobs spread across numerous manufacturing and non-manufacturing industries. As
discussed earlier, the intermediate category captures the employment necessary to satisfy parts
manufacturers’ and suppliers’ demands for the materials and services needed to produce and
sell parts, components and supplies to the OEMs. Due to the demands of one industry on other
industries, many jobs are created across the economy by the motor vehicle parts suppliers.
Fifteen percent of the estimated intermediate and spin-off jobs are in manufacturing. There are
a substantial number of jobs estimated to be in other sectors; an estimated 23 percent of the
jobs are located in the business and professional services sector, 29 percent in the education,
health and personal services sectors, 22 percent in the retail or wholesale trade, warehousing,
and transportation sectors, and the remaining 11 percent of the jobs are in the raw materials or
construction sectors.
Table 2.5: Intermediate and Spin-off Employment from Motor Vehicle Suppliers and Parts
Manufacturer-related Operations in the U.S.
Economic Impact Intermediate Spin-off
Manufacturing 145,100 235,200
Primary metal mfg 35,200 65,300
Fabricated metal prod mfg 44,700 43,600
Plastics, rubber prod mfg 16,200 15,100
Electrical or computer products 3,200 20,700
Motor vehicle parts mfg 14,500 7,100
Other Manufacturing 31,300 83,400
Non-Manufacturing 753,400 1,466,600
Professional and Technical Services 141,200 86,300
Administration and Services 145,500 34,900
Wholesale Trade 83,000 60,400
Retail Trade 75,900 220,000
Transportation, Warehousing 52,600 83,100
Finance, Insurance 54,000 72,000
Management of Companies 35,800 18,200
Other Services 142,600 618,600
Other Non-Manufacturing 22,800 273,100
Total 898,500 1,701,800
Note: Due to rounding, columns or rows may not sum exactly. The bulk of the employment in the intermediate category is in the non-manufacturing sector,
totaling 753,000 jobs. As mentioned earlier, industries within this intermediate category are not
normally thought to be associated with automobile parts manufacturing and supply in such high

8/9/2019 Association Paper Final
http://slidepdf.com/reader/full/association-paper-final 46/65
© Center for Automotive Research 2010 37
numbers. However, as a result of the separation of the complete vehicle design and parts
manufacturing processes from within the automobile manufacturing company to the supplier
sector, many more distinct industries have become major suppliers to the automobile industry.
Industries of note in the non-manufacturing category are professional and technical services
which employ 141,000; administration and services, 146,000 jobs; wholesale trade, 83,000 jobs;
and finance and insurance, 54,000 jobs.
Table 2.5 shows there are 1,702,000 total spin-off jobs associated with U.S. automobile parts
manufacturing operations. These are expenditure-induced jobs which are the explicit result of
spending by the people employed in the direct and intermediate categories. As could be
expected, a large portion of the spin-off jobs are in the non-manufacturing sector of retail trade,
which employs 220,000 people and in service industries, which employ nearly 620,000 people.
Automobile Dealerships
Auto assembly operations and motor vehicle parts manufacturing operations are business
operations often clustered together within certain areas in manufacturing-oriented regions of the
country. Auto dealerships, on the other hand, are found in nearly every community across the
country–in rural and urban areas alike. Just as the manufacturing segment of the motor vehicle
industry has suffered in the recent economic downturn, the retail and service segment of the
industry has also incurred heavy losses. If the amount of column space in news media is
considered a measure of issues of importance, the economic and cultural impact of the
downturn on auto dealerships did not go unnoticed anywhere. The omnipresence of auto
dealerships in communities across the U.S. allow for a deep connection between their business
operations and civic events. “If there were a competitive event to measure the philanthropy of
businesses in America, the local car dealer would always take the top prize. If you go to a Little
League or youth hockey game or any other locally organized sporting event, the sponsors
always seem to be local auto dealers.”23
The tables in this section detail the estimated employment contributions by new vehicle dealer
operations to the economies of each of the 50 states and the country as a whole. Employment
estimates are broken out by direct employment (people employed directly by dealerships);intermediate employment (people employed by those who provide goods and services,
excepting inventory, to dealerships); and spin-off employment (expenditure-induced
employment resulting from spending by direct and intermediate employees).
23 Automotive News. Keith Crain, “Closing Dealerships? Be Careful”. September 7, 2009. P. 12.
8/9/2019 Association Paper Final
http://slidepdf.com/reader/full/association-paper-final 47/65
© Center for Automotive Research 2010 38
Employment and income estimates are derived from analyses using the REMI model mentioned
earlier. The employment and compensation data used to perform the research was provided by
the National Automobile Dealers Association (NADA); the intermediate and spin-off effects were
generated by the model. The remaining data on the U.S. economy and the automotive industry
was collected by CAR from a wide variety of publicly available sources, which are listed in the
Reference section. All employment numbers cited below are rounded to the nearest thousand;
income and tax receipt numbers are also rounded.
Complete U.S. automotive dealership employment (for new vehicle sales) totaled 737,000
employees. As can be seen in Table 2.6, there are 239,000 intermediate jobs that support
direct employment in the industry (suppliers of goods and services, not including motor vehicle
inventory). The spin-off jobs associated with spending (from the people who work in the direct
and intermediate jobs) add another 552,000 jobs, bringing the total jobs associated with new
motor vehicle retail operations in the United States (direct plus intermediate plus spin-off) to
more than one and a half million jobs. The ratio of total jobs created to direct employment
produces an employment multiplier for motor vehicle retail operations; this number is 2.1
(1,528,700 ÷ 737,000). This multiplier of 2.1 means there is slightly more than 1 additional job in
the U.S. economy for every 1 job in automobile dealership operations.
Compensation in the private sector associated with total jobs (direct plus intermediate plus spin-
off) amounts to $90 billion. Estimated personal taxes to be paid resulting from employment in
automotive manufacturing operations are $13 billion.

8/9/2019 Association Paper Final
http://slidepdf.com/reader/full/association-paper-final 48/65
© Center for Automotive Research 2010 39
Table 2.6: Total Contribution of New Motor Vehicle Dealership Operations to theEconomy in the United States
Economic Impact
Employment
Direct 736,952
Intermediate 239,356
Total (Direct + Intermediate) 976,308
Spin-off 552,348
Total (Direct + Intermediate + Spin-off) 1,528,656
Multiplier: (Direct + Intermediate + Spin-off)/Direct 2.1
Compensation ($billions nominal) 90.600
Less: transfer payments & social insurance contributions -9.716Less: personal income taxes -13.440
Equals private disposable personal income ($billions
nominal) 67.444
Contribution as % of total private economy
Employment 0.9
Compensation 0.7
The direct, intermediate, and spin-off jobs associated with U.S. auto dealerships account for
nearly 1 percent of employment in the entire U.S. economy and nearly 1 percent of total U.S.
compensation.
Table 2.7 provides a more detailed look at the intermediate and spin-off employment associated
with dealership operations. In the intermediate employment category, there are 239,000 jobs
spread across numerous industries.
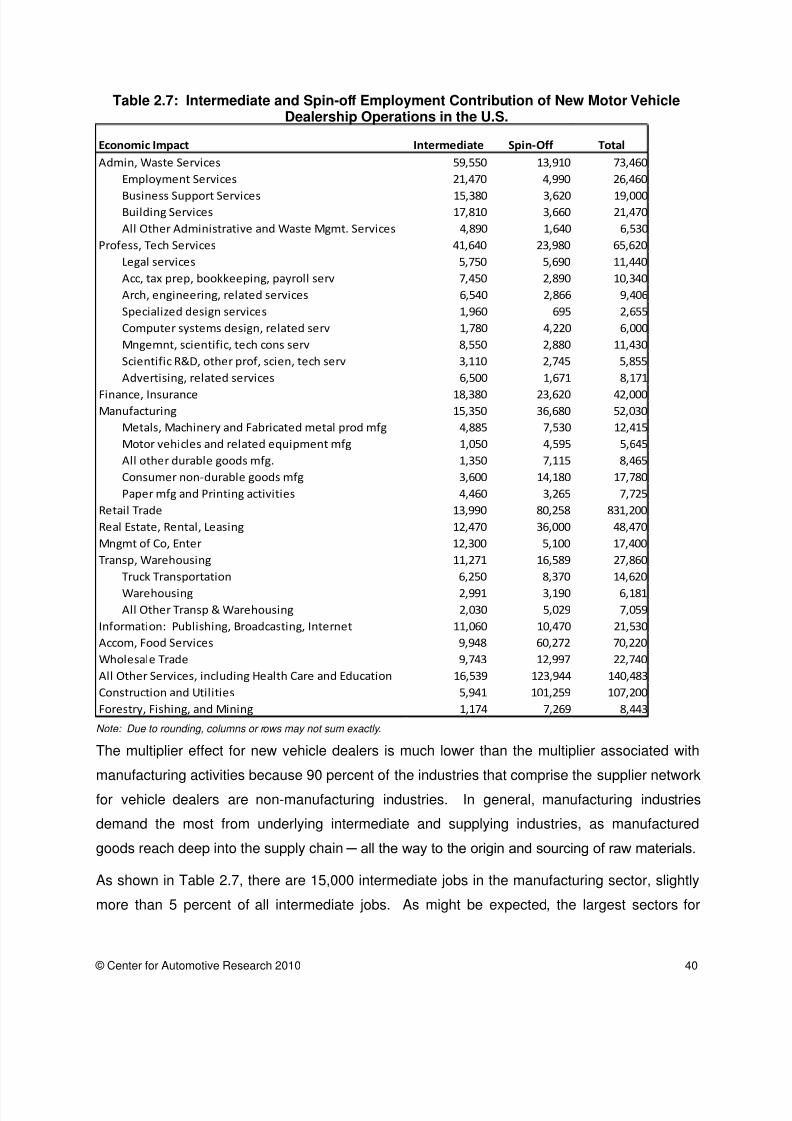
8/9/2019 Association Paper Final
http://slidepdf.com/reader/full/association-paper-final 49/65
© Center for Automotive Research 2010 40
Table 2.7: Intermediate and Spin-off Employment Contribution of New Motor VehicleDealership Operations in the U.S.
Economic Impact Intermediate Spin-Off Total
Admin, Waste Services 59,550 13,910 73,460
Employment Services 21,470 4,990 26,460
Business Support Services 15,380 3,620 19,000Building Services 17,810 3,660 21,470
All Other Administrative and Waste Mgmt. Services 4,890 1,640 6,530
Profess, Tech Services 41,640 23,980 65,620
Legal services 5,750 5,690 11,440
Acc, tax prep, bookkeeping, payroll serv 7,450 2,890 10,340
Arch, engineering, related services 6,540 2,866 9,406
Specialized design services 1,960 695 2,655
Computer systems design, related serv 1,780 4,220 6,000
Mngemnt, scientific, tech cons serv 8,550 2,880 11,430
Scientific R&D, other prof, scien, tech serv 3,110 2,745 5,855
Advertising, related services 6,500 1,671 8,171
Finance, Insurance 18,380 23,620 42,000
Manufacturing 15,350 36,680 52,030
Metals, Machinery and Fabricated metal prod mfg 4,885 7,530 12,415
Motor vehicles and related equipment mfg 1,050 4,595 5,645
All other durable goods mfg. 1,350 7,115 8,465
Consumer non-durable goods mfg 3,600 14,180 17,780
Paper mfg and Printing activities 4,460 3,265 7,725
Retail Trade 13,990 80,258 831,200
Real Estate, Rental, Leasing 12,470 36,000 48,470
Mngmt of Co, Enter 12,300 5,100 17,400
Transp, Warehousing 11,271 16,589 27,860
Truck Transportation 6,250 8,370 14,620
Warehousing 2,991 3,190 6,181
All Other Transp & Warehousing 2,030 5,029 7,059
Information: Publishing, Broadcasting, Internet 11,060 10,470 21,530
Accom, Food Services 9,948 60,272 70,220
Wholesale Trade 9,743 12,997 22,740
All Other Services, including Health Care and Education 16,539 123,944 140,483
Construction and Utilities 5,941 101,259 107,200
Forestry, Fishing, and Mining 1,174 7,269 8,443
Note: Due to rounding, columns or rows may not sum exactly. The multiplier effect for new vehicle dealers is much lower than the multiplier associated with
manufacturing activities because 90 percent of the industries that comprise the supplier network
for vehicle dealers are non-manufacturing industries. In general, manufacturing industries
demand the most from underlying intermediate and supplying industries, as manufactured
goods reach deep into the supply chain ─ all the way to the origin and sourcing of raw materials.
As shown in Table 2.7, there are 15,000 intermediate jobs in the manufacturing sector, slightly
more than 5 percent of all intermediate jobs. As might be expected, the largest sectors for

8/9/2019 Association Paper Final
http://slidepdf.com/reader/full/association-paper-final 50/65
© Center for Automotive Research 2010 41
intermediate jobs (recalling that intermediate jobs comprise the supplier network for dealerships)
are business services. Administrative services; waste management; professional, technical and
management services real estate; finance; and insurance and information providers together
encompass two-thirds of all intermediate jobs. These people are providing the services
necessary for retail dealerships to operate.
Tables 2.7 and 2.8 show there are 552,000 total spin-off jobs associated with U.S. automobile
dealer operations. These are expenditure-induced jobs, created as a result of spending by the
people employed in the direct and intermediate categories. A large portion of the spin-off jobs
are in the non-manufacturing sector of retail trade, which employs 80,000 people. The largest
sector for spin-off jobs is the service sector. Service providers of education, health care, arts
and entertainment, construction and utility services, restaurant and accommodation providers
and government jobs account for half of all spin-off jobs.
New vehicle dealer employment figures for each of the 50 states and national employment
results are shown in Table 2.8. Direct dealer employment and total employment figures in the
states (direct + intermediate + spin-off) closely correlate to the population of each of the states,
as more vehicle dealerships are needed to service larger populations. However, intermediate
employment does not mirror the states’ populations. Rather, as with the manufacturing
operations, the locations of suppliers with respect to dealerships are a result of factors other
than state population. Therefore, an even dispersion of supplier jobs across the states is not to
be expected.

8/9/2019 Association Paper Final
http://slidepdf.com/reader/full/association-paper-final 51/65
© Center for Automotive Research 2010 42
Table 2.8: Dealership Employment by StateState Direct Indirect Spin-off TOTAL
Alabama 11,064 2,564 7,791 21,419
Alaska 1,532 438 1,085 3,055
Arizona 17,901 6,920 15,337 40,159
Arkansas 5,863 1,370 4,773 12,006
California 85,383 39,095 60,862 185,340
Colorado 11,551 4,897 10,997 27,444
Connecticut 9,616 2,619 6,840 19,076
Delaware 2,938 657 1,997 5,592
District of Columbia 21 481 1,898 2,401
Florida 51,775 20,327 39,476 111,578
Georgia 22,614 7,900 17,912 48,426
Hawaii 3,000 1,026 2,159 6,185
Idaho 3,884 1,061 3,330 8,275
Illinois 30,293 10,977 21,718 62,989
Indiana 15,084 3,561 11,034 29,679
Iowa 7,933 1,652 5,812 15,397
Kansas 6,846 1,496 4,787 13,129
Kentucky 8,589 1,948 6,336 16,873
Louisiana 10,913 2,930 8,225 22,068
Maine 3,693 854 2,831 7,378
Maryland 16,474 3,957 11,088 31,520
Massachusetts 15,278 5,529 11,921 32,728
Michigan 23,947 6,359 15,641 45,947
Minnesota 12,913 4,566 9,491 26,970
Mississippi 5,684 1,046 4,412 11,142
Missouri 14,657 4,116 11,103 29,876
Montana 2,599 540 2,127 5,266
Nebraska 4,627 1,157 3,333 9,117
Nevada 6,767 2,728 8,109 17,605
New Hampshire 4,639 935 3,577 9,151
New Jersey 21,410 5,705 16,322 43,437
New Mexico 4,941 1,082 3,505 9,529
New York 32,793 12,783 27,354 72,930North Carolina 22,538 6,514 16,381 45,434
North Dakota 2,179 372 1,454 4,006
Ohio 28,565 8,198 18,946 55,708
Oklahoma 8,675 2,048 6,058 16,781
Oregon 9,303 3,021 6,511 18,834
Pennsylvania 33,415 8,307 22,696 64,418
Rhode Island 2,269 607 1,803 4,679
South Carolina 10,408 2,411 8,044 20,863
South Dakota 2,365 390 1,723 4,478
Tennessee 15,164 4,288 12,882 32,334
Texas 59,209 21,759 45,371 126,339
Utah 5,971 2,512 6,052 14,535
Vermont 1,905 338 1,558 3,802
Virginia 21,557 5,522 15,179 42,257Washington 15,339 5,178 10,037 30,554
West Virginia 4,079 521 2,696 7,296
Wisconsin 15,229 3,843 10,257 29,329
Wyoming 1,559 244 1,521 3,324
TOTAL U.S. 736,952 239,352 552,352 1,528,656
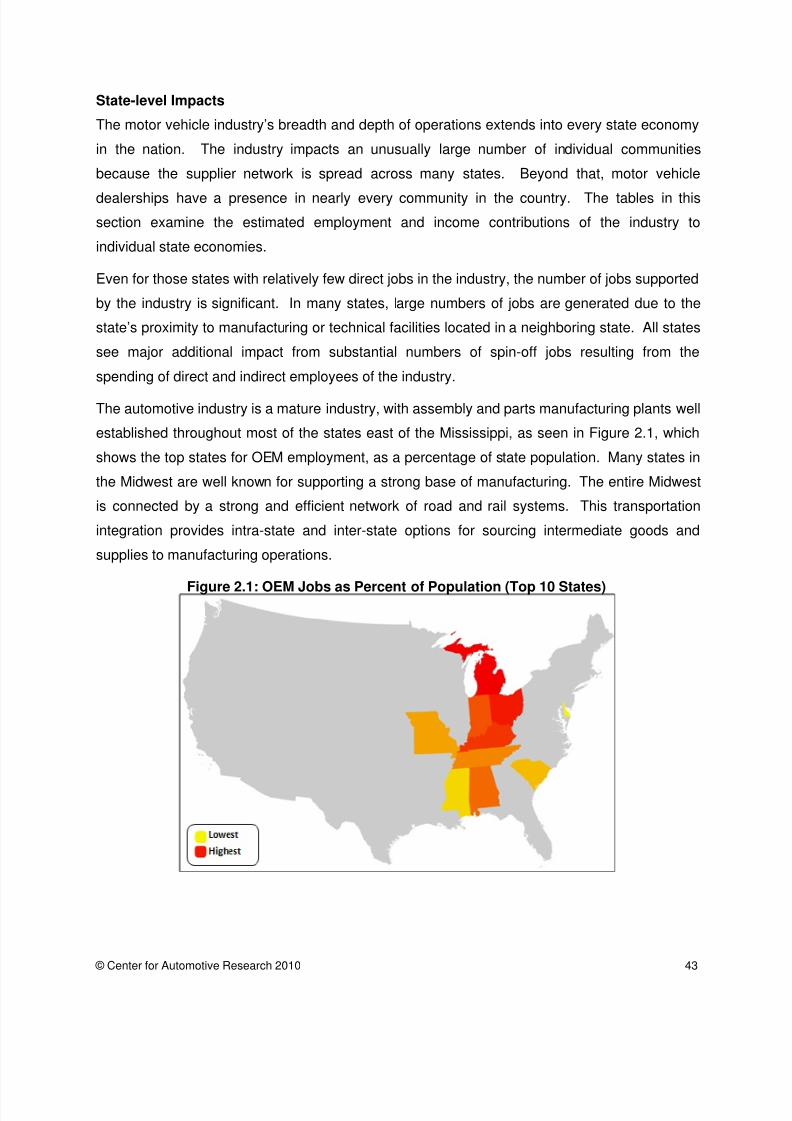
8/9/2019 Association Paper Final
http://slidepdf.com/reader/full/association-paper-final 52/65
© Center for Automotive Research 2010 43
State-level Impacts
The motor vehicle industry’s breadth and depth of operations extends into every state economy
in the nation. The industry impacts an unusually large number of individual communities
because the supplier network is spread across many states. Beyond that, motor vehicle
dealerships have a presence in nearly every community in the country. The tables in this
section examine the estimated employment and income contributions of the industry to
individual state economies.
Even for those states with relatively few direct jobs in the industry, the number of jobs supported
by the industry is significant. In many states, large numbers of jobs are generated due to the
state’s proximity to manufacturing or technical facilities located in a neighboring state. All states
see major additional impact from substantial numbers of spin-off jobs resulting from the
spending of direct and indirect employees of the industry.
The automotive industry is a mature industry, with assembly and parts manufacturing plants well
established throughout most of the states east of the Mississippi, as seen in Figure 2.1, which
shows the top states for OEM employment, as a percentage of state population. Many states in
the Midwest are well known for supporting a strong base of manufacturing. The entire Midwest
is connected by a strong and efficient network of road and rail systems. This transportation
integration provides intra-state and inter-state options for sourcing intermediate goods and
supplies to manufacturing operations.
Figure 2.1: OEM Jobs as Percent of Population (Top 10 States)

8/9/2019 Association Paper Final
http://slidepdf.com/reader/full/association-paper-final 53/65
© Center for Automotive Research 2010 44
It is this broad, efficient network of suppliers (located across many states) which leads to the
dispersion of total employment contributions from manufacturing operations to all areas of the
nation. Figure 2.2 below shows the impact of employment in the industry for motor vehicle
assemblers, parts, systems and components manufacturers, motor vehicle dealerships, and the
suppliers to these operations. This map does not include expenditure-induced employment. It
is a portrayal of the direct impacts of employment and suppliers to the industry. As can be
seen, the industry provides significant numbers of jobs to every state in the nation.
Each individual state’s economic impact is one effect of the total contribution of the industry to
the nation. That is, jobs in one state are not only attributable to investment in that state, but are
supported by the auto industry’s investments and activities in nearby states as well. Therefore,
an employment multiplier is not calculated for any individual state. Employment multipliers
apply to the national economy and are not applicable to, nor can be derived from, any one
state’s economy.
Figure 2.2: Automotive Industry Employment by State for Direct and Indirect Jobs
Total Automotive Employmentby State Less than 20,000 20,000 to 70,000
70,000 to 150,000 150,000 to 300,000 More than 300,000

8/9/2019 Association Paper Final
http://slidepdf.com/reader/full/association-paper-final 54/65
© Center for Automotive Research 2010 45
Figure 2.3: Three State Examples – Automotive Jobs as a Percent of Labor Force
Total Contribution to the U.S. Economy by Motor Vehicle Assembly and ManufacturingOperations, Parts and Systems Supply, and Dealership Operations
Table 2.9 sums the combined effects from all motor vehicle manufacturing and retail operations.
Summing the direct employment from all operations (3,145,000), intermediate employment
(3,286,000) and spin-off employment, nearly 8 million jobs are supported or directly provided by
the industry to the U.S. economy. Comparing total employment to direct employment produces
an overall employment multiplier of 4.6 (7,960,391 / 1,736,293). This means that there are 3.6
additional jobs in the U.S. economy for every one job in the industry. The industry comprises
4.4% of all private sector employment in the U.S.
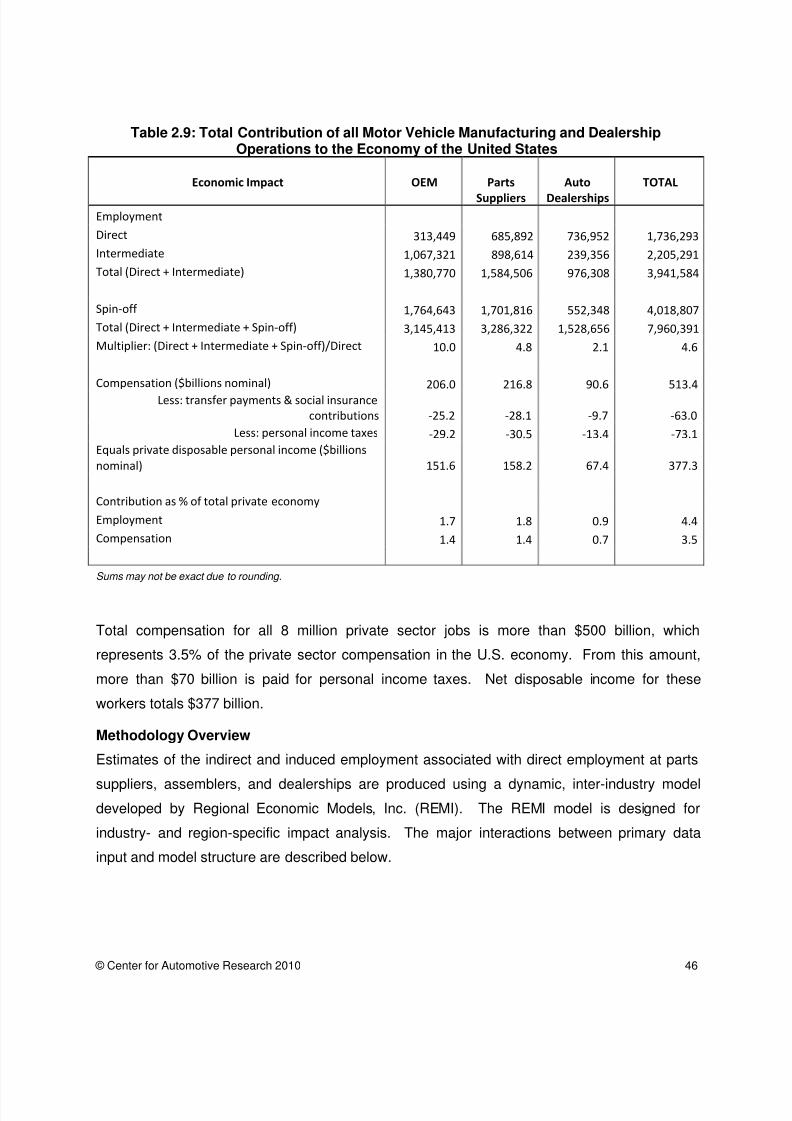
8/9/2019 Association Paper Final
http://slidepdf.com/reader/full/association-paper-final 55/65
© Center for Automotive Research 2010 46
Table 2.9: Total Contribution of all Motor Vehicle Manufacturing and DealershipOperations to the Economy of the United States
Economic Impact OEM Parts
Suppliers
Auto
Dealerships
TOTAL
Employment
Direct 313,449 685,892 736,952 1,736,293
Intermediate 1,067,321 898,614 239,356 2,205,291
Total (Direct + Intermediate) 1,380,770 1,584,506 976,308 3,941,584
Spin-off 1,764,643 1,701,816 552,348 4,018,807
Total (Direct + Intermediate + Spin-off) 3,145,413 3,286,322 1,528,656 7,960,391
Multiplier: (Direct + Intermediate + Spin-off)/Direct 10.0 4.8 2.1 4.6
Compensation ($billions nominal) 206.0 216.8 90.6 513.4
Less: transfer payments & social insurance
contributions -25.2 -28.1 -9.7 -63.0
Less: personal income taxes -29.2 -30.5 -13.4 -73.1
Equals private disposable personal income ($billions
nominal) 151.6 158.2 67.4 377.3
Contribution as % of total private economy
Employment 1.7 1.8 0.9 4.4
Compensation 1.4 1.4 0.7 3.5
Sums may not be exact due to rounding.
Total compensation for all 8 million private sector jobs is more than $500 billion, which
represents 3.5% of the private sector compensation in the U.S. economy. From this amount,
more than $70 billion is paid for personal income taxes. Net disposable income for these
workers totals $377 billion.
Methodology Overview
Estimates of the indirect and induced employment associated with direct employment at parts
suppliers, assemblers, and dealerships are produced using a dynamic, inter-industry modeldeveloped by Regional Economic Models, Inc. (REMI). The REMI model is designed for
industry- and region-specific impact analysis. The major interactions between primary data
input and model structure are described below.

8/9/2019 Association Paper Final
http://slidepdf.com/reader/full/association-paper-final 56/65
© Center for Automotive Research 2010 47
The Macroeconomic Model
To estimate the total employment and compensation provided by parts suppliers, motor vehicle
assemblers and new vehicle dealership operations, the research team at CAR used a 51-
region, 169 industry sector model developed by REMI to capture effects in all fifty U.S. state
economies, the District of Columbia and the U.S. national economy. The model provides abaseline forecast of regional and national economies. Various economic scenarios are then
input into the model and simulations based on the new data are calculated by the model
Changes from the baseline are measured using results from these simulations. Underlying
demographic and industry-specific information for every region are contained in the baseline
forecast.
Trade flows, migration patterns and commuter flows connect each state economy, allowing for
dynamic multi-regional analysis. Simulation results can be interpreted as the new economic
equilibrium (given a change to the baseline) and are the product of multiple structural equation
iterations across the state economies. A simulation begins with the user inputting a direct
change to the baseline economy. Once this change is entered into the model, new vectors of
transactions between businesses are calculated along with consumer purchases of goods and
services. These vectors may change as estimated household income increases or decreases
under the new scenario being modeled. The model reports the economic changes from the
baseline in a number of variables, with the most easily understood being employment.
The dynamic multi-regional character of the REMI model is a defining element not found in other
commercial impact analysis models and enables CAR to produce the results contained in this
study. In essence, the model can simulate economic impacts that may occur in any one state
resulting from changing the levels of employment in any or all of the other states.
Methods & Assumptions
The general analysis method is to run independent simulations for parts suppliers, motor vehicle
assemblers, and new vehicle dealership operations by subtracting the employment of each
group from the baseline regional economies at the state level. This counter-factual technique
allows for the separation of economic activity ─ influenced by the operations of suppliers,
assemblers and dealers ─ from the aggregate economy, and permits the capture of economic
contributions from continued employment in the sectors of interest for any given time period. In
general, the difference between the baseline forecast and the simulation represents the
economic contribution of suppliers, assemblers, and dealers.

8/9/2019 Association Paper Final
http://slidepdf.com/reader/full/association-paper-final 57/65
© Center for Automotive Research 2010 48
This study should not be interpreted as representing the economic activity that would be lost if
the automotive industry did not operate in the United States. That scenario would generate
significant compensating adjustments (over time) in the economy and is not examined in this
study. CAR’s purpose is to dissect and present the industry’s current presence in the domestic
economy. This study represents a snapshot of the automotive industry’s total employment
impact on the nation’s economy.
Consideration was paid to the potential of double-counting activities between supplier,
dealership and assembler runs. Within the framework of the REMI model, there is an inter-
industry, input-output (I-O) table that calculates demand for intermediate inputs used in the
production of a finished good. By running the assembler simulation first, then discounting the
calculated demand for parts suppliers associated with OEM assemblers, the CAR research
team was able to adjust for systemic double counts and calculate only the net employment
effects when combining supplier and assembler simulation runs. As a consequence of this
effort made up-front to avoid double counting between segments of the industry (OEM, parts
supply and dealerships), the results for each of these segments can be added together to arrive
at the total economic contribution of the industry. These results fairly represent the size of the
industry and its impact on the U.S. and individual state economies.
All simulation results are relevant to the economic conditions of calendar year 2009. The REMI
Standard Regional Control Forecast was adjusted to reflect the forecast values and underlying
assumptions of the University of Michigan’s Research Seminar in Quantitative Economics
(RSQE) macroeconomic forecast, released March 18, 2009.

8/9/2019 Association Paper Final
http://slidepdf.com/reader/full/association-paper-final 58/65
© Center for Automotive Research 2010 49
APPENDIX A: State Level Employment Contributions
AUTO INDUSTRY EMPLOYMENT CONTRIBUTION
State
Total Industry
Employment
Contribution
State Labor
Force
Auto Contribution as
% of Labor Force
Alabama 178,739 2,640,717 6.8%
Alaska 5,742 452,986 1.3%
Arizona 67,449 3,437,191 2.0%
Arkansas 60,335 1,599,446 3.8%
California 412,580 21,063,338 2.0%
Colorado 61,294 3,285,413 1.9%
Connecticut 66,267 2,279,011 2.9%
Delaware 19,862 553,149 3.6%
District of Columbia 13,927 814,340 1.7%
Florida 269,334 10,424,100 2.6%
Georgia 225,049 5,571,666 4.0%
Hawaii 9,080 873,749 1.0%
Idaho 13,888 939,793 1.5%
Illinois 459,876 7,657,328 6.0%
Indiana 515,822 3,718,148 13.9%
Iowa 72,328 2,025,350 3.6%
Kansas 56,324 1,875,134 3.0%
Kentucky 241,167 2,442,252 9.9%
Louisiana 75,366 2,576,960 2.9%
Maine 18,482 840,874 2.2%
Maryland 93,309 3,471,985 2.7%
Massachusetts 97,510 4,251,139 2.3%
Michigan 1,176,924 5,397,807 21.8%
Minnesota 103,196 3,567,295 2.9%
Mississippi 65,377 1,558,262 4.2%
Missouri 193,760 3,672,794 5.3%
Montana 10,454 651,425 1.6%
Nebraska 37,799 1,253,549 3.0%
Nevada 39,881 1,638,004 2.4%
New Hampshire 23,504 857,040 2.7%
New Jersey 145,456 5,176,293 2.8%
New Mexico 16,469 1,117,433 1.5%
New York 302,254 11,289,001 2.7%
North Carolina 217,493 5,497,808 4.0%
North Dakota 10,232 498,718 2.1%
Ohio 848,304 6,819,050 12.4%
Oklahoma 63,250 2,206,469 2.9%
Oregon 38,716 2,339,488 1.7%
Pennsylvania 257,940 7,407,409 3.5%
Rhode Island 12,446 612,258 2.0%
South Carolina 138,630 2,579,280 5.4%
South Dakota 12,376 566,490 2.2%
Tennessee 309,362 3,759,569 8.2%
Texas 394,938 14,469,900 2.7%
Utah 37,742 1,702,493 2.2%
Vermont 10,025 434,917 2.3%
Virginia 153,197 4,916,428 3.1%
Washington 48,127 4,012,270 1.2%
West Virginia 42,141 934,944 4.5%
Wisconsin 208,211 3,619,782 5.8%
Wyoming 8,456 404,855 2.1%
TOTAL U.S. 7,960,391 181,755,100 4.4%

8/9/2019 Association Paper Final
http://slidepdf.com/reader/full/association-paper-final 59/65
© Center for Automotive Research 2010 50
ALL JOBS - OEM
State Direct IndirectExpenditure-
InducedTOTAL
Alabama 12,337 22,479 39,642 74,459
Alaska 25 392 786 1,203
Arizona 1,459 3,637 5,314 10,410
Arkansas 512 3,676 13,843 18,031
California 18,537 49,373 39,051 106,961Colorado 1,133 4,601 9,022 14,756
Connecticut 446 4,818 13,828 19,092
Delaware 968 2,940 4,624 8,532
District of Columbia 71 1,173 4,436 5,680
Florida 1,949 19,939 50,321 72,209
Georgia 2,563 21,796 51,602 75,960
Hawaii 14 400 691 1,105
Idaho 7 692 963 1,661
Illinois 7,189 58,760 116,517 182,466
Indiana 21,762 77,641 133,485 232,888
Iowa 753 4,716 17,375 22,844
Kansas 1,159 5,095 14,711 20,965
Kentucky 14,596 37,905 61,753 114,254
Louisiana 1,556 7,820 17,671 27,047
Maine 13 942 3,442 4,397Maryland 1,570 7,769 20,726 30,065
Massachusetts 690 8,831 18,722 28,244
Michigan 119,303 274,922 301,195 695,420
Minnesota 549 9,967 21,189 31,704
Mississippi 4,230 5,181 18,015 27,426
Missouri 10,599 34,337 43,564 88,500
Montana 14 418 1,839 2,272
Nebraska 289 2,320 7,511 10,120
Nevada 705 2,069 7,370 10,145
New Hampshire 60 1,078 4,820 5,959
New Jersey 5,003 12,685 32,716 50,404
New Mexico 16 641 1,790 2,447
New York 3,933 29,480 65,695 99,107
North Carolina 1,436 16,347 42,668 60,452
North Dakota 8 439 1,994 2,441Ohio 39,685 167,891 221,018 428,594
Oklahoma 1,151 4,891 10,585 16,627
Oregon 777 2,905 2,221 5,904
Pennsylvania 1,085 19,461 62,311 82,857
Rhode Island 80 792 2,640 3,513
South Carolina 7,561 13,684 28,528 49,773
South Dakota 11 519 2,478 3,008
Tennessee 13,847 41,168 72,002 127,017
Texas 8,025 40,958 61,393 110,376
Utah 131 1,867 3,711 5,710
Vermont 6 448 2,479 2,932
Virginia 718 11,346 36,979 49,043
Washington 153 2,718 505 3,377
West Virginia 1,418 2,489 13,821 17,728
Wisconsin 3,344 20,625 53,198 77,167Wyoming 3 277 1,882 2,162
TOTAL U.S. 313,449 1,067,321 1,764,643 3,145,413
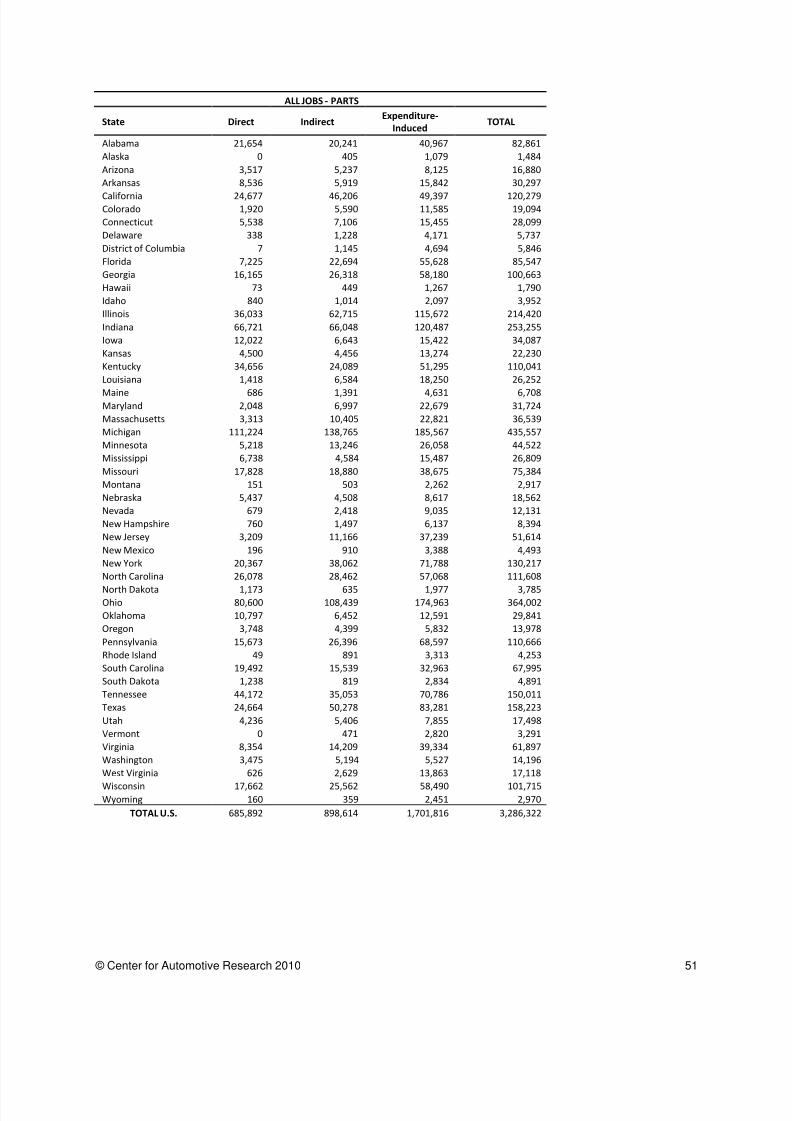
8/9/2019 Association Paper Final
http://slidepdf.com/reader/full/association-paper-final 60/65
© Center for Automotive Research 2010 51
ALL JOBS - PARTS
State Direct IndirectExpenditure-
InducedTOTAL
Alabama 21,654 20,241 40,967 82,861
Alaska 0 405 1,079 1,484
Arizona 3,517 5,237 8,125 16,880
Arkansas 8,536 5,919 15,842 30,297
California 24,677 46,206 49,397 120,279Colorado 1,920 5,590 11,585 19,094
Connecticut 5,538 7,106 15,455 28,099
Delaware 338 1,228 4,171 5,737
District of Columbia 7 1,145 4,694 5,846
Florida 7,225 22,694 55,628 85,547
Georgia 16,165 26,318 58,180 100,663
Hawaii 73 449 1,267 1,790
Idaho 840 1,014 2,097 3,952
Illinois 36,033 62,715 115,672 214,420
Indiana 66,721 66,048 120,487 253,255
Iowa 12,022 6,643 15,422 34,087
Kansas 4,500 4,456 13,274 22,230
Kentucky 34,656 24,089 51,295 110,041
Louisiana 1,418 6,584 18,250 26,252
Maine 686 1,391 4,631 6,708Maryland 2,048 6,997 22,679 31,724
Massachusetts 3,313 10,405 22,821 36,539
Michigan 111,224 138,765 185,567 435,557
Minnesota 5,218 13,246 26,058 44,522
Mississippi 6,738 4,584 15,487 26,809
Missouri 17,828 18,880 38,675 75,384
Montana 151 503 2,262 2,917
Nebraska 5,437 4,508 8,617 18,562
Nevada 679 2,418 9,035 12,131
New Hampshire 760 1,497 6,137 8,394
New Jersey 3,209 11,166 37,239 51,614
New Mexico 196 910 3,388 4,493
New York 20,367 38,062 71,788 130,217
North Carolina 26,078 28,462 57,068 111,608
North Dakota 1,173 635 1,977 3,785Ohio 80,600 108,439 174,963 364,002
Oklahoma 10,797 6,452 12,591 29,841
Oregon 3,748 4,399 5,832 13,978
Pennsylvania 15,673 26,396 68,597 110,666
Rhode Island 49 891 3,313 4,253
South Carolina 19,492 15,539 32,963 67,995
South Dakota 1,238 819 2,834 4,891
Tennessee 44,172 35,053 70,786 150,011
Texas 24,664 50,278 83,281 158,223
Utah 4,236 5,406 7,855 17,498
Vermont 0 471 2,820 3,291
Virginia 8,354 14,209 39,334 61,897
Washington 3,475 5,194 5,527 14,196
West Virginia 626 2,629 13,863 17,118
Wisconsin 17,662 25,562 58,490 101,715Wyoming 160 359 2,451 2,970
TOTAL U.S. 685,892 898,614 1,701,816 3,286,322

8/9/2019 Association Paper Final
http://slidepdf.com/reader/full/association-paper-final 61/65
© Center for Automotive Research 2010 52
ALL JOBS - DEALERS
State Direct IndirectExpenditure-
InducedTOTAL
Alabama 11,064 2,564 7,791 21,419
Alaska 1,532 438 1,085 3,055
Arizona 17,901 6,920 15,337 40,159
Arkansas 5,863 1,370 4,773 12,006
California 85,383 39,095 60,862 185,340Colorado 11,551 4,897 10,997 27,444
Connecticut 9,616 2,619 6,840 19,076
Delaware 2,938 657 1,997 5,592
District of
Columbia 21 481 1,898 2,401
Florida 51,775 20,327 39,476 111,578
Georgia 22,614 7,900 17,912 48,426
Hawaii 3,000 1,026 2,159 6,185
Idaho 3,884 1,061 3,330 8,275
Illinois 30,293 10,977 21,718 62,989
Indiana 15,084 3,561 11,034 29,679
Iowa 7,933 1,652 5,812 15,397
Kansas 6,846 1,496 4,787 13,129
Kentucky 8,589 1,948 6,336 16,873
Louisiana 10,913 2,930 8,225 22,068Maine 3,693 854 2,831 7,378
Maryland 16,474 3,957 11,088 31,520
Massachusetts 15,278 5,529 11,921 32,728
Michigan 23,947 6,359 15,641 45,947
Minnesota 12,913 4,566 9,491 26,970
Mississippi 5,684 1,046 4,412 11,142
Missouri 14,657 4,116 11,103 29,876
Montana 2,599 540 2,127 5,266
Nebraska 4,627 1,157 3,333 9,117
Nevada 6,767 2,728 8,109 17,605
New Hampshire 4,639 935 3,577 9,151
New Jersey 21,410 5,705 16,322 43,437
New Mexico 4,941 1,082 3,505 9,529
New York 32,793 12,783 27,354 72,930
North Carolina 22,538 6,514 16,381 45,434North Dakota 2,179 372 1,454 4,006
Ohio 28,565 8,198 18,946 55,708
Oklahoma 8,675 2,048 6,058 16,781
Oregon 9,303 3,021 6,511 18,834
Pennsylvania 33,415 8,307 22,696 64,418
Rhode Island 2,269 607 1,803 4,679
South Carolina 10,408 2,411 8,044 20,863
South Dakota 2,365 390 1,723 4,478
Tennessee 15,164 4,288 12,882 32,334
Texas 59,209 21,759 45,371 126,339
Utah 5,971 2,512 6,052 14,535
Vermont 1,905 338 1,558 3,802
Virginia 21,557 5,522 15,179 42,257
Washington 15,339 5,178 10,037 30,554
West Virginia 4,079 521 2,696 7,296Wisconsin 15,229 3,843 10,257 29,329
Wyoming 1559 244 1,521 3,324
TOTAL U.S. 736,952 239,352 552,352 1,528,656

8/9/2019 Association Paper Final
http://slidepdf.com/reader/full/association-paper-final 62/65
© Center for Automotive Research 2010 53
APPENDIX B: Determination of Direct Employment for the Motor Vehicle Parts Industry
Data for this study were collected using the NAICS system of classifying employment,
compensation and output. In addition to employment in motor vehicle parts manufacturing,
NAICS 3363, 8 subsectors, or industry groups, were included in the analysis. These are shown
in Table B1.
Table B.1 Sectors Comprising Auto Parts Manufacturing Industry
NAICS Description Employment
3261.991
Transportation plastics products, includes for boats, rail and
aerospace.
62,000
3262.1 Tires 52,000
3262.203 Hoses for motor vehicles 6,000
3325.106 Motor vehicle hardware 12,000
3345.145 Motor vehicle instruments 7,000
3351.10 Lighting 2,000
3359.114 Batteries 11,000
3362.115 Other truck and vehicle bodies for sale 12,000
3363 Auto Parts 522,000
Sources: Bureau of Economic Analysis, Input/Output Matrices,Census data at the 7-digit NAICS level, 2002 and 2007,County Business
Patterns, 2006, Bureau of Labor Statistics, Quarterly Census of Employment and Wages (QCEW),Annual Survey of Manufacturers,
Rubber Manufacturers Association,Battery Council International
Before running the economic estimation model, it was first necessary to determine the number
of jobs in each subsector or industry group, as some of these contain companies that do not
produce parts exclusively for motor vehicles. For instance, tire manufacturers also produce tires
for airplanes, and light bulb manufacturers produce for a variety of applications besides motor
vehicles.
Battery manufacturing: Employment in this category was taken from forecasts of battery
shipments by type of battery, prepared by the Battery Council International. Motor vehicle-
related employment was estimated based on actual historical employment and shipments,
compared to forecasts by type of battery. Only batteries destined for motor vehicle use were
considered. Approximately 70 percent of all battery production in the U.S. is for light motor
vehicle use.
Tire manufacturing: U.S. government data for this industry is at a 4-digit NAICS code level,
which includes tires made for aircraft and non-motorized vehicles (wheelbarrows, etc.).

8/9/2019 Association Paper Final
http://slidepdf.com/reader/full/association-paper-final 63/65
© Center for Automotive Research 2010 54
Employment in this category was taken from forecasts of tire shipments prepared by the Rubber
Manufacturers Association. Employment was estimated based on actual historical employment
and shipments compared to forecasts by type of tire. Only tires destined for motor vehicle use
were considered. Approximately 93 percent of all tire production in the U.S. is for light motor
vehicle use.
Light bulb manufacture: U.S. government data for this industry is at a 4-digit NAICS code level,
which includes all types of light bulbs. Several major international light bulb manufacturers
provide a breakdown of production or sales by type of light bulb. This information was used to
develop a production profile of auto light bulb manufacturing as a component of the entire
industry. Furthermore, many of the major producers provide detailed information on their
manufacturing operations. When available, employment at facilities specifically identified as
motor vehicle-related manufacturing was used. Approximately 17 percent of all bulbs produced
are for the motor vehicle industry. When specific site-related employment was not available,
employment was estimated using the percent of motor vehicle bulbs produced within the entire
industry production.
Transportation fabricated plastics products: According to historical statistics, which break this
industrial class into specific transportation sectors, plastics for motor vehicles accounted for
approximately two-thirds of total transportation plastics. This percentage was then applied to
current employment data to estimate the motor vehicle-related employment contribution from
the plastics products manufacturing.

8/9/2019 Association Paper Final
http://slidepdf.com/reader/full/association-paper-final 64/65
© Center for Automotive Research 2010 55
References
External References
• Automotive Aftermarket Industry Association (AAIA). AAIA 2009 Factbook. “Size of the U.S. Motor VehicleAftermarket.” <www.smpcorp.com>.
•
Automotive News. “Automotive News Data Center.” <www.autonews.com/section/DATACENTER>.• Automotive News. Keith Crain, “Closing Dealerships? Be Careful.” September 7, 2009. Page 12.
<www.autonewseurope.com/apps/pbcs.dll/article?AID=/20090907/ANA06/309079988/1125#>.
• BankruptcyData.com. <www.bankruptcydata.com/>.
• Battery Council International. Chicago, Illinois. www.batterycouncil.org
• Datamonitor. “Automotive Aftermarket in the United States.” Industry Profile. November 2008.
• Datamonitor. “Medium & Heavy Trucks in the United States.” Industry Profile. December 2008.
• IRN. Grand Rapids, MI. <www.think-irn.com/>.
• National Automobile Dealers Association. “NADA Data 2009.” <www.nada.org/Publications/NADADATA/>.
• National Science Foundation. “Research and Development in Industry: 2007.” <www.nsf.gov>.
• Research and Innovative Technology Administration, Bureau of Transportation Statistics. “NationalTransportation Statistics 2008.” <www.bts.gov>.
• Research and Innovative Technology Administration, Bureau of Transportation Statistics. Commodity FlowSurvey. “Shipment Characteristics by Mode of Transportation for the United States: 2007.” <www.bts.gov>.
• Rubber Manufacturers Association. Washington, D.C. www.rma.org
• U.S. Census Bureau. “2006 Annual Survey of Manufactures (ASM).”<www.census.gov/manufacturing/asm/index.html>.
• U.S. Department of Commerce, Bureau of Economic Analysis. <www.bea.gov/>.
• U.S. Department of Commerce, Bureau of the Census. “2007 Economic Census.”<www.census.gov/econ/census07/>.
•
U.S. Department of Commerce, Bureau of the Census. “County Business Patterns.” <www.census.gov>.• U.S. Department of Commerce, Bureau of the Census. “Annual Survey of Manufacturers, 2006.”
<www.census.gov>.
• U.S. Department of Labor, Bureau of Labor Statistics. “Employment Statistics Survey.” <www.bls.gov>.
• U.S. Department of Labor, Bureau of Labor Statistics. “Quarterly Census of Employment and Wages(QCEW).” <www.bls.gov>.
• Wall Street Journal. <www.wallstreetjournal.com>.
• Ward’s Automotive Group. “Ward’s Automotive Reports.” Southfield, MI.
• Ward’s Automotive Group. “Ward's Motor Vehicle Facts & Figures 2009.” Southfield, MI.<www.wardsauto.com>.
CAR Publications:
• Automotive Communities Program Book of Deals. Center for Automotive Research, Ann Arbor, MI,January 4, 2010.
• CAR Research Memorandum: The Impact on the U.S. Economy of a Major Contraction of the DetroitThree Automakers. Sean P. McAlinden, Kristen Dziczek and Debbie Maranger Menk, Center forAutomotive Research, Ann Arbor, MI, November 4, 2008.
• Contribution of Honda to the Economies of Seven States and the United States. Sean P. McAlinden,Kim Hill, David Cole and Debbie Maranger Menk, Center for Automotive Research. Prepared for AmericanHonda Motor Co., Inc., January, 2009.

8/9/2019 Association Paper Final
http://slidepdf.com/reader/full/association-paper-final 65/65
• Contribution of Toyota Motor North America to the Economies of Sixteen States and the UnitedStates, 2006. Kim Hill and Debbie Maranger Menk, Center for Automotive Research. Prepared for ToyotaMotor North America, October, 2007.
• Contribution of the Motor Vehicle Supplier Sector to the Economies of the United States and Its 50State – Kim Hill and Debbie Menk, Center for Automotive Research. Prepared for the Motor and EquipmentManufacturers Association, January 2007.
• Evaluation of Economic Impacts of the State of Michigan’s Vehicle Infrastructure IntegrationProgram -- Kim Hill, Center for Automotive Research. Prepared for Michigan Department of Transportation,September 2007.
• Contribution of a Vehicle Infrastructure System to the Economy of Michigan: Economic andIndustrial Impacts Update and Benefit-Cost Analysis -- Kim Hill and Debbie Menk, Center for AutomotiveResearch. Prepared for Michigan Department of Transportation, June 2008.
• Contribution of Toyota Motor North America to the Economies of Sixteen States and the UnitedStates in 2006 -- Kim Hill, Center for Automotive Research. Prepared for Toyota Motor North America, Inc.,October 2007.
• Contribution of the U.S. Motor Vehicle Industry to the Economies of the United States, California,New York, and New Jersey in 2003 – Institute of Labor and Industrial Relations, University of Michigan andthe Center for Automotive Research. Prepared for the Alliance of Automobile Manufacturers, Inc., May2004.
• Economic Contribution of the Automotive Industry to the U.S. Economy – An Update –McAlinden,Sean P., et al., Center for Automotive Research. Prepared for the Alliance of Automobile Manufacturers, Fall2003.
• Contribution of the Automotive Industry to the U.S. Economy in 1998: The Nation and Its Fifty States – Institute of Labor and Industrial Relations and the Office for the Study of Automotive Transportation,University of Michigan and the Center for Automotive Research. Prepared for the Alliance of AutomobileManufacturers, Inc. and the Association of International Automobile Manufacturers, Inc., Winter 2001.
• Country of Origin: Is this Vehicle Domestic or Import? The U.S. Domestic Content MeasurementPrograms, 2008 -- Sean McAlinden and Debbie Menk, Center for Automotive Research. Prepared forToyota Motor North America, Inc., April 2008.
• How Automakers Plan Their Products: A Primer for Policymakers on Automotive Industry BusinessPlanning -- Kim Hill, Center for Automotive Research. Prepared for the Environmental Defense Fund, July
2007.
• Michigan Automotive Research & Development Directory, 1st
Edition -- Kim Hill, Center for AutomotiveResearch. Prepared for the Michigan Economic Development Corporation, October 2002.
• The Contribution of the International Auto Sector to the U.S. Economy – The Office for the Study ofAutomotive Transportation, Transportation Research Institute, and the Institute of Labor and IndustrialRelations, University of Michigan. Prepared for the Association of International Automobile Manufacturers,Inc., Ann Arbor, March 1998.
• Competitive Survival: Private Initiatives, Public Policy and the North American Automotive Industry – Office for the Study of Automotive Transportation, University of Michigan Transportation ResearchInstitute. Prepared for the U.S.-Canada Automotive Select Panel, June 1992.
Note: The research staff of the Center for Automotive Research performed a number of these studies while
located at the University of Michigan’s Office for the Study of Automotive Transportation.