ast-120: a novel drug to prevent progression of...
TRANSCRIPT

AST-120: A NOVEL DRUG TO PREVENT
PROGRESSION OF CKD?
GERALD SCHULMAN, MD,FASN
PROFESSOR OF MEDICINE
VANDERBILT UNIVERSITY SCHOOL OF MEDICINE
NASHVILLE, TN, USA

The Renal Disease Iceberg
DIALYSIS
ESRD
CH
RO
NIC
KID
NE
Y D
ISE
AS
E

Estimates of CKD within the USA
Based on Creatinine (NHANES III Data)
Jones et al. Am J Kidney Dis. 1998, US Renal Data System, 2000
Early stages of CKD
(20 Million?)
0.3
0.8
2.5
6.0
Renal Replacement Therapy
SCr 2.0 mg/dL
SCr 1.7 mg/dL
SCr 1.5 mg/dL
SCr 1.4 mg/dL
250 Million in the US
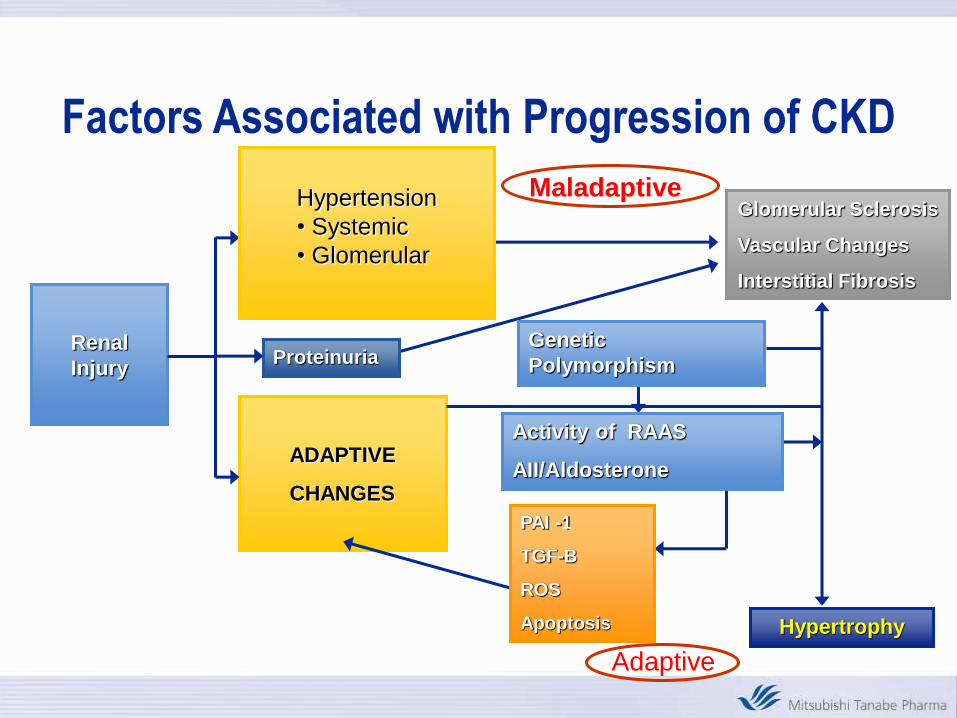
Factors Associated with Progression of CKD
Renal
InjuryProteinuria
Hypertrophy
ADAPTIVE
CHANGES
Glomerular Sclerosis
Vascular Changes
Interstitial Fibrosis
Hypertension
• Systemic
• Glomerular
Adaptive
Maladaptive
Genetic
Polymorphism
Activity of RAAS
AII/Aldosterone
PAI -1
TGF-B
ROS
Apoptosis

Optimal Pre-ESRD CareEarly Detection
of CRF
Prevention of
uremic complications
Interventions that
delay progression
Modification of
comorbidity
Preparation
for RRT
MalnutritionACE inhibitors Cardiac disease Education
AnemiaBP control Vascular diseaseInformed choice
of RRT
OsteodystrophyBlood sugar controlNeuropathy
(in diabetics)
Timely access
placement
AcidosisProtein restriction?Retinopathy
(in diabetics)
Timely initiation
of dialysis
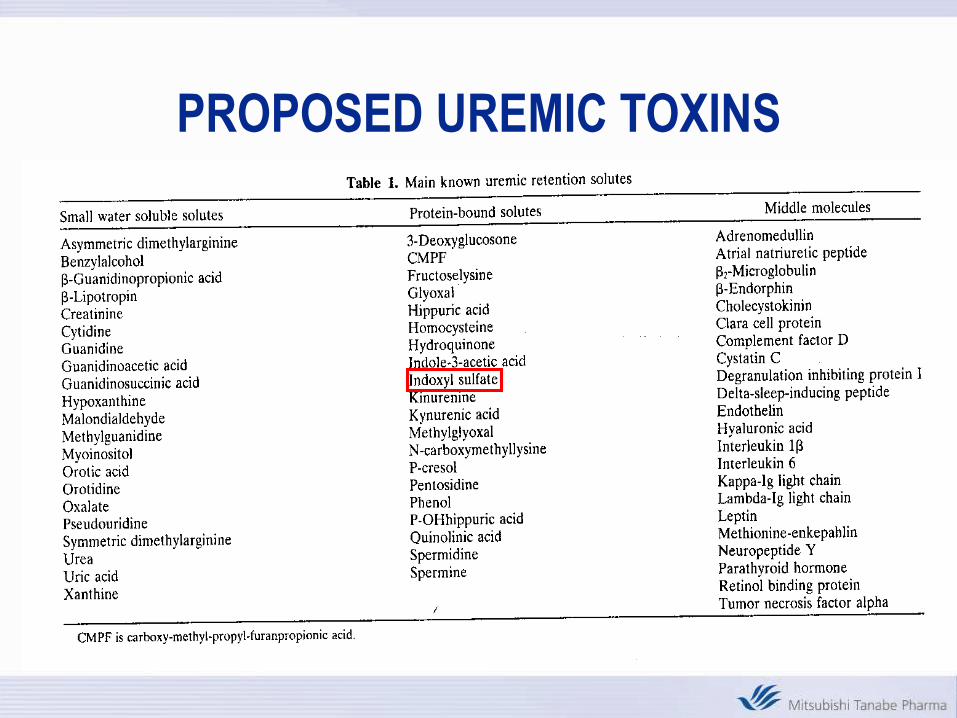
PROPOSED UREMIC TOXINS
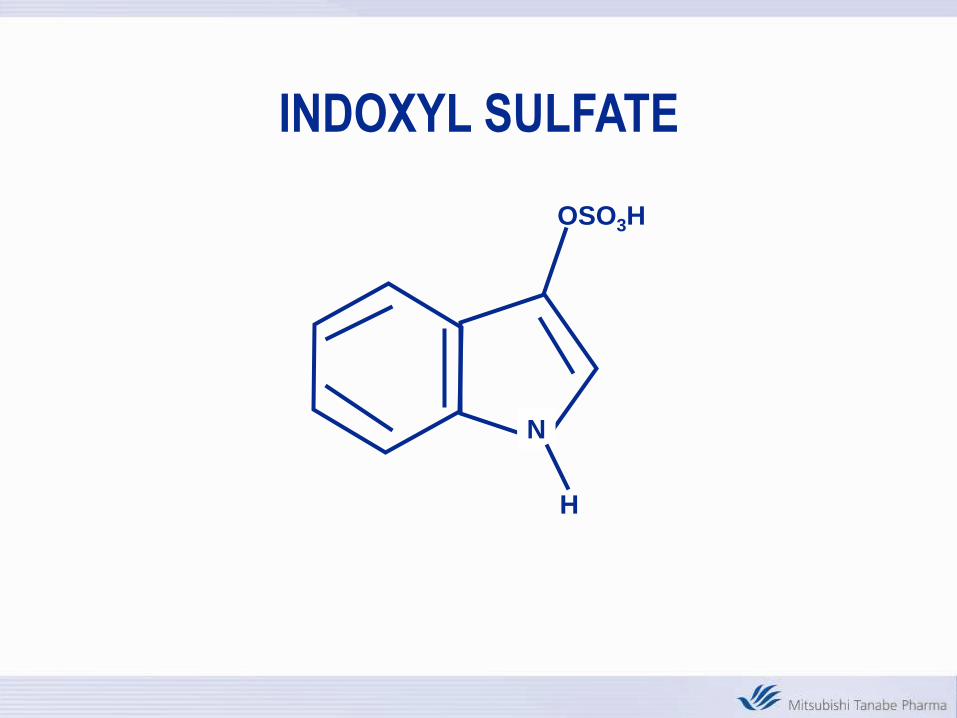
INDOXYL SULFATE
N
H
OSO3H

Serum Creatinine and Indoxyl Sulfate Levels
in Chronic Kidney Disease in the U.S.
r=0.73
sCr (mg/dL)
S –
IS (
mg
/dL
)
0
0.5
1
1.5
2
2.5
3
3.5
4
4.5
5
0.0 2.0 4.0 6.0 8.0 10.0
sCr (mg/dL)
S-IS (mg/dL)
4(mg/dL)
3
2
1
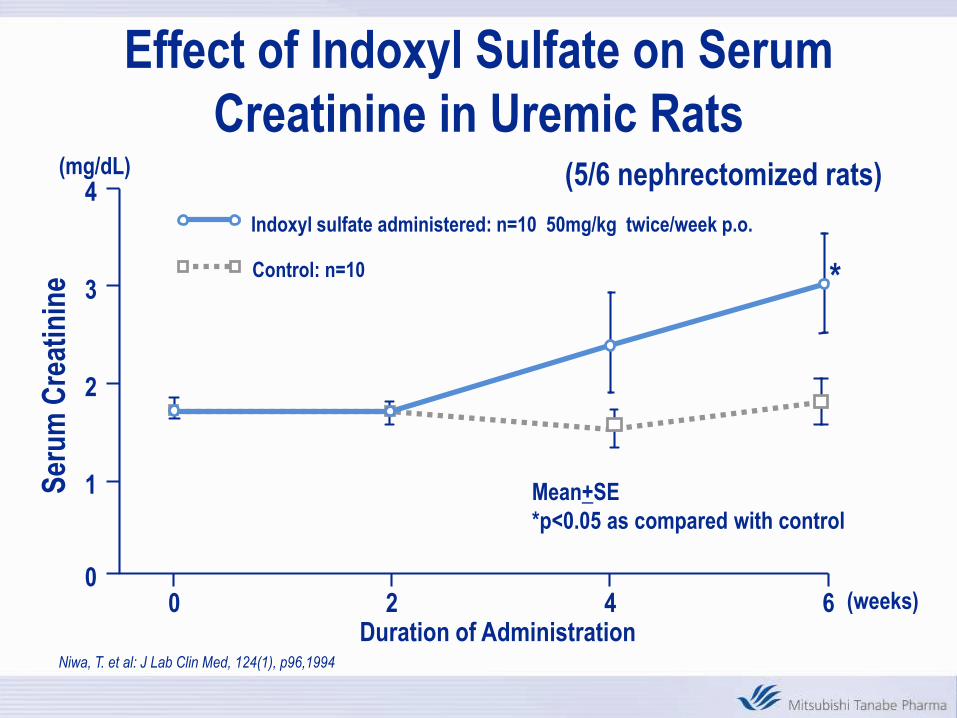
00 2 4 6 (weeks)
Mean+SE
*p<0.05 as compared with control
Ser
um
Cre
atin
ine
Indoxyl sulfate administered: n=10 50mg/kg twice/week p.o.
Control: n=10 *
Duration of Administration
(5/6 nephrectomized rats)
Niwa, T. et al: J Lab Clin Med, 124(1), p96,1994
Effect of Indoxyl Sulfate on Serum
Creatinine in Uremic Rats

AST-120
• AST-120 consists of black spherical particles ca. 0.2 to
0.4 mm in diameter. Composed mainly of carbon
(approximately 96%), AST-120 exhibits similar or
superior adsorption-ability to activated charcoal for
certain acidic and basic organic compounds that are
known to be increased in renal failure patients. The
clinical utility of AST-120, therefore, is believed to reside
in its ability to adsorb uremic toxins in the
gastrointestinal (GI) tract, thereby reducing systemic
absorption of uremic toxins and related contributions to
the CKD disease process

Difference between AST-120 and Activated Charcoal

AST-120 vs Activated Charcoal
Physical Appearance
AST-120 Activated
Charcoal
Niwa,T.et al Kidney Int 52 Suppl.62 :S23, 1997
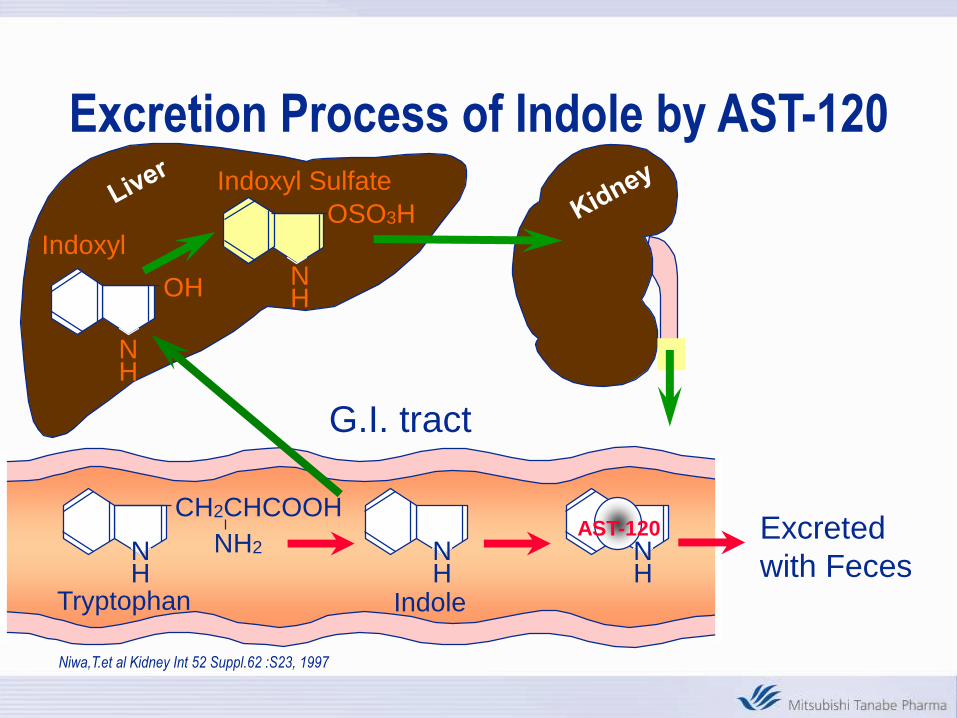
Indoxyl Sulfate
NH
NHOH
OSO3H
NH
CH2CHCOOH
NH
Indoxyl
Tryptophan
NH2
Indole
NH
AST-120
G.I. tract
Excreted
with Feces
Excretion Process of Indole by AST-120
.
Miyazaki, T. et al. Nephrol. Dial. Transplant ,15, 2000
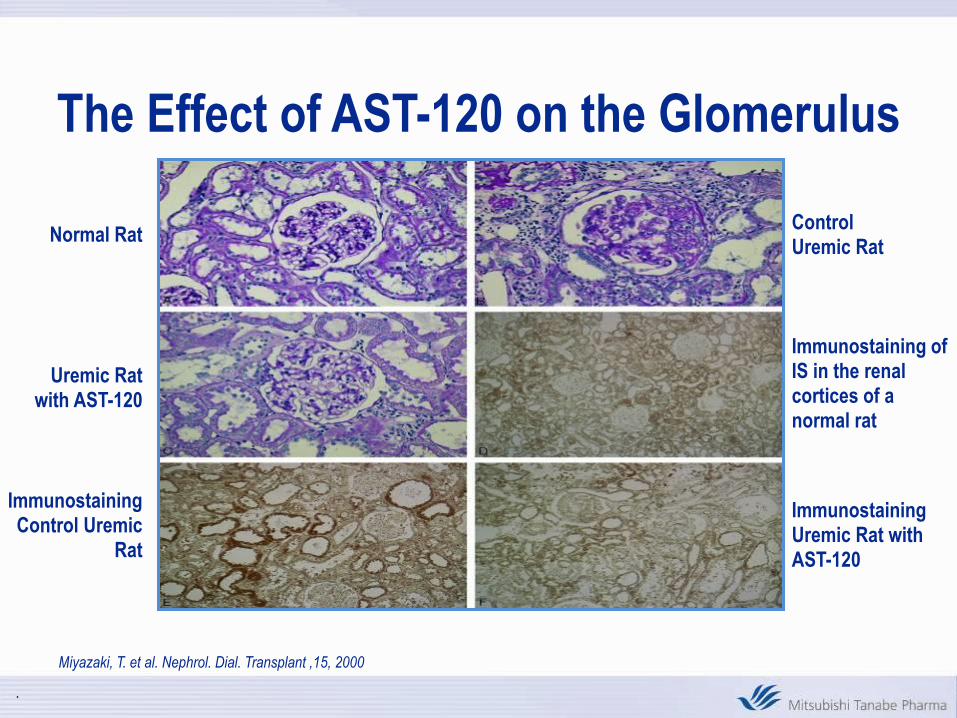
Normal Rat
Uremic Rat with AST-120
ControlUremic Rat
Immunostaining of IS in the renal cortices of a normal rat
Immunostaining Control Uremic
Rat
Immunostaining Uremic Rat with AST-120
The Effect of AST-120 on the Glomerulus

IS, AST-120 AND ACE-I
Aoyama I, et al. Nephron. 2002;90:297–312
INDOXYL SULFATE AND CKD
• TGF -1
• METALLOPROTEINASE
• PAI-1
• ABNORMALITIES IN TRYPTOPHAN METABOLISM
• CARDIOVASCULAR EFFECTS?

3-Month (12 Weeks) Double-Blind Treatment Phase
AST-120 2.7 grams/day
AST-120 6.3 grams/day
AST-120 9.0 grams/day
PLACEBO
2- to 4-Week
Screening Phase
2-Week
Follow-up
Phase
Week 4 Week 8 Week 12 Follow Up
Safety
Baseline LabsScreen Labs
Laboratory
Assessments
Laboratory
Assessments
Laboratory
Assessments
Week 14
Study Schematic
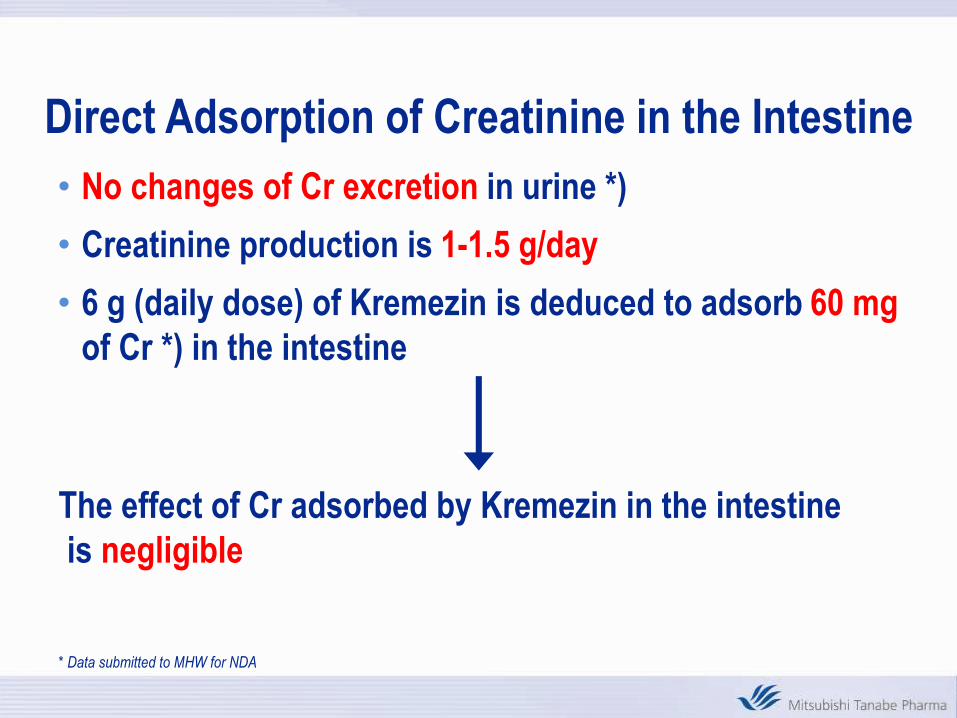
Direct Adsorption of Creatinine in the Intestine
• No changes of Cr excretion in urine *)
• Creatinine production is 1-1.5 g/day
• 6 g (daily dose) of Kremezin is deduced to adsorb 60 mg
of Cr *) in the intestine
The effect of Cr adsorbed by Kremezin in the intestine
is negligible
* Data submitted to MHW for NDA

Week 8
-0.6
-0.5
-0.4
-0.3
-0.2
-0.1
0
0.1
0.2
9g 6.3g 2.7g P
Week 12
-0.6
-0.5
-0.4
-0.3
-0.2
-0.1
0
0.1
0.2
9g 6.3g 2.7g P
MEAN CHANGE IN SERUM IS FROM
BASELINE TO WEEK 8 AND WEEK 12
(Mean + 95% Confidence Interval)
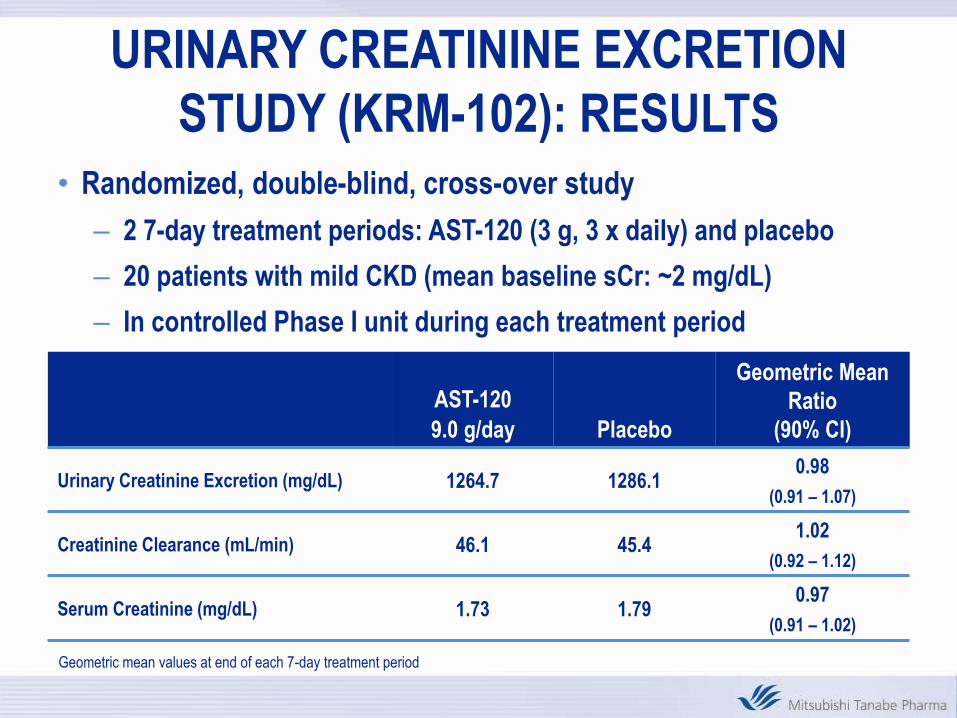
• Randomized, double-blind, cross-over study
– 2 7-day treatment periods: AST-120 (3 g, 3 x daily) and placebo
– 20 patients with mild CKD (mean baseline sCr: ~2 mg/dL)
– In controlled Phase I unit during each treatment period
AST-120
9.0 g/day Placebo
Geometric Mean
Ratio
(90% CI)
Urinary Creatinine Excretion (mg/dL) 1264.7 1286.10.98
(0.91 – 1.07)
Creatinine Clearance (mL/min) 46.1 45.41.02
(0.92 – 1.12)
Serum Creatinine (mg/dL) 1.73 1.790.97
(0.91 – 1.02)
Geometric mean values at end of each 7-day treatment period
URINARY CREATININE EXCRETION
STUDY (KRM-102): RESULTS

Paired U-test:p=0.0001
-497×10-5 dL/mg/week-96×10-5 dL/mg/week
Mean s-Cn:3.2(2.0~4.0)
Cr=2~4 mg/dL
Slope of 1/s-Cr: -150~-1500×10-5 dL/mg/week
-24 0 240.0
0.2
0.4
0.6
Before Afterweeks
1/C
r
No. of patients: 416
1/s-Cr slope Before and
After the Initiation of Kremezin Administration
(from Phase IV data)

0 24 48 72 96
No
-dia
lysi
s R
ate
(%)
Time (weeks)
n=93
n=40
n=21
n=17
Placebo
Kremezin
31%
77%
85%
97%
85%←70% (n=125)
←60% (n=119)
←50% (n=96)
70%
19%
Sample Size (per group)
(a=0.05, 1-b=0.8)55%
010
20
3040
50
6070
80
90
100
(from Phase IV data)
Estimated No-dialysis Rate & Sample Size

Primary Endpoint: Doubling Serum Creatinine,
Creatinine ≥ 6 mg/dl, Death, Dialysis, Transplant
Akizawa T et al, AJKD: 54, 2009

Effect of AST-120 on estimated Glomerular
Filtration Rate Over Time in Japan (6 g/day)
Akizawa T et al, AJKD: 54, 2009
P<0.001

Clinical
Outcomes
Progression
of CKD
Cinacalcet
HCl
PTH
Calcium
Phosphorus
Indoxyl
Sulfate
Effects on
the Kidneys
AST-120
Lowers Serum
Indoxyl Sulfate
Current Data Do Not Answer
The Real Question
Why EPPIC?

26
Primary Objectives
• Demonstrate that AST-120 reduces the risk of developing a component of the triple composite endpoint—”time to”
– Doubling of sCr
– Dialysis
– Transplantation
• Assess long-term safety of AST-120 in CKD patients

27
Secondary Objectives
• Quadruple endpoint: Primary + Death*
• Effects of AST-120 on protein and creatinine excretion, CCr, CUrea
• Effects on fat soluble vitamins, B-12, folate
*Death is “all-cause”
*Cause of death = SAE
*Endpoint Adjudication Committee will review and
assess causality of deaths
*Statistical Analysis Plan will detail these procedures
28
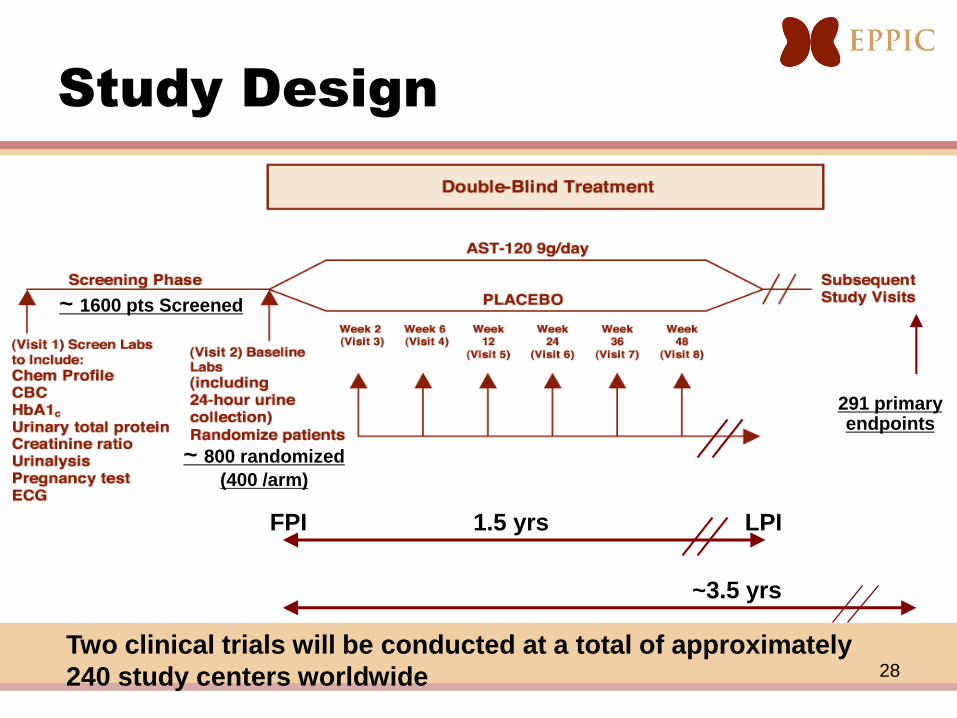
Study Design
Two clinical trials will be conducted at a total of approximately
240 study centers worldwide
291 primary endpoints
~ 1600 pts Screened
~ 800 randomized
(400 /arm)
~3.5 yrs
1.5 yrsFPI LPI

29
Protocol Gender NScreening
Age (Avg)
DM-
Nephropathy
ratio
(%)
Screening
Ur.Prot/Cr
(mg/mg Cr)
(Avg)
Baseline
sCr
(mg/dL)
(Avg)
Baseline
eGFR*
(mL/min
/1.73m2)
(Avg)
CKD **
(N)
Stage
3
Stage
4
Stage
5
KRM-
306
male 646 57.9293
45.4%2.0 3.2 23.9
143
22.1%
435
67.3%
68
10.5%
female 375 53.0141
37.6%2.0 3.0 20.2
35
9.3%
239
63.7%
101
26.9%
KRM-
307
male 560 55.7221
39.5%2.1 3.2 23.6
104
18.6%
407
72.7%
49
8.8%
female 455 54.3177
38.9%1.9 3.0 20.2
44
9.7%
278
61.1%
133
29.2%
Demography - Preliminary dataAll Randomized Patients as of December 1, 2010
* The coefficient of African-American is tentatively excluded from eGFR calculation
because the race data aren't available at this time.
eGFR(mL/min/1.73m²) = 186x(sCr) -1.154 x(Age) -0.203 x(0.742 if female)x(1.210 if African-American)
** CKD stage is tentatively categorized by eGFR at baseline.

RESULTS OF THE TWO EPPIC TRIALS
30
- -
-

PRIMARY AND SECONDARY POOLED
ITT ENDPOINTS
31

Summary of Estimated Glomerular Filtration Rate and Serum Creatinine Level at Time of
Dialysis Initiation.
EPPIC-1 EPPIC-2
neGFR,
Mean ± SDsCr,
Mean ± SD neGFR,
Mean ± SDsCr,
Mean ± SD
Total 302 10.90 ± 5.25 6.59 ± 3.16 289 9.95 ± 4.67 6.81 ± 3.00
CKD Etiology
Diabetic nephropathy 147 13.02 ± 5.19 5.26 ± 2.00 124 11.32 ± 5.02 5.91 ± 2.28
Nondiabetic nephropathy 155 8.88 ± 4.47 7.84 ± 3.54 165 8.92 ± 4.10 7.48 ± 3.30
Gender
Female 99 8.89 ± 4.49 6.81 ± 3.43 126 8.99 ± 4.22 6.61 ± 3.33
Male 203 11.88 ± 5.33 6.48 ± 3.03 163 10.70 ± 4.87 6.96 ± 2.72
Region
Europe (with Russia and the Ukraine) 113 8.22 ± 3.74 8.23 ± 3.78 108 8.10 ± 4.18 8.31 ± 3.50
Europe (without Russia and the Ukraine) 35 10.81 ± 3.40 5.92 ± 1.55 33 10.39 ± 3.35 6.37 ± 2.75
Latin America 43 8.61 ± 3.30 7.19 ± 2.50 74 9.46 ± 4.18 6.56 ± 2.50
North America 146 13.64 ± 5.34 5.13 ± 1.90 107 12.16 ± 4.57 5.47 ± 1.92
32
.
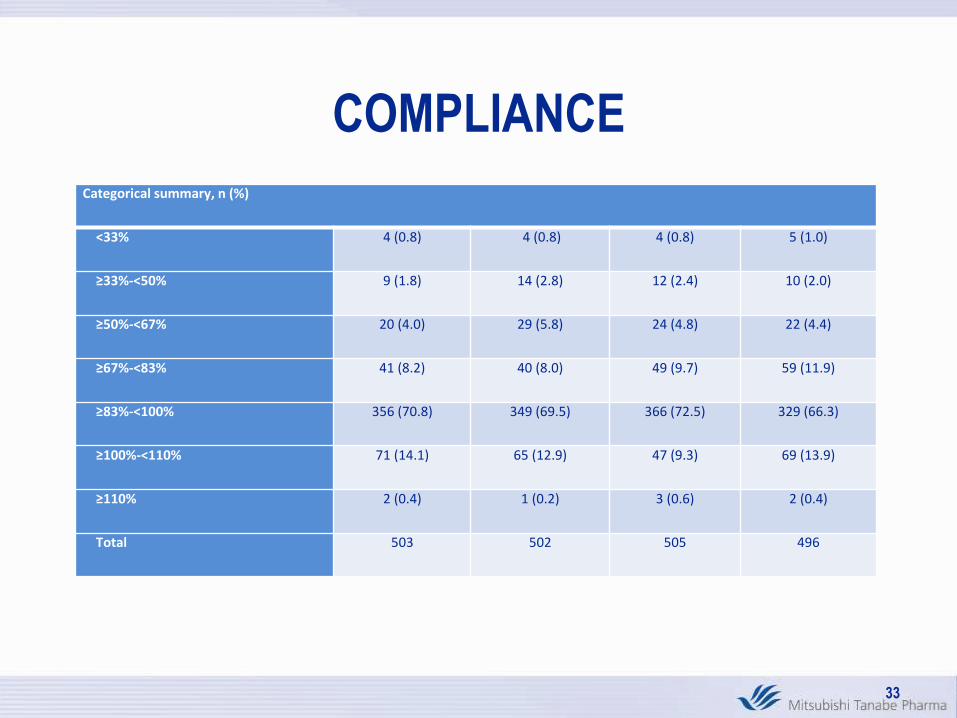
COMPLIANCE
Categorical summary, n (%)
<33% 4 (0.8) 4 (0.8) 4 (0.8) 5 (1.0)
≥33%-<50% 9 (1.8) 14 (2.8) 12 (2.4) 10 (2.0)
≥50%-<67% 20 (4.0) 29 (5.8) 24 (4.8) 22 (4.4)
≥67%-<83% 41 (8.2) 40 (8.0) 49 (9.7) 59 (11.9)
≥83%-<100% 356 (70.8) 349 (69.5) 366 (72.5) 329 (66.3)
≥100%-<110% 71 (14.1) 65 (12.9) 47 (9.3) 69 (13.9)
≥110% 2 (0.4) 1 (0.2) 3 (0.6) 2 (0.4)
Total 503 502 505 496
33

SLOW vs RAPID PROGRESSORS IN
PLACEBO GROUP
34
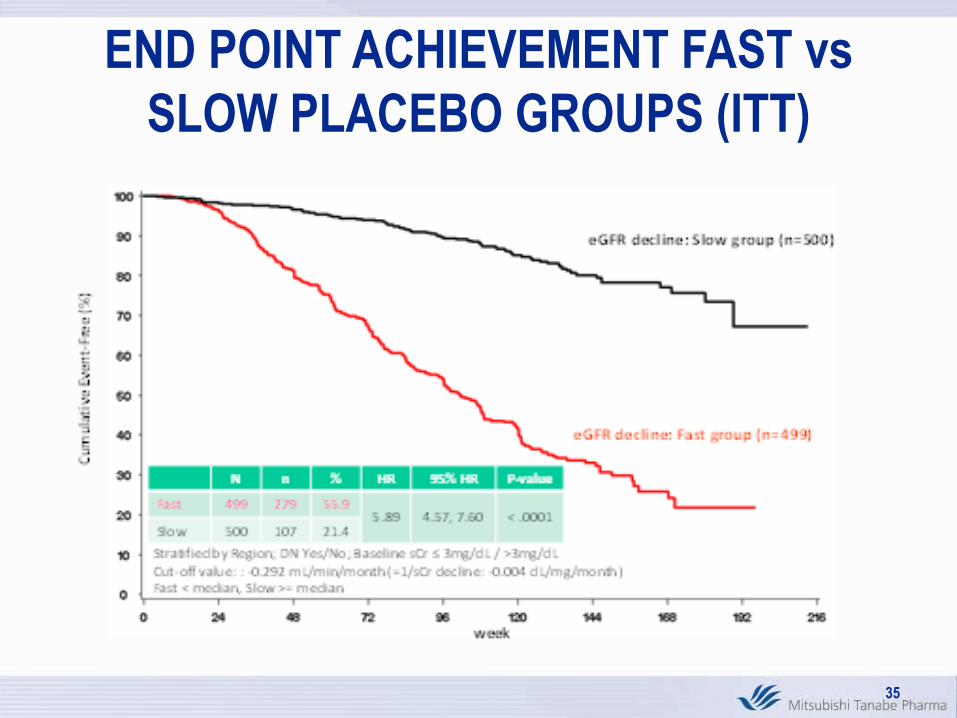
END POINT ACHIEVEMENT FAST vs
SLOW PLACEBO GROUPS (ITT)
35
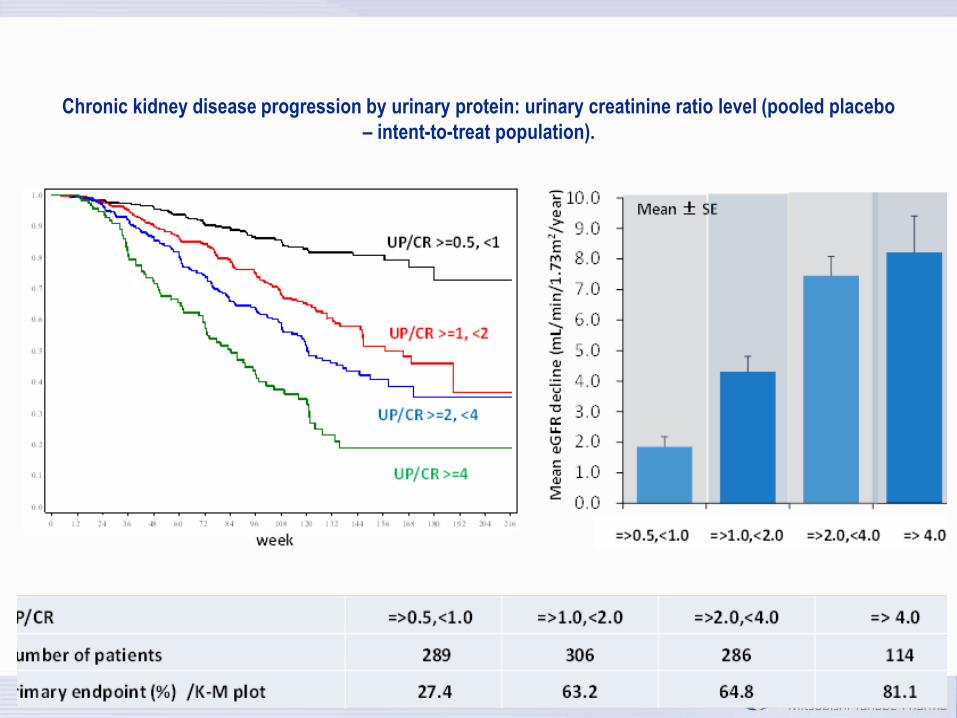
Chronic kidney disease progression by urinary protein: urinary creatinine ratio level (pooled placebo
– intent-to-treat population).
36

Chronic kidney disease progression by urinary protein: urinary creatinine ratio level and hematuria
(pooled placebo – intent-to-treat population).
37
Cum
ulat
ive
Even
t-Fr
ee (%
)
week
UP:UCr >=1.0
UP:UCr >=0.5, < 1.0
Cum
ulat
ive
Even
t-Fre
e (%
)
weekStratified by Region; DN Yes/No; Baseline sCr ≤ 3mg/dL / >3mg/dL
N n % HR 95% HR P-value
UP:UCr >=1.0 706 308 43.63.08 2.27, 4.17 < .0001
UP:UCr <1.0 289 51 17.6
Hematuria (-), UP:UCr >=0.5
Hematuria (+), UP:UCr >=0.5
week
Cum
ulat
ive
Even
t-Fr
ee (%
)
N n % HR 95% HR P-value
Hematuria (+) 343 165 48.12.08 1.68, 2.58 < .0001
Hematuria (-) 655 194 29.6
UP/CR(>=0.5, <1) & hematuria(+)(n=65)
UP/CR(>=0.5, <1) & hematuria(-) (n=224)
UP/CR(>=1) & hematuria(-)(n=428)
UP/CR(>=1) & hematuria(+)(n=277) Hematuria(-):NEGATIVEHematuria(+):TRACE, 1+, 2+, 3+
Projected placebo survival curve

Primary Endpoint in Patients with Factors Associated with Fast Progressing Chronic Kidney Disease,
Study Medication Compliance ≥80%, and Baseline ACEI/ARB Use (Pooled Intent-to-Treat Population
38

39
AST-120: Future Investigation
• EFFECT ON RESIDUAL RENAL FUNCTION
– CCPD, CAPD, PET CLASS, HEMODIALYSIS
• SYNERGY WITH OTHER AGENTS
– RAAS BLOCKERS, PROBIOTICS, TGF- ANTAGONISTS
• EFFECTS ON CARDIOVASCULAR EVENTS

PWV: Pulse Wave Velocity, IMT: Intima-Media Thickness
Nakamura T et al, Kidney Blood Press Res., 2004:27, 2004
AST-120 and Changes in Indicators of
Arterial Stiffness in Japan (6 g/day)

41
Issues in Modality Selection:
Residual Renal Function
0
1
2
3
4
5
0 6 12 18 24 30 36 42 48
Time on therapy in months
Res
idu
al C
reat
inin
e C
lear
ance
(ml/m
in)
CAPD (n = 58)HD (N = 57)
Lysaght et al. ASAIO Trans. 1991;37:598-604.

42
Decline in Creatinine Clearance During PD
0
20
40
60
80
Baseline 12 months 24 months
Wee
kly
CC
r, L
/1.7
3 m
2
CCr total
CCr PD
CCr RRF
WHAT CAN BE DONE NEXT?
• CONSIDER ANOTHER STUDY
– GREAT EXPENSE
– ENRICH STUDY POPULATION BY ENSURING THAT
PROGRESSORS ONLY ARE ENROLLED
– LIBERALIZE ENDPOINTS e.g., 50% INCREASE IN
CREATININE
– INCLUDE CARDIAC ENDPOINTS
• LOOK AT AST-120 IN PRESERVING RESIDUAL RENAL
FUNCTION IN DIALYSIS PATIENTS
• CONTINUE RESEARCH IN ANTI-FRIBOTIC THERAPIES43