asthma mortality in pennsylvania - … health/diseases and conditions/a-d/asthma...p a g e | 1 2015...
TRANSCRIPT

P a g e | 1
2015 PENNSYLVANIA ASTHMA MORTALITY REPORT
2015
ASTHMA MORTALITY IN PENNSYLVANIA

P a g e | 2
2015 PENNSYLVANIA ASTHMA MORTALITY REPORT
TABLE OF CONTENTS
Introduction…………………...…………………………………………………………………………...1
Methodology……………………………………………………………………………………………….2
Summary…………………………………………………………………………………………………...3
Mortality Trends………………………………………………………………………………………...4-8
Age- Adjusted Asthma Mortality Rates by Age-Group...………………………………………………9
County level Mortality Rates due to Asthma, 2004-2012..…………………………………………….10
Conclusion……………………....………………………………………………………………………...11
References………………………………………………………………………………………………...12
Appendix………………………………………………………………………………………………….13
Acknowledgements……………………………………………………………………………………….14
Disclaimers...……………………………………………………………………………………………...14

P a g e | 1
2015 PENNSYLVANIA ASTHMA MORTALITY REPORT
INTRODUCTION
Asthma, a chronic disease of the lungs
characterized by wheezing, breathlessness, chest
tightness, and coughing at night or early in the
morning. 3 The cause(s) of asthma is not clear
but several triggers have been associated with
asthma. A combination of both genetic and
environmental factors may predispose an
individual to asthma. 5 Asthma triggers includes
pollen, animal dander, mold, cockroaches, dust
mites, tobacco smoke, physical activity, certain
foods and medication. Asthma has no cure;
however, its effective management has been
shown to reduce the severity of symptoms.
Asthma affects all people of all ages.
Worldwide, an estimated 334 million people
have asthma. 4 In 2011 in the United States, 25.7
million persons have current asthma, of which
7.0 million were children and 18.7 million were
adults. Among adults, an estimated 3.1 million
people over sixty-five years of age are living
with asthma. In children, more boys have asthma
than girls. The reverse is true in adults. More
adult females develop asthma compared to
men.1 The role of sex and hormones in the
development of asthma is unclear.
Deaths due to asthma are a rare occurrence but
do occur. An estimated 255,000 people
worldwide die from asthma annually 1. In the
U.S, an estimated nine deaths occur daily. 2 This
is of serious concern because asthma deaths are
preventable through asthma education, proper
management and control. Asthma will continue
to be an important public health issue as the
health department along with its partners work
to reduce the burden of asthma and eliminate
preventable deaths from asthma in the
Commonwealth of Pennsylvania.

P a g e | 2
2015 PENNSYLVANIA ASTHMA MORTALITY REPORT
METHODOLOGY
This section describes mortality data of
Pennsylvania residents who died of asthma as
noted on their death certificates from year 2003
to 2012. Deaths due to asthma as the underlying
cause were classified using the ICD-10/ICD-9:
J45-J46/493 code. Asthma deaths were
combined in a three-year block and aggregated
by age, gender, race/ethnicity to increase the
reliability of the results.
Age-adjusted rates were calculated using the
direct standardization method and presented per
100,000 population. 95% Confidence Intervals
were calculated and displayed. Mortality rates
for demographic units with a small number of
events (less than 10) were not calculated and not
displayed (ND) because these rates were
statistically unreliable. The source of asthma
mortality data is the Pennsylvania Department of
Health, Bureau of Health Statistics and Research
P a g e | 3
2015 PENNSYLVANIA ASTHMA MORTALITY REPORT
SUMMARY
The total number of deaths and age-adjusted
mortality rates in Pennsylvania increased from
2010 to 2012. In 2010, there were 126 deaths
due to asthma. In 2011, there were 129 deaths
and in 2012 there were 145 deaths due to
asthma.
In combined three year period from 2010-2012,
there were 400 deaths due to asthma, a rate of
0.9 per 100,000 residents in Pennsylvania.
In 2010, of the 126 deaths due to asthma, 44
were males and 82 were females. In 2011, of the
129 deaths due to asthma, 46 were males while
83 were females. In 2012, of the 145 deaths due
to asthma, 51 were males and 94 were females.
In combined three year period from 2010-2012,
females had a higher proportion of deaths due to
asthma compared to males (65% vs 35%). The
age adjusted rates in females are higher than that
of males but the difference is not statistically
significant.
Blacks have consistently had higher death rates
due to asthma than Whites. The rates in Blacks
are approximately 3-4 times that of Whites
during the three year period from 2010-2012.
In the U.S, asthma mortality rate presented in
2013 was 1.1 per 100,000. This is similar to the
rates in Pennsylvania in combined in a three-
year period from 2010-2012.
Asthma mortality rate increases with age, with
persons age 85 and older having the highest
mortality rate. However, advancing age and
other co- morbidities such as Chronic
Obstructive Pulmonary disease (COPD),
diabetes might be responsible for the high death
rates in this group.
Disparities in asthma death rates were observed
with Blacks having higher death rates than
Whites and females having higher death rates
than males.

P a g e | 4
2015 PENNSYLVANIA ASTHMA MORTALITY REPORT
MORTALITY TRENDS
Age-Adjusted Mortality Rate from 2003-2012
The age-adjusted mortality rates for year 2004 -
2007 remained relatively the same at 1.1 deaths
per 100,000. Two peak rates of 1.3 deaths per
100,000 residents were observed in 2003 and
2008. There is a subsequent decrease in
mortality rate from 1.3 deaths per 100,000 in
2008 to 0.9 deaths per 100,000 in 2009.The
death rates remained the same in 2009 and 2010,
decreased slightly in 2011 and increased to 1.0
death per 100,000 in 2012. Overall, the death
rates in Pennsylvania have remained relatively
stable ranging from 0.8 to 1.3 deaths per
100,000(figure 1).
Figure 1: Trends in Age-adjusted Asthma Death Rates per 100,000 Pennsylvania
Residents, PA 2003-2012.
Data Source: Bureau of Health Statistics and Research, Pennsylvania Department of Health
*Only includes death with asthma listed as the underlying cause
Vertical bars on the graph denote the 95% confidence interval.
1.3
1.1 1.0
1.1 1.1
1.3
0.9 0.9 0.8
1.0
0.0
0.2
0.4
0.6
0.8
1.0
1.2
1.4
1.6
2003 2004 2005 2006 2007 2008 2009 2010 2011 2012
Rat
es
pe
r 1
00
,00
0
Year

P a g e | 5
2015 PENNSYLVANIA ASTHMA MORTALITY REPORT
Age-Adjusted Asthma Mortality Rate by Sex
The ten- year trend analysis of the mortality data
in both females and males follow a similar
pattern. However, disparity exists in asthma
mortality between females and males. Age-
adjusted death rates per 100,000 were higher in
females compared to males. Death due to asthma
occurred in more females than males in a ratio of
approximately 1.5 to1.
Overall, the asthma mortality rates in both male
and female in 2012 were lower than the rates in
2003 (Figure 2). In a combined data analysis
covering three groups of data for the period
2003 to 2012, the age-adjusted asthma mortality
rates with asthma as the underlying cause of
death was higher among females compared to
males. Deaths rates were also higher among
females compared to rates in Pennsylvania.
Death rates per 100,000 residents have
decreased in both females and males since 2003
to 2011 and peaked in 2008 for both sexes. More
recently, from 2011 to 2012, there has been a
slight increase in death rates per 100,000
residents in both females and males (Figure 3).
Figure 2: Trends in Age-Adjusted Asthma Mortality Rate by Sex, PA 2003-2012.
Data Source: Bureau of Health Statistics and Research, Pennsylvania Department of Health
*Only includes death with asthma listed as the underlying cause
1.2
0.8 0.8 0.8 0.9
1.2
0.7 0.7 0.7 0.8
1.4
1.2 1.2 1.3
1.2
1.4
1.1 1.0
0.9
1.1
0.0
0.2
0.4
0.6
0.8
1.0
1.2
1.4
1.6
2003 2004 2005 2006 2007 2008 2009 2010 2011 2012
Rat
es
pe
r 1
00
,00
0
Year
Male Female

P a g e | 6
2015 PENNSYLVANIA ASTHMA MORTALITY REPORT
Figure 3: Age-Adjusted Asthma Mortality Rate by Sex, PA 2004-2012
(3 Year Combined Data).
Data Source: Bureau of Health Statistics and Research, Pennsylvania Department of Health
*Only includes death with asthma listed as the underlying cause
Vertical bars on the graph denote the 95% confidence interval.
0.8
0.9
0.7
1.2 1.2
1.0 1.1 1.1
0.9
0.0
0.2
0.4
0.6
0.8
1.0
1.2
1.4
1.6
2004-2006 2007-2009 2010-2012
Rat
es
pe
r 1
00
,00
0
Year
Male Female PA

P a g e | 7
2015 PENNSYLVANIA ASTHMA MORTALITY REPORT
Age-adjusted Asthma Mortality Rate by
Race/Ethnicity
The ten- year asthma mortality trend in Whites
in Pennsylvania follows a similar pattern to the
overall rate pattern in Pennsylvania. Rates in
Whites are lower than the overall state rates.
Asthma mortality rates in Whites have been
relatively constant all through 2003 to 2012 with
rates ranging from 1.2 death rates per 100,000 in
2003 to 0.8 death rates per 100,000 in 2012.
However among Blacks, death rates per
100,000 were higher than rates in Whites and the
overall state rates (Figure 4). Rates among
Blacks decreased from 3.1 per 100,000 in 2003
to 2.5 per 100,000 in 2005.
This was followed by an increase and peak rate
of 4.3 per 100,000 in 2008. From 2009, rates
have gradually decreased among blacks from 2.1
per 100,000 to 2.0 per 100,000 in 2012 (Figure
4). Blacks have consistently had higher death
rates due to asthma than Whites.
Data on trends in death rates due to asthma
among Hispanics and Asian/Pacific islander are
not shown because counts were less than ten and
unreliable results will be produced.
Figure 4: Trends in Age-Adjusted Asthma Mortality Rate by Race, PA 2003-2012.
Data Source: Bureau of Health Statistics and Research, Pennsylvania Department of Health *Only includes death with asthma listed as the underlying cause
3.1 2.8
2.5
2.9
3.3
4.3
2.1 2.2
1.8 2.0
1.2 0.9 0.9 0.9 0.8
1.0 0.8 0.7 0.7 0.8
1.3 1.1 1.0 1.1 1.1
1.3
0.9 0.9 0.8 1.0
0.0
0.5
1.0
1.5
2.0
2.5
3.0
3.5
4.0
4.5
5.0
2003 2004 2005 2006 2007 2008 2009 2010 2011 2012
Rat
es
pe
r 1
00
,00
0
Year
Black White PA
P a g e | 8
2015 PENNSYLVANIA ASTHMA MORTALITY REPORT
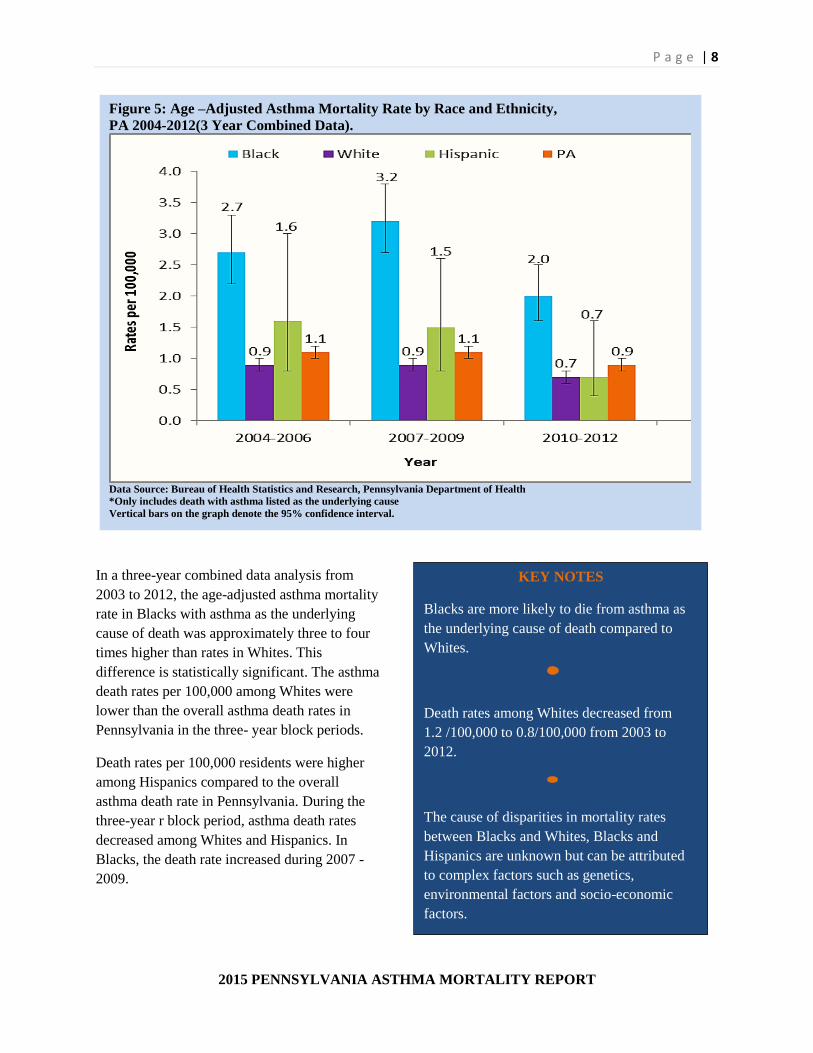
In a three-year combined data analysis from
2003 to 2012, the age-adjusted asthma mortality
rate in Blacks with asthma as the underlying
cause of death was approximately three to four
times higher than rates in Whites. This
difference is statistically significant. The asthma
death rates per 100,000 among Whites were
lower than the overall asthma death rates in
Pennsylvania in the three- year block periods.
Death rates per 100,000 residents were higher
among Hispanics compared to the overall
asthma death rate in Pennsylvania. During the
three-year r block period, asthma death rates
decreased among Whites and Hispanics. In
Blacks, the death rate increased during 2007 -
2009.
Figure 5: Age –Adjusted Asthma Mortality Rate by Race and Ethnicity,
PA 2004-2012(3 Year Combined Data).
Data Source: Bureau of Health Statistics and Research, Pennsylvania Department of Health
*Only includes death with asthma listed as the underlying cause
Vertical bars on the graph denote the 95% confidence interval.
KEY NOTES
Blacks are more likely to die from asthma as
the underlying cause of death compared to
Whites.
Death rates among Whites decreased from
1.2 /100,000 to 0.8/100,000 from 2003 to
2012.
The cause of disparities in mortality rates
between Blacks and Whites, Blacks and
Hispanics are unknown but can be attributed
to complex factors such as genetics,
environmental factors and socio-economic
factors.

P a g e | 9
2015 PENNSYLVANIA ASTHMA MORTALITY REPORT
Age-Adjusted Asthma Mortality Rate by Age-
Group
Death rates per 100,000 residents from 2003 –
2012 increased with age with the highest number
of deaths occurring in persons 85 years and
older. Mortality rates per 100,000 in persons
ages 85 and older were approximately two times
the rate observed in individuals in age group 80-
84. Other factors including advancing age,
occurrence of co-morbidities such as Chronic
Obstructive Pulmonary disease (COPD),
diabetes and cardiovascular diseases might be
contributing to this high rate observed among
age group 85+ (Table 1).
Table 1: Age-Specific Asthma Mortality Rates by Age, PA 2004-2012 YEAR 2004-2006 YEAR 2007-2009 YEAR 2010-2012
AGE
GROUP
FREQUENCY RATE L U FREQUENCY RATE L U FREQUENCY RATE L U
00-04 3 ND ND ND 3 ND ND ND 1 ND ND ND
05--09 10 0.4 0.2 0.8 8 ND ND ND 2 ND ND ND
10--14 5 ND ND ND 12 0.5 0.3 0.9 1 ND ND ND
15-19 1 ND ND ND 11 0.4 0.2 0.7 6 ND ND ND
20-24 9 ND ND ND 6 ND ND ND 14 0.5 0.3 0.9
25-29 7 ND ND ND 20 0.9 0.5 1.4 17 0.7 0.4 1.1
30-34 10 0.4 0.2 0.8 15 0.7 0.4 1.1 14 0.6 0.3 1
35-39 13 0.5 0.3 0.9 22 0.9 0.6 1.4 12 0.5 0.3 0.9
40-44 28 1 0.7 1.5 19 0.7 0.4 1.1 23 0.9 0.6 1.4
45-49 43 1.5 1.1 2.1 44 1.6 1.2 2.1 21 0.8 0.5 1.2
50-54 36 1.4 1 1.9 38 1.4 1 2 34 1.2 0.8 1.6
55-59 29 1.3 0.9 1.8 29 1.2 0.8 1.7 38 1.4 1 1.9
60-64 34 1.8 1.3 2.6 38 1.9 1.3 2.6 32 1.4 0.9 1.9
65-69 24 1.6 1 2.3 28 1.8 1.2 2.5 20 1.2 0.7 1.8
70-74 22 1.6 1 2.5 24 1.8 1.2 2.7 14 1.1 0.6 1.8
75-79 33 2.8 1.9 3.9 28 2.5 1.7 3.6 33 3.1 2.1 4.3
80-84 42 4.8 3.5 6.5 40 4.7 3.4 6.4 37 4 2.8 5.5
85+ 94 12.5 10.1 15.3 80 9.4 7.4 11.6 81 8.6 6.8 10.7
TOTAL 443 1.1 1 1.2 466 1.1 1 1.2 400 0.9 0.8 1.0
Data Source: Bureau of Health Statistics and Research, Pennsylvania Department of Health
*Only includes death with asthma listed as the underlying cause
ND =not displayed if count <10
L=the lower 95% confidence limit for the rate or percent that appears in the corresponding row
U=the upper 95% confidence limit for the rate or percent that appears in the corresponding row
**Age-Adjusted rates are standardized to “2000 U.S. Standard Million Population.”

P a g e | 10
2015 PENNSYLVANIA ASTHMA MORTALITY REPORT
COUNTY LEVEL MORTALITY RATE
DUE TO ASTHMA 2004-2012
The total deaths due to asthma as the underlying
cause from 2004 to 2012 were 1,309.The crude
rate during this period was 1.2 deaths per
100,000 residents. A total of 35 out of 67
counties had combined total deaths of less than
10. Hence, county data level will not be
presented in any form. Mifflin County had the
highest crude death rate of 2.6 per 100,000,
followed by Lackawanna County at 2.0 per
100,000. Philadelphia County had a death rate of
1.9 per 100,000. Lancaster, Cumberland and
Chester Counties had the lowest crude death
rates of 0.6; 0.5 and 0.5 per 100,000 respectively
(Table 2).
Table 2: Age-Adjusted Asthma Mortality
Rates by County, PA 2004-2012
County Rates per 100,000
Mifflin 2.6
Lackawanna 2.0
Beaver 2.0
Philadelphia 1.9
Monroe 1.7
Adams 1.7
Fayette 1.6
Blair 1.6
Mercer 1.5
Luzerne 1.5
Crawford 1.4
Lawrence 1.3
Allegheny 1.3
Schuylkill 1.3
Lycoming 1.2
Dauphin 1.2
Pennsylvania 1.2
Berks 1.2
Lebanon 1.1
Franklin 1.1
Northampton 1.1
Delaware 1.0
Bucks 1.0
Montgomery 0.9
Westmoreland 0.9
Butler 0.9
York 0.9
Lehigh 0.9
Washington 0.9
Erie 0.8
Lancaster 0.6
Cumberland 0.5
Chester 0.5
Data Source: Bureau of Health Statistics and
Research, Pennsylvania Department of Health
*Only includes death with asthma listed as the
underlying cause.
*Counties with count <10 are not included in the table.
ASTHMA DEATH IS
PREVENTABLE!

P a g e | 12
2015 PENNSYLVANIA ASTHMA MORTALITY REPORT
CONCLUSION
Asthma mortality is low in comparison to the burden of the disease and asthma death is preventable.
Disparity in asthma mortality exists. Adults, females, Blacks and persons 85 years and older are more
likely to die from asthma compared to children, male, White (and other ethnicity) and individuals less
than 85 years old. The Asthma Control Program will continue to drive its intervention activities using
surveillance data in ensuring that patients who are at high risk of asthma-related deaths have access to
resources that will provide early treatment information and asthma management resources. Measures are
also been put in place in conjunction with the Pennsylvania Asthma partnership (PAP) in ensuring that
persons with asthma have a thorough understanding of asthma self-management. The Asthma Control
Program will continue to work with her partners in ensuring that doctors, nurses, patients, care givers and
family members are better educated and are aware of the factors that exacerbate an asthma attack, adopt
better asthma management practice, have increased access to quality care and overall ensure that asthma
mortality in the state of Pennsylvania is eliminated or remains low.

P a g e | 13
2015 PENNSYLVANIA ASTHMA MORTALITY REPORT
REFERENCES
1. American Academy of Allergy, Asthma & Immunology: Asthma Statistics. Retrieved May 18,
2015 at http://www.aaaai.org/about-the-aaaai/newsroom/asthma-statistics.aspx
2. Centers for Disease Control and Prevention (CDC). National Center for Environmental Health.
Asthma’s Impact on the Nation: Data from the CDC National Asthma Control Program. 2014.
Retrieved June 22, 2015 at http://www.cdc.gov/asthma/impacts_nation/asthmafactsheet.pdf.
3. National Heart, Lung & Blood Institute. What is Asthma? Retrieved May 18, 2005 at
http://www.nhlbi.nih.gov/health/health-topics/topics/asthma#.
4. The Global Asthma Report 2014. Auckland, New Zealand: Global Asthma network, 2014
5. World Health Organization: Chronic respiratory disease. Retrieved May 18, 2015 at
http://www.who.int/respiratory/asthma/causes/en/#

P a g e | 14
2015 PENNSYLVANIA ASTHMA MORTALITY REPORT
APPENDIX
Table 1: Number of Deaths Due to Asthma and Age-Adjusted Rates by gender, PA 2003-2012.
MALE FEMALE
Year Frequency Rate L U Frequency Rate L U
2003 71 1.2 0.9 1.5 111 1.4 1.2 1.7
2004 50 0.8 0.6 1.1 98 1.2 1 1.5
2005 46 0.8 0.6 1.0 102 1.2 1 1.5
2006 47 0.8 0.6 1.1 100 1.3 1.1 1.6
2007 52 0.9 0.6 1.1 95 1.2 1 1.5
2008 73 1.2 0.9 1.5 111 1.4 1.1 1.7
2009 47 0.7 0.5 1.0 88 1.1 0.8 1.3
2010 44 0.7 0.5 1.0 82 1 0.7 1.2
2011 46 0.7 0.5 1.0 83 0.9 0.7 1.2
2012 51 0.8 0.6 1.0 94 1.1 0.9 1.3
Data Source: Bureau of Health Statistics and Research, Pennsylvania Department of Health
*Only includes death with asthma listed as the underlying cause
L=the lower 95% confidence limit for the rate or percent that appears in the corresponding row
U=the upper 95% confidence limit for the rate or percent that appears in the corresponding row
**Age-Adjusted rates are standardized to “2000 U.S. Standard Million Population.”
Table 2: Number of Deaths Due to Asthma and Age-Adjusted Rates,
PA 2003-2012. Year Count Population Rate L U
2003 182 12,365,455 1.3 1.1 1.5
2004 148 12,406,292 1.1 0.9 1.2
2005 148 12,429,616 1.0 0.9 1.2
2006 147 12,440,621 1.1 0.9 1.3
2007 147 12,432,792 1.1 0.9 1.3
2008 184 12,448,279 1.3 1.1 1.5
2009 135 12,604,767 0.9 0.8 1.1
2010 126 12,702,379 0.9 0.7 1.0
2011 129 12,742,886 0.8 0.7 1.0
2012 145 12,763,536 1.0 0.8 1.1
Data Source: Bureau of Health Statistics and Research, Pennsylvania Department of Health
*Only includes death with asthma listed as the underlying cause
L=the lower 95% confidence limit for the rate or percent that appears in the corresponding row
U=the upper 95% confidence limit for the rate or percent that appears in the corresponding row
**Age-Adjusted rates are standardized to “2000 U.S. Standard Million Population.”

P a g e | 15
2015 PENNSYLVANIA ASTHMA MORTALITY REPORT
ACKNOWLEDGMENTS
This report was prepared by the Asthma Control Program, Bureau of Health Promotion and Risk
Reduction, Bureau of epidemiology, Pennsylvania Department of Health. The Pennsylvania Asthma
Control Program would like to extend our appreciation to all members and organizations for their
assistance in providing access to asthma mortality data, and in reviewing and making recommendations
for the creation of the 2015 Pennsylvania Asthma Mortality Report:
Centers for Disease Control and Prevention (CDC)
Pennsylvania Department of Health, Bureau of Health Promotion and Risk Reduction
Pennsylvania Department of Health, Bureau of Epidemiology
Pennsylvania Department of Health, Bureau of Health Statistics and Research
Many thanks to:
Serina Gaston, M.Ed., CHES, Principal Investigator, Asthma Control Program and Public Health
Program Director, Bureau of Health Promotion and Risk Reduction.
Melissa A. Bronstetter, MA, Asthma Control Program Manager, Bureau of Health Promotion and Risk
Reduction.
Farhad Ahmed, MBBS, MPH, Epidemiologist, Principal Investigator and Health Assessment Section
Chief, Bureau of Environmental Health.
For more information regarding data analysis and report compilation, please contact the author of the
report:
Monisola Malomo, DVM, M.P.H., Asthma Epidemiology Research Associate
Bureau of Epidemiology, Pennsylvania Department of Health
625 Forster Street.
Health and Welfare Building, Harrisburg, PA 17120
Phone: 717-787-3350
Email: [email protected]
DISCLAIMERS
This report was supported by Cooperative Agreement Number 2U59EH000533-06 from the Centers for
Disease Control and Prevention (CDC). Its contents are solely the responsibility of the authors and do not
necessarily represent the official views of the Centers for Disease Control and Prevention.
The Pennsylvania Department of Health, Bureau of Health Statistics and Research specifically disclaim
responsibility for any analyses, interpretations or conclusions made by the user of this report.