astronomy c eso 2007 astrophysicsmensa.ast.uct.ac.za/~kraan/papers/07pksdenis.pdf · a&a 466,...
TRANSCRIPT

A&A 466, 481–499 (2007)DOI: 10.1051/0004-6361:20065980c© ESO 2007
Astronomy&
Astrophysics
The highly obscured region around PKS 1343 – 601
I. Galactic interstellar extinctions using DENIS galaxy colours�
A. C. Schröder1, G. A. Mamon2,3, R. C. Kraan-Korteweg4,5, and P. A. Woudt5
1 Department of Physics & Astronomy, University of Leicester, University Road, Leicester LE1 7RH, UKe-mail: [email protected]
2 Institut d’Astrophysique de Paris (UMR 7095: CNRS & Université Pierre & Marie Curie) 98 bis Bd Arago, 75014 Paris, France3 GEPI (UMR 8111: CNRS & Université Denis Diderot), Observatoire de Paris, 92195 Meudon, France4 Depto. de Astronomía, Univ. de Guanajuato, Ap. P. 144, Guanajuato, GTO 36000, Mexico5 Department of Astronomy, University of Cape Town, Private Bag X3, Rondebosch 7701, South Africa
Received 5 July 2006 / Accepted 10 January 2007
ABSTRACT
The highly obscured radio-bright galaxy PKS 1343 – 601 at Galactic coordinates of (l, b) = (309.◦7,+1.◦8) has been suspected to markthe centre of a hitherto unknown cluster in the wider Great Attractor region. As such it presents an ideal region for a search of galaxiesin the near-infrared (NIR) and an in-depth study of their colours as a function of extinction. A visual search of a ∼30 square-degree areacentred on this radio galaxy on images of the NIR DENIS survey (IJK) revealed 83 galaxies (including two AGNs) and 39 possiblecandidates. Of these, 49 are also listed in the 2MASS Extended Source Catalog 2MASX. Taking the IRAS/DIRBE extinction values(Schlegel et al. 1998, ApJ, 500, 525) at face value, the absorption in the optical (AB) ranges from ∼2m to over 100m across the GalacticPlane. Comparing the detections with other systematic surveys, we conclude that this search is highly complete up to the detectionlimits of the DENIS survey and certainly surpasses any automatic galaxy finding algorithm applied to crowded areas.The NIR galaxy colours from the 7′′ aperture were used as a probe to measure total Galactic extinction. A comparison with theIRAS/DIRBE Galactic reddening maps suggests that the IRAS/DIRBE values result in a slight overestimate of the true extinctionat such low Galactic latitudes, the inferred extinction from the galaxy colours corresponds to about 87% of the IRAS/DIRBE ex-tinctions. Although this determination still shows quite some scatter, it proves the usefulness of NIR surveys for calibrating theIRAS/DIRBE maps in the extinction range of about 2m <∼ AB <∼ 12m.
Key words. galaxies: clusters: general – galaxies: fundamental parameters – galaxies: photometry – dust, extinction
1. Introduction
Various extragalactic large-scale structures are hidden behind thedust and stars of the Milky Way, the so-called Zone of Avoidance(ZoA), resulting in a poor understanding of the dynamics of thenearby Universe; for a detailed overview see Kraan-Korteweg& Lahav (2000), Kraan-Korteweg (2005), and the conferenceproceedings “Nearby Large-Scale Structures and the Zone ofAvoidance” (Fairall & Woudt 2005). The Great Attractor (GA),an extended mass overdensity in the nearby Universe, lies forinstance close to the crossing of the Supergalactic plane andthe Galactic plane. Its presence was inferred by the systematiclarge-scale flow of elliptical galaxies (Lynden-Bell et al. 1988).Applying the potential reconstruction method of the mass den-sity field POTENT (Dekel 1994), Kolatt et al. (1995) found itscentre at (l, b, v) = (320◦, 0◦, 4000 km s−1).
Close to the potential well of the GA lies the clusterACO 3627 (l, b, v) = (325◦,−7◦, 4848 km s−1), also calledthe Norma cluster. A deep optical galaxy search (Woudt &Kraan-Korteweg 2001) revealed this cluster to be as massiveand rich a cluster as the Coma cluster (Kraan-Korteweg et al.1996; Woudt et al. 2005). It therefore most likely marks thecentre of the potential well of the GA. However, the GA is anextended region of high galaxy density (about 40◦ × 40◦ on
� Table 2 and Appendix B are only available in electronic form athttp://www.aanda.org
the sky, see Kolatt et al. 1995), and other clusters (rich andpoor) may well contribute substantially to this mass overdensity.Identifying them is a challenge as the central part of the widerGA area lies behind the thickest dust layer of the Milky Way.
About 10◦ from the Norma cluster, at (l, b) = (309.◦7,+1.◦8),lies the galaxy PKS 1343 – 601 with a recession velocity of3872 km s−1 (West & Tarenghi 1989). Near-infrared (NIR)observations revealed PKS 1343 – 601 to be a giant ellipti-cal galaxy, which often reside at the centre of galaxy clus-ters. It is also one of the brightest radio sources in the sky(McAdam 1991): its flux density is only surpassed by Cygnus A,Centaurus A, Virgo A, and Fornax A. Two of these four radiosources are situated at the centre of rich clusters, one in a smallercluster, and one in a group of galaxies (Jones et al. 2001). Thisevidence motivated Kraan-Korteweg & Woudt (1999) to use dif-ferent means to investigate whether PKS 1343 – 601 points to an-other cluster in the GA region. Such a cluster would have a con-siderable impact on the local velocity-field calculations.
Results are still controversial. A preliminary analysis ofthe systematic deep H i search for galaxies with the ParkesMultibeam receiver found a concentration of galaxies in red-shift space around this radio galaxy (Kraan-Korteweg et al.2005b). A deep NIR search (JHK) of half a degree radiusand a deep I-band survey of 2 degrees around PKS 1343 – 601(Nagayama et al. 2004; Kraan-Korteweg et al. 2005a, respec-tively) have revealed a distribution of galaxies consistent with a
Article published by EDP Sciences and available at http://www.aanda.org or http://dx.doi.org/10.1051/0004-6361:20065980

482 A. C. Schröder et al.: The highly obscured region around PKS 1343 – 601. I.
(medium-sized) cluster around PKS 1343 – 601. X-ray obser-vations with ASCA have only revealed diffuse emission fromPKS 1343 – 601 itself (Tashiro et al. 1998; see also the discus-sion in Ebeling et al. 2002), which would rule out a rich cluster.
This paper presents the results of a search for galaxies basedon the NIR DENIS survey (Epchtein et al. 1997) in a much largerbut shallower area than the above ones. The advantages of usingthe NIR to search for galaxies in the ZoA are manifold: (i) theNIR is less affected by the foreground extinction than the opti-cal (the extinction in the K-band is about 10% of the extinctionin the B-band); (ii) the NIR is sensitive to early-type galaxies,which are tracers of massive groups and clusters (contrary to far-infrared and blind H i surveys); (iii) the NIR shows little confu-sion with Galactic objects such as young stellar objects and coolcirrus sources.
In pilot studies, we assessed the performance of theDENIS survey at low Galactic latitudes (Schröder et al. 1997;Kraan-Korteweg et al. 1998; Schröder et al. 1999; Mamon et al.2001). We tested the potential of the DENIS survey to detectgalaxies where optical and far-infrared surveys fail, i.e., at highforeground extinctions and in crowded regions; we establishedthat the NIR colours of galaxies lead to values for the foregroundextinction; and we cross-identified highly obscured galaxies de-tected in a blind H i search at |b| < 5◦. Overall, both sys-tematic NIR surveys DENIS (IJK; Paturel et al. 2003; Vauglinet al. 1999) and 2MASS (JHK; Skrutskie et al. 2006; Jarrettet al. 2000a) have proved their effectiveness in penetrating theZoA (Jarrett et al. 2000b; Rousseau et al. 2000; Schröder et al.2000) – as long as the star density does not exceed a certain value(Kraan-Korteweg & Jarrett 2005).
In the following, we will introduce the DENIS survey and theimplication of extinction on galaxy counts in general (Sects. 2and 3, respectively). We then describe the search area and thequality of the DENIS data (Sect. 4), and the methods of galaxyand parameter extraction (Sect. 5). The catalogue data are de-scribed in Sect. 6, Sect. 7 gives a detailed comparison withthe data of other searches and catalogues in this area, and inSect. 8 we investigate the extinction in this area using the de-rived NIR colours. Conclusions are presented in the final Sect. 9.Throughout the paper, we assume a Hubble constant of H0 =70 km s−1 Mpc−1.
A second paper will provide a detailed discussion of the lo-cal environment of PKS 1343 – 601 using the local galaxy den-sity, the velocity distribution, and the X-ray luminosity to assessits mass and contribution to the GA overdensity (Schröder &Mamon 2007, hereafter Paper II).
2. The DENIS survey
The DENIS survey (DEep Near-Infrared Survey of the south-ern sky) is a European joint program that simultaneously im-aged the sky in the Gunn-i (0.82 µm, hereafter I), J (1.25 µm)and Ks (2.15 µm, hereafter K) passbands with a resolution of 1′′in I and 3′′ in J and K (Epchtein 1997, 1998). The observationswere carried out between 1995 and 2001 with the dedicated 1 mESO telescope at La Silla (Chile). About 92% of the southernsky (+2◦ ≤ Dec ≤ −88◦) has been covered.
DENIS images have a field of view of 12′ × 12′. Exposuretimes per field and band are 9 s. The observing mode consistedof step-and-stare scans of 180 images in declination, resulting instrips of 12′ × 30◦. The overlap region between images are 1′ oneach side. Any given 12′ × 30◦ slot in the sky was usually ob-served once and, depending on the quality of the images and/orweather conditions of the previous observations, repeated.
Fig. 1. Predicted galaxy counts in B, I, J, and K as a function of absorp-tion in B, for highly complete and reliable DENIS galaxy samples anda BJ ≤ 19m optical sample.
The reduction process of the DENIS images consisted in biascorrections and flat-fielding. The latter was done using an iter-ative fitting of the pixel response over the night relative to themean over the image centre (Borsenberger 1997). The imageswere then smoothed with kernels the size of which is a func-tion of the wavelength of the spectral waveband. Objects wereextracted and measured with SExtractor (Bertin & Arnouts1996). For the purpose of the analysis of the ZoA the star/galaxyseparation was, however, performed visually.
To ensure homogeneous quality over the whole survey, theDENIS processing centre in Paris (PDAC) recently re-processedall strips with the latest software of the pipeline. The limitingmagnitudes for point sources (at a sensitivity of about 3σ) are18.m5, 16.m5, 13.m5 for the I-, J-, and K-bands, respectively, whilethe completeness limits for galaxy extraction at high Galactic lat-itudes are roughly 16.m5, 14.m8, and 12.m01 (Mamon 1998, 2000).
3. Extinction effects on galaxy counts
In the ZoA, number counts of galaxies decrease due to the in-creasing foreground extinction. This effect depends, however, onwavelength. Using the formula given in Cardelli et al. (1989), theextinction in the DENIS NIR passbands are
AI = 0.45AB, AJ = 0.21AB, AK = 0.09AB, (1)
directly implying that the decrease in number counts as a func-tion of extinction will be considerably slower in the NIR than inthe optical. Figure 1 shows the predicted surface number den-sity of galaxies as a function of Galactic foreground extinction,using the DENIS IJK galaxy counts for their respective com-pleteness limits as given in Mamon (1998), and for comparisonthe bJ galaxy counts of Gardner et al. (1996) in unobscured re-gions at the detection limit of Blim = 19.m0 of the deep B-bandsearch in this area (Woudt & Kraan-Korteweg 2001).
Figure 1 indicates that – given the above number countsand completeness limits – the NIR becomes more efficient atAB >∼ 2m than the optical in revealing galaxies in the ZoA.The J-band seems the most efficient passband at intermedi-ate extinctions (2m < AB < 12m), whereas K becomes su-perior to J at AB � 12m. As Kraan-Korteweg (2000) and
1 The DENIS K-band limiting magnitude is bright because theK background of the DENIS camera is high and dominated by thermalemission of the instrument.
A. C. Schröder et al.: The highly obscured region around PKS 1343 – 601. I. 483
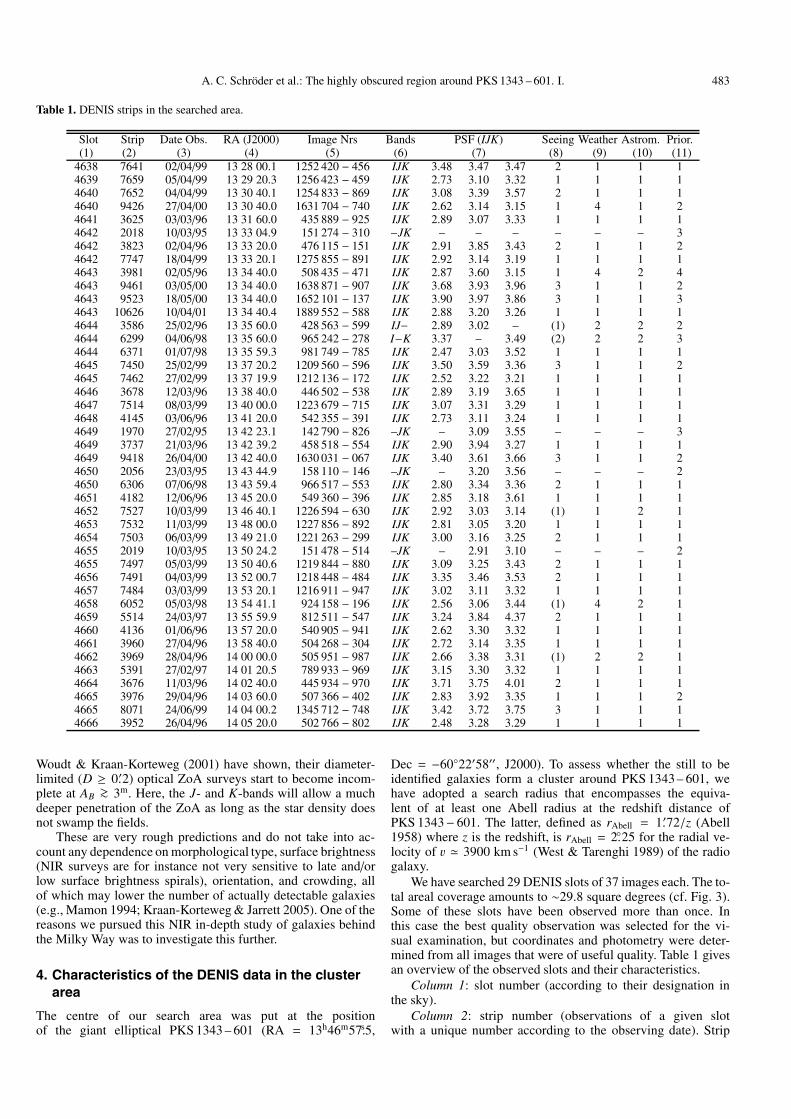
Table 1. DENIS strips in the searched area.
Slot Strip Date Obs. RA (J2000) Image Nrs Bands PSF (IJK) Seeing Weather Astrom. Prior.(1) (2) (3) (4) (5) (6) (7) (8) (9) (10) (11)
4638 7641 02/04/99 13 28 00.1 1252 420 − 456 IJK 3.48 3.47 3.47 2 1 1 14639 7659 05/04/99 13 29 20.3 1256 423 − 459 IJK 2.73 3.10 3.32 1 1 1 14640 7652 04/04/99 13 30 40.1 1254 833 − 869 IJK 3.08 3.39 3.57 2 1 1 14640 9426 27/04/00 13 30 40.0 1631 704 − 740 IJK 2.62 3.14 3.15 1 4 1 24641 3625 03/03/96 13 31 60.0 435 889 − 925 IJK 2.89 3.07 3.33 1 1 1 14642 2018 10/03/95 13 33 04.9 151 274 − 310 −JK – – – – – – 34642 3823 02/04/96 13 33 20.0 476 115 − 151 IJK 2.91 3.85 3.43 2 1 1 24642 7747 18/04/99 13 33 20.1 1275 855 − 891 IJK 2.92 3.14 3.19 1 1 1 14643 3981 02/05/96 13 34 40.0 508 435 − 471 IJK 2.87 3.60 3.15 1 4 2 44643 9461 03/05/00 13 34 40.0 1638 871 − 907 IJK 3.68 3.93 3.96 3 1 1 24643 9523 18/05/00 13 34 40.0 1652 101 − 137 IJK 3.90 3.97 3.86 3 1 1 34643 10626 10/04/01 13 34 40.4 1889 552 − 588 IJK 2.88 3.20 3.26 1 1 1 14644 3586 25/02/96 13 35 60.0 428 563 − 599 IJ− 2.89 3.02 – (1) 2 2 24644 6299 04/06/98 13 35 60.0 965 242 − 278 I−K 3.37 – 3.49 (2) 2 2 34644 6371 01/07/98 13 35 59.3 981 749 − 785 IJK 2.47 3.03 3.52 1 1 1 14645 7450 25/02/99 13 37 20.2 1209 560 − 596 IJK 3.50 3.59 3.36 3 1 1 24645 7462 27/02/99 13 37 19.9 1212 136 − 172 IJK 2.52 3.22 3.21 1 1 1 14646 3678 12/03/96 13 38 40.0 446 502 − 538 IJK 2.89 3.19 3.65 1 1 1 14647 7514 08/03/99 13 40 00.0 1223 679 − 715 IJK 3.07 3.31 3.29 1 1 1 14648 4145 03/06/96 13 41 20.0 542 355 − 391 IJK 2.73 3.11 3.24 1 1 1 14649 1970 27/02/95 13 42 23.1 142 790 − 826 –JK – 3.09 3.55 – – – 34649 3737 21/03/96 13 42 39.2 458 518 − 554 IJK 2.90 3.94 3.27 1 1 1 14649 9418 26/04/00 13 42 40.0 1630 031 − 067 IJK 3.40 3.61 3.66 3 1 1 24650 2056 23/03/95 13 43 44.9 158 110 − 146 –JK – 3.20 3.56 – – – 24650 6306 07/06/98 13 43 59.4 966 517 − 553 IJK 2.80 3.34 3.36 2 1 1 14651 4182 12/06/96 13 45 20.0 549 360 − 396 IJK 2.85 3.18 3.61 1 1 1 14652 7527 10/03/99 13 46 40.1 1226 594 − 630 IJK 2.92 3.03 3.14 (1) 1 2 14653 7532 11/03/99 13 48 00.0 1227 856 − 892 IJK 2.81 3.05 3.20 1 1 1 14654 7503 06/03/99 13 49 21.0 1221 263 − 299 IJK 3.00 3.16 3.25 2 1 1 14655 2019 10/03/95 13 50 24.2 151 478 − 514 –JK – 2.91 3.10 – – – 24655 7497 05/03/99 13 50 40.6 1219 844 − 880 IJK 3.09 3.25 3.43 2 1 1 14656 7491 04/03/99 13 52 00.7 1218 448 − 484 IJK 3.35 3.46 3.53 2 1 1 14657 7484 03/03/99 13 53 20.1 1216 911 − 947 IJK 3.02 3.11 3.32 1 1 1 14658 6052 05/03/98 13 54 41.1 924 158 − 196 IJK 2.56 3.06 3.44 (1) 4 2 14659 5514 24/03/97 13 55 59.9 812 511 − 547 IJK 3.24 3.84 4.37 2 1 1 14660 4136 01/06/96 13 57 20.0 540 905 − 941 IJK 2.62 3.30 3.32 1 1 1 14661 3960 27/04/96 13 58 40.0 504 268 − 304 IJK 2.72 3.14 3.35 1 1 1 14662 3969 28/04/96 14 00 00.0 505 951 − 987 IJK 2.66 3.38 3.31 (1) 2 2 14663 5391 27/02/97 14 01 20.5 789 933 − 969 IJK 3.15 3.30 3.32 1 1 1 14664 3676 11/03/96 14 02 40.0 445 934 − 970 IJK 3.71 3.75 4.01 2 1 1 14665 3976 29/04/96 14 03 60.0 507 366 − 402 IJK 2.83 3.92 3.35 1 1 1 24665 8071 24/06/99 14 04 00.2 1345 712 − 748 IJK 3.42 3.72 3.75 3 1 1 14666 3952 26/04/96 14 05 20.0 502 766 − 802 IJK 2.48 3.28 3.29 1 1 1 1
Woudt & Kraan-Korteweg (2001) have shown, their diameter-limited (D ≥ 0.′2) optical ZoA surveys start to become incom-plete at AB >∼ 3m. Here, the J- and K-bands will allow a muchdeeper penetration of the ZoA as long as the star density doesnot swamp the fields.
These are very rough predictions and do not take into ac-count any dependence on morphological type, surface brightness(NIR surveys are for instance not very sensitive to late and/orlow surface brightness spirals), orientation, and crowding, allof which may lower the number of actually detectable galaxies(e.g., Mamon 1994; Kraan-Korteweg & Jarrett 2005). One of thereasons we pursued this NIR in-depth study of galaxies behindthe Milky Way was to investigate this further.
4. Characteristics of the DENIS data in the clusterarea
The centre of our search area was put at the positionof the giant elliptical PKS 1343 – 601 (RA = 13h46m57.s5,
Dec = −60◦22′58′′, J2000). To assess whether the still to beidentified galaxies form a cluster around PKS 1343 – 601, wehave adopted a search radius that encompasses the equiva-lent of at least one Abell radius at the redshift distance ofPKS 1343− 601. The latter, defined as rAbell = 1.′72/z (Abell1958) where z is the redshift, is rAbell = 2.◦25 for the radial ve-locity of v � 3900 km s−1 (West & Tarenghi 1989) of the radiogalaxy.
We have searched 29 DENIS slots of 37 images each. The to-tal areal coverage amounts to ∼29.8 square degrees (cf. Fig. 3).Some of these slots have been observed more than once. Inthis case the best quality observation was selected for the vi-sual examination, but coordinates and photometry were deter-mined from all images that were of useful quality. Table 1 givesan overview of the observed slots and their characteristics.
Column 1: slot number (according to their designation inthe sky).
Column 2: strip number (observations of a given slotwith a unique number according to the observing date). Strip

484 A. C. Schröder et al.: The highly obscured region around PKS 1343 – 601. I.
numbers smaller than 3000 were part of the pre-survey (thesehave no I-band counterparts, and the exposure time was slightlylarger); they were used for verification only since they are notastrometrically and photometrically calibrated.
Column 3: date of observation (DD/MM/YY).Column 4: central Right Ascension of the strip (J2000) (re-
call that each image has a width of about 12′).Column 5: image numbers for the searched area (only the
last three digits are given for the final image).Column 6: observed passbands.Column 7: half-flux radius as calculated by SExtractor
multiplied by 2 (an equivalent to the point-spread function, PSF).The half-flux radii were determined from all stars in the mag-nitude ranges 11.m0 < I < 15.m0, 9.m0 < J < 13.m0, and7.m0 < K < 10.m5 that do not lie within 50 pixels of the imageborder.
The entries in the table are the geometric means of the half-flux radii over the given images. The values are similar to, al-though in the I-band roughly 0.′′7 greater than, the full widthhalf maximum (FWHM) in arcseconds of the PSF calculated byPDAC. This is mainly due to the pixelization of the image.
Column 8: seeing quality as estimated from the photometryof stars (cf. Appendix A). 1 stands for good seeing (photome-try not affected), 2 for medium seeing (7′′-aperture photometryis affected), and 3 for bad seeing (all magnitudes affected). Thenumbers in brackets are an estimate of the seeing where the as-trometry was insufficient for a statistical comparison of the pho-tometry in the overlap regions.
Column 9: weather conditions. 1 indicates no clouds, 2 un-known conditions, 3 possible clouds, and 4 clouds.
Column 10: astrometric quality of the strips. The DENISstandard high accuracy of an rms of 0.′′2 is indicated with a 1,lower accuracy with 2. For strips where astrometric calibrationfailed we determined the coordinates from the DSS2-red images(accuracy of about 2−3′′).
Column 11: order of quality of strips with more than one ob-servation (1 indicates the best strip, higher numbers designatelower priorities).
All priority 1 strips, except strip 6052, had photometricweather conditions. Lower quality images will have a system-atic effect on the search results. It is unlikely to result in a lossof large galaxies, but in an increase of uncertain galaxies due tothe blurring of faint stars into patches similar in appearance tosmall and faint galaxies. The photometry of galaxies obtainedunder adverse seeing conditions will obviously also have largeruncertainties.
5. Galaxy extraction and parameters
Extended objects (“nebulae”) in general are either galaxies orobjects of Galactic origin (typically emission or reflection nebu-lae). In crowded areas we also find many stars that are blendedinto elongated objects, or groups of (unresolved) faint stars thatform a diffuse nebula-like patch. This is usually the main rea-son why automatic searches for galaxies, like SExtractor, failat low latitudes. The sharp gradient in surface brightness withradius can be used to distinguish blended stars from galaxies.But if the stars are very faint and in addition the seeing condi-tion is not very good, this criterion becomes less distinct even tothe eye.
We have visually examined all the images. This was donewith the DENIS visualisation package Denis3d by E. Copet. It
2 The STScI Digitized Sky Survey.
is optimally suited to such a search for extended objects: apartfrom the full image in a given band, it simultaneously displaysthe I, J, and K zoomed-in images under the cursor. Using thezoom-windows each whole image was systematically scanned.The simultaneous inspection of an object in the 3 passbands fa-cilitates the galaxy/star discrimination considerably as the rela-tive appearance of highly-obscured galaxies in the three bandsvaries compared to stars (cf. Fig. 1). To ensure homogeneity ofthe search the same cut-values were applied to all images (min =−30 ADU and max = 70 ADU, conforming to values of typically−4.6 to 10.8σ in I, −6.9 to 16.0σ in J, and −4.4 to 10.2σ in K).
We compared our results closely to the deep B-band cat-alogue by Woudt & Kraan-Korteweg (2001, hereafter WKK;Blim = 19.m0), i.e., our initial list of candidates was cross-correlated with the B-band detections. We found that we hadmissed a few low surface brightness galaxies. These generallyare very faint in the NIR, but we did recover them in hindsight.They were subsequently added to our list and classified as BG.Only one B-band galaxy was not visible in the NIR.
We also identified various extended Galactic objects; theyare discussed in more detail in Sect. 6.2. When classification asa galaxy was not clear-cut, we labelled the object as an uncertaingalaxy.
The automatic extraction package SExtractor (Bertin &Arnouts 1996) was used to derive IJK Kron-photometry for thevisually detected galaxies. SExtractor computes total magni-tudes (“best”) as well as photometry in apertures of 3′′, 5′′, 7′′,10′′, 20′′, and 40′′.
Colours were determined from the 7′′-aperture magnitudes.This aperture was chosen to minimise contamination by super-imposed stars on the one hand and the variation in seeing condi-tions on the other. Since the radial colour gradient is small in theNIR (e.g., Moriondo et al. 2001; Rembold et al. 2002), the effectof having different fractions of a galaxy within our fixed aperturewill be small and will introduce less uncertainty in the colourthan the increased star subtraction required for larger apertures.
By going back to the image, a careful analysis was made totest whether SExtractor has deblended all objects in the vicin-ity of the galaxy, and whether all the parameters agree with eachother. As a result we give quality parameters for the photometryin each band, depending on whether the 7′′-aperture and/or thetotal magnitude are estimated to be uncertain or unreliable.
Although SExtractor computes semi-major and semi-minor axes of an object, we have decided – for uniformity rea-sons – to derive the diameters by other means since not all ourgalaxies were extracted by SExtractor and some were con-taminated by not-deblended stars. We employed the contour fa-cility in ds9 (Joye & Mandel 2003) to measure the semi-majoraxis Ads9 out to isophotes of 21.m75, 20.m5, and 18.m0 in theI-, J-, and K-bands, respectively. The isophotes were selectedto be quarter integers close to values where the DENIS imagesin the search area have similar noise characteristics.
To compare our diameters with the parameters calculated bySExtractorwe used the isophotal area parameter ISOAREA:
Aiso =√ISOAREA/π/(B/A),
which is typically 2A (with an rms of 1.′′8). Figure 2 shows theresiduals (log Ads9 − log Aiso) for each band. They agree wellfor I and K, while the J-band shows a small but significantdeviation:
I : ∆(log A) = (0.04 ± 0.07) log Aiso + 0.05 ± 0.05
J : ∆(log A) = (−0.18 ± 0.07) log Aiso + 0.20 ± 0.06
K : ∆(log A) = (0.02 ± 0.07) log Aiso + 0.03 ± 0.04.

A. C. Schröder et al.: The highly obscured region around PKS 1343 – 601. I. 485
Fig. 2. The difference between the two estimates of the isophotal semi-major axis as determined with ds9, Ads9, and by SExtractor, Aiso, isplotted versus the logarithm of Aiso for each passband. The least squaresfit is plotted. Open circles (middle panel) indicate outliers removed ina second fit.
Two objects in the J-band fit show more than 3σ deviationsfrom the fit. In both cases the object is partly blended withnear-by stars which affects the automatic diameter extraction bySExtractor. If we exclude these outliers the fit will improveslightly to:
J : log Ads9 = (−0.12 ± 0.06) log Aiso + 0.14 ± 0.05.
These comparisons indicate that the isophotes of the semi-majoraxes derived with ds9 agree well with the SExtractor limitsin the I- and K-bands, whereas in the J-band SExtractor goesslightly fainter than µJ = 20.m5.
We have extracted magnitudes and diameters from all im-ages where the respective object is visible (at a reasonable dis-tance from the edge) and averaged those where the quality wasacceptable.
We estimated the morphological types by visually inspectingall DENIS images as well as the DSS-red images. Fairly accu-rate classifications are possible at low extinctions (a comparisonwith the morphological types determined by WKK show goodagreement). With increasing extinctions the outer spheroid be-comes more and more truncated and a distinction between typesmore uncertain. At the highest extinction levels only the bulgesof galaxies remain visible, making it impossible to distinguishbetween ellipticals and bulges of a spiral galaxies.
As a guide to the variation in dust content and the interpreta-tion of the (absorbed) object parameters, the Galactic foregroundextinctions have been determined from the IRAS/DIRBE mapsby Schlegel et al. (1998). The colour excess E(B − V) has beenconverted to AB using AB = RB E(B−V), where RB = RV AB/AV ,AB/AV = 1.337 (Cardelli et al. 1989), and RV = 3.1. Since theextinction maps were measured at 100 microns and converted toE(B − V) using RV = 3.1, the extinction values presented hereare not very sensitive to an uncertainty in RV . We present B-band
extinction rather than I-band extinctions for easier comparisonwith other works in the ZoA.
Note that the IRAS/DIRBE extinction maps are not prop-erly calibrated at latitudes |b| < 5◦ and therefore only provide anestimate. In Sect. 8, a first attempt was made at calibrating theIRAS/DIRBE maps based on the reddened colours of the galax-ies detected in this survey. Moreover, Schlegel et al. (1998) notein their paper that far-infrared point sources have been removedwhere source lists exists to correct for overestimates. This wasnot done for our search region, and we have taken care to checkfor possible point sources which could overestimate the local ex-tinctions. No such source has been found in the search area.
Cameron (1990) has shown that to correct highly absorbedisophotal magnitudes of galaxies it is necessary to apply botha correction to the magnitude as well as a correction for the factthat the angular diameter of an obscured object appears smallerand therefore the isophotal magnitude appears fainter. Cameronhas determined the correction for diameters in the optical B-bandup to extinctions of AB = 6m. The effect of extinction on theSExtractor Kron magnitudes is more difficult to estimate: theKron “total” magnitude is the magnitude computed in an ellipti-cal aperture aligned with the major axis found through the sec-ond moments but whose size is proportional to the first moment(Bertin & Arnouts 1996). The effect of extinction is to push theentire galaxy intensity profile down by some factor, which meansthat the detection isophote is smaller, hence the 1st order mo-ment is smaller, meaning the Kron aperture is smaller, and thederived magnitude is fainter.
To analyse this effect in detail was beyond the scope of thispaper, and we have not attempted a diameter correction for themagnitudes. Throughout the paper extinction-corrected magni-tudes mean a correction for magnitudes only, unless noted oth-erwise. On the other hand, the colours given refer to a fixed aper-ture where a diameter correction is unnecessary for all galaxieslarger than the aperture.
6. The catalogue
Table 2, which is available online at A&A, lists all the galax-ies and galaxy candidates in the searched area. The columns areas follows.
Column 1: identity consisting of the lettering DZOA (forDENIS-ZOA) followed by the DENIS slot number and a con-secutive number for each initial candidate.
Column 2: total number of sightings of same galaxy (e.g., onoverlap regions or repeat observations). A plus denotes an addi-tional observation from the pre-survey (these observations wereused for verification only).
Column 3: Right Ascension and Declination (J2000).A colon after the coordinates indicates a lower positional accu-racy (cf. Table 1). They were determined from the DSS-red im-ages.
Column 4: Galactic longitude l and latitude b in degrees.Column 5: B-band extinction AB as derived from the redden-
ing values E(B − V) of the IRAS/DIRBE maps (Schlegel et al.1998) using AB = 4.14 E(B − V). Note that the extinction val-ues are not calibrated for |b| < 5◦ and may be unreliable. Forthe subsequent analysis, the extinctions in the NIR bands werecalculated using Eqs. (1) in Sect. 3.
Column 6: classification of the candidate: DG stands forDENIS galaxy; UG stands for an uncertain galaxy; BG indicatesa galaxy that was identified after consulting the WKK catalogue.NG stands for a B-band galaxy that was found to be non-galaxianwith DENIS.
486 A. C. Schröder et al.: The highly obscured region around PKS 1343 – 601. I.
Column 7: visibility of the galaxy in the B-, I-, J-, andK-bands respectively, where 1 stands for a positive identificationand 0 for a non-detection.
Column 8: morphological type of the galaxy as estimatedfrom the appearance in all three NIR passbands as well as theDSS-red image. “E”: elliptical galaxy; “S”: spiral galaxy (withno possible differentiation between early- and late-type spiral);“SE”: early-type spiral; “SM” medium-type spiral; “SL”: late-type spiral (including irregulars). A question mark is given ifa distinction between an elliptical galaxy and the bulge of a spiralgalaxy was not possible. A dash is used where the object is nota galaxy (class NG).
Columns 9–11: total magnitudes and errors in I, J, and K,as derived using SExtractor (with the MAG_AUTO parameter).Note that a galaxy may be visible in one of the NIR bands buthave no magnitudes depending on the ability of SExtractor todetect or deblend the object from its neighbours.
Columns 12–14: the colours and errors obtained from the7′′-aperture magnitudes as derived using SExtractor and cor-rected for reddening using the DIRBE/IRAS extinction values:(I − J)0, (I − K)0, and (J − K)0.
Column 15: quality of the photometry for the I-band (firstdigit), J-band (second digit), and K-band (last digit): 0 meansgood photometry, 2 uncertainty in the 7′′-aperture magnitude,3 uncertainty in the total magnitude, and 4 uncertainty in both.5 means the 7′′-aperture magnitude is unreliable, 6 stands forunreliability in the total magnitude, and 7 means both areunreliable. A 9 indicates that the strip was non-photometric(strip 6052) and all photometry is unreliable (the estimatedextinction due to the clouds in this case is ∼0.m25−0.m3).Magnitudes with quality parameters 5–9 have been excluded inthe further analysis.
Columns 16–18: the major diameters of the galaxies in I,J, and K in arcseconds, derived at an isophote of 21.m75, 20.m5,and 18.m0, respectively. These isophotes have a comparable back-ground noise in all three bands across the entire search area.
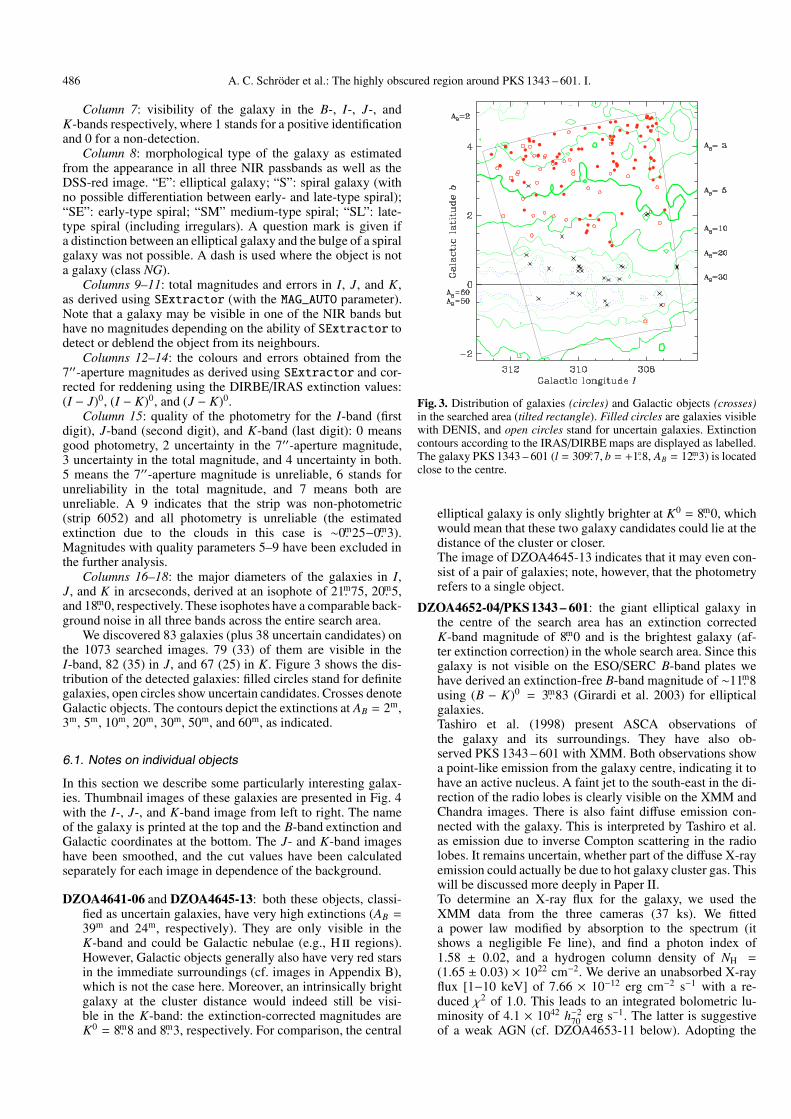
We discovered 83 galaxies (plus 38 uncertain candidates) onthe 1073 searched images. 79 (33) of them are visible in theI-band, 82 (35) in J, and 67 (25) in K. Figure 3 shows the dis-tribution of the detected galaxies: filled circles stand for definitegalaxies, open circles show uncertain candidates. Crosses denoteGalactic objects. The contours depict the extinctions at AB = 2m,3m, 5m, 10m, 20m, 30m, 50m, and 60m, as indicated.
6.1. Notes on individual objects
In this section we describe some particularly interesting galax-ies. Thumbnail images of these galaxies are presented in Fig. 4with the I-, J-, and K-band image from left to right. The nameof the galaxy is printed at the top and the B-band extinction andGalactic coordinates at the bottom. The J- and K-band imageshave been smoothed, and the cut values have been calculatedseparately for each image in dependence of the background.
DZOA4641-06 and DZOA4645-13: both these objects, classi-fied as uncertain galaxies, have very high extinctions (AB =39m and 24m, respectively). They are only visible in theK-band and could be Galactic nebulae (e.g., H ii regions).However, Galactic objects generally also have very red starsin the immediate surroundings (cf. images in Appendix B),which is not the case here. Moreover, an intrinsically brightgalaxy at the cluster distance would indeed still be visi-ble in the K-band: the extinction-corrected magnitudes areK0 = 8.m8 and 8.m3, respectively. For comparison, the central
Fig. 3. Distribution of galaxies (circles) and Galactic objects (crosses)in the searched area (tilted rectangle). Filled circles are galaxies visiblewith DENIS, and open circles stand for uncertain galaxies. Extinctioncontours according to the IRAS/DIRBE maps are displayed as labelled.The galaxy PKS 1343 – 601 (l = 309.◦7, b = +1.◦8, AB = 12.m3) is locatedclose to the centre.
elliptical galaxy is only slightly brighter at K0 = 8.m0, whichwould mean that these two galaxy candidates could lie at thedistance of the cluster or closer.The image of DZOA4645-13 indicates that it may even con-sist of a pair of galaxies; note, however, that the photometryrefers to a single object.
DZOA4652-04/PKS1343 – 601: the giant elliptical galaxy inthe centre of the search area has an extinction correctedK-band magnitude of 8.m0 and is the brightest galaxy (af-ter extinction correction) in the whole search area. Since thisgalaxy is not visible on the ESO/SERC B-band plates wehave derived an extinction-free B-band magnitude of ∼11.m8using (B − K)0 = 3.m83 (Girardi et al. 2003) for ellipticalgalaxies.Tashiro et al. (1998) present ASCA observations ofthe galaxy and its surroundings. They have also ob-served PKS 1343 – 601 with XMM. Both observations showa point-like emission from the galaxy centre, indicating it tohave an active nucleus. A faint jet to the south-east in the di-rection of the radio lobes is clearly visible on the XMM andChandra images. There is also faint diffuse emission con-nected with the galaxy. This is interpreted by Tashiro et al.as emission due to inverse Compton scattering in the radiolobes. It remains uncertain, whether part of the diffuse X-rayemission could actually be due to hot galaxy cluster gas. Thiswill be discussed more deeply in Paper II.To determine an X-ray flux for the galaxy, we used theXMM data from the three cameras (37 ks). We fitteda power law modified by absorption to the spectrum (itshows a negligible Fe line), and find a photon index of1.58 ± 0.02, and a hydrogen column density of NH =(1.65 ± 0.03) × 1022 cm−2. We derive an unabsorbed X-rayflux [1−10 keV] of 7.66 × 10⁻¹² erg cm−2 s−1 with a re-duced χ2 of 1.0. This leads to an integrated bolometric lu-minosity of 4.1 × 1042 h−2
70 erg s−1. The latter is suggestiveof a weak AGN (cf. DZOA4653-11 below). Adopting the

A. C. Schröder et al.: The highly obscured region around PKS 1343 – 601. I. 487
DZOA4641-06
A(B) = 38.6
I
l = 307.5095
J
b = -0.5747
K
DZOA4645-13
A(B) = 24.3
I
l = 308.0316
J
b = -1.0536
K
DZOA4652-04
A(B) = 12.3
I
l = 309.7211
J
b = 1.7317
K
DZOA4653-09
A(B) = 12.2
I
l = 309.7458
J
b = 1.5603
K
DZOA4653-11
A(B) = 12.0
I
l = 309.7709
J
b = 1.5061
K
DZOA4655-08
A(B) = 2.6
I
l = 310.8338
J
b = 4.1667
K
Fig. 4. I-, J-, and K-band images (left, middle, and right hand column, respectively) of the galaxies discussed in Sect. 6.1; the names are givenat the top, B-band extinctions and Galactic coordinates at the bottom of the respective row of images of the galaxy. The minimum and maximumcut values for the I-band are 1.0 and 300, respectively, for the J-band they are 0.05 and 70, respectively, and for the K-band they are 0.1 and 70,respectively.
above derived B-band magnitude we find log LB/L� = 11.0and log LX/LB = 31.6. Note that this value depends on theadopted (B − K) colour (a change of 0.m1 leads to a changeof 0.1 in log LB/L�).
DZOA4653-09: this is the second largest galaxy within thecluster centre area. With an extinction corrected K-bandmagnitude of 9.m1 it is about 1m fainter than PKS 1343 – 601.The extinction for both galaxies is very similar, but whilePKS 1343 – 601 is visible in all passbands, DZOA4645-13 is
only visible in the J- and K-bands. This suggests a lower sur-face brightness than for elliptical galaxies. DZOA4653-09 istherefore more likely to be an early or medium type spiral: inthe K-band the bulge is quite distinct and shows an elongatedfaint halo.This galaxy was not detected in the blind H i ParkesMultibeam survey of the ZoA (Schröder et al. 2005; Henninget al. 2005); it is therefore unlikely to be an H i-rich spi-ral at the cluster distance. On the other hand, being close

488 A. C. Schröder et al.: The highly obscured region around PKS 1343 – 601. I.
to the centre of the suspected cluster, this galaxy may beH i-deficient.
DZOA4653-11: this galaxy was discovered in the GalacticPlane optical identification programme of XMM-Newtonserendipitous sources carried out by the Survey ScienceCentre (Motch et al. 2003; Watson et al. 2001). It was iden-tified as a highly obscured AGN by Michel et al. (2004)though a significant part of the extinction is Galactic. Italso has an entry in the serendipitous 1XMM catalogue(XMM-Newton Survey Science Centre 2003).A deep I-band image obtained for the optical identifica-tion programme shows a bright bulge and very faint halo,which implies an early type spiral galaxy (see Fig. 1 inPiconcelli et al. 2006). The optical spectrum shows a promi-nent Hα line. Together with the [N ii] lines (λλ 6548, 6583)and [S ii] line (λ6731) this provides a heliocentric velocityof v = 3628 ± 12 km s−1, putting DZOA4653-09 right atthe cluster distance (see also the velocity determinations inSchröder et al. 2005; Masetti et al. 2006; and Piconcelli et al.2006).The XMM-Newton spectrum is highly absorbed due to bothintrinsic as well as Galactic absorption: using as a simplemodel a power law modified by absorption and a faint ironline (44 eV equivalent width), we found a photon index of1.20 ± 0.02 and a hydrogen column density of NH = (2.02±0.04) × 1022 cm−2. The Galactic column density at this pointis only NH = 1.07 × 1022 cm−2, hence there is significantintrinsic absorption (cf. PKS 1343 – 601).Piconcelli et al. (2006) discuss this galaxy in more detail.They conclude that DZOA4653-09 is likely to be an interme-diate Seyfert. Their more complex model gives an absorbedX-ray flux [1−10 keV] of 3.72 × 10⁻¹¹ erg cm−2 s−1 witha reduced χ2 of 0.94. According to Elvis et al. (1994) the in-trinsic hard band luminosity (L2−10) is about 3% of the bolo-metric luminosity for quasars, but Gandhi & Fabian (2003)find a value closer to 10% for Seyferts. Using the latter wederive a bolometric luminosity of 1.5 × 1044 h−2
70 erg s−1.We estimate the B-band magnitude to be 13.m0 using theextinction-corrected K-band magnitude of 9.m48 and thecolour (B − K)0 = 3.m50 (Girardi et al. 2003) for early-typespiral galaxies which is corrected for Galactic extinction aswell as internal absorption (we assume the internal absorp-tion to be negligible in the K-band). We find log LB/L� =10.5 and log LX/LB = 33.7, a typical value for AGNs.
DZOA4655-08: this galaxy is the only one in the entire searcharea that was found in the B-band but is not visible on theDENIS images. For completeness reasons we have includedit in our catalogue. DZOA4655-08 is a late type spiral andlies at a low extinction of AB = 2.m5. This is consistent withthe predictions in Fig. 1 to find more galaxies in the opticalthan in the NIR at low extinctions levels (AB < 2.m2; notethis limit depends quite strongly on morphological type andsurface brightness).
6.2. Galactic objects
Separating Galactic objects from galaxies at high extinction lev-els can be confusing: Galactic nebulae, like galaxies, can bebright at longer wavelengths, either because of the large ex-tinction or because of their intrinsically very red colours (e.g.,young stellar objects). Most of them are found at very low lat-itudes and very high extinctions (AB > 50m) and because ofthis are unlikely to be galaxies, but some were found at lower
extinctions. We used similarities in form and colour in compar-ison with other Galactic objects and definite galaxies to classifycases at medium extinctions. In addition, a couple of PlanetaryNebulae were found at low extinctions. These can be usuallyrecognised by their sharp and sometimes irregular edges.
We have listed all objects believed to be Galactic in Table 3,and thumbnail images of them are shown in Appendix B of theA&A online version. Columns 1–7 are as described in Table 2.The coordinates are either the estimated centre of the nebulosityor indicate the most prominent feature connected with it. Notethat the extinctions given in Col. 5 are total extinctions along theline-of-sight through our Galaxy, i.e., the actual extinction fora Galactic object can be anywhere between zero and the totalextinction. Where possible, the classification in Col. 6 indicatesPlanetary Nebulae (PN), reflection nebulae (RN), H ii regions,and young stellar objects (YSO) which show one or several veryred stars and some diffuse emission connected with it. The vis-ibility in the B-band in Col. 7 refers to the SSS3-blue images.Column 8 gives the name in the literature as found with NED4:2MASX stands for the 2MASS5 all-sky extended source cat-alogue (Two Micron All Sky Survey team), PMN for Parkes-MIT-NRAO Radio Survey (Griffith et al. 1994), AM for Arp& Madore (1987), and KK for Karachentseva & Karachentsev(2000).
7. Comparison with other catalogues
We have searched NED for known galaxies in our search area.Apart from 2MASS and WKK counterparts only few others hadbeen observed before, most of them in the radio. They are alllisted in Table 4. For quick reference we repeat the DENIS-ID(Col. 1), coordinates (Col. 2), extinction (Col. 3), class (Col. 4),and visibility (Col. 5) from the Cols. 1, 3, 5–7 in Table 2, respec-tively. Column 6 gives the 2MASS-ID from the extended sourcecatalogue (Two Micron All Sky Survey team 2003); Col. 7gives the WKK name and the last column gives other IDs fromother catalogues. These are IRAS for the IRAS Point SourceCatalog (IRAS PSC; Joint IRAS Science Working Group 1988),PMN for Parkes-MIT-NRAO Radio Survey (Griffith et al. 1994),HIZOA for Juraszek et al. (2000), HIZSS for the H i Parkes ZoAShallow Survey (Henning et al. 2000), NW04 for Nagayamaet al. (2004), PKS for the Parkes Catalog of radio sources(Wright & Otrupcek 1990) 4U for the Fourth Uhuru Catalog ofX-ray Sources (Forman et al. 1978), and 1XMM for the FirstXMM-Newton Serendipitous Source Catalogue (XMM-NewtonSurvey Science Centre 2003).
7.1. B-band
The WKK catalogue lists 35 galaxies within our search area.One galaxy (WKK2589, DZOA4655-08) is not visible on theDENIS images. It is a small, very low surface brightness galaxy,probably Sm or Irr. Five B-band galaxies, all classified as uncer-tain galaxies by WKK, were identified as (blended) stars with thehigher spatial resolution of the DENIS I-band images (they areclassified as NG in Table 2). Figure 5 shows the WKK galaxiesas plus signs overlaid over the plot shown in Fig. 3.
As expected from Fig. 1, most B-band galaxies are found inthe low extinction regions. The highest extinction for a B-bandgalaxy in the searched area is AB = 5.m2 (DZOA4641-07,
3 The SuperCOSMOS Sky Survey (Hambly et al. 2001).4 the NASA/IPAC Extragalactic Database.5 see http://irsa.ipac.caltech.edu/Missions/2mass.html

A. C. Schröder et al.: The highly obscured region around PKS 1343 – 601. I. 489
Table 3. Galactic objects detected in the search area.
Ident. N RA (J2000) Dec Gal � Gal b AtotB Class Visibil. Other name
(1) (2) (3a) (3b) (4a) (4b) (5) (6) (7) (8)DZOA4638-16 1 13 27 08.5 –62 03 17 307.10 0.53 28.9 ... 0 0 0 1 2MASXJ13270813-6203201DZOA4638-13 2 13 27 10.4 –62 05 05 307.10 0.50 28.1 ... 0 0 1 1DZOA4641-10a 2 13 32 12.4 –60 25 33 307.94 2.05 12.5 ... 1 1 1 1DZOA4641-12 5 13 32 30.9 –62 45 06 307.61 –0.25 127.6 HII? 0 1 1 1DZOA4642-09 6 13 32 31.4 –63 05 22 307.56 –0.59 50.0 HII 0 0 1 1 PMNJ1332-6305DZOA4642-07 3 13 32 48.8 –60 26 44 308.02 2.02 21.0 YSO 1 1 1 1 2MASXJ13324576-6026565, AM1326-601DZOA4647-04 1 13 40 26.4 –61 47 57 308.69 0.52 100.8 YSO 0 0 0 1DZOA4648-07 1 13 40 57.6 –61 45 44 308.75 0.55 113.4 ... 0 0 1 1 2MASXJ13405761-6145447DZOA4649-10 3+ 13 41 54.8 –62 07 43 308.79 0.17 39.9 ... 0 1 1 1DZOA4650-12 4++ 13 44 39.3 –62 05 31 309.12 0.14 94.2 HII 0 0 0 1DZOA4651-13 1 13 45 42.4 –62 00 32 309.25 0.20 46.0 ... 0 0 0 1DZOA4652-10b 1 13 46 20.8: –62 48 02: 309.16 –0.59 57.2 ... 0 1 1 1 2MASXJ13462058-6247597DZOA4652-09 1 13 46 37.4: –62 39 27: 309.22 –0.46 111.9 HII? 0 0 1 1 2MASXJ13463702-6239303DZOA4655-12 1 13 50 35.4 –61 40 18 309.89 0.40 143.4 YSO 0 0 1 1 2MASXJ13503488-6140199, (PMNJ1350-6141)DZOA4655-11 2 13 50 41.8 –61 35 09 309.92 0.48 151.6 YSO 0 0 0 1DZOA4655-09c 1 13 51 02.6 –61 30 15 309.98 0.55 77.0 ... 0 0 1 1 2MASXJ13510266-6130150DZOA4655-10 2 13 51 14.7 –61 32 35 309.99 0.51 97.5 ... 0 0 1 1DZOA4656-08d 1 13 51 37.9 –61 39 07 310.01 0.39 113.2 ... 0 1 1 1DZOA4656-06 1 13 51 59.8 –61 15 41 310.15 0.76 60.5 HII? 0 0 0 1 2MASXJ13515956-6115394DZOA4657-05 2 13 52 37.3 –62 19 00 309.97 –0.28 55.8 ... 0 0 1 1DZOA4657-06 2 13 53 23.3 –60 33 48 310.48 1.40 11.2 PN 1 1 1 1DZOA4658-07 1 13 54 15.9: –62 13 46: 310.18 –0.24 76.5 RN 1 1 1 1 KK2000-60DZOA4661-02 2 13 58 13.8 –58 54 31 311.48 2.85 4.4 PN 1 1 1 1DZOA4661-05 1 13 58 23.9 –61 21 45 310.87 0.47 57.1 ... 0 0 0 1DZOA4664-05 2 14 02 36.2 –61 05 44 311.43 0.60 57.2 HII? 0 0 1 1 2MASXJ14023620-6105450DZOA4664-04 1 14 02 52.9 –60 48 27 311.54 0.86 29.0 ... 0 0 1 1DZOA4664-06 1 14 02 52.9 –62 07 22 311.18 –0.40 93.6 HII? 0 0 0 1
a While this object shows two apparent point sources in the K-band, the B- and I-bands clearly show an elongated compact extended emissionwith the brightest part positioned on one of the point sources.b This object shows diffuse emission, as well as clumps, and possibly a dust lane. It could be a PN or a YSO seen on-edge.c Very faint, it seems to show comparable features to DZOA4652-10 and DZOA4656-08.d An extremely bright point source in the K-band, is also shows diffuse and clumpy extended emission and possible a dust lane in all bands.
WKK2301). The completeness limit for B0 = 15.m5 andD0 = 60′′ of the WKK-catalogue is AB = 3m (Woudt &Kraan-Korteweg 2001).
The B-band magnitudes are isophotal and comparable tothe B25 magnitudes. To derive (Galactic) extinction-correctedcolours (B− I)0, (B− J)0, and (B− K)0 for our galaxies we havetherefore used the total I-, J-, and K-band Kron-magnitudes.Note that these are more uncertain than colours from a fixedaperture due to problems with star subtraction. In addition, athigh extinctions it is necessary to correct the diameters as well asthe magnitudes (Cameron 1990). However, the diameter correc-tion for NIR data has not been investigated to date (cf. Sect. 5);hence, we have only applied a magnitude correction. Since thediameter correction affects mainly the disk we have not at-tempted to derive colours for the SL-types.
The mean corrected colours, the standard deviation, and thenumber of galaxies are given in Table 5 along with respectivevalues taken from Girardi et al. (2003; field and group galaxies)and from Moriondo et al. (2001; galaxies in the Pisces-Perseuscluster), where the latter two are corrected both for Galactic ex-tinction as well as for internal absorption. Since Moriondo et al.give only NIR photometry we have extracted the two correc-tion terms as well as the corrected B- and I-band data from theLEDA6 database. Both samples agree very well for (B − K), de-spite the large difference in the number of galaxies.
6 the Lyon-Meudon Extragalactic DAtabase, seehttp://leda.univ-lyon1.fr.
We have not attempted to correct our data for internal absorp-tion since the inclinations, as well as the morphological classifi-cations, are uncertain at these high foreground extinction levels.We therefore turned this correction off for the Moriondo et al.sample (see last entry in Table 5) to better compare it with oursample. The colours agree reasonably well within the errors, ex-cept for the sample of elliptical galaxies where only a coupleof galaxies contribute to the mean value: the standard deviationfor the two ellipticals in our sample is very small and they areclearly not representative.
The colours of our SM-sample are nominally redder than thecolours of our SE-sample. On the other hand, the standard de-viations of the two subsamples are at least twice as large as theones for the Moriondo et al. samples. Obviously, this effect ispartly due to the large uncertainties in morphological types ofour sample. In addition, while for large samples the statisticalmean is little affected by the (unknown) individual inclination-dependent corrections, small samples may be highly biased, andthe statistical means as well as the scatter may vary widely solelydue to a different distribution in inclinations.
Consequently, we can only say that the colours of thesetwo (small) subsamples appear to be similar. For example, if weinclude the colours of one galaxy found south of our search area(WKK2503 at l = 308.◦41 and b = −3.◦38) to the SM-sample,we find (B − I)0 = 1.43 instead of 1.70, (B − J)0 = 2.53 insteadof 2.82, and (B−K)0 = 3.59 instead of 3.93, which agrees muchbetter with the Moriondo et al. colours.

490 A. C. Schröder et al.: The highly obscured region around PKS 1343 – 601. I.
Table 4. Cross-identifications with other catalogues.
Ident. RA (J2000) Dec AB Class Visibil. 2MASX WKK Other names(1) (2a) (2b) (3) (4) (5) (6) (7) (8)
DZOA4638-04 13 27 20.3 –57 52 08 2.8 DG 0 1 1 1 J13272018-5752081DZOA4638-09 13 27 25.1 –58 20 28 2.6 DG 0 1 1 1 J13272507-5820282DZOA4638-03 13 28 10.0 –57 41 09 3.0 DG 0 1 1 1 J13280986-5741102DZOA4638-11 13 28 10.3 –60 22 59 5.0 DG 0 1 1 1 J13281021-6022580DZOA4638-10 13 28 11.0 –59 25 09 3.1 DG 0 1 1 0DZOA4638-06 13 28 15.4 –57 55 21 2.7 DG 0 1 1 1DZOA4638-01 13 28 37.1 –57 42 19 2.9 DG 1 1 1 1 J13283697-5742188 WKK 2267DZOA4639-07 13 28 44.4 –58 03 32 2.8 UG 0 1 1 0DZOA4639-06 13 28 49.7 –58 03 21 2.7 DG 1 1 1 1 J13284958-5803228 WKK 2271DZOA4639-19 13 29 00.3 –58 55 30 2.6 BG 1 1 1 0 WKK 2274DZOA4639-02 13 29 01.7 –57 37 32 3.0 DG 0 1 1 0DZOA4639-14 13 29 10.4 –59 42 27 4.1 UG 0 1 1 0DZOA4639-01 13 29 14.7 –57 37 06 3.1 UG 0 1 1 1DZOA4639-03 13 29 16.1 –57 39 56 2.9 DG 0 1 1 1 J13291609-5739562DZOA4639-05 13 29 17.7 –57 56 03 2.7 DG 1 1 1 1 J13291753-5756032 WKK 2278DZOA4639-10 13 29 25.8 –59 07 11 2.6 DG 0 1 1 1DZOA4639-09 13 29 33.2 –58 50 54 3.0 DG 1 1 1 1 J13293316-5850552 WKK 2281DZOA4639-08 13 29 40.9 –58 49 30 3.1 DG 0 1 1 1DZOA4639-16 13 29 50.5 –60 44 05 5.8 UG 0 1 1 1DZOA4639-13 13 29 51.9 –59 28 19 3.1 DG 1 1 1 1 WKK 2285DZOA4640-05 13 30 13.4 –59 08 34 3.1 DG 0 1 1 1DZOA4640-03 13 30 34.6 –58 29 24 3.4 DG 1 1 1 1 J13303446-5829247 WKK 2292DZOA4640-02 13 31 09.6 –58 09 45 2.8 DG 0 1 1 1 J13310962-5809453DZOA4641-01 13 31 33.3 –57 50 04 2.7 DG 1 1 1 1 J13313318-5750054 WKK 2300DZOA4641-04 13 31 36.6 –60 22 37 5.8 UG 0 0 1 1DZOA4641-02 13 31 43.7 –57 53 11 2.8 DG 1 1 1 1 J13314368-5753125 WKK 2303DZOA4641-06 13 32 03.3 –63 05 06 38.5 UG 0 0 0 1DZOA4642-04 13 33 11.8 –58 49 22 4.0 DG 1 1 1 1 WKK 2327DZOA4642-01 13 33 39.2 –57 47 42 2.8 DG 1 1 1 1 J13333914-5747422 WKK 2334DZOA4642-06 13 33 47.6 –59 03 07 3.9 DG 1 1 1 1 WKK 2336DZOA4642-02 13 33 58.2 –58 00 29 3.2 DG 1 1 1 1 WKK 2338DZOA4644-04 13 35 26.0 –59 14 38 4.1 UG 0 1 1 1DZOA4644-02 13 35 30.1 –57 53 47 3.4 DG 0 1 1 0DZOA4644-01 13 36 08.1 –57 37 48 2.7 DG 0 1 1 1DZOA4645-01 13 37 05.0 –58 02 40 3.1 DG 0 1 1 1DZOA4645-14 13 37 15.2 –57 37 11 2.7 BG 1 1 1 0 WKK 2386DZOA4645-13 13 37 20.7 –63 28 12 24.3 UG 0 0 1 1DZOA4645-09 13 37 24.7 –58 52 21 4.5 DG 1 1 1 1 J13372458-5852216 WKK 2390DZOA4645-04 13 37 31.9 –58 08 01 3.1 DG 0 1 1 1DZOA4645-08 13 37 32.8 –58 50 04 4.5 DG 1 1 1 1 J13373272-5850056 WKK 2392DZOA4645-10 13 37 32.9 –58 54 14 4.5 DG 0 1 1 1 J13373282-5854136 IRAS 13342-5830 PMN J1337-5854DZOA4645-03 13 37 44.1 –58 06 37 3.0 UG 0 1 1 1DZOA4645-05 13 37 44.3 –58 13 26 3.5 DG 1 1 1 0 WKK 2397DZOA4645-02 13 37 51.3 –58 00 59 2.9 DG 0 1 1 0DZOA4645-07 13 37 59.2 –58 30 55 4.7 DG 0 1 1 1 J13375912-5830556DZOA4646-01 13 38 03.3 –58 14 27 3.5 UG 0 1 1 1DZOA4646-03 13 38 08.5 –58 45 19 4.1 DG 0 1 1 1 J13380855-5845197DZOA4646-04 13 38 16.6 –59 00 15 4.3 DG 0 1 1 1DZOA4646-06 13 38 21.7 –60 17 02 9.0 DG 0 1 1 1DZOA4647-03 13 39 17.6 –59 04 46 4.3 UG 0 1 1 1DZOA4647-01 13 39 39.7 –58 04 00 3.5 DG 0 1 1 1 J13393970-5804007DZOA4647-02 13 39 52.7 –57 42 17 2.6 DG 1 1 1 1 WKK 2435DZOA4649-02 13 41 54.8 –58 48 28 3.9 DG 0 1 1 1 IRAS 13386-5832 HIZOA J1341-58DZOA4649-07 13 42 09.8 –61 08 18 12.0 DG 0 0 1 1DZOA4649-06 13 42 29.6 –61 01 23 13.0 DG 0 0 1 1 HIZSS 082 HIZOA J1342-61DZOA4649-03 13 42 35.6 –59 33 18 6.7 UG 0 1 1 0DZOA4649-01 13 42 59.9 –57 39 06 2.5 DG 1 1 1 1 WKK 2483DZOA4650-09 13 44 03.7 –60 19 35 10.4 DG 0 1 1 1 J13440358-6019350DZOA4650-01 13 44 36.5 –58 13 10 3.9 DG 0 1 1 1DZOA4651-05 13 45 00.2 –59 22 17 6.2 UG 0 1 1 0DZOA4651-02 13 45 17.7 –58 12 01 3.5 DG 0 1 1 0DZOA4651-08 13 45 25.3 –60 29 14 11.9 UG 0 0 1 1 NW04-03DZOA4651-06 13 45 50.7 –60 09 05 8.2 DG 0 1 1 1 J13455154-6009067 NW04-08DZOA4652-01 13 46 40.3: –57 39 50: 2.3 UG 0 1 1 1

A. C. Schröder et al.: The highly obscured region around PKS 1343 – 601. I. 491
Table 4. continued.
Ident. RA (J2000) Dec AB Class Visibil. 2MASX WKK Other names(1) (2a) (2b) (3) (4) (5) (6) (7) (8)
DZOA4652-04 13 46 48.9: –60 24 29: 12.3 DG 0 1 1 1 J13464910-6024299 NW04-24 PKS 1343-601 Centaurus BDZOA4652-02 13 46 57.3: –58 10 19: 3.3 DG 0 1 1 0 HIZOA J1347-58DZOA4653-09 13 47 18.5 –60 34 13 12.2 DG 0 0 1 1 J13471848-6034133 NW04-38DZOA4653-03 13 47 32.3 –58 47 45 3.8 UG 0 1 1 0DZOA4653-11 13 47 36.2 –60 37 04 12.0 DG 0 1 1 1 NW04-45 4U 1344-60 1XMM J134736.1-603704DZOA4653-04 13 47 38.2 –58 52 15 4.3 UG 0 1 1 0DZOA4653-01 13 47 44.1 –58 26 38 3.8 UG 0 1 1 1DZOA4653-07 13 48 27.5 –60 11 47 10.7 DG 0 1 1 1 NW04-51DZOA4654-03 13 49 04.0 –58 27 34 3.2 UG 0 1 1 1DZOA4654-04 13 49 41.3 –57 48 40 2.6 NG 1 1 0 0 WKK 2559DZOA4654-02 13 49 46.1 –58 13 04 2.6 DG 1 1 1 1 J13494605-5813040 WKK 2562DZOA4654-01 13 49 49.9 –57 37 25 2.5 DG 1 1 1 0 WKK 2564DZOA4655-01 13 50 21.3 –58 17 12 2.9 DG 0 1 1 1 J13502126-5817121DZOA4655-04 13 50 47.0 –59 23 08 6.0 DG 0 1 1 1 J13504691-5923083DZOA4655-07 13 50 51.8 –57 43 02 2.6 NG 1 1 1 0 WKK 2586DZOA4655-03 13 50 55.3 –59 08 29 4.1 DG 0 1 1 1DZOA4655-02 13 50 56.5 –58 27 46 3.5 DG 0 1 1 1DZOA4655-08 13 51 03.5 –57 47 15 2.6 BG 1 0 0 0 WKK 2589DZOA4656-01 13 51 31.9 –58 23 01 3.0 DG 0 1 1 1DZOA4656-04 13 51 33.9 –60 07 17 9.2 UG 0 1 1 1DZOA4656-03 13 51 38.6 –58 35 15 4.1 DG 1 1 1 1 J13513848-5835153 WKK 2596 IRAS 13483-5820 HIZSS 084 HIZOA J1351-58DZOA4656-02 13 51 39.8 –58 26 48 3.2 UG 0 1 0 0DZOA4657-03 13 52 55.4 –58 09 59 2.3 UG 0 1 1 1DZOA4657-04 13 53 08.7 –58 12 59 2.4 UG 0 1 1 0DZOA4657-02 13 53 32.4 –57 49 30 2.7 DG 0 1 1 1DZOA4657-01 13 53 34.1 –57 49 10 2.7 DG 0 1 1 1 J13533399-5749098DZOA4658-06 13 54 18.1: –59 56 14: 10.1 UG 0 1 1 0DZOA4658-04 13 54 23.1: –58 06 30: 2.5 DG 0 1 1 1 J13542319-5806299DZOA4658-03 13 54 27.3: –58 07 35: 2.6 DG 1 1 1 1 J13542749-5807328 WKK 2660DZOA4658-01 13 54 38.5: –57 41 11: 2.3 DG 1 1 1 0 WKK 2669DZOA4658-05 13 54 39.5: –58 31 07: 3.4 UG 0 1 1 1DZOA4659-13 13 55 18.4 –58 05 32 2.8 UG 0 1 1 1DZOA4659-11 13 55 29.0 –57 38 59 2.4 BG 1 1 1 0 WKK 2684DZOA4659-10 13 55 29.5 –57 35 26 2.4 BG 1 1 1 0 WKK 2686DZOA4659-01 13 55 43.5 –57 48 38 2.9 UG 0 1 1 1 J13554342-5748384DZOA4659-02 13 56 07.7 –58 52 21 3.8 UG 0 1 1 1DZOA4659-05 13 56 09.7 –59 46 14 8.2 UG 0 1 1 1DZOA4660-06 13 56 42.9 –59 11 16 5.1 NG 1 1 1 1 WKK 2708DZOA4660-02 13 56 52.3 –57 51 53 2.5 DG 1 1 1 1 WKK 2714DZOA4660-05 13 57 01.5 –59 12 35 5.4 DG 0 1 1 1 J13570135-5912362DZOA4660-03 13 57 06.7 –58 02 43 2.9 DG 0 1 1 1DZOA4660-01 13 57 08.2 –57 44 09 2.6 UG 0 1 1 1DZOA4660-04 13 57 46.6 –58 07 01 3.0 DG 0 1 1 1 J13574653-5807028DZOA4661-04 13 58 40.7 –58 18 13 3.6 NG 1 1 1 0 WKK 2755DZOA4661-03 13 58 52.6 –59 45 47 8.9 UG 0 1 1 1DZOA4661-01 13 58 57.0 –58 46 02 4.3 DG 1 1 1 1 J13585694-5846014 WKK 2764DZOA4662-02 13 59 35.7: –58 25 49: 4.5 UG 0 1 1 1 J13593587-5825489DZOA4662-03 14 00 01.9: –58 29 06: 4.8 UG 0 1 1 0DZOA4662-01 14 00 04.0: –57 50 02: 2.7 DG 1 1 1 1 WKK 2785DZOA4662-04 14 00 10.9: –59 12 35: 5.3 UG 0 1 1 0DZOA4662-07 14 00 26.9: –60 18 31: 15.4 UG 0 0 1 1DZOA4663-05 14 00 33.9 –59 32 32 6.6 DG 0 1 1 1DZOA4663-02 14 00 55.3 –57 37 23 2.9 DG 0 1 1 0DZOA4663-01 14 00 55.8 –57 37 28 2.9 DG 0 1 1 0 J14005571-5737279DZOA4663-04 14 01 25.6 –58 37 37 4.4 DG 0 1 1 1DZOA4663-03 14 01 35.4 –58 32 22 4.3 UG 0 1 1 0DZOA4664-03 14 02 42.0 –57 44 08 3.3 NG 1 1 0 0 WKK 2872DZOA4664-02 14 03 11.2 –58 06 20 3.6 DG 0 1 1 1 J14031094-5806201DZOA4665-02 14 03 13.8 –58 07 13 3.6 DG 0 1 1 1 J14031384-5807141DZOA4665-03 14 03 57.5 –58 09 49 4.0 UG 0 1 1 1DZOA4665-01 14 04 21.0 –57 43 33 2.9 DG 0 1 1 1 J14042102-5743339DZOA4666-01 14 05 35.9 –59 32 19 8.5 UG 0 1 1 1
492 A. C. Schröder et al.: The highly obscured region around PKS 1343 – 601. I.
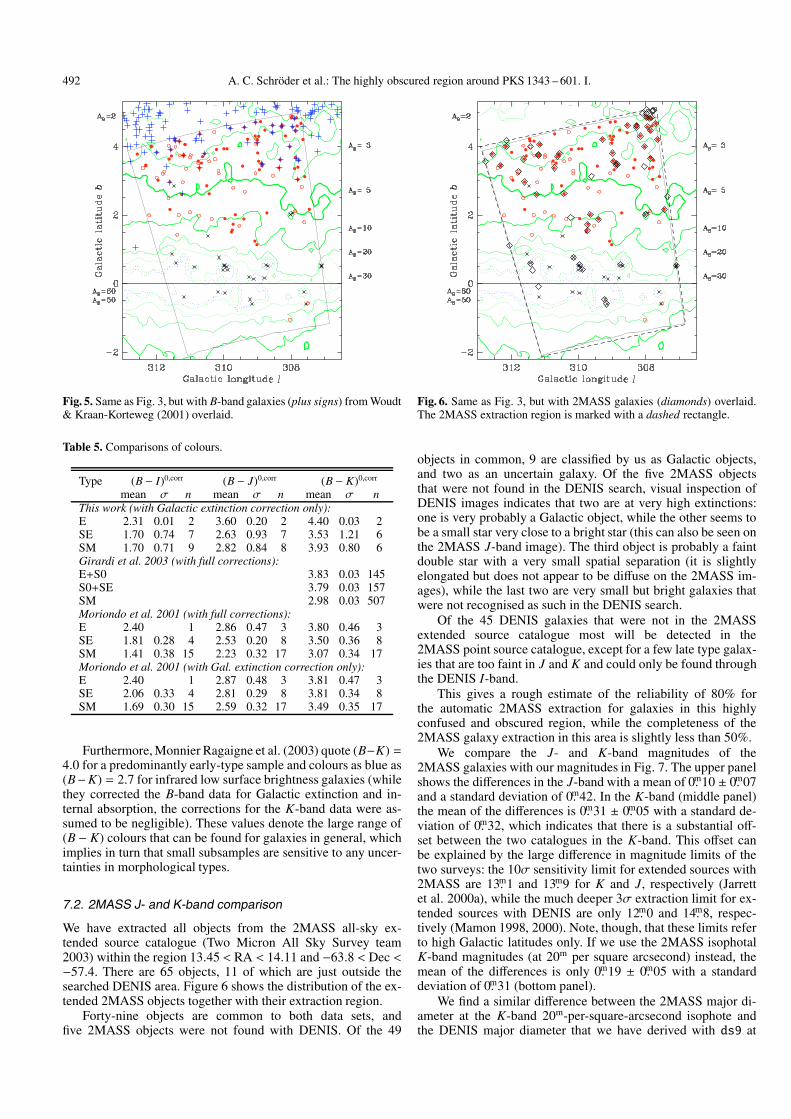
Fig. 5. Same as Fig. 3, but with B-band galaxies (plus signs) from Woudt& Kraan-Korteweg (2001) overlaid.
Table 5. Comparisons of colours.
Type (B − I)0,corr (B − J)0,corr (B − K)0,corr
mean σ n mean σ n mean σ nThis work (with Galactic extinction correction only):E 2.31 0.01 2 3.60 0.20 2 4.40 0.03 2SE 1.70 0.74 7 2.63 0.93 7 3.53 1.21 6SM 1.70 0.71 9 2.82 0.84 8 3.93 0.80 6Girardi et al. 2003 (with full corrections):E+S0 3.83 0.03 145S0+SE 3.79 0.03 157SM 2.98 0.03 507Moriondo et al. 2001 (with full corrections):E 2.40 1 2.86 0.47 3 3.80 0.46 3SE 1.81 0.28 4 2.53 0.20 8 3.50 0.36 8SM 1.41 0.38 15 2.23 0.32 17 3.07 0.34 17Moriondo et al. 2001 (with Gal. extinction correction only):E 2.40 1 2.87 0.48 3 3.81 0.47 3SE 2.06 0.33 4 2.81 0.29 8 3.81 0.34 8SM 1.69 0.30 15 2.59 0.32 17 3.49 0.35 17
Furthermore, Monnier Ragaigne et al. (2003) quote (B−K) =4.0 for a predominantly early-type sample and colours as blue as(B−K) = 2.7 for infrared low surface brightness galaxies (whilethey corrected the B-band data for Galactic extinction and in-ternal absorption, the corrections for the K-band data were as-sumed to be negligible). These values denote the large range of(B − K) colours that can be found for galaxies in general, whichimplies in turn that small subsamples are sensitive to any uncer-tainties in morphological types.
7.2. 2MASS J- and K-band comparison
We have extracted all objects from the 2MASS all-sky ex-tended source catalogue (Two Micron All Sky Survey team2003) within the region 13.45 < RA < 14.11 and −63.8 < Dec <−57.4. There are 65 objects, 11 of which are just outside thesearched DENIS area. Figure 6 shows the distribution of the ex-tended 2MASS objects together with their extraction region.
Forty-nine objects are common to both data sets, andfive 2MASS objects were not found with DENIS. Of the 49
Fig. 6. Same as Fig. 3, but with 2MASS galaxies (diamonds) overlaid.The 2MASS extraction region is marked with a dashed rectangle.
objects in common, 9 are classified by us as Galactic objects,and two as an uncertain galaxy. Of the five 2MASS objectsthat were not found in the DENIS search, visual inspection ofDENIS images indicates that two are at very high extinctions:one is very probably a Galactic object, while the other seems tobe a small star very close to a bright star (this can also be seen onthe 2MASS J-band image). The third object is probably a faintdouble star with a very small spatial separation (it is slightlyelongated but does not appear to be diffuse on the 2MASS im-ages), while the last two are very small but bright galaxies thatwere not recognised as such in the DENIS search.
Of the 45 DENIS galaxies that were not in the 2MASSextended source catalogue most will be detected in the2MASS point source catalogue, except for a few late type galax-ies that are too faint in J and K and could only be found throughthe DENIS I-band.
This gives a rough estimate of the reliability of 80% forthe automatic 2MASS extraction for galaxies in this highlyconfused and obscured region, while the completeness of the2MASS galaxy extraction in this area is slightly less than 50%.
We compare the J- and K-band magnitudes of the2MASS galaxies with our magnitudes in Fig. 7. The upper panelshows the differences in the J-band with a mean of 0.m10 ± 0.m07and a standard deviation of 0.m42. In the K-band (middle panel)the mean of the differences is 0.m31 ± 0.m05 with a standard de-viation of 0.m32, which indicates that there is a substantial off-set between the two catalogues in the K-band. This offset canbe explained by the large difference in magnitude limits of thetwo surveys: the 10σ sensitivity limit for extended sources with2MASS are 13.m1 and 13.m9 for K and J, respectively (Jarrettet al. 2000a), while the much deeper 3σ extraction limit for ex-tended sources with DENIS are only 12.m0 and 14.m8, respec-tively (Mamon 1998, 2000). Note, though, that these limits referto high Galactic latitudes only. If we use the 2MASS isophotalK-band magnitudes (at 20m per square arcsecond) instead, themean of the differences is only 0.m19 ± 0.m05 with a standarddeviation of 0.m31 (bottom panel).
We find a similar difference between the 2MASS major di-ameter at the K-band 20m-per-square-arcsecond isophote andthe DENIS major diameter that we have derived with ds9 at
A. C. Schröder et al.: The highly obscured region around PKS 1343 – 601. I. 493
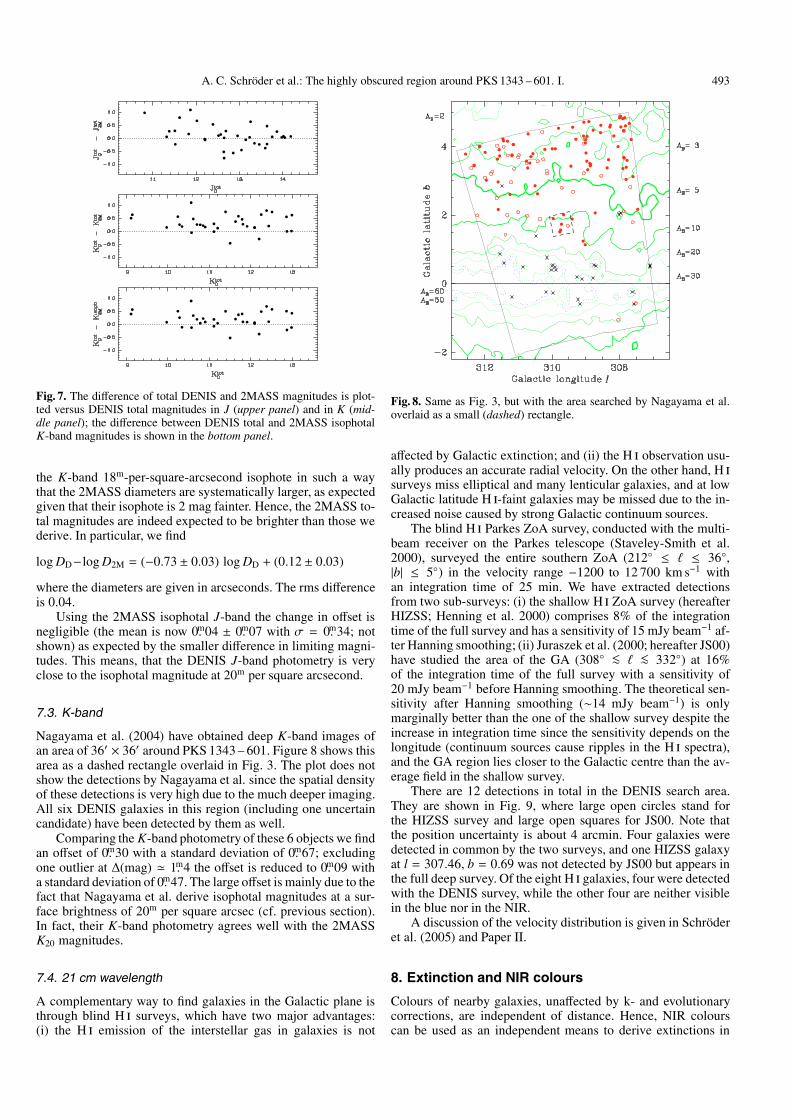
Fig. 7. The difference of total DENIS and 2MASS magnitudes is plot-ted versus DENIS total magnitudes in J (upper panel) and in K (mid-dle panel); the difference between DENIS total and 2MASS isophotalK-band magnitudes is shown in the bottom panel.
the K-band 18m-per-square-arcsecond isophote in such a waythat the 2MASS diameters are systematically larger, as expectedgiven that their isophote is 2 mag fainter. Hence, the 2MASS to-tal magnitudes are indeed expected to be brighter than those wederive. In particular, we find
log DD−log D2M = (−0.73 ± 0.03) log DD + (0.12 ± 0.03)
where the diameters are given in arcseconds. The rms differenceis 0.04.
Using the 2MASS isophotal J-band the change in offset isnegligible (the mean is now 0.m04 ± 0.m07 with σ = 0.m34; notshown) as expected by the smaller difference in limiting magni-tudes. This means, that the DENIS J-band photometry is veryclose to the isophotal magnitude at 20m per square arcsecond.
7.3. K-band
Nagayama et al. (2004) have obtained deep K-band images ofan area of 36′ × 36′ around PKS 1343 – 601. Figure 8 shows thisarea as a dashed rectangle overlaid in Fig. 3. The plot does notshow the detections by Nagayama et al. since the spatial densityof these detections is very high due to the much deeper imaging.All six DENIS galaxies in this region (including one uncertaincandidate) have been detected by them as well.
Comparing the K-band photometry of these 6 objects we findan offset of 0.m30 with a standard deviation of 0.m67; excludingone outlier at ∆(mag) � 1.m4 the offset is reduced to 0.m09 witha standard deviation of 0.m47. The large offset is mainly due to thefact that Nagayama et al. derive isophotal magnitudes at a sur-face brightness of 20m per square arcsec (cf. previous section).In fact, their K-band photometry agrees well with the 2MASSK20 magnitudes.
7.4. 21 cm wavelength
A complementary way to find galaxies in the Galactic plane isthrough blind H i surveys, which have two major advantages:(i) the H i emission of the interstellar gas in galaxies is not
Fig. 8. Same as Fig. 3, but with the area searched by Nagayama et al.overlaid as a small (dashed) rectangle.
affected by Galactic extinction; and (ii) the H i observation usu-ally produces an accurate radial velocity. On the other hand, H isurveys miss elliptical and many lenticular galaxies, and at lowGalactic latitude H i-faint galaxies may be missed due to the in-creased noise caused by strong Galactic continuum sources.
The blind H i Parkes ZoA survey, conducted with the multi-beam receiver on the Parkes telescope (Staveley-Smith et al.2000), surveyed the entire southern ZoA (212◦ ≤ � ≤ 36◦,|b| ≤ 5◦) in the velocity range −1200 to 12 700 km s−1 withan integration time of 25 min. We have extracted detectionsfrom two sub-surveys: (i) the shallow H i ZoA survey (hereafterHIZSS; Henning et al. 2000) comprises 8% of the integrationtime of the full survey and has a sensitivity of 15 mJy beam−1 af-ter Hanning smoothing; (ii) Juraszek et al. (2000; hereafter JS00)have studied the area of the GA (308◦ <∼ � <∼ 332◦) at 16%of the integration time of the full survey with a sensitivity of20 mJy beam−1 before Hanning smoothing. The theoretical sen-sitivity after Hanning smoothing (∼14 mJy beam−1) is onlymarginally better than the one of the shallow survey despite theincrease in integration time since the sensitivity depends on thelongitude (continuum sources cause ripples in the H i spectra),and the GA region lies closer to the Galactic centre than the av-erage field in the shallow survey.
There are 12 detections in total in the DENIS search area.They are shown in Fig. 9, where large open circles stand forthe HIZSS survey and large open squares for JS00. Note thatthe position uncertainty is about 4 arcmin. Four galaxies weredetected in common by the two surveys, and one HIZSS galaxyat l = 307.46, b = 0.69 was not detected by JS00 but appears inthe full deep survey. Of the eight H i galaxies, four were detectedwith the DENIS survey, while the other four are neither visiblein the blue nor in the NIR.
A discussion of the velocity distribution is given in Schröderet al. (2005) and Paper II.
8. Extinction and NIR colours
Colours of nearby galaxies, unaffected by k- and evolutionarycorrections, are independent of distance. Hence, NIR colourscan be used as an independent means to derive extinctions in

494 A. C. Schröder et al.: The highly obscured region around PKS 1343 – 601. I.
Fig. 9. Same as Fig. 3, but with galaxies detected with HIZSS (largeopen circles) and JS00 (large open squares) overlaid.
low latitude areas where the IRAS/DIRBE maps of Schlegelet al. (1998) are not properly calibrated. For our analysiswe have applied the extinction correction according to theIRAS/DIRBE maps to all colours and look for dependencies inthe residuals.
Figure 10 shows the results (filled circles are galaxies, opencircles uncertain candidates): galaxies at higher extinctions areclearly too blue, i.e., the extinctions of the IRAS/DIRBE maps areoverestimated at low galactic latitudes. The least squares fits tothe filled circles (i.e., excluding the uncertain candidates) give:
(I − J)0 = (−0.04±0.01)AB + (1.07±0.06), (2)
(J − K)0 = (−0.01±0.01)AB + (0.94±0.05), (3)
(I − K)0 = (−0.06±0.02)AB + (2.15±0.09), (4)
where the rms deviations of the data points from the best fit lineare σ = 0.21, 0.18, and 0.28, respectively. A Spearman Rank testindicates probabilities of 0.11, 0.21, and 0.04 that the slopes ofthe fits in I − J, J − K, and I − K, occur by chance, respectively.
For a generic colour C, Eqs. (2)–(4) can be written as
C0 = aAB + b, (5)
the reddening equation is simply
C = C0 +
(EAB
)AB, (6)
and the true extinction-corrected colour is
C0 = C −(
EAB
)AB. (7)
Combining Eqs. (5)–(7), one gets
C0 = a AB + b +(AB − AB
) (EAB
)· (8)
If the opacity is overestimated by some constant factor, that is,if the extinction, AB, is overestimated by some constant additiveterm, there would be no slope in Fig. 10, i.e., a = 0 for C0 to beindependent of AB in Eq. (8).
Fig. 10. The NIR colours, corrected for extinction according to theIRAS/DIRBE maps, are plotted versus extinction in the B-band. Filledcircles are galaxies, while open circles are uncertain galaxies. The linerepresents the least squares fit to the filled circles only.
We therefore now assume that the true extinction is a con-stant f times the IRAS/DIRBE value of Schlegel et al.:
AB = f AB, (9)
and that the selective extinctions in the DENIS bands given inEqs. (1) (see Sect. 3) are exact (we use tilde signs for “true”quantities). Equation (8) becomes
C0 =
[a + (1 − f )
(EAB
)]AB + b, (10)
so, for the extinction-corrected colour to be independent of AB,and hence AB (from Eq. (9)), the quantity in brackets in Eq. (10)must be zero, yielding
f = 1 +a
E/AB· (11)
With the selective extinctions of Eqs. (1) and the a coefficientsfrom Eqs. (2)–(4), Eq. (11) yields f = 0.84 ± 0.05 using I − J,f = 0.93 ± 0.08 using J − K, and f = 0.83 ± 0.05 using I − K.Combining the first two, independent, estimates of f (see, e.g.,Appendix A of Sanchis et al. 2004), we conclude that
AB = (0.87 ± 0.04) AB, (12)
i.e., in this area of the Galactic plane, the true reddening appearsto be 13% lower than the IRAS/DIRBE estimate of Schlegel et al.
8.1. Caveats
With a sample like the present one, where the uncertainties arelarge, it is important to understand the possible biases and differ-ent explanations for the effect seen. In the following we addressthe most important caveats.

A. C. Schröder et al.: The highly obscured region around PKS 1343 – 601. I. 495
8.1.1. Patchiness
One of the problems with attempting to calibrate the extinctionsin the Galactic plane is the relatively poor spatial resolution of 6′of the IRAS/DIRBE maps, which misses extinction variationson smaller angular scales. As a consequence it is possible thatwe miss galaxies in the high-extinction patches and thereforeunderestimate the overall true extinction.
We have tested this by restricting our least squares fit tothe points below AB = 10m, assuming that we find all galaxiesaround AB = 10m and that the variations in AB are not very large(this is confirmed by the fact that no considerable changes in starcounts in the I-band are apparent at these extinction levels). Theleast squares fits to our data of Fig. 10, restricted to AB < 10m,now show considerably larger variations and errors:
(I − J)0 = (+0.04 ± 0.03)AB + (0.83 ± 0.11), (13)
(J − K)0 = (−0.04 ± 0.02)AB + (1.07 ± 0.08), (14)
(I − K)0 = (−0.00 ± 0.04)AB + (1.95 ± 0.16), (15)
where the rms deviations of the data points from the best fit lineare similar to the fit to the full range in extinction, namely σ =0.20, 0.16, and 0.26, respectively. The resulting corrections forthe extinction are now (Eq. (11)): f = 1.15 ± 0.13 using I − J,f = 0.64 ± 0.17 using J − K, and f = 0.99 ± 0.12 using I − K.Combining the first two (independent) estimates of f , which are,however, not consistent anymore, we find
AB = (0.96 ± 0.10) AB. (16)
Therefore, the IRAS/DIRBE extinctions of Schlegel et al. are con-sistent with the NIR colours of the galaxies of our sample, re-stricted to AB < 10m.
The major drawback of this method is that our restrictedsample has only very few galaxies above AB = 5m and nonebelow AB = 2.m2, hence, the range in extinctions is too smallto provide meaningful fits. With a larger sample one could alsocompare the scatter in colour at low and at high extinctions: thescatter in colour at any given extinction is expected to be in-flated by the uncertainty in the extinction correction; in otherwords, the extinctions would have considerably large error bars.A galaxy in a higher extinction patch would be redder than ex-pected, and if we start missing galaxies at the highest extinctionsit means we are biased towards the blue. We would therefore ex-pect the scatter in colour to decrease at the high extinction endbecause we would miss more and more of the red galaxies andhence be biased towards the blue as the fits indicate.
We could test this on a different project, the search forNIR counterparts of galaxies found in a blind H i survey(Schröder et al. 2005). This sample covers the extinction range1m < AB < 8m with better statistics, and we do not find sucha decrease in scatter. In fact, the dependence on extinction foundin this project confirms our first result (Eq. (12)), i.e.,
AB = (0.79 ± 0.05) AB. (17)
A comparison of the estimates of f for the colour I − K givesmore consistent results (the sample of galaxies here is slightlydifferent and comprises only of galaxies with measurements inall three passbands): f = 0.83 ± 0.05 from Eq. (4), and f =0.84 ± 0.08 from Schröder et al. (2005). The estimate of f fromthe low extinction sample, i.e., f = 0.99± 0.12 (Eq. (15)), agreeswithin the errors.
We are therefore confident that the variation of the extinctionon a small scale (the x-axis error) at these levels is small and doesnot affect our fit significantly.
Fig. 11. The NIR colours, corrected for extinction according to theIRAS/DIRBE maps, as a function of distance from PKS 1343 – 601 indegrees. Filled circles are galaxies, while open circles are uncertaingalaxies. The line represents the least squares fit to the filled circles.
8.1.2. Morphological segregation
Rich clusters usually show a morphological segregation:one finds predominantly early-type (red) galaxies in the centreand late-type (blue) galaxies in the outskirts of a cluster.
To investigate this we have plotted the colours corrected forextinction according to the IRAS/DIRBE maps as a function ofdistance to PKS 1343 – 601 in degrees (Fig. 11), assuming thatPKS 1343 – 601 is at or very near the centre of the cluster.
Contrary to the expectation we find that the galaxies close toPKS 1343 – 601 are clearly bluer than those at a larger distance.However, since the cluster seems to be much smaller than ex-pected (see Paper II where we derive a virial radius of ∼0.◦3),we do not expect to see any colour change due to morphologi-cal segregation much beyond that. In fact, if we exclude the inner0.◦6 from the fit we do not find any significant dependence on dis-tance anymore. On the other hand, we cannot achieve a properfit using only the six galaxies within the inner 0.◦6 since the scat-ter is too large. We therefore cannot determine whether we seea colour change due to morphological segregation.
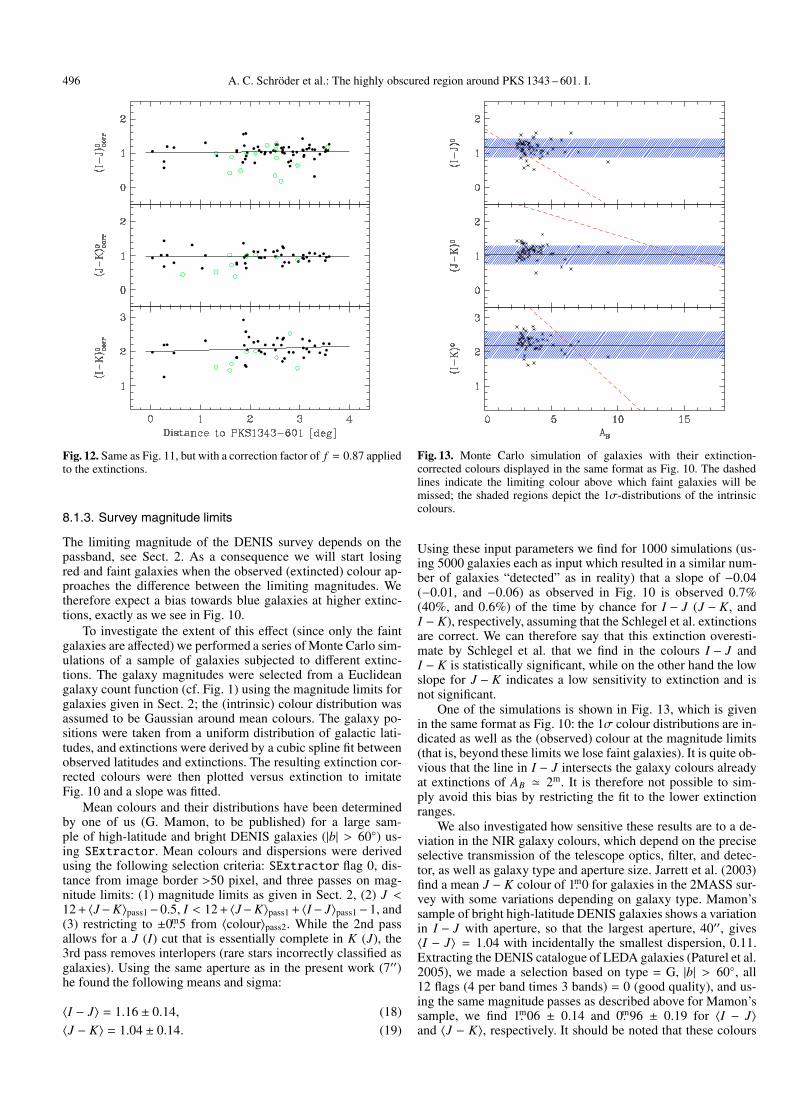
To explain why the inner six galaxies are bluer than the restwe refer to Fig. 3 which shows that these galaxies are all lo-cated at the highest extinction levels where we still find galaxies.In other words, Fig. 11 shows only the extinction effect seen inFig. 10 in a slightly different form. To demonstrate this, we havecorrected the colours for the extinction as determined in Eq. (12),and Fig. 12 with the corrected colours shows no further depen-dence on extinction, i.e., the slopes are now consistent with zero.No difference can be seen between the galaxies within the virialradius and the rest, and we conclude that any possible effect ofmorphological segregation does not affect our fit significantly.
496 A. C. Schröder et al.: The highly obscured region around PKS 1343 – 601. I.
Fig. 12. Same as Fig. 11, but with a correction factor of f = 0.87 appliedto the extinctions.
8.1.3. Survey magnitude limits
The limiting magnitude of the DENIS survey depends on thepassband, see Sect. 2. As a consequence we will start losingred and faint galaxies when the observed (extincted) colour ap-proaches the difference between the limiting magnitudes. Wetherefore expect a bias towards blue galaxies at higher extinc-tions, exactly as we see in Fig. 10.
To investigate the extent of this effect (since only the faintgalaxies are affected) we performed a series of Monte Carlo sim-ulations of a sample of galaxies subjected to different extinc-tions. The galaxy magnitudes were selected from a Euclideangalaxy count function (cf. Fig. 1) using the magnitude limits forgalaxies given in Sect. 2; the (intrinsic) colour distribution wasassumed to be Gaussian around mean colours. The galaxy po-sitions were taken from a uniform distribution of galactic lati-tudes, and extinctions were derived by a cubic spline fit betweenobserved latitudes and extinctions. The resulting extinction cor-rected colours were then plotted versus extinction to imitateFig. 10 and a slope was fitted.
Mean colours and their distributions have been determinedby one of us (G. Mamon, to be published) for a large sam-ple of high-latitude and bright DENIS galaxies (|b| > 60◦) us-ing SExtractor. Mean colours and dispersions were derivedusing the following selection criteria: SExtractor flag 0, dis-tance from image border >50 pixel, and three passes on mag-nitude limits: (1) magnitude limits as given in Sect. 2, (2) J <12+ 〈J−K〉pass1−0.5, I < 12+ 〈J−K〉pass1+ 〈I− J〉pass1−1, and(3) restricting to ±0.m5 from 〈colour〉pass2. While the 2nd passallows for a J (I) cut that is essentially complete in K (J), the3rd pass removes interlopers (rare stars incorrectly classified asgalaxies). Using the same aperture as in the present work (7′′)he found the following means and sigma:
〈I − J〉 = 1.16 ± 0.14, (18)
〈J − K〉 = 1.04 ± 0.14. (19)
Fig. 13. Monte Carlo simulation of galaxies with their extinction-corrected colours displayed in the same format as Fig. 10. The dashedlines indicate the limiting colour above which faint galaxies will bemissed; the shaded regions depict the 1σ-distributions of the intrinsiccolours.
Using these input parameters we find for 1000 simulations (us-ing 5000 galaxies each as input which resulted in a similar num-ber of galaxies “detected” as in reality) that a slope of −0.04(−0.01, and −0.06) as observed in Fig. 10 is observed 0.7%(40%, and 0.6%) of the time by chance for I − J (J − K, andI − K), respectively, assuming that the Schlegel et al. extinctionsare correct. We can therefore say that this extinction overesti-mate by Schlegel et al. that we find in the colours I − J andI − K is statistically significant, while on the other hand the lowslope for J − K indicates a low sensitivity to extinction and isnot significant.
One of the simulations is shown in Fig. 13, which is givenin the same format as Fig. 10: the 1σ colour distributions are in-dicated as well as the (observed) colour at the magnitude limits(that is, beyond these limits we lose faint galaxies). It is quite ob-vious that the line in I − J intersects the galaxy colours alreadyat extinctions of AB � 2m. It is therefore not possible to sim-ply avoid this bias by restricting the fit to the lower extinctionranges.
We also investigated how sensitive these results are to a de-viation in the NIR galaxy colours, which depend on the preciseselective transmission of the telescope optics, filter, and detec-tor, as well as galaxy type and aperture size. Jarrett et al. (2003)find a mean J − K colour of 1.m0 for galaxies in the 2MASS sur-vey with some variations depending on galaxy type. Mamon’ssample of bright high-latitude DENIS galaxies shows a variationin I − J with aperture, so that the largest aperture, 40′′, gives〈I − J〉 = 1.04 with incidentally the smallest dispersion, 0.11.Extracting the DENIS catalogue of LEDA galaxies (Paturel et al.2005), we made a selection based on type = G, |b| > 60◦, all12 flags (4 per band times 3 bands) = 0 (good quality), and us-ing the same magnitude passes as described above for Mamon’ssample, we find 1.m06 ± 0.14 and 0.m96 ± 0.19 for 〈I − J〉and 〈J − K〉, respectively. It should be noted that these colours

A. C. Schröder et al.: The highly obscured region around PKS 1343 – 601. I. 497
refer to the total magnitudes; and due to the higher sensitivity inthe blue bands of the DENIS survey, the colours are biased to-wards the blue. Finally, Mamon et al. (1998) find 1.m15 and 1.m05for bright high latitude DENIS galaxies, while our galaxy sam-ple, after correction for the effect seen in Fig. 10, gives 1.m07and 0.m98, respectively (Eqs. (2) and (3)).
We therefore also tested a set of bluer colours (1.m00and 0.m95 with the same dispersion as in the first test). The sim-ulations show that 1.6% (38%, and 0.7%) of the slopes are morenegative than observed in Fig. 10. The I − J result is slightlymore significant than the result for the redder colours, but itshould be stressed that these numbers are very extreme. The un-certainty in intrinsic colour, therefore, does not have a very largeeffect on the slopes.
Hence, we conclude that despite uncertainties in the meanintrinsic colours the simulations show that the overestimate ofextinction by Schlegel et al. that we find is statistically signifi-cant given the magnitude selection effects.
8.2. Discussion
We have shown that in our search area the extinction estimatesof the DIRBE/IRAS maps by Schlegel et al. (1998) are slightlyoverestimated, which cannot be fully explained by (i) patchinessof the extincting material in the sky; (ii) morphological segrega-tion within the assumed cluster; or (iii) selection effects at themagnitudes limits of the survey.
While the fractional error in the reddening estimates of theDIRBE/IRAS maps is 16% (Schlegel et al.), we find a system-atic overestimation of 1/ f = 15% ( f = 0.87), thus fairly large incomparison with the DIRBE/IRAS uncertainty on a single point.When comparing reddening values derived from Mg2 indicesof a large sample of elliptical galaxies, Schlegel et al. find thatthe highest reddening values of their maps appear to be over-estimated. Inspecting their Fig. 6 we can say that a slope off − 1 = −0.13 according to our findings is compatible with theirdata. It has to be stressed, though, that the sparsity of points atE(B−V) > 0.2 in their figure makes it difficult to estimate a slopeat all. Schlegel et al. state clearly (in their Appendix C) that theirpredicted reddenings at low Galactic latitudes (|b| < 5◦) are notto be trusted because of (i) the possibility that contaminatingsources may exist (our search area is such a case though no suchsources have been found by us), and (ii) a calibration at higherextinctions was not attempted.
Since then, various attempts have been made to cali-brate the DIRBE/IRAS maps at different latitudes and usingdifferent objects and methods. Most of these find that theDIRBE/IRAS maps are overestimated at low latitudes.
Nagayama et al. (2004), who have also searched for galaxiesin this cluster (see Sect. 7.3), have determined extinction valuesusing J − K colours of foreground giant stars. They find that theextinction in the K-band, AK , is systematically lower by 0.m4 thanthe DIRBE/IRAS values. This corresponds to a factor of f �0.67 for the average extinction in this area. Their extinction mapshows a higher spatial resolution than the DIRBE/IRAS maps,and one can see that the variation of their extinction along a lineof equal extinction in the DIRBE/IRAS maps is only moder-ate (σ (AK) � 0.m3). This indicates that the intrinsic patchinessin this area does not lead to large variations in extinction ona small spatial scale and hence has not caused us to predomi-nantly miss galaxies in supposedly very high extinction patches(see Sect. 8.1.1).
Dutra et al. (2003b) have derived reddening values fromthe spectral continuum in the optical of elliptical galaxies in
three different areas of the sky. In combination with previ-ous work by this group (Dutra et al. 2003a), where they usedbulge giants within 10 degrees of the Galactic centre to derivean AK extinction map, they find a calibration factor of f ∼ 0.75for reddening values of up to E(B − V) = 1.6 (AB = 6.m6).
Choloniewski & Valentijn (2003b) used the surface bright-ness of galaxies in the ESO-LV catalogue (Lauberts & Valentijn1989) in the R- and B-band (Choloniewski & Valentijn 2003a)and find a calibration factor of f = 0.71.
Other work in the literature include Arce & Goodman(1999), who find 0.67 < f < 0.77 for reddening in the Taurusdark cloud complex, and Schröder et al. 2005 with f = 0.79, asdiscussed in Sect. 8.1.1. On the other hand, Fingerhut et al. 2003find a much higher extinction in the direction of Maffei 1, whichtranslates to f = 1.3. However, this is a single object and seemsto be the exception.
We can therefore conclude that our calibration factor off = 0.87 derived from a fairly high extinction area (2m <∼ AB <∼12m) is in reasonable agreement with the results of other inves-tigations (0.67 < f < 0.79) at various extinction levels in thesense that the DIRBE/IRAS maps overestimate the extinction atlow Galactic latitudes where they are uncalibrated. Though insome cases a higher RV could explain the overestimation (e.g.,work done in the blue bands or in high density clouds), the NIRis fairly insensitive to RV . Hence, our results in the NIR cannotbe explained by a nonstandard reddening law.
We have shown that there is no obvious evidence that wepredominately find galaxies in low extinction patches in the in-vestigated range of extinctions, but better statistics are neededto completely solve this question. One possible way would beto use galaxies at moderate extinction levels (where we can besure to go reasonably deep to find all galaxies in the NIR) inan area of high spatial density of galaxies, e.g., the Norma clus-ter in the centre of the GA region, to look for a strong spa-tial variation in the reddening estimates by other means. Onecould also investigate larger areas by comparing shallow surveyswith deeper ones, e.g., using the UKIDSS (Lawrence 2006) andVISTA (McPherson et al. 2003) projects, to determine whetherthe fainter “new” galaxies in the deeper surveys show all signif-icantly larger reddening values. In fact, the comparison of our“shallow” search with the deeper search by Nagayama (2004)already indicates that a strong spatial variation cannot be theonly explanation: the shallow survey finds actually a higher ab-solute extinction than the deeper one, contrary to the argumentfor patchiness.
However, independent of the cause, a calibration factor ofabout f = 0.87 applied to the DIRBE/IRAS maps will improvesignificantly the actual extinction correction for galaxies at lowlatitudes.
9. Conclusion
We have investigated a ∼30 square-degree area around the radio-bright galaxy PKS 1343 – 601 using the NIR survey DENIS. Wefound 83 galaxies and 39 possible candidates. The searched areacovers a wide range of extinctions (from∼2m to over 100m wherethe search area crosses the Galactic plane). The galaxy countsreflect the dependence on extinction, as qualitatively shown inFig. 1 (i.e., the effect is less pronounced for the longer wave-lengths), as well as the underlying large-scale structures: thereis a clear enhancement of galaxies around the radio galaxy, indi-cating that there is a cluster or at least a group of galaxies.
Our detections compare well with those of the 2MASS sur-vey: while we find more galaxies at intermediate extinctions due

498 A. C. Schröder et al.: The highly obscured region around PKS 1343 – 601. I.
to the I-band, which is more sensitive to late-type spiral galax-ies than the J- and K-bands, 2MASS goes deeper in the K-band.However, our search is more reliable, since the 2MASS extendedsource catalogue is derived automatically and includes bothgalaxies and extended objects in our Galaxy without distinction.
Using the NIR galaxy colours from the 7′′ aperture, wefind that the extinction derived from the IRAS/DIRBE maps(Schlegel et al. 1998) is overestimated by about 15%; that is,the ratio of true extinction as derived using NIR colours toIRAS/DIRBE extinction is f = AB/AB = 0.87 ± 0.04. Otherfindings in the literature confirm this result.
We investigated several possible explanations: (i) patchinessof obscuring material which results in our finding galaxies onlyin areas of below-average extinction; (ii) morphological segrega-tion within the dense system of galaxies around PKS 1343 – 601;and (iii) selection effects at the magnitudes limits of the survey.None of these affect the galaxy colours presented here on a sta-tistical significant level. We therefore conclude that the poor cal-ibration of the IRAS/DIRBE at low latitudes is the major causeof the overestimate.
Since our work is nearly independent of RV (we use the sameRV to calculate extinctions as Schlegel et al. used to calculateE(B − V)), the disagreement cannot be explained by a nonstan-dard reddening law. Also, a variation in the dust temperaturealong the line of sight, which is very likely, would lead to an un-derestimate of the IRAS/DIRBE extinction (Schlegel et al. 1998)and can therefore not be the explanation either.
The second paper of this series (Schröder & Mamon 2006)will discuss the question whether PKS 1343 – 601 is part ofa cluster or a mere group of galaxies, making use of the galaxydistribution, velocity distribution, and X-ray emission.
Acknowledgements. The authors are grateful to the DENIS teams in Chile andat PDAC for all thir efforts in observing and reducing the data, in particular J.Borsenberger, G. Simon, P. Texier for preferential treatment of the DENIS dataneeded for this project. We thank Ch. Motch for making unpublished data avail-able to us.The DENIS project has been partly funded by the SCIENCE and the HCMplans of the European Commission under grants CT920791 and CT940627. Itis supported by INSU, MEN, and CNRS in France, by the State of Baden-Württemberg in Germany, by DGICYT in Spain, by CNR in Italy, by FFwFBWFin Austria, by FAPESP in Brazil, by OTKA grants F–4239 and F–013990in Hungary, and by the ESO C&EE grant A–04–046. This research hasmade use of the NASA/IPAC Infrared Science Archive (2MASS) and theNASA/IPAC Extragalactic Database (NED), which are operated by the JetPropulsion Laboratory, California Institute of Technology, under contract withthe National Aeronautics and Space Administration, as well as the Lyon-MeudonExtragalactic Database (LEDA), supplied by the LEDA team at the Centrede Recherche Astronomique de Lyon, Obs. de Lyon. Furthermore, this re-search has also made use of the Digitized Sky Surveys (produced at the SpaceTelescope Science Institute under US Government grant NAG W-2166) and theSuperCOSMOS Sky Surveys (produced by the Wide Field Astronomy Unit at theUniversity of Edinburgh). A. Schröder gratefully acknowledges financial supportfrom the European Marie Curie Fellowship Grant.
Appendix A: Photometry
We have tested the quality of the photometry by matching allobjects extracted by SExtractor in the overlap regions be-tween (a) images within one slot (overlap in Dec), (b) im-ages of adjacent slots (overlap in RA), and (c) re-observationsof the same slot (overlap of the whole images). Figure A.1shows a sketch of these overlap regions in exaggerated form.The matching was done automatically and was only possible forobservations where high quality astrometry was available (seeCol. 10 in Table 1). For each pair of strips we have then plot-ted the differences in the total magnitudes as well as in the 7′′-aperture magnitudes for the matched objects versus magnitude,
Fig. A.1. The different overlap regions of an image are shown here in ex-aggerated form. Each image of slot 2 has been observed twice (strips aand c). There are 1-arcmin-wide overlap regions in RA (between adja-cent slots) and in Dec (between images of the same strip).
time, RA, and Dec (the latter two depend on the kind of overlapregions) to look for systematic dependences.
In the following we will discuss the results in detail. A sum-mary of the global effects of photometric and seeing conditionson the photometry of each strip is given in Table 1.
– We used the magnitude differences of matched objects in theRA overlap regions, plotted versus time (i.e., scan direction),to look for variation in atmospheric extinction. These can bedistinguished from normal scatter by the fact that they oc-cur in all three passbands with the same amplitude. Abruptchanges as small as ∆mag = 0.m1 were immediately obvious(e.g., strip 9426), while other strips showed a constant sig-nificant offset over the whole range of images (about 12 minobserving time), e.g., strip 3823.
– Bad seeing conditions can also show rapid variations of themagnitude difference versus time, but in this case the 7′′-aperture magnitudes are much more strongly affected thanthe total magnitudes, and there are marked differences be-tween the passbands (e.g., strip 9461).
– In the I-band a small number of points show an offset of±∼0.m25 from the mean for the following strips: 7659, 9426,3625, 7747, 6371, 7462, 7532, 7484, 3976. A simple checkon the images showed that the affected objects were scatteredamong the “normal” objects in the overlap region. Thereseems to be a dependence on RA in such a way that the leftquarter to half of the image is not affected. No dependenceon Dec across the image could be found. No apparent reasonfor such deviations could be found.
– Small but negligible variations in the magnitude differencesdue to the pattern of the 2 × 2 CCDs that make the imagecould be found both in RA and Dec.
– Occasionally an increased scatter for the very brightest ob-jects was found, mainly due to saturation.
– Small offsets of the mean magnitude difference in theDec overlap regions within a strip indicate a slight gradientacross an image.
– For strips between ∼6000 and ∼7800, the J-band showsa marked lack of points in the RA overlap region intwo places: just to the right of the middle of the image, and in

A. C. Schröder et al.: The highly obscured region around PKS 1343 – 601. I. 499
the right-hand corner. This was due to the lack of detectionsby SExtractor around black areas in the CCDs.
A total recalibration of all the observations in the survey isplanned by PDAC which will remove most of the intrinsic ef-fects that we have noticed.
References
Abell, G. O. 1958, ApJS, 3, 211Arce, H. G., & Goodman, A. A. 1999, ApJ, 512, L135Arp, H. C., & Madore, B. F. 1987, A Catalog of Southern Peculiar Galaxies and
Associations (Cambridge: Cambridge University Press)Bertin, E., & Arnouts, S. 1996, A&AS, 117, 393Borsenberger, J. 1997, in The Impact of Large-Scale Near-IR Sky Surveys,
ed. F. Garzón, N. Epchtein, A. Omont, B. Burton, & P. Persi (Dordrecht:Kluwer), 181
Cameron, L. M. 1990, A&A, 233, 16Cardelli, J. A., Clayton, G. C., & Mathis, J. S. 1989, ApJ, 345, 245Choloniewski, J., & Valentijn, E. A. 2003a, Acta Astron., 53, 249Choloniewski, J., & Valentijn, E. A. 2003b, Acta Astron., 53, 265Dekel, A. 1994, ARA&A, 32, 371Dutra, C. M., Santiago, B. X., Bica, E. L. D., & Barbuy, B. 2003a, MNRAS, 338,
253Dutra, C. M., Ahumada, A. V., Clariá, J. J., Bica, E., & Barbuy, B. 2003b, A&A,
408, 287Ebeling, H., Mullis, C. R., & Tully, R. B. 2002, ApJ, 580, 774Elvis, M., Wilkes, B. J., McDowell, J. C., et al. 1994, ApJS, 95, 1Epchtein, N. 1997, in The Impact of Large Scale Near-IR Surveys, ed. F. Garzón,
N. Epchtein, A. Omont, B. Burton, & P. Persi (Dordrecht: Kluwer), 15Epchtein, N. 1998, in 179th Symp. of the IAU, New Horizons from Multi-
Wavelength Sky Surveys, ed. B. J. McLean, D. A. Golombek, J. J. E. Hayes,& H. E. Payne (Dordrecht: Kluwer), 106
Epchtein, N., Batz, B. de, Capoani, L., et al. 1997, Messenger, 87, 27Fairall, A. P., Woudt, P. A., ed. 2005, Nearby Large-Scale Structures & the Zone
of Avoidance (San Francisco: ASP), ASP Conf. Ser., 329Fingerhut, R. L., McCall, M. L., De Robertis, M., et al. 2003, ApJ, 587, 672Forman, W., Jones, C., Cominsky, L., et al. 1978, ApJS, 38, 357Gandhi, P., & Fabian, A. C. 2003, MNRAS, 339, 1095Gardner, J. P., Sharples, R. M., Carrasco, B. E., & Frenk, C. S. 1996, MNRAS,
282, L1Girardi, M., Mardirossian, F., Marinoni, C., Mezzetti, M., & Rigoni, E. 2003,
A&A, 410, 461Griffith, M. R., Wright, A. E., Burke, B. F., & Ekers, R. D. 1994, ApJS, 90, 179Hambly, N. C., MacGillivray, H. T., Read, M. A., et al. 2001, MNRAS, 326,
1279Henning, P. A., Staveley-Smith, L., Ekers, R. D., et al. 2000, AJ, 119, 2686
(HIZSS)Henning, P. A., Kraan-Korteweg, R. C., & Staveley-Smith, L. 2005, in Nearby
Large-Scale Structures and the Zone of Avoidance (San Francisco: ASP),ASP Conf. Ser., 199
Jarrett, T.-H., Chester, T., Cutri, R., et al. 2000a, AJ, 119, 2498Jarrett, T.-H., Chester, T., Cutri, R., et al. 2000b, AJ, 120, 298Jarrett, T.-H., Chester, T., Cutri, R., Schneider, S., & Huchra, J. P. 2003, AJ, 125,
525Joint IRAS Science Working Group 1988, IRAS Point Source Catalog, Version 2
(Washington: US Govt. Printing Office) (IRAS PSC)Jones, P. A., Lloyd, B. D., & McAdam, W. B. 2001, MNRAS, 325, 817Joye, W. A., & Mandel, E. 2003, in Astronomical Data Analysis Software
and Systems XII, ed. H. E. Payne, R. I. Jedrzejewski, & R. N. Hook(San Francisco: ASP), ASP Conf. Ser., 295, 489
Juraszek, S. J., Staveley-Smith, L., Kraan-Korteweg, R. C., et al. 2000, AJ, 119,1627 (JS00)
Karachentseva, V. E., & Karachentsev, I. D. 2000, A&AS, 146, 359Kolatt, T., Dekel, A., & Lahav, O. 1995, MNRAS, 275, 797Kraan-Korteweg, R. C. 2000, A&ASS, 141, 123Kraan-Korteweg, R. C. 2005, in From Cosmological Structures to the
Milky Way, Rev. Modern Astronomy 18, ed. S. Röser (New York: Wiley),48
Kraan-Korteweg, R. C., Woudt, P. A., Cayatte, V., et al. 1996, Nature, 379, 51Kraan-Korteweg, R. C., Schröder, A., Mamon, G. A., & Ruphy, S. 1998, in
3rd Euroconference, The Impact of Near IR Surveys, ed. N. Epchtein(Dordrecht: Kluwer), 209
Kraan-Korteweg, R. C., & Woudt, P. A. 1999, PASA, 16, 53Kraan-Korteweg, R. C., & Lahav, O. 2000, A&ARv, 10, 211
Kraan-Korteweg, R. C., & Jarrett, T. H. 2005, in Nearby Large-Scale Structuresand the Zone of Avoidance (San Francisco: ASP), ASP Conf. Ser., 119
Kraan-Korteweg, R. C., Ochoa, M., Woudt, P., & Andernach, H. 2005a, inNearby Large-Scale Structures and the Zone of Avoidance (San Francisco:ASP), ASP Conf. Ser., 159
Kraan-Korteweg, R. C., Staveley-Smith, L., Donley, J., Koribalski, B., &Henning, P. A. 2005b, in IAU Symp. 216, Maps of the Cosmos, ed. M.Colless, & L. Staveley-Smith (San Francisco: ASP), ASP Conf. Ser., 203
Lauberts, A., & Valentijn, E. A. 1989, The Surface Photometry Catalogue of theESO-Uppsala Galaxies, (Garching: ESO)
Lawrence, A., Warren, S. J., Almaini, O., et al. 2006, MNRAS, submitted[arXiv:astro-ph/0604426]
Lynden-Bell, D., Faber, S. M., Burstein, D., et al. 1988, ApJ, 326, 19Mamon, G. A. 1994, in Unveiling Large-Scale Structures Behind the Milky Way,
ed. C. Balkowski, & R. C. Kraan-Korteweg (San Francisco: ASP), ASPConf. Ser., 67, 53
Mamon, G. A. 1998, in XIVth IAP Astrophysics Meeting, Wide Field Surveysin Cosmology, ed. S. Colombi, Y. Mellier, & B. Raban (Gif-sur-Yvette:Éditions Frontières), 323
Mamon, G. A., Borsenberger, J., Tricottet, M., & Banchet, V. 1998, in3rd Euroconference, The Impact of Near IR Surveys, ed. N. Epchtein(Dordrecht: Kluwer), 177
Mamon, G. A. 2000, in Cosmic Flows 1999: Towards an Understanding ofLarge-Scale Structure, ed. S. Courteau, M. A. Strauss, & J. A. Willick(San Francisco: ASP), ASP Conf. Ser., 201, 103
Mamon, G. A., Parker, Q. A., & Proust, D. 2001, PASA, 18, 232Masetti, N., Pretorius, M. L., Palazzi, E., et al. 2006, A&A, 449, 1139McAdam, W. B. 1991, PASA, 9, 255McPherson, A. M., Craig, S. C., & Sutherland, W. 2003, Large Ground-based
Telescopes, ed. J. M. Oschmann, & L. M. Stepp, Proc. of the SPIE, 4837,82
Michel, L., Herent, O., Motch, C., et al. 2004, in Astronomical Data AnalysisSoftware and Systems (ADASS) XIII, ed. F. Ochsenbein, M. G. Allen, &D. Egret (San Francisco: ASP), ASP Conf. Ser., 314, 570
Monnier Ragaigne, D., van Driel, W., Schneider, S. E., Jarrett, T. H., &Balkowski, C. 2003, A&A, 405, 99
Moriondo, G., Baffa, C., Casertano, S., et al. 2001, A&A, 370, 881Motch, C., Herent, O., & Guillot, P. 2003, Astr. Nachr., 324, 61Nagayama, T., Woudt, P. A., Nagashima, C., et al. 2004, MNRAS, 354, 980Paturel, G., Petit, C., Rousseau, J., & Vauglin, I. 2003, A&A, 405, 1Paturel, G., Vauglin, I., Petit, C., et al. 2005, A&A, 430, 751Piconcelli, E., Sánchez-Portal, M., Guainazzi, M., et al. 2006, A&A, 453, 839Rembold, S. B., Pastoriza, M. G., Ducati, J. R., Rubio, M., & Roth, M. 2002,
A&A, 391, 531Rousseau, J., Paturel, G., Vauglin, I., et al. 2000, A&A, 363, 62Sanchis, T., Mamon, G. A., Salvador-Solé, E., & Solanes, J. M. 2004, A&A, 418,
393Schlegel, D. J., Finkbeiner, D. P., & Davis, M. 1998, ApJ, 500, 525Schröder, A., Kraan-Korteweg, R. C., Mamon, G. A., & Ruphy, S. 1997, in
XVIIth Moriond Astrophysics Meeting, Extragalactic Astronomy in theInfrared, ed. G. A. Mamon, Trinh Xuân Thuân, & J. Trân Thanh Vân (Gif-sur-Yvette: Éditions Frontières), 381
Schröder, A., Kraan-Korteweg, R. C., & Mamon, G. 1999, PASA, 16, 42Schröder, A., Kraan-Korteweg, R. C., & Mamon, G. 2000, in Mapping the
Hidden Universe: The Universe behind the Milky Way – The Universe inHI (San Francisco: ASP), ASP Conf. Ser., 218, 119
Schröder, A., Mamon, G., Kraan-Korteweg, R. C., & Woudt, P. A. 2005, inNearby Large-Scale Structures & the Zone of Avoidance, ed. A. P. Fairall,& P. A. Woudt (San Francisco: ASP), ASP Conf. Ser., 329, 167
Schröder, A., & Mamon, G. 2007, A&A, submitted (Paper II)Skrutskie, M. F., Cutri, R. M., Stiening, R., et al. 2006, AJ, 131, 116Staveley-Smith, L., Koribalski, B. S., Stewart, I., et al. 2000, in Imaging at Radio
through Submillimetre Wavelengths, ed. J. G. Mangum, & S. J. E. Radford(San Francisco: ASP), ASP Conf. Ser., 217, 50
Tashiro, M., Kaneda, H., Makishima, K., et al. 1998, ApJ, 499, 713Two Micron All Sky Survey team 2003, 2MASS extended objects. Final releaseVauglin, I., Paturel, G., Borsenberger, J., et al. 1999, A&AS, 135, 133Watson, M. G., Auguéres, J.-L., Ballet, J., et al. 2001, A&A, 365, L51West, R. M., & Tarenghi, M. 1989, A&A, 223, 61Woudt, P. A., & Kraan-Korteweg, R. C. 2001, A&A, 380, 441 (WKK)Woudt, P. A., Fairall, A. P., Kraan-Korteweg, R. C., et al. 2005, in Nearby Large-
Scale Structures and the Zone of Avoidance, ed. A. P. Fairall, & P. A. Woudt(San Francisco: ASP), ASP Conf. Ser., 329, 147
Wright, A., & Otrupcek, R. 1990, Parkes Catalog, Australia telescope nationalfacility
XMM-Newton Survey Science Centre (SSC) 2003, The First XMM-NewtonSerendipitous Source Catalogue, Version 1 (1XMM)

A. C. Schröder et al.: The highly obscured region around PKS 1343 – 601. I., Online Material p 1
Online Material

A. C. Schröder et al.: The highly obscured region around PKS 1343 – 601. I., Online Material p 2
Appendix B: Images of Galactic objects
Thumbnail images of the Galactic nebulae, presented and dis-cussed in Sect. 6.2, are displayed in Fig. B.1. They are availablein the electronic form of the journal. There are two objects perrow, each with the I-, J-, and K-band image shown from left toright; the name is printed at the top and the total B-band extinc-tion and Galactic coordinates at the bottom of the images. TheJ- and K-band images have been smoothed, and the cut valueshave been calculated separately for each image depending on thebackground.

A. C. Schröder et al.: The highly obscured region around PKS 1343 – 601. I., Online Material p 3
DZOA4638-16
A(B) = 28.9
I
l = 307.1009
J
b = 0.5277
KDZOA4638-13
A(B) = 28.1
I
l = 307.1006
J
b = 0.4974
K
DZOA4641-10
A(B) = 12.5
I
l = 307.9446
J
b = 2.0485
KDZOA4641-12
A(B) = 127.6
I
l = 307.6122
J
b = -0.2537
K
DZOA4642-09
A(B) = 50.0
I
l = 307.5605
J
b = -0.5875
KDZOA4642-07
A(B) = 21.0
I
l = 308.0146
J
b = 2.0173
K
DZOA4647-04
A(B) = 100.8
I
l = 308.6863
J
b = 0.5239
KDZOA4648-07
A(B) = 113.4
I
l = 308.7532
J
b = 0.5486
K
DZOA4649-10
A(B) = 39.9
I
l = 308.7923
J
b = 0.1675
KDZOA4650-12
A(B) = 94.2
I
l = 309.1147
J
b = 0.1393
K
DZOA4651-13
A(B) = 46.0
I
l = 309.2523
J
b = 0.1951
KDZOA4652-10
A(B) = 57.2
I
l = 309.1578
J
b = -0.5943
K
DZOA4652-09
A(B) = 111.9
I
l = 309.2198
J
b = -0.4614
KDZOA4655-12
A(B) = 143.4
I
l = 309.8881
J
b = 0.3986
K
Fig. B.1. I-, J-, and K-band images (left, middle, and right hand column, respectively) of the Galactic nebulae discussed in Sect. 6.2; names,total B-band extinctions, and Galactic coordinates are given for each set. The minimum and maximum cut values for the I-band are 1.0 and 300,respectively, for the J-band they are 0.05 and 70, respectively, and for the K-band they are 0.1 and 70, respectively.

A. C. Schröder et al.: The highly obscured region around PKS 1343 – 601. I., Online Material p 4
DZOA4655-11
A(B) = 151.6
I
l = 309.9192
J
b = 0.4795
KDZOA4655-09
A(B) = 77.0
I
l = 309.9784
J
b = 0.5495
K
DZOA4655-10
A(B) = 97.5
I
l = 309.9927
J
b = 0.5062
KDZOA4656-08
A(B) = 113.2
I
l = 310.0120
J
b = 0.3897
K
DZOA4656-06
A(B) = 60.5
I
l = 310.1451
J
b = 0.7595
KDZOA4657-05
A(B) = 55.8
I
l = 309.9713
J
b = -0.2841
K
DZOA4657-06
A(B) = 11.2
I
l = 310.4746
J
b = 1.3980
KDZOA4658-07
A(B) = 76.5
I
l = 310.1766
J
b = -0.2445
K
DZOA4661-02
A(B) = 4.4
I
l = 311.4739
J
b = 2.8511
KDZOA4661-05
A(B) = 57.1
I
l = 310.8652
J
b = 0.4738
K
DZOA4664-05
A(B) = 57.2
I
l = 311.4251
J
b = 0.5972
KDZOA4664-04
A(B) = 29.0
I
l = 311.5347
J
b = 0.8656
K
DZOA4664-06
A(B) = 93.6
I
l = 311.1757
J
b = -0.3998
K
Fig. B.1. continued.

A. C. Schröder et al.: The highly obscured region around PKS 1343 – 601. I., Online Material p 5
Table 2. Galaxies in the search area.
Ident. N RA (J2000) Dec Gal � Gal b AB Class Visibil. Type I J K (I − J)0 (I − K)0 (J − K)0 Phot. DI DJ DK
[h m s] [◦ ′ ′′] [◦] [◦] [mag] [mag] [mag] [mag] [mag] [mag] [mag] [′′] [′′] [′′](1) (2) (3a) (3b) (4a) (4b) (5) (6) (7) (8) (9) (10) (11) (12) (13) (14) (15) (16) (17) (18)
DZOA4638-04 1 13 27 20.3 –57 52 08 307.71 4.67 2.8 DG 0 1 1 1 SM 15.35 ± 0.10 13.87 ± 0.06 ... ... 1.01 ± 0.10 ... ... ... ... 000 11 14 5DZOA4638-09 1 13 27 25.1 –58 20 28 307.65 4.20 2.6 DG 0 1 1 1 E/SE 15.96 ± 0.07 14.02 ± 0.06 12.87 ± 0.28 1.06 ± 0.09 1.87 ± 0.20 0.80 ± 0.19 030 11 12 7DZOA4638-03 1 13 28 10.0 –57 41 09 307.84 4.83 3.0 DG 0 1 1 1 E/SE 16.10 ± 0.08 14.19 ± 0.06 12.98 ± 0.27 1.17 ± 0.09 2.08 ± 0.18 0.93 ± 0.17 000 10 13 5DZOA4638-11 1 13 28 10.3 –60 22 59 307.46 2.17 5.0 DG 0 1 1 1 SM 13.70 ± 0.02 11.92 ± 0.02 10.90 ± 0.06 0.27 ± 0.02 0.83 ± 0.04 0.56 ± 0.04 774 17 35 15DZOA4638-10 2 13 28 11.0 –59 25 09 307.60 3.12 3.1 DG 0 1 1 0 SM 16.40 ± 0.08 ... ... ... ... ... ... ... ... ... ... 000 10 8 ...DZOA4638-06 2 13 28 15.4 –57 55 21 307.82 4.60 2.7 DG 0 1 1 1 SM 15.64 ± 0.05 14.19 ± 0.05 12.65 ± 0.25 0.88 ± 0.07 1.83 ± 0.23 0.95 ± 0.23 000 10 12 6DZOA4638-01 2 13 28 37.1 –57 42 19 307.90 4.81 2.9 DG 1 1 1 1 SE 13.96 ± 0.01 12.02 ± 0.02 10.78 ± 0.05 0.98 ± 0.02 1.90 ± 0.04 0.91 ± 0.04 000 22 25 17DZOA4639-07 3 13 28 44.4 –58 03 32 307.87 4.46 2.8 UG 0 1 1 0 SM ... ... ... ... ... ... ... ... ... ... ... ... 000 7 8 ...DZOA4639-06 1 13 28 49.7 –58 03 21 307.88 4.46 2.7 DG 1 1 1 1 SM 15.48 ± 0.06 14.05 ± 0.06 ... ... 1.02 ± 0.09 ... ... ... ... 330 10 12 7DZOA4639-19 2 13 29 00.3 –58 55 30 307.77 3.59 2.6 BG 1 1 1 0 SL ... ... 15.27 ± 0.18 ... ... ... ... ... ... ... ... 000 6 9 ...DZOA4639-02 1 13 29 01.7 –57 37 32 307.97 4.88 3.0 DG 0 1 1 0 SM 16.30 ± 0.15 14.95 ± 0.13 ... ... 0.99 ± 0.17 ... ... ... ... 000 7 6 ...DZOA4639-14 1 13 29 10.4 –59 42 27 307.68 2.82 4.1 UG 0 1 1 0 S ... ... ... ... ... ... ... ... ... ... ... ... 000 6 7 ...DZOA4639-01 1 13 29 14.7 –57 37 06 308.00 4.88 3.0 UG 0 1 1 1 E/SE 16.93 ± 0.12 14.71 ± 0.09 ... ... 1.07 ± 0.16 ... ... ... ... 000 9 13 7DZOA4639-03 1 13 29 16.1 –57 39 56 307.99 4.83 2.9 DG 0 1 1 1 SM 15.79 ± 0.06 13.60 ± 0.05 12.99 ± 0.25 0.95 ± 0.09 1.77 ± 0.22 0.81 ± 0.22 030 12 15 6DZOA4639-05 2 13 29 17.7 –57 56 03 307.96 4.57 2.7 DG 1 1 1 1 E/SE 14.30 ± 0.01 12.20 ± 0.02 11.20 ± 0.07 1.02 ± 0.02 2.04 ± 0.04 1.02 ± 0.04 040 20 22 14DZOA4639-10 1 13 29 25.8 –59 07 11 307.80 3.39 2.6 DG 0 1 1 1 E/SE 15.51 ± 0.05 13.53 ± 0.05 12.61 ± 0.22 0.98 ± 0.07 1.92 ± 0.16 0.94 ± 0.16 000 10 10 7DZOA4639-09 1 13 29 33.2 –58 50 54 307.86 3.66 3.0 DG 1 1 1 1 SM 14.25 ± 0.03 12.39 ± 0.03 11.39 ± 0.14 0.93 ± 0.05 1.57 ± 0.13 0.65 ± 0.13 330 17 25 11DZOA4639-08 1 13 29 40.9 –58 49 30 307.87 3.68 3.1 DG 0 1 1 1 SE ... ... ... ... 12.65 ± 0.15 ... ... ... ... ... ... 000 15 13 7DZOA4639-16 6 13 29 50.5 –60 44 05 307.61 1.79 5.8 UG 0 1 1 1 SM 16.15 ± 0.06 13.83 ± 0.03 12.48 ± 0.10 0.81 ± 0.09 1.74 ± 0.10 0.93 ± 0.08 300 6 9 8DZOA4639-13 3 13 29 51.9 –59 28 19 307.80 3.04 3.1 DG 1 1 1 1 SM 15.57 ± 0.03 13.48 ± 0.03 12.50 ± 0.12 0.88 ± 0.04 1.79 ± 0.09 0.90 ± 0.09 440 11 12 8DZOA4640-05 2 13 30 13.4 –59 08 34 307.90 3.35 3.1 DG 0 1 1 1 SE 15.96 ± 0.07 14.45 ± 0.07 ... ... 0.92 ± 0.10 ... ... ... ... 000 9 12 6DZOA4640-03 2 13 30 34.6 –58 29 24 308.04 3.99 3.4 DG 1 1 1 1 SE 15.51 ± 0.06 13.64 ± 0.05 12.86 ± 0.21 1.07 ± 0.08 1.82 ± 0.16 0.75 ± 0.16 000 13 14 8DZOA4640-02 2 13 31 09.6 –58 09 45 308.17 4.30 2.8 DG 0 1 1 1 E 14.35 ± 0.02 12.69 ± 0.02 11.79 ± 0.09 0.95 ± 0.03 1.74 ± 0.07 0.79 ± 0.07 740 17 18 12DZOA4641-01 1 13 31 33.3 –57 50 04 308.27 4.62 2.7 DG 1 1 1 1 SM 13.53 ± 0.02 11.52 ± 0.02 10.70 ± 0.07 1.16 ± 0.03 2.19 ± 0.05 1.04 ± 0.05 000 40 42 21DZOA4641-04 1 13 31 36.6 –60 22 37 307.88 2.11 5.8 UG 0 0 1 1 SM ... ... ... ... 12.22 ± 0.22 ... ... ... ... 0.79 ± 0.15 074 ... 10 6DZOA4641-02 1 13 31 43.7 –57 53 11 308.28 4.57 2.8 DG 1 1 1 1 E 13.64 ± 0.02 11.83 ± 0.01 10.57 ± 0.06 1.03 ± 0.02 1.94 ± 0.04 0.91 ± 0.04 000 20 23 14DZOA4641-06 2 13 32 03.3 –63 05 06 307.51 –0.57 38.5 UG 0 0 0 1 ? ... ... ... ... 12.25 ± 0.08 ... ... ... ... ... ... 000 ... ... 7DZOA4642-04 2 13 33 11.8 –58 49 22 308.32 3.61 4.0 DG 1 1 1 1 SL 16.22 ± 0.08 14.26 ± 0.06 12.57 ± 0.24 0.84 ± 0.10 2.02 ± 0.18 1.18 ± 0.18 000 10 14 8DZOA4642-01 2 13 33 39.2 –57 47 42 308.55 4.62 2.8 DG 1 1 1 1 SE 13.50 ± 0.02 11.47 ± 0.01 10.13 ± 0.06 1.04 ± 0.02 1.95 ± 0.04 0.91 ± 0.04 000 28 30 19DZOA4642-06 2 13 33 47.6 –59 03 07 308.36 3.37 4.0 DG 1 1 1 1 SE/M 16.13 ± 0.07 14.24 ± 0.06 ... ... 0.63 ± 0.10 ... ... ... ... 030 9 9 6DZOA4642-02 6 13 33 58.2 –58 00 29 308.56 4.40 3.2 DG 1 1 1 1 SE 14.16 ± 0.01 12.97 ± 0.01 11.22 ± 0.02 0.85 ± 0.01 1.83 ± 0.03 0.98 ± 0.03 330 27 33 22DZOA4644-04 14 13 35 26.0 –59 14 38 308.54 3.15 4.1 UG 0 1 1 1 SM 15.60 ± 0.03 14.13 ± 0.03 ... ... 0.36 ± 0.05 ... ... ... ... 000 12 13 7DZOA4644-02 6 13 35 30.1 –57 53 47 308.78 4.47 3.3 DG 0 1 1 0 SL 15.97 ± 0.09 14.33 ± 0.15 ... ... 0.94 ± 0.15 ... ... ... ... 000 9 8 ...DZOA4644-01 3 13 36 08.1 –57 37 48 308.91 4.72 2.7 DG 0 1 1 1 SE 16.29 ± 0.15 15.02 ± 0.22 ... ... 1.01 ± 0.18 ... ... ... ... 300 7 9 6DZOA4645-01 2 13 37 05.0 –58 02 40 308.96 4.29 3.1 DG 0 1 1 1 SE 15.89 ± 0.05 14.08 ± 0.05 12.29 ± 0.20 1.05 ± 0.07 2.04 ± 0.17 0.98 ± 0.17 000 11 11 6DZOA4645-14 2 13 37 15.2 –57 37 11 309.06 4.71 2.7 BG 1 1 1 0 SM/L ... ... ... ... ... ... ... ... ... ... ... ... 000 4 5 ...DZOA4645-13 2 13 37 20.7 –63 28 12 308.03 –1.05 24.3 UG 0 0 1 1 ? ... ... ... ... 10.44 ± 0.05 ... ... ... ... ... ... 006 ... 8 15DZOA4645-09 2 13 37 24.7 –58 52 21 308.86 3.47 4.5 DG 1 1 1 1 SE 13.10 ± 0.01 11.32 ± 0.01 10.28 ± 0.04 0.69 ± 0.01 1.38 ± 0.02 0.71 ± 0.02 000 47 43 22DZOA4645-04 2 13 37 31.9 –58 08 01 309.00 4.19 3.1 DG 0 1 1 1 E 16.59 ± 0.07 14.59 ± 0.07 ... ... 1.15 ± 0.09 ... ... ... ... 000 9 9 6DZOA4645-08 2 13 37 32.8 –58 50 04 308.88 3.50 4.5 DG 1 1 1 1 SL 15.00 ± 0.03 12.65 ± 0.03 12.38 ± 0.24 0.78 ± 0.05 1.35 ± 0.12 0.57 ± 0.12 003 17 22 10DZOA4645-10 4 13 37 32.9 –58 54 14 308.87 3.44 4.5 DG 0 1 1 1 SM 14.29 ± 0.02 11.87 ± 0.01 10.56 ± 0.03 1.41 ± 0.02 2.71 ± 0.02 1.30 ± 0.02 000 24 30 18DZOA4645-03 2 13 37 44.1 –58 06 37 309.03 4.21 3.0 UG 0 1 1 1 E/SE 16.75 ± 0.17 14.82 ± 0.12 ... ... 1.19 ± 0.13 ... ... ... ... 000 7 6 4DZOA4645-05 2 13 37 44.3 –58 13 26 309.01 4.10 3.5 DG 1 1 1 0 SL ... ... ... ... ... ... ... ... ... ... ... ... 000 9 15 5DZOA4645-02 2 13 37 51.3 –58 00 59 309.06 4.30 2.9 DG 0 1 1 0 S 17.13 ± 0.13 ... ... ... ... ... ... ... ... ... ... 000 6 6 ...DZOA4645-07 3 13 37 59.2 –58 30 55 308.99 3.81 4.7 DG 0 1 1 1 SM/L 15.82 ± 0.06 12.52 ± 0.02 11.11 ± 0.06 1.04 ± 0.05 2.08 ± 0.07 1.04 ± 0.05 030 12 20 13DZOA4646-01 6 13 38 03.3 –58 14 27 309.05 4.08 3.5 UG 0 1 1 1 SM ... ... ... ... 13.33 ± 0.18 ... ... ... ... ... ... 000 7 9 5DZOA4646-03 6 13 38 08.5 –58 45 19 308.97 3.57 4.1 DG 0 1 1 1 SE 14.33 ± 0.01 12.21 ± 0.01 11.11 ± 0.04 0.89 ± 0.01 1.85 ± 0.03 0.96 ± 0.03 000 17 19 17DZOA4646-04 1 13 38 16.6 –59 00 15 308.94 3.32 4.3 DG 0 1 1 1 SE/M 15.74 ± 0.06 14.11 ± 0.05 12.72 ± 0.11 0.90 ± 0.07 1.62 ± 0.16 0.73 ± 0.15 000 12 15 6DZOA4646-06 1 13 38 21.7 –60 17 02 308.72 2.06 9.0 DG 0 1 1 1 E/SE ... ... 13.77 ± 0.07 12.41 ± 0.18 ... ... ... ... 0.49 ± 0.14 040 7 10 9DZOA4647-03 4 13 39 17.6 –59 04 46 309.06 3.22 4.2 UG 0 1 1 1 SM/L 15.56 ± 0.03 13.89 ± 0.03 12.26 ± 0.14 0.29 ± 0.04 1.25 ± 0.11 0.96 ± 0.12 000 10 11 7DZOA4647-01 2 13 39 39.7 –58 04 00 309.29 4.21 3.5 DG 0 1 1 1 SM 16.03 ± 0.06 13.76 ± 0.06 12.43 ± 0.22 0.97 ± 0.09 2.03 ± 0.17 1.06 ± 0.17 000 10 12 5DZOA4647-02 1 13 39 52.7 –57 42 17 309.39 4.56 2.6 DG 1 1 1 1 SE 15.20 ± 0.06 13.80 ± 0.06 ... ... 0.54 ± 0.08 ... ... ... ... 000 12 14 5DZOA4649-02 3+ 13 41 54.8 –58 48 28 309.44 3.42 3.9 DG 0 1 1 1 SL 15.86 ± 0.08 13.32 ± 0.04 ... ... 0.61 ± 0.12 ... ... ... ... 000 25 25 6DZOA4649-07 3+ 13 42 09.8 –61 08 18 309.02 1.13 12.0 DG 0 0 1 1 ? ... ... ... ... ... ... ... ... ... ... ... ... 000 ... 17 15DZOA4649-06 2+ 13 42 29.6 –61 01 23 309.08 1.24 13.0 DG 0 0 1 1 SE ... ... 13.69 ± 0.05 11.31 ± 0.04 ... ... ... ... 1.11 ± 0.07 000 ... 14 13
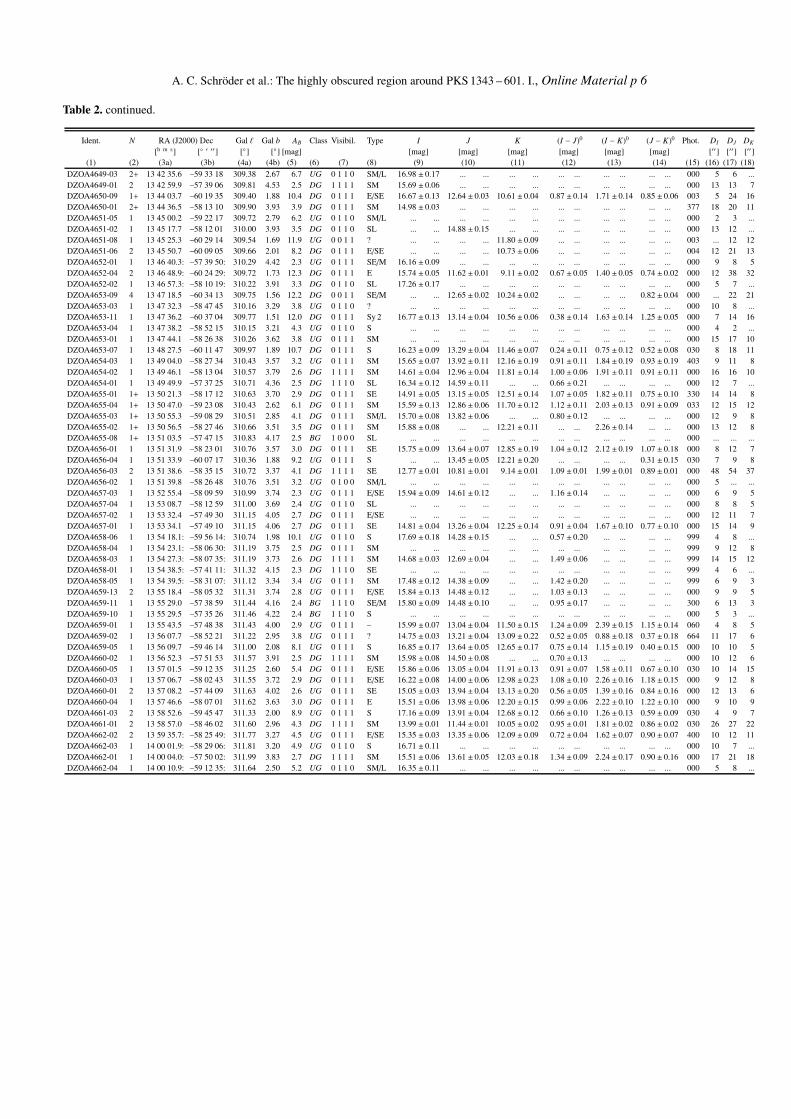
A. C. Schröder et al.: The highly obscured region around PKS 1343 – 601. I., Online Material p 6
Table 2. continued.
Ident. N RA (J2000) Dec Gal � Gal b AB Class Visibil. Type I J K (I − J)0 (I − K)0 (J − K)0 Phot. DI DJ DK
[h m s] [◦ ′ ′′] [◦] [◦] [mag] [mag] [mag] [mag] [mag] [mag] [mag] [′′] [′′] [′′](1) (2) (3a) (3b) (4a) (4b) (5) (6) (7) (8) (9) (10) (11) (12) (13) (14) (15) (16) (17) (18)
DZOA4649-03 2+ 13 42 35.6 –59 33 18 309.38 2.67 6.7 UG 0 1 1 0 SM/L 16.98 ± 0.17 ... ... ... ... ... ... ... ... ... ... 000 5 6 ...DZOA4649-01 2 13 42 59.9 –57 39 06 309.81 4.53 2.5 DG 1 1 1 1 SM 15.69 ± 0.06 ... ... ... ... ... ... ... ... ... ... 000 13 13 7DZOA4650-09 1+ 13 44 03.7 –60 19 35 309.40 1.88 10.4 DG 0 1 1 1 E/SE 16.67 ± 0.13 12.64 ± 0.03 10.61 ± 0.04 0.87 ± 0.14 1.71 ± 0.14 0.85 ± 0.06 003 5 24 16DZOA4650-01 2+ 13 44 36.5 –58 13 10 309.90 3.93 3.9 DG 0 1 1 1 SM 14.98 ± 0.03 ... ... ... ... ... ... ... ... ... ... 377 18 20 11DZOA4651-05 1 13 45 00.2 –59 22 17 309.72 2.79 6.2 UG 0 1 1 0 SM/L ... ... ... ... ... ... ... ... ... ... ... ... 000 2 3 ...DZOA4651-02 1 13 45 17.7 –58 12 01 310.00 3.93 3.5 DG 0 1 1 0 SL ... ... 14.88 ± 0.15 ... ... ... ... ... ... ... ... 000 13 12 ...DZOA4651-08 1 13 45 25.3 –60 29 14 309.54 1.69 11.9 UG 0 0 1 1 ? ... ... ... ... 11.80 ± 0.09 ... ... ... ... ... ... 003 ... 12 12DZOA4651-06 2 13 45 50.7 –60 09 05 309.66 2.01 8.2 DG 0 1 1 1 E/SE ... ... ... ... 10.73 ± 0.06 ... ... ... ... ... ... 004 12 21 13DZOA4652-01 1 13 46 40.3: –57 39 50: 310.29 4.42 2.3 UG 0 1 1 1 SE/M 16.16 ± 0.09 ... ... ... ... ... ... ... ... ... ... 000 9 8 5DZOA4652-04 2 13 46 48.9: –60 24 29: 309.72 1.73 12.3 DG 0 1 1 1 E 15.74 ± 0.05 11.62 ± 0.01 9.11 ± 0.02 0.67 ± 0.05 1.40 ± 0.05 0.74 ± 0.02 000 12 38 32DZOA4652-02 1 13 46 57.3: –58 10 19: 310.22 3.91 3.3 DG 0 1 1 0 SL 17.26 ± 0.17 ... ... ... ... ... ... ... ... ... ... 000 5 7 ...DZOA4653-09 4 13 47 18.5 –60 34 13 309.75 1.56 12.2 DG 0 0 1 1 SE/M ... ... 12.65 ± 0.02 10.24 ± 0.02 ... ... ... ... 0.82 ± 0.04 000 ... 22 21DZOA4653-03 1 13 47 32.3 –58 47 45 310.16 3.29 3.8 UG 0 1 1 0 ? ... ... ... ... ... ... ... ... ... ... ... ... 000 10 8 ...DZOA4653-11 1 13 47 36.2 –60 37 04 309.77 1.51 12.0 DG 0 1 1 1 Sy 2 16.77 ± 0.13 13.14 ± 0.04 10.56 ± 0.06 0.38 ± 0.14 1.63 ± 0.14 1.25 ± 0.05 000 7 14 16DZOA4653-04 1 13 47 38.2 –58 52 15 310.15 3.21 4.3 UG 0 1 1 0 S ... ... ... ... ... ... ... ... ... ... ... ... 000 4 2 ...DZOA4653-01 1 13 47 44.1 –58 26 38 310.26 3.62 3.8 UG 0 1 1 1 SM ... ... ... ... ... ... ... ... ... ... ... ... 000 15 17 10DZOA4653-07 1 13 48 27.5 –60 11 47 309.97 1.89 10.7 DG 0 1 1 1 S 16.23 ± 0.09 13.29 ± 0.04 11.46 ± 0.07 0.24 ± 0.11 0.75 ± 0.12 0.52 ± 0.08 030 8 18 11DZOA4654-03 1 13 49 04.0 –58 27 34 310.43 3.57 3.2 UG 0 1 1 1 SM 15.65 ± 0.07 13.92 ± 0.11 12.16 ± 0.19 0.91 ± 0.11 1.84 ± 0.19 0.93 ± 0.19 403 9 11 8DZOA4654-02 1 13 49 46.1 –58 13 04 310.57 3.79 2.6 DG 1 1 1 1 SM 14.61 ± 0.04 12.96 ± 0.04 11.81 ± 0.14 1.00 ± 0.06 1.91 ± 0.11 0.91 ± 0.11 000 16 16 10DZOA4654-01 1 13 49 49.9 –57 37 25 310.71 4.36 2.5 DG 1 1 1 0 SL 16.34 ± 0.12 14.59 ± 0.11 ... ... 0.66 ± 0.21 ... ... ... ... 000 12 7 ...DZOA4655-01 1+ 13 50 21.3 –58 17 12 310.63 3.70 2.9 DG 0 1 1 1 SE 14.91 ± 0.05 13.15 ± 0.05 12.51 ± 0.14 1.07 ± 0.05 1.82 ± 0.11 0.75 ± 0.10 330 14 14 8DZOA4655-04 1+ 13 50 47.0 –59 23 08 310.43 2.62 6.1 DG 0 1 1 1 SM 15.59 ± 0.13 12.86 ± 0.06 11.70 ± 0.12 1.12 ± 0.11 2.03 ± 0.13 0.91 ± 0.09 033 12 15 12DZOA4655-03 1+ 13 50 55.3 –59 08 29 310.51 2.85 4.1 DG 0 1 1 1 SM/L 15.70 ± 0.08 13.82 ± 0.06 ... ... 0.80 ± 0.12 ... ... ... ... 000 12 9 8DZOA4655-02 1+ 13 50 56.5 –58 27 46 310.66 3.51 3.5 DG 0 1 1 1 SM 15.88 ± 0.08 ... ... 12.21 ± 0.11 ... ... 2.26 ± 0.14 ... ... 000 13 12 8DZOA4655-08 1+ 13 51 03.5 –57 47 15 310.83 4.17 2.5 BG 1 0 0 0 SL ... ... ... ... ... ... ... ... ... ... ... ... 000 ... ... ...DZOA4656-01 1 13 51 31.9 –58 23 01 310.76 3.57 3.0 DG 0 1 1 1 SE 15.75 ± 0.09 13.64 ± 0.07 12.85 ± 0.19 1.04 ± 0.12 2.12 ± 0.19 1.07 ± 0.18 000 8 12 7DZOA4656-04 1 13 51 33.9 –60 07 17 310.36 1.88 9.2 UG 0 1 1 1 S ... ... 13.45 ± 0.05 12.21 ± 0.20 ... ... ... ... 0.31 ± 0.15 030 7 9 8DZOA4656-03 2 13 51 38.6 –58 35 15 310.72 3.37 4.1 DG 1 1 1 1 SE 12.77 ± 0.01 10.81 ± 0.01 9.14 ± 0.01 1.09 ± 0.01 1.99 ± 0.01 0.89 ± 0.01 000 48 54 37DZOA4656-02 1 13 51 39.8 –58 26 48 310.76 3.51 3.2 UG 0 1 0 0 SM/L ... ... ... ... ... ... ... ... ... ... ... ... 000 5 ... ...DZOA4657-03 1 13 52 55.4 –58 09 59 310.99 3.74 2.3 UG 0 1 1 1 E/SE 15.94 ± 0.09 14.61 ± 0.12 ... ... 1.16 ± 0.14 ... ... ... ... 000 6 9 5DZOA4657-04 1 13 53 08.7 –58 12 59 311.00 3.69 2.4 UG 0 1 1 0 SL ... ... ... ... ... ... ... ... ... ... ... ... 000 8 8 5DZOA4657-02 1 13 53 32.4 –57 49 30 311.15 4.05 2.7 DG 0 1 1 1 E/SE ... ... ... ... ... ... ... ... ... ... ... ... 000 12 11 7DZOA4657-01 1 13 53 34.1 –57 49 10 311.15 4.06 2.7 DG 0 1 1 1 SE 14.81 ± 0.04 13.26 ± 0.04 12.25 ± 0.14 0.91 ± 0.04 1.67 ± 0.10 0.77 ± 0.10 000 15 14 9DZOA4658-06 1 13 54 18.1: –59 56 14: 310.74 1.98 10.1 UG 0 1 1 0 S 17.69 ± 0.18 14.28 ± 0.15 ... ... 0.57 ± 0.20 ... ... ... ... 999 4 8 ...DZOA4658-04 1 13 54 23.1: –58 06 30: 311.19 3.75 2.5 DG 0 1 1 1 SM ... ... ... ... ... ... ... ... ... ... ... ... 999 9 12 8DZOA4658-03 1 13 54 27.3: –58 07 35: 311.19 3.73 2.6 DG 1 1 1 1 SM 14.68 ± 0.03 12.69 ± 0.04 ... ... 1.49 ± 0.06 ... ... ... ... 999 14 15 12DZOA4658-01 1 13 54 38.5: –57 41 11: 311.32 4.15 2.3 DG 1 1 1 0 SE ... ... ... ... ... ... ... ... ... ... ... ... 999 4 6 ...DZOA4658-05 1 13 54 39.5: –58 31 07: 311.12 3.34 3.4 UG 0 1 1 1 SM 17.48 ± 0.12 14.38 ± 0.09 ... ... 1.42 ± 0.20 ... ... ... ... 999 6 9 3DZOA4659-13 2 13 55 18.4 –58 05 32 311.31 3.74 2.8 UG 0 1 1 1 E/SE 15.84 ± 0.13 14.48 ± 0.12 ... ... 1.03 ± 0.13 ... ... ... ... 000 9 9 5DZOA4659-11 1 13 55 29.0 –57 38 59 311.44 4.16 2.4 BG 1 1 1 0 SE/M 15.80 ± 0.09 14.48 ± 0.10 ... ... 0.95 ± 0.17 ... ... ... ... 300 6 13 3DZOA4659-10 1 13 55 29.5 –57 35 26 311.46 4.22 2.4 BG 1 1 1 0 S ... ... ... ... ... ... ... ... ... ... ... ... 000 5 3 ...DZOA4659-01 1 13 55 43.5 –57 48 38 311.43 4.00 2.9 UG 0 1 1 1 – 15.99 ± 0.07 13.04 ± 0.04 11.50 ± 0.15 1.24 ± 0.09 2.39 ± 0.15 1.15 ± 0.14 060 4 8 5DZOA4659-02 1 13 56 07.7 –58 52 21 311.22 2.95 3.8 UG 0 1 1 1 ? 14.75 ± 0.03 13.21 ± 0.04 13.09 ± 0.22 0.52 ± 0.05 0.88 ± 0.18 0.37 ± 0.18 664 11 17 6DZOA4659-05 1 13 56 09.7 –59 46 14 311.00 2.08 8.1 UG 0 1 1 1 S 16.85 ± 0.17 13.64 ± 0.05 12.65 ± 0.17 0.75 ± 0.14 1.15 ± 0.19 0.40 ± 0.15 000 10 10 5DZOA4660-02 1 13 56 52.3 –57 51 53 311.57 3.91 2.5 DG 1 1 1 1 SM 15.98 ± 0.08 14.50 ± 0.08 ... ... 0.70 ± 0.13 ... ... ... ... 000 10 12 6DZOA4660-05 1 13 57 01.5 –59 12 35 311.25 2.60 5.4 DG 0 1 1 1 E/SE 15.86 ± 0.06 13.05 ± 0.04 11.91 ± 0.13 0.91 ± 0.07 1.58 ± 0.11 0.67 ± 0.10 030 10 14 15DZOA4660-03 1 13 57 06.7 –58 02 43 311.55 3.72 2.9 DG 0 1 1 1 E/SE 16.22 ± 0.08 14.00 ± 0.06 12.98 ± 0.23 1.08 ± 0.10 2.26 ± 0.16 1.18 ± 0.15 000 9 12 8DZOA4660-01 2 13 57 08.2 –57 44 09 311.63 4.02 2.6 UG 0 1 1 1 SE 15.05 ± 0.03 13.94 ± 0.04 13.13 ± 0.20 0.56 ± 0.05 1.39 ± 0.16 0.84 ± 0.16 000 12 13 6DZOA4660-04 1 13 57 46.6 –58 07 01 311.62 3.63 3.0 DG 0 1 1 1 E 15.51 ± 0.06 13.98 ± 0.06 12.20 ± 0.15 0.99 ± 0.06 2.22 ± 0.10 1.22 ± 0.10 000 9 10 9DZOA4661-03 2 13 58 52.6 –59 45 47 311.33 2.00 8.9 UG 0 1 1 1 S 17.16 ± 0.09 13.91 ± 0.04 12.68 ± 0.12 0.66 ± 0.10 1.26 ± 0.13 0.59 ± 0.09 030 4 9 7DZOA4661-01 2 13 58 57.0 –58 46 02 311.60 2.96 4.3 DG 1 1 1 1 SM 13.99 ± 0.01 11.44 ± 0.01 10.05 ± 0.02 0.95 ± 0.01 1.81 ± 0.02 0.86 ± 0.02 030 26 27 22DZOA4662-02 2 13 59 35.7: –58 25 49: 311.77 3.27 4.5 UG 0 1 1 1 E/SE 15.35 ± 0.03 13.35 ± 0.06 12.09 ± 0.09 0.72 ± 0.04 1.62 ± 0.07 0.90 ± 0.07 400 10 12 11DZOA4662-03 1 14 00 01.9: –58 29 06: 311.81 3.20 4.9 UG 0 1 1 0 S 16.71 ± 0.11 ... ... ... ... ... ... ... ... ... ... 000 10 7 ...DZOA4662-01 1 14 00 04.0: –57 50 02: 311.99 3.83 2.7 DG 1 1 1 1 SM 15.51 ± 0.06 13.61 ± 0.05 12.03 ± 0.18 1.34 ± 0.09 2.24 ± 0.17 0.90 ± 0.16 000 17 21 18DZOA4662-04 1 14 00 10.9: –59 12 35: 311.64 2.50 5.2 UG 0 1 1 0 SM/L 16.35 ± 0.11 ... ... ... ... ... ... ... ... ... ... 000 5 8 ...

A. C. Schröder et al.: The highly obscured region around PKS 1343 – 601. I., Online Material p 7
Table 2. continued.
Ident. N RA (J2000) Dec Gal � Gal b AB Class Visibil. Type I J K (I − J)0 (I − K)0 (J − K)0 Phot. DI DJ DK
[h m s] [◦ ′ ′′] [◦] [◦] [mag] [mag] [mag] [mag] [mag] [mag] [mag] [′′] [′′] [′′](1) (2) (3a) (3b) (4a) (4b) (5) (6) (7) (8) (9) (10) (11) (12) (13) (14) (15) (16) (17) (18)
DZOA4662-07 1 14 00 26.9: –60 18 31: 311.38 1.43 15.4 UG 0 0 1 1 ? ... ... 14.37 ± 0.07 12.69 ± 0.15 ... ... ... ... 0.16 ± 0.16 000 ... 11 9DZOA4663-05 2 14 00 33.9 –59 32 32 311.60 2.16 6.6 DG 0 1 1 1 SE/M 16.53 ± 0.07 12.86 ± 0.02 11.45 ± 0.08 1.37 ± 0.08 2.27 ± 0.09 0.90 ± 0.06 000 6 16 11DZOA4663-02 1 14 00 55.3 –57 37 23 312.15 4.00 2.9 DG 0 1 1 0 SM 15.02 ± 0.03 14.22 ± 0.05 ... ... 0.23 ± 0.06 ... ... ... ... 000 13 15 ...DZOA4663-01 1 14 00 55.8 –57 37 28 312.15 4.00 2.9 DG 0 1 1 0 SM 15.27 ± 0.04 13.64 ± 0.04 ... ... 0.74 ± 0.05 ... ... ... ... 000 14 16 ...DZOA4663-04 1 14 01 25.6 –58 37 37 311.95 3.01 4.4 DG 0 1 1 1 SE/M 15.84 ± 0.07 13.43 ± 0.04 11.99 ± 0.10 1.11 ± 0.08 2.19 ± 0.14 1.08 ± 0.13 000 11 14 10DZOA4663-03 1 14 01 35.4 –58 32 22 311.99 3.09 4.3 UG 0 1 1 0 S 16.38 ± 0.14 15.39 ± 0.20 ... ... 0.04 ± 0.20 ... ... ... ... 000 7 8 ...DZOA4664-02 1 14 03 11.2 –58 06 20 312.31 3.45 3.5 DG 0 1 1 1 SL 15.03 ± 0.05 13.46 ± 0.05 ... ... 0.83 ± 0.09 ... ... ... ... 000 15 15 6DZOA4665-02 2 14 03 13.8 –58 07 13 312.31 3.44 3.6 DG 0 1 1 1 SM 14.50 ± 0.02 12.61 ± 0.02 11.67 ± 0.05 0.81 ± 0.03 1.66 ± 0.06 0.85 ± 0.06 030 18 21 12DZOA4665-03 1 14 03 57.5 –58 09 49 312.40 3.37 4.0 UG 0 1 1 1 SM/L ... ... ... ... ... ... ... ... ... ... ... ... 000 8 15 6DZOA4665-01 2 14 04 21.0 –57 43 33 312.57 3.77 2.9 DG 0 1 1 1 E 15.21 ± 0.03 13.29 ± 0.03 12.13 ± 0.10 1.10 ± 0.04 2.13 ± 0.06 1.03 ± 0.07 000 10 14 11DZOA4666-01 1 14 05 35.9 –59 32 19 312.21 1.99 8.5 UG 0 1 1 1 SM/L 17.00 ± 0.16 14.70 ± 0.13 ... ... 0.09 ± 0.16 ... ... ... ... 000 6 12 5
B-band galaxies found to be non galaxian with DENIS:
DZOA4654-04 1 13 49 41.3 –57 48 40 310.65 4.18 2.6 NG 1 1 0 0 – ... ... ... ... ... ... ... ... ... ... ... ... 000 4 ... ...DZOA4655-07 1 13 50 51.8 –57 43 02 310.82 4.24 2.6 NG 1 1 1 0 – ... ... ... ... ... ... ... ... ... ... ... ... 000 5 4 ...DZOA4660-06 2 13 56 42.9 –59 11 16 311.22 2.63 5.1 NG 1 1 1 1 – 15.95 ± 0.05 14.62 ± 0.06 ... ... 0.08 ± 0.11 ... ... ... ... 000 ... ... ...DZOA4661-04 1 13 58 40.7 –58 18 13 311.69 3.42 3.5 NG 1 1 1 0 – ... ... ... ... ... ... ... ... ... ... ... ... 000 ... ... ...DZOA4664-03 2 14 02 42.0 –57 44 08 312.35 3.83 3.3 NG 1 1 0 0 – ... ... ... ... ... ... ... ... ... ... ... ... 000 ... ... ...