aswath damodaran - new york universitypeople.stern.nyu.edu/adamodar/pdfiles/eqnotes/dcfgro… ·...
TRANSCRIPT

Aswath Damodaran 1
Estimating Growth
Aswath Damodaran

Aswath Damodaran 2
Ways of Estimating Growth in Earnings
n Look at the past• The historical growth in earnings per share is usually a good starting point
for growth estimation
n Look at what others are estimating• Analysts estimate growth in earnings per share for many firms. It is useful
to know what their estimates are.
n Look at fundamentals• Ultimately, all growth in earnings can be traced to two fundamentals -
how much the firm is investing in new projects, and what returns theseprojects are making for the firm.

Aswath Damodaran 3
I. Historical Growth in EPS
n Historical growth rates can be estimated in a number of different ways• Arithmetic versus Geometric Averages
• Simple versus Regression Models
n Historical growth rates can be sensitive to• the period used in the estimation
n In using historical growth rates, the following factors have to beconsidered• how to deal with negative earnings
• the effect of changing size

Aswath Damodaran 4
Motorola: Arithmetic versus Geometric GrowthRates
Revenues % Change EBITDA % Change EBIT % Change1994 22,245$ 4,151$ 2,604$ 1995 27,037$ 21.54% 4,850$ 16.84% 2,931$ 12.56%1996 27,973$ 3.46% 4,268$ -12.00% 1,960$ -33.13%1997 29,794$ 6.51% 4,276$ 0.19% 1,947$ -0.66%1998 29,398$ -1.33% 3,019$ -29.40% 822$ -57.78%1999 30,931$ 5.21% 5,398$ 78.80% 3,216$ 291.24%
Arithmetic Average 7.08% 10.89% 42.45%Geometric Average 6.82% 5.39% 4.31%Standard deviation 8.61% 41.56% 141.78%

Aswath Damodaran 5
Cisco: Linear and Log-Linear Models forGrowth
Year EPS ln(EPS)1991 $ 0.01 -4.60521992 $ 0.02 -3.91201993 $ 0.04 -3.21891994 $ 0.07 -2.65931995 $ 0.08 -2.52571996 $ 0.16 -1.83261997 $ 0.18 -1.71481998 $ 0.25 -1.3863
1999 $ 0.32 -1.1394
n EPS = -.066 + 0.0383 ( t): EPS grows by $0.0383 a yearGrowth Rate = $0.0383/$0.13 = 30.5% ($0.13: Average EPS from 91-99)n ln(EPS) = -4.66 + 0.4212 (t): Growth rate approximately 42.12%
Aswath Damodaran 6
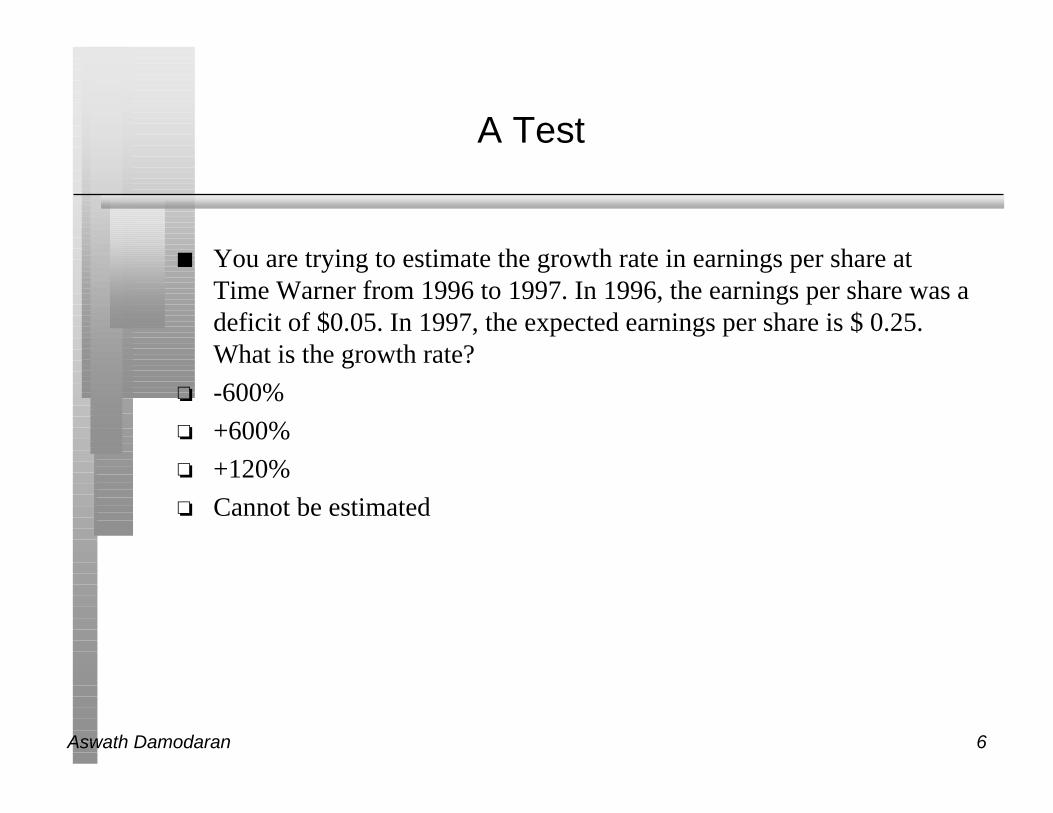
A Test
n You are trying to estimate the growth rate in earnings per share atTime Warner from 1996 to 1997. In 1996, the earnings per share was adeficit of $0.05. In 1997, the expected earnings per share is $ 0.25.What is the growth rate?
o -600%
o +600%
o +120%
o Cannot be estimated
Aswath Damodaran 7
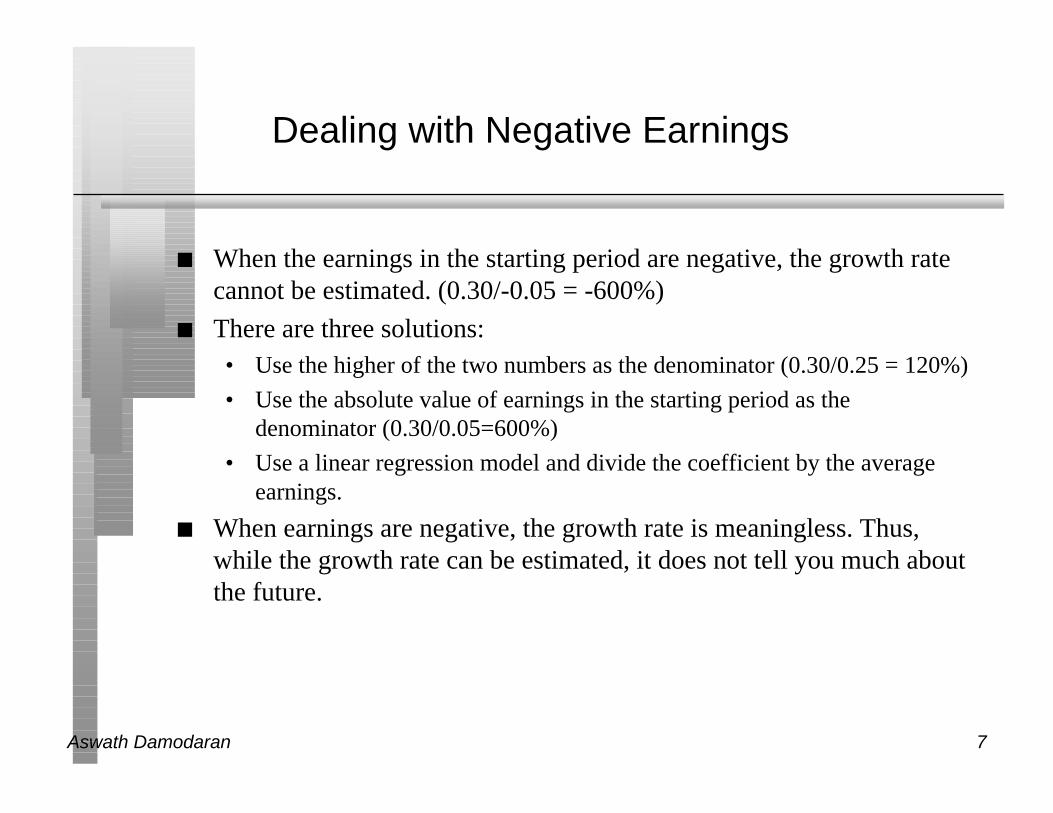
Dealing with Negative Earnings
n When the earnings in the starting period are negative, the growth ratecannot be estimated. (0.30/-0.05 = -600%)
n There are three solutions:• Use the higher of the two numbers as the denominator (0.30/0.25 = 120%)
• Use the absolute value of earnings in the starting period as thedenominator (0.30/0.05=600%)
• Use a linear regression model and divide the coefficient by the averageearnings.
n When earnings are negative, the growth rate is meaningless. Thus,while the growth rate can be estimated, it does not tell you much aboutthe future.

Aswath Damodaran 8
The Effect of Size on Growth: Callaway Golf
Year Net Profit Growth Rate
1990 1.80
1991 6.40 255.56%
1992 19.30 201.56%
1993 41.20 113.47%
1994 78.00 89.32%
1995 97.70 25.26%
1996 122.30 25.18%
Geometric Average Growth Rate = 102%

Aswath Damodaran 9
Extrapolation and its Dangers
Year Net Profit
1996 $ 122.30
1997 $ 247.05
1998 $ 499.03
1999 $ 1,008.05
2000 $ 2,036.25
2001 $ 4,113.23
n If net profit continues to grow at the same rate as it has in the past 6years, the expected net income in 5 years will be $ 4.113 billion.

Aswath Damodaran 10
II. Analyst Forecasts of Growth
n While the job of an analyst is to find under and over valued stocks inthe sectors that they follow, a significant proportion of an analyst’stime (outside of selling) is spent forecasting earnings per share.• Most of this time, in turn, is spent forecasting earnings per share in the
next earnings report
• While many analysts forecast expected growth in earnings per share overthe next 5 years, the analysis and information (generally) that goes intothis estimate is far more limited.
n Analyst forecasts of earnings per share and expected growth arewidely disseminated by services such as Zacks and IBES, at least forU.S companies.

Aswath Damodaran 11
How good are analysts at forecasting growth?
n Analysts forecasts of EPS tend to be closer to the actual EPS thansimple time series models, but the differences tend to be small
Study Time Period Analyst Forecast Error Time Series Model
Collins & Hopwood Value Line Forecasts 31.7% 34.1%
Brown & Rozeff Value Line Forecasts 28.4% 32.2%
Fried & Givoly Earnings Forecaster 16.4% 19.8%
n The advantage that analysts have over time series models• tends to decrease with the forecast period (next quarter versus 5 years)
• tends to be greater for larger firms than for smaller firms
• tends to be greater at the industry level than at the company level
n Forecasts of growth (and revisions thereof) tend to be highly correlatedacross analysts.

Aswath Damodaran 12
Are some analysts more equal than others?
n A study of All-America Analysts (chosen by Institutional Investor) found that• There is no evidence that analysts who are chosen for the All-America Analyst
team were chosen because they were better forecasters of earnings. (Their medianforecast error in the quarter prior to being chosen was 30%; the median forecasterror of other analysts was 28%)
• However, in the calendar year following being chosen as All-America analysts,these analysts become slightly better forecasters than their less fortunate brethren.(The median forecast error for All-America analysts is 2% lower than the medianforecast error for other analysts)
• Earnings revisions made by All-America analysts tend to have a much greaterimpact on the stock price than revisions from other analysts
• The recommendations made by the All America analysts have a greater impact onstock prices (3% on buys; 4.7% on sells). For these recommendations the pricechanges are sustained, and they continue to rise in the following period (2.4% forbuys; 13.8% for the sells).

Aswath Damodaran 13
The Five Deadly Sins of an Analyst
n Tunnel Vision: Becoming so focused on the sector and valuationswithin the sector that they lose sight of the bigger picture.
n Lemmingitis:Strong urge felt by analysts to change recommendations& revise earnings estimates when other analysts do the same.
n Stockholm Syndrome(shortly to be renamed the Bre-X syndrome):Refers to analysts who start identifying with the managers of the firmsthat they are supposed to follow.
n Factophobia (generally is coupled with delusions of being a famousstory teller): Tendency to base a recommendation on a “story” coupledwith a refusal to face the facts.
n Dr. Jekyll/Mr.Hyde: Analyst who thinks his primary job is to bring ininvestment banking business to the firm.

Aswath Damodaran 14
Propositions about Analyst Growth Rates
n Proposition 1: There if far less private information and far morepublic information in most analyst forecasts than is generally claimed.
n Proposition 2: The biggest source of private information for analystsremains the company itself which might explain• why there are more buy recommendations than sell recommendations
(information bias and the need to preserve sources)
• why there is such a high correlation across analysts forecasts and revisions
• why All-America analysts become better forecasters than other analystsafter they are chosen to be part of the team.
n Proposition 3: There is value to knowing what analysts are forecastingas earnings growth for a firm. There is, however, danger when theyagree too much (lemmingitis) and when they agree to little (in whichcase the information that they have is so noisy as to be useless).

Aswath Damodaran 15
III. Fundamental Growth Rates
Investmentin ExistingProjects$ 1000
Current Return onInvestment on Projects12%
X =CurrentEarnings$120
Investmentin ExistingProjects$1000
Next Period’s Return onInvestment12%
XInvestmentin NewProjects$100
Return onInvestment onNew Projects12%
X+ =Next Period’sEarnings132
Investmentin ExistingProjects$1000
Change inROI from current to nextperiod: 0%
XInvestmentin NewProjects$100
Return onInvestment onNew Projects12%
X+ Change in Earnings$ 12=

Aswath Damodaran 16
Growth Rate Derivations
In the special case where ROI on existing projects remains unchanged and is equal to the ROI on new projects
Investment in New Projects
Current EarningsReturn on Investment
Change in Earnings
Current Earnings=X
Reinvestment Rate X Return on Investment = Growth Rate in Earnings
in the more general case where ROI can change from period to period, this can be expanded as follows:
Investment in Existing Projects*(Change in ROI) + New Projects (ROI)
Investment in Existing Projects* Current ROIChange in Earnings
Current Earnings=
100
120 X 12% =$12
$120
For instance, if the ROI increases from 12% to 13%, the expected growth rate can be written as follows:
83.33% X 12% = 10%
$1,000 * (.13 - .12) + 100 (13%)
$ 1000 * .12$23
$120= = 19.17%

Aswath Damodaran 17
I. Expected Long Term Growth in EPS
n When looking at growth in earnings per share, these inputs can be cast asfollows:
Reinvestment Rate = Retained Earnings/ Current Earnings = Retention RatioReturn on Investment = ROE = Net Income/Book Value of Equity
n In the special case where the current ROE is expected to remain unchangedgEPS = Retained Earningst-1/ NIt-1 * ROE
= Retention Ratio * ROE= b * ROE
n Proposition 1: The expected growth rate in earnings for a companycannot exceed its return on equity in the long term.

Aswath Damodaran 18
Estimating Expected Growth in EPS: ABNAmro
n Current Return on Equity = 15.79%
n Current Retention Ratio = 1 - DPS/EPS = 1 - 1.13/2.45 = 53.88%
n If ABN Amro can maintain its current ROE and retention ratio, itsexpected growth in EPS will be:
Expected Growth Rate = 0.5388 (15.79%) = 8.51%

Aswath Damodaran 19
Expected ROE changes and Growth
n Assume now that ABN Amro’s ROE next year is expected to increaseto 17%, while its retention ratio remains at 53.88%. What is the newexpected long term growth rate in earnings per share?
n Will the expected growth rate in earnings per share next year begreater than, less than or equal to this estimate?
o greater than
o less than
o equal to

Aswath Damodaran 20
Changes in ROE and Expected Growth
n When the ROE is expected to change,gEPS= b *ROEt+1 +(ROEt+1– ROEt)/ ROEt
n Proposition 2: Small changes in ROE translate into large changes inthe expected growth rate.• The lower the current ROE, the greater the effect on growth of changes in
the ROE.
n Proposition 3: No firm can, in the long term, sustain growth inearnings per share from improvement in ROE.• Corollary: The higher the existing ROE of the company (relative to the
business in which it operates) and the more competitive the business inwhich it operates, the smaller the scope for improvement in ROE.

Aswath Damodaran 21
Changes in ROE: ABN Amro
n Assume now that ABN’s expansion into Asia will push up the ROE to17%, while the retention ratio will remain 53.88%. The expectedgrowth rate in that year will be:
gEPS = b *ROEt+1 + (ROEt+1– ROEt)/ ROEt =(.5388)(.17)+(.17-.1579)/(.1579)= 16.83%
n Note that 1.21% improvement in ROE translates into almost adoubling of the growth rate from 8.51% to 16.83%.

Aswath Damodaran 22
ROE and Leverage
n ROE = ROC + D/E (ROC - i (1-t))
where,
ROC = EBITt (1 - tax rate)) / BV of Capitalt-1D/E = BV of Debt/ BV of Equity
i = Interest Expense on Debt / BV of Debt
t = Tax rate on ordinary income
n Note that BV of capital = BV of Debt + BV of Equity.
n BV: Book Value

Aswath Damodaran 23
Decomposing ROE: Brahma
n Real Return on Capital = 687 (1-.32) / (1326+542+478) = 19.91%• This is assumed to be real because both the book value and income are
inflation adjusted.
n Debt/Equity Ratio = (542+478)/1326 = 0.77
n After-tax Cost of Debt = 8.25% (1-.32) = 5.61% (Real BR)
n Return on Equity = ROC + D/E (ROC - i(1-t))19.91% + 0.77 (19.91% - 5.61%) = 30.92%

Aswath Damodaran 24
Decomposing ROE: Titan Watches (India)
n Return on Capital = 713 (1-.25)/(1925+2378+1303) = 9.54%
n Debt/Equity Ratio = (2378 + 1303)/1925 = 1.91
n After-tax Cost of Debt = 13.5% (1-.25) = 10.125%
n Return on Equity = ROC + D/E (ROC - i(1-t))9.54% + 1.91 (9.54% - 10.125%) = 8.42%

Aswath Damodaran 25
II. Expected Growth in Net Income
n The limitation of the EPS fundamental growth equation is that itfocuses on per share earnings and assumes that reinvested earnings areinvested in projects earning the return on equity.
n A more general version of expected growth in earnings can beobtained by substituting in the equity reinvestment into realinvestments (net capital expenditures and working capital):Equity Reinvestment Rate = (Net Capital Expenditures + Change in Working
Capital) (1 - Debt Ratio)/ Net Income
Expected GrowthNet Income = Equity Reinvestment Rate * ROE

Aswath Damodaran 26
III. Expected Growth in EBIT AndFundamentals: Stable ROC and Reinvestment
Rate
n When looking at growth in operating income, the definitions areReinvestment Rate = (Net Capital Expenditures + Change in WC)/EBIT(1-t)
Return on Investment = ROC = EBIT(1-t)/(BV of Debt + BV of Equity)
n Reinvestment Rate and Return on Capital
gEBIT = (Net Capital Expenditures + Change in WC)/EBIT(1-t) * ROC= Reinvestment Rate * ROC
n Proposition: The net capital expenditure needs of a firm, for agiven growth rate, should be inversely proportional to the qualityof its investments.

Aswath Damodaran 27
No Net Capital Expenditures and Long TermGrowth
n You are looking at a valuation, where the terminal value is based uponthe assumption that operating income will grow 3% a year forever, butthere are no net cap ex or working capital investments being madeafter the terminal year. When you confront the analyst, he contendsthat this is still feasible because the company is becoming moreefficient with its existing assets and can be expected to increase itsreturn on capital over time. Is this a reasonable explanation?
o Yes
o No
n Explain.
Aswath Damodaran 28
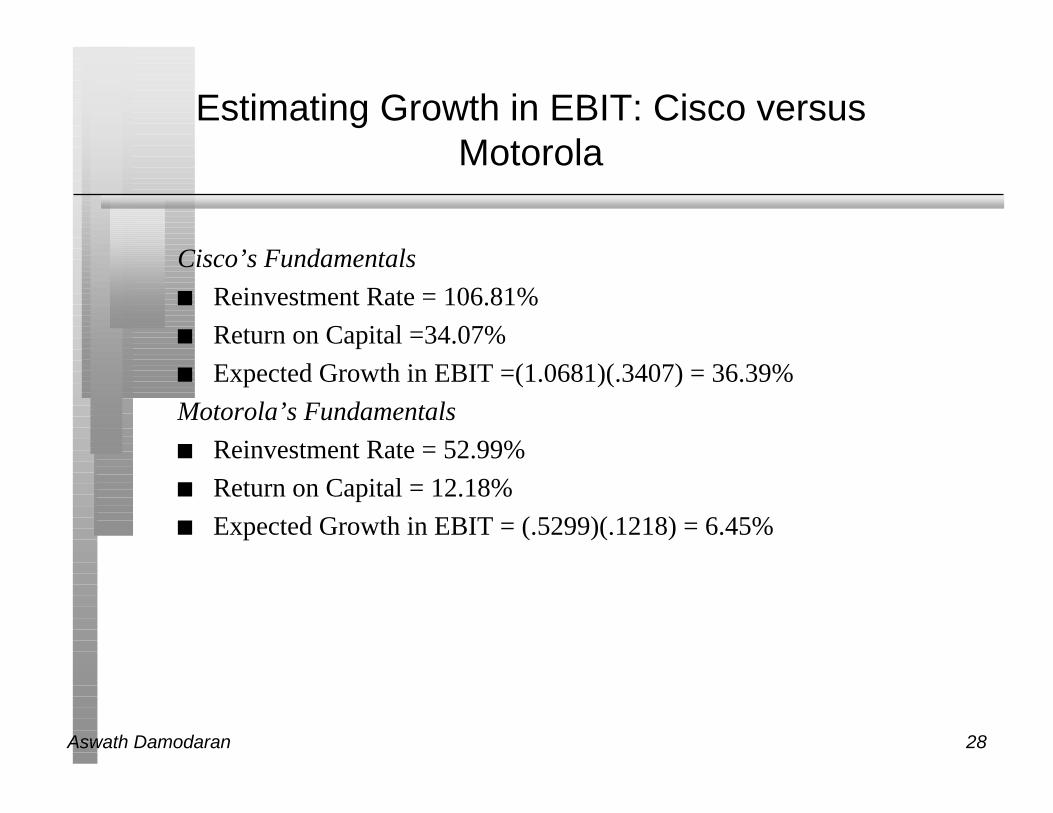
Estimating Growth in EBIT: Cisco versusMotorola
Cisco’s Fundamentals
n Reinvestment Rate = 106.81%
n Return on Capital =34.07%
n Expected Growth in EBIT =(1.0681)(.3407) = 36.39%
Motorola’s Fundamentals
n Reinvestment Rate = 52.99%
n Return on Capital = 12.18%
n Expected Growth in EBIT = (.5299)(.1218) = 6.45%

Aswath Damodaran 29
IV. Operating Income Growth when Return onCapital is Changing
n When the return on capital is changing, there will be a secondcomponent to growth, positive if the return on capital is increasing andnegative if the return on capital is decreasing.
n If ROCt is the return on capital in period t and ROCt+1 is the return oncapital in period t+1, the expected growth rate in operating income willbe:
Expected Growth Rate = ROCt+1 * Reinvestment rate
+(ROCt+1 – ROCt)/ROCt
n If the change is over multiple periods, the second component should bespread out over each period.

Aswath Damodaran 30
Motorola’s Growth Rate
n Motorola’s current return on capital is 12.18% and its reinvestment rate is52.99%.
n We expect Motorola’s return on capital to rise to 17.22% over the next 5 years(which is half way towards the industry average)
Expected Growth Rate
= ROCNew Investments*Reinvestment Ratecurrent+ {[1+(ROCIn 5 years-ROCCurrent)/ROCCurrent]1/5-1}
= .1722*.5299 +{ [1+(.1722-.1218)/.1218]1/5-1}
= .174 or 17.40%
One way to think about this is to decompose Motorola’s expected growth into
Growth from new investments: .1722*5299= 9.12%
Growth from more efficiently using existing investments: 17.40%-9.12%=8.28%
{Note that I am assuming that the new investments start making 17.22%immediately, while allowing for existing assets to improve returns gradually}

Aswath Damodaran 31
V. Estimating Growth when Operating Incomeis Negative or Margins are changing
n When operating income is negative or margins are expected to changeover time, we use a three step process to estimate growth:• Estimate growth rates in revenues over time
– Use historical revenue growth to get estimates of revenue growth in the nearfuture
– Decrease the growth rate as the firm becomes larger– Keep track of absolute revenues to make sure that the growth is feasible
• Estimate expected operating margins each year– Set a target margin that the firm will move towards– Adjust the current margin towards the target margin
• Estimate the capital that needs to be invested to generate revenue growthand expected margins
– Estimate a sales to capital ratio that you will use to generate reinvestmentneeds each year.

Aswath Damodaran 32
Commerce One: Revenues and RevenueGrowth
Year Growth Rate Revenues Operating Margin Operating Income
Current $537 -79.62% -$428
1 50.00% $806 -48.17% -$388
2 100.00% $1,611 -27.21% -$438
3 80.00% $2,900 -13.23% -$384
4 60.00% $4,640 -3.91% -$182
5 40.00% $6,496 2.30% $149
6 35.00% $8,770 6.44% $565
7 30.00% $11,401 9.20% $1,049
8 20.00% $13,681 11.04% $1,510
9 10.00% $15,049 12.27% $1,846
10 5.00% $15,802 13.08% $2,068

Aswath Damodaran 33
Commerce One: Reinvestment Needs
Year Revenues ∆Revenues Sales/Capital Reinvestment Capital ROC
Current $537 $2,744
1 $806 $269 2.20 $122 $2,866 -14.14%
2 $1,611 $806 2.20 $366 $3,232 -15.30%
3 $2,900 $1,289 2.20 $586 $3,818 -11.87%
4 $4,640 $1,740 2.20 $791 $4,609 -4.76%
5 $6,496 $1,856 2.20 $844 $5,452 3.24%
6 $8,770 $2,274 2.20 $1,033 $6,486 10.36%
7 $11,401 $2,631 2.20 $1,196 $7,682 16.17%
8 $13,681 $2,280 2.20 $1,036 $8,718 14.17%
9 $15,049 $1,368 2.20 $622 $9,340 13.76%
10 $15,802 $752 2.20 $342 $9,682 14.39%
Industry average = 15%

Aswath Damodaran 34
Expected Growth Rate
Equity Earnings Operating Income
HistoricalFundamentalsAnalysts HistoricalFundamentals
Stable ROE Changing ROE
ROE * Retention RatioROEt+1*Retention Ratio+ (ROEt+1-ROEt)/ROEt
Stable ROC
ROC * Reinvestment Rate
Changing ROC
ROCt+1*Reinvestment Rate+ (ROCt+1-ROCt)/ROCt
Negative Earnings
1. Revenue Growth2. Operating Margins3. Reinvestment NeedsEarnings per share Net Income
Stable ROE Changing ROE
ROE * Equity Reinvestment Ratio
ROEt+1*Eq. Reinv Ratio+ (ROEt+1-ROEt)/ROEt