at a glance - mathematically speaking - new...
TRANSCRIPT
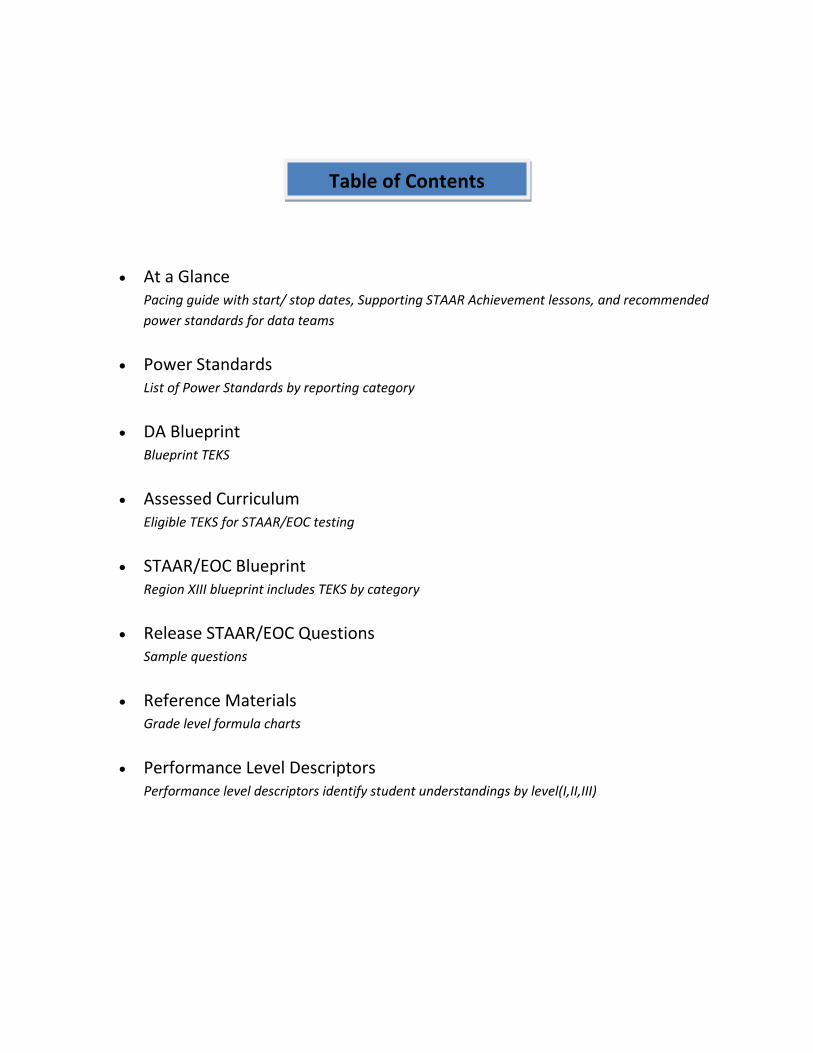
• At a Glance
Pacing guide with start/ stop dates, Supporting STAAR Achievement lessons, and recommended power standards for data teams
• Power Standards
List of Power Standards by reporting category
• DA Blueprint
Blueprint TEKS
• Assessed Curriculum
Eligible TEKS for STAAR/EOC testing
• STAAR/EOC Blueprint
Region XIII blueprint includes TEKS by category
• Release STAAR/EOC Questions
Sample questions
• Reference Materials
Grade level formula charts
• Performance Level Descriptors
Performance level descriptors identify student understandings by level(I,II,III)
Table of Contents

Department of Curriculum and Instruction
Algebra II at a Glance
Nine Week Period
Unit Name Supporting
STAAR Achievement
Lessons
Power Standards Estimated
Time Frame
START DATES
STOP DATES
1st Nine Weeks
Equations and Inequalities
12 days August 27
September 12
Relations and Functions
Domain and Range of Functions Scatterplots
2A.1A, 2A.1B 9 days
September 13
September 25
Transformations of Functions
Function Transformations
2A.1A, 2A.4B 8 days September
26 October
5
Solving Systems of Equations and
Inequalities
Systems of Equations: Three Unknowns Systems of Linear Inequalities
2A.1A, 2A.3A, 2A.3B, 2A.3C
13 days
October 8
October 24
2nd Nine Weeks
Solving Systems of Equations and
Inequalities
continued
Quadratic Functions, Equations and
Inequalities
Determining Reasonableness Quadratic Representations Quadratic Situations Quadratic Formula Standard and Vertex Forms
2A.1B, 2A.4B, 2A.6A, 2A.6B, 2A.7A, 2A.8A, 2A.8D
33 days
October
25
December
13
3rd Nine Weeks
Quadratic Relations - Conics
Systems of Equations: Substitution
2A.3B, 2A.7A 13 days January
8 January
25 Radical Functions,
Equations and Inequalities
Square Root Functions
2A.4B, 2A.9F 20 days
January 28
February 25
Rational Functions, Equations and
Inequalities Rational Functions
2A.10F 14 days
February 26
March 22
4th Nine Weeks
Exponential and Logarithmic
Functions, Equations and Inequalities
Inverse of an Exponential Function Exponential Functions
2A.4B, 2A.11A, 2A.11F 29 days
March
25
May
9
Polynomial Functions, Equations
and Inequalities
12 days
May 10
May 28
Power Standards • Algebra II Page 1 of 2
Department of Curriculum and Instruction
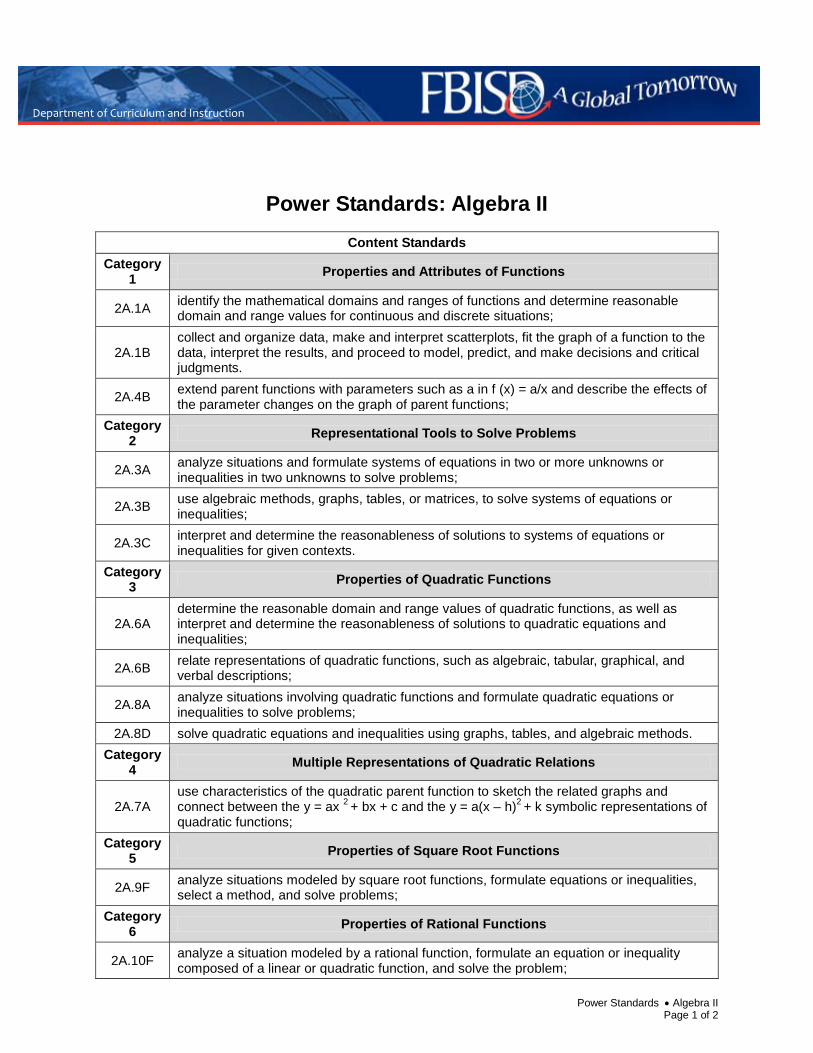
Power Standards: Algebra II Content Standards
Category 1 Properties and Attributes of Functions
2A.1A identify the mathematical domains and ranges of functions and determine reasonable domain and range values for continuous and discrete situations;
2A.1B collect and organize data, make and interpret scatterplots, fit the graph of a function to the data, interpret the results, and proceed to model, predict, and make decisions and critical judgments.
2A.4B extend parent functions with parameters such as a in f (x) = a/x and describe the effects of the parameter changes on the graph of parent functions;
Category 2 Representational Tools to Solve Problems
2A.3A analyze situations and formulate systems of equations in two or more unknowns or inequalities in two unknowns to solve problems;
2A.3B use algebraic methods, graphs, tables, or matrices, to solve systems of equations or inequalities;
2A.3C interpret and determine the reasonableness of solutions to systems of equations or inequalities for given contexts.
Category 3 Properties of Quadratic Functions
2A.6A determine the reasonable domain and range values of quadratic functions, as well as interpret and determine the reasonableness of solutions to quadratic equations and inequalities;
2A.6B relate representations of quadratic functions, such as algebraic, tabular, graphical, and verbal descriptions;
2A.8A analyze situations involving quadratic functions and formulate quadratic equations or inequalities to solve problems;
2A.8D solve quadratic equations and inequalities using graphs, tables, and algebraic methods. Category
4 Multiple Representations of Quadratic Relations
2A.7A use characteristics of the quadratic parent function to sketch the related graphs and connect between the y = ax 2 + bx + c and the y = a(x – h)2
Category 5
+ k symbolic representations of quadratic functions;
Properties of Square Root Functions
2A.9F analyze situations modeled by square root functions, formulate equations or inequalities, select a method, and solve problems;
Category 6 Properties of Rational Functions
2A.10F analyze a situation modeled by a rational function, formulate an equation or inequality composed of a linear or quadratic function, and solve the problem;

Power Standards • Algebra II Page 2 of 2
Department of Curriculum and Instruction
Category 7 Properties of Exponential and Logarithmic Functions
2A.11A develop the definition of logarithms by exploring and describing the relationship between exponential functions and their inverses;
2A.11F analyze a situation modeled by an exponential function, formulate an equation or inequality, and solve the problem.
Department of Curriculum and Instruction
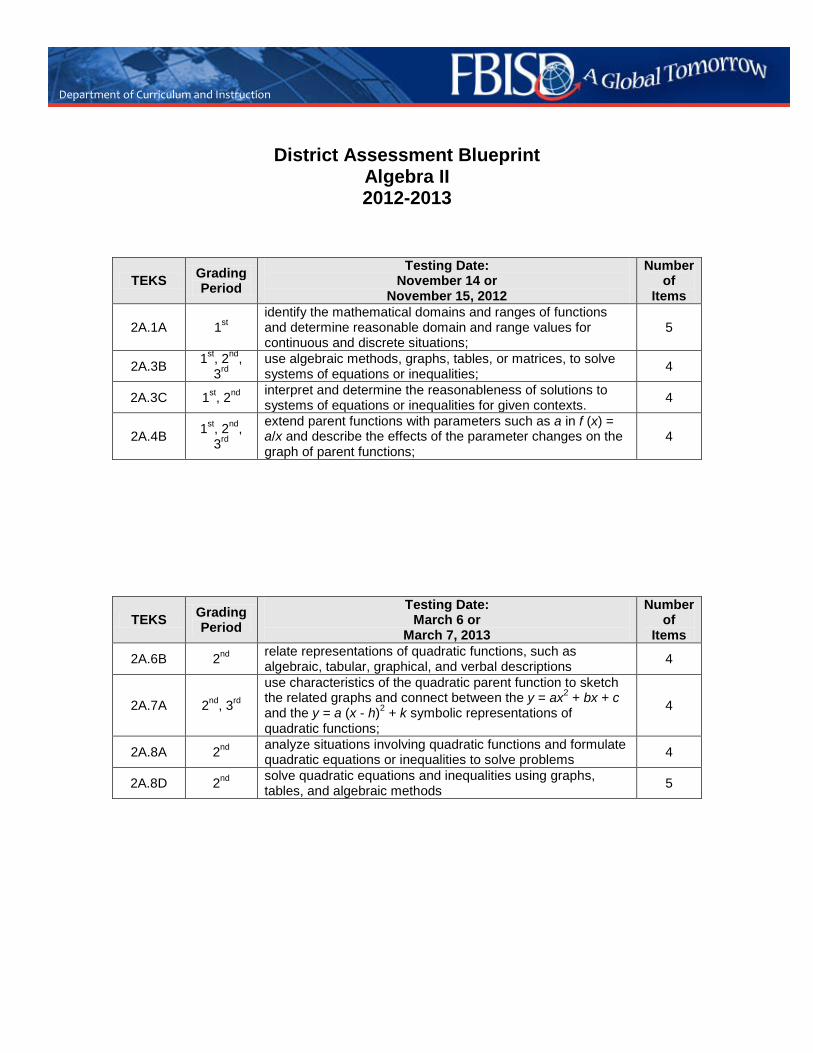
District Assessment Blueprint
Algebra II 2012-2013
TEKS Grading Period
Testing Date: November 14 or
November 15, 2012
Number of
Items
2A.1A 1st identify the mathematical domains and ranges of functions and determine reasonable domain and range values for continuous and discrete situations;
5
2A.3B 1st, 2nd, 3rd
use algebraic methods, graphs, tables, or matrices, to solve systems of equations or inequalities; 4
2A.3C 1st, 2nd interpret and determine the reasonableness of solutions to systems of equations or inequalities for given contexts. 4
2A.4B 1st, 2nd, 3rd
extend parent functions with parameters such as a in f (x) = a/x and describe the effects of the parameter changes on the graph of parent functions;
4
TEKS Grading Period
Testing Date: March 6 or
March 7, 2013
Number of
Items
2A.6B 2nd relate representations of quadratic functions, such as algebraic, tabular, graphical, and verbal descriptions 4
2A.7A 2nd, 3rd
use characteristics of the quadratic parent function to sketch the related graphs and connect between the y = ax2 + bx + c and the y = a (x - h)2 + k symbolic representations of quadratic functions;
4
2A.8A 2nd analyze situations involving quadratic functions and formulate quadratic equations or inequalities to solve problems 4
2A.8D 2nd solve quadratic equations and inequalities using graphs, tables, and algebraic methods 5

Algebra II Assessment
Eligible Texas EssentialKnowledge and Skills
Texas Education AgencyStudent Assessment Division
Fall 2010

STAAR Algebra II Assessment
Reporting Category 1:Properties and Attributes of Functions
The student will demonstrate an understanding of the foundational
properties and attributes of functions.
(2A.1) Foundations for functions. The student uses properties and attributes of
functions and applies functions to problem situations. The student is
expected to
(A) identify the mathematical domains and ranges of functions and
determine reasonable domain and range values for continuous and
discrete situations; and Readiness Standard
(B) collect and organize data, make and interpret scatterplots, fit the
graph of a function to the data, interpret the results, and proceed to
model, predict, and make decisions and critical judgments.
Readiness Standard
(2A.4) Algebra and geometry. The student connects algebraic and geometric
representations of functions. The student is expected to
(A) identify and sketch graphs of parent functions, including linear
(f (x) = x), quadratic (f (x) = x 2), exponential (f (x) = ax), and
logarithmic (f (x) = logax) functions, absolute value of x (f (x) = |x|),
square root of x (f (x) = x ), and reciprocal of x (f (x) = 1/x);
Supporting Standard
(B) extend parent functions with parameters such as a in f (x) = a/x and
describe the effects of the parameter changes on the graph of parent
functions; and Readiness Standard
(C) describe and analyze the relationship between a function and its
inverse. Supporting Standard
STAAR Algebra II Page 2 of 8
Texas Education AgencyStudent Assessment Division
Fall 2010
Reporting Category 2:Representational Tools to Solve Problems
The student will demonstrate an understanding of the use of
representational tools to solve problems.
(2A.2) Foundations for functions. The student understands the importance of
the skills required to manipulate symbols in order to solve problems and
uses the necessary algebraic skills required to simplify algebraic
expressions and solve equations and inequalities in problem situations.
The student is expected to
(A) use tools including factoring and properties of exponents to simplify
expressions and to transform and solve equations; and
Supporting Standard
(B) use complex numbers to describe the solutions of quadratic
equations. Supporting Standard
(2A.3) Foundations for functions. The student formulates systems of equations
and inequalities from problem situations, uses a variety of methods to
solve them, and analyzes the solutions in terms of the situations. The
student is expected to
(A) analyze situations and formulate systems of equations in two or
more unknowns or inequalities in two unknowns to solve problems;
Readiness Standard
(B) use algebraic methods, graphs, tables, or matrices, to solve systems
of equations or inequalities; and Readiness Standard
(C) interpret and determine the reasonableness of solutions to systems
of equations or inequalities for given contexts. Readiness Standard
STAAR Algebra II Page 3 of 8
Texas Education AgencyStudent Assessment Division
Fall 2010
Reporting Category 3:Properties of Quadratic Functions
The student will demonstrate an understanding of the properties of
quadratic functions.
(2A.6) Quadratic and square root functions. The student understands that
quadratic functions can be represented in different ways and translates
among their various representations. The student is expected to
(A) determine the reasonable domain and range values of quadratic
functions, as well as interpret and determine the reasonableness of
solutions to quadratic equations and inequalities;
Readiness Standard
(B) relate representations of quadratic functions, such as algebraic,
tabular, graphical, and verbal descriptions; and
Readiness Standard
(C) determine a quadratic function from its roots (real and complex) or a
graph. Supporting Standard
(2A.8) Quadratic and square root functions. The student formulates equations
and inequalities based on quadratic functions, uses a variety of methods to
solve them, and analyzes the solutions in terms of the situation. The
student is expected to
(A) analyze situations involving quadratic functions and formulate
quadratic equations or inequalities to solve problems;
Readiness Standard
(B) analyze and interpret the solutions of quadratic equations using
discriminants and solve quadratic equations using the quadratic
formula; Supporting Standard
(C) compare and translate between algebraic and graphical solutions of
quadratic equations; and Supporting Standard
(D) solve quadratic equations and inequalities using graphs, tables, and
algebraic methods. Readiness Standard
STAAR Algebra II Page 4 of 8
Texas Education AgencyStudent Assessment Division
Fall 2010
Reporting Category 4:Multiple Representations of Quadratic Relations
The student will demonstrate an understanding of the connections
between algebraic and geometric representations of quadratic functions
and relations.
(2A.5) Algebra and geometry. The student knows the relationship between the
geometric and algebraic descriptions of conic sections. The student is
expected to
(A) describe a conic section as the intersection of a plane and a cone;
Supporting Standard
(B) sketch graphs of conic sections to relate simple parameter changes
in the equation to corresponding changes in the graph;
Supporting Standard
(C) identify symmetries from graphs of conic sections;
Supporting Standard
(D) identify the conic section from a given equation; and
Supporting Standard
(E) use the method of completing the square. Supporting Standard
(2A.7) Quadratic and square root functions. The student interprets and
describes the effects of changes in the parameters of quadratic functions in
applied and mathematical situations. The student is expected to
(A) use characteristics of the quadratic parent function to sketch the
related graphs and connect between the y = ax 2 + bx + c and the
y = a(x – h)2 + k symbolic representations of quadratic functions;
and Readiness Standard
(B) use the parent function to investigate, describe, and predict the
effects of changes in a, h, and k on the graphs of y = a(x – h)2 + k
form of a function in applied and purely mathematical situations.
Supporting Standard
STAAR Algebra II Page 5 of 8
Texas Education AgencyStudent Assessment Division
Fall 2010
Reporting Category 5:Properties of Square Root Functions
The student will demonstrate an understanding of the properties of
square root functions.
(2A.9) Quadratic and square root functions. The student formulates equations
and inequalities based on square root functions, uses a variety of methods
to solve them, and analyzes the solutions in terms of the situation. The
student is expected to
(A) use the parent function to investigate, describe, and predict the
effects of parameter changes on the graphs of square root functions
and describe limitations on the domains and ranges;
Supporting Standard
(B) relate representations of square root functions, such as algebraic,
tabular, graphical, and verbal descriptions; Supporting Standard
(C) determine the reasonable domain and range values of square root
functions, as well as interpret and determine the reasonableness of
solutions to square root equations and inequalities;
Supporting Standard
(D) determine solutions of square root equations using graphs, tables,
and algebraic methods; Supporting Standard
(E) determine solutions of square root inequalities using graphs and
tables; Supporting Standard
(F) analyze situations modeled by square root functions, formulate
equations or inequalities, select a method, and solve problems; and
Readiness Standard
(G) connect inverses of square root functions with quadratic functions.
Supporting Standard
STAAR Algebra II Page 6 of 8
Texas Education AgencyStudent Assessment Division
Fall 2010
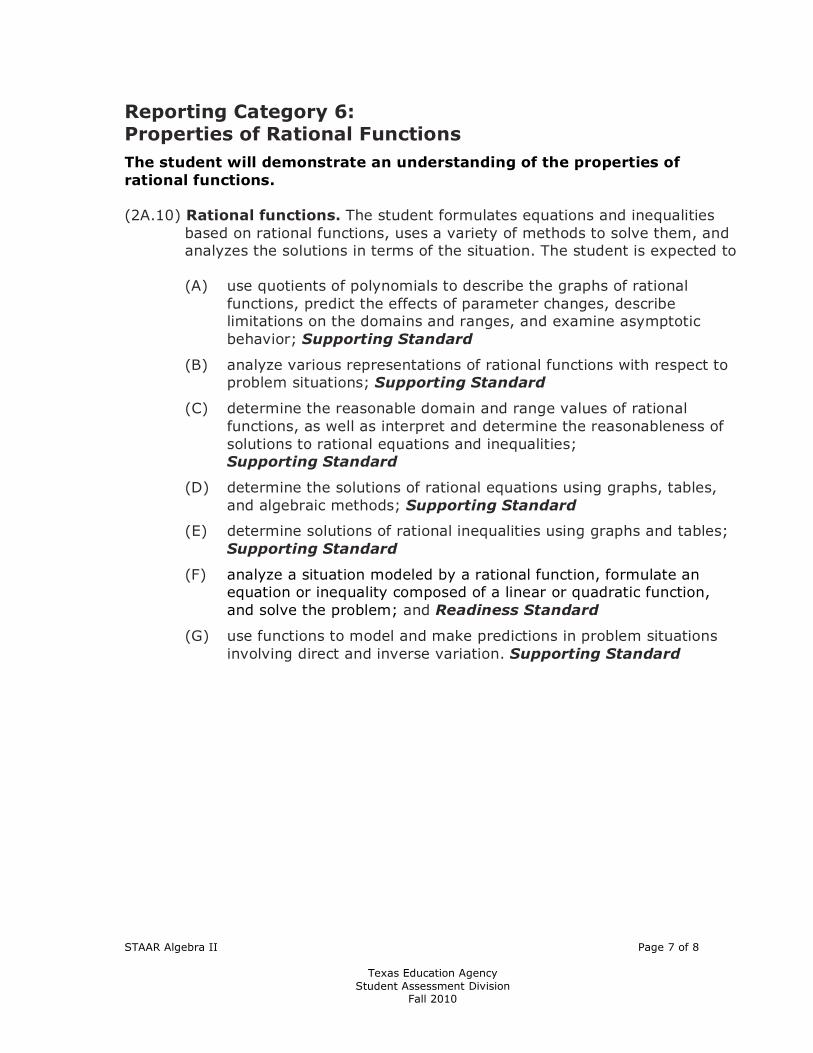
Reporting Category 6: Properties of Rational Functions
The student will demonstrate an understanding of the properties of
rational functions.
(2A.10) Rational functions. The student formulates equations and inequalities
based on rational functions, uses a variety of methods to solve them, and
analyzes the solutions in terms of the situation. The student is expected to
(A) use quotients of polynomials to describe the graphs of rational
functions, predict the effects of parameter changes, describe
limitations on the domains and ranges, and examine asymptotic
behavior; Supporting Standard
(B) analyze various representations of rational functions with respect to
problem situations; Supporting Standard
(C) determine the reasonable domain and range values of rational
functions, as well as interpret and determine the reasonableness of
solutions to rational equations and inequalities;
Supporting Standard
(D) determine the solutions of rational equations using graphs, tables,
and algebraic methods; Supporting Standard
(E) determine solutions of rational inequalities using graphs and tables;
Supporting Standard
(F) analyze a situation modeled by a rational function, formulate an
equation or inequality composed of a linear or quadratic function,
and solve the problem; and Readiness Standard
(G) use functions to model and make predictions in problem situations
involving direct and inverse variation. Supporting Standard
STAAR Algebra II Page 7 of 8
Texas Education AgencyStudent Assessment Division
Fall 2010

Reporting Category 7:Properties of Exponential and Logarithmic Functions
The student will demonstrate an understanding of the properties of
exponential and logarithmic functions.
(2A.11) Exponential and logarithmic functions. The student formulates
equations and inequalities based on exponential and logarithmic functions,
uses a variety of methods to solve them, and analyzes the solutions in
terms of the situation. The student is expected to
(A) develop the definition of logarithms by exploring and describing the
relationship between exponential functions and their inverses;
Readiness Standard
(B) use the parent functions to investigate, describe, and predict the
effects of parameter changes on the graphs of exponential and
logarithmic functions, describe limitations on the domains and
ranges, and examine asymptotic behavior; Supporting Standard
(C) determine the reasonable domain and range values of exponential
and logarithmic functions, as well as interpret and determine the
reasonableness of solutions to exponential and logarithmic equations
and inequalities; Supporting Standard
(D) determine solutions of exponential and logarithmic equations using
graphs, tables, and algebraic methods; Supporting Standard
(E) determine solutions of exponential and logarithmic inequalities using
graphs and tables; and Supporting Standard
(F) analyze a situation modeled by an exponential function, formulate an
equation or inequality, and solve the problem. Readiness Standard
STAAR Algebra II Page 8 of 8
Texas Education AgencyStudent Assessment Division
Fall 2010
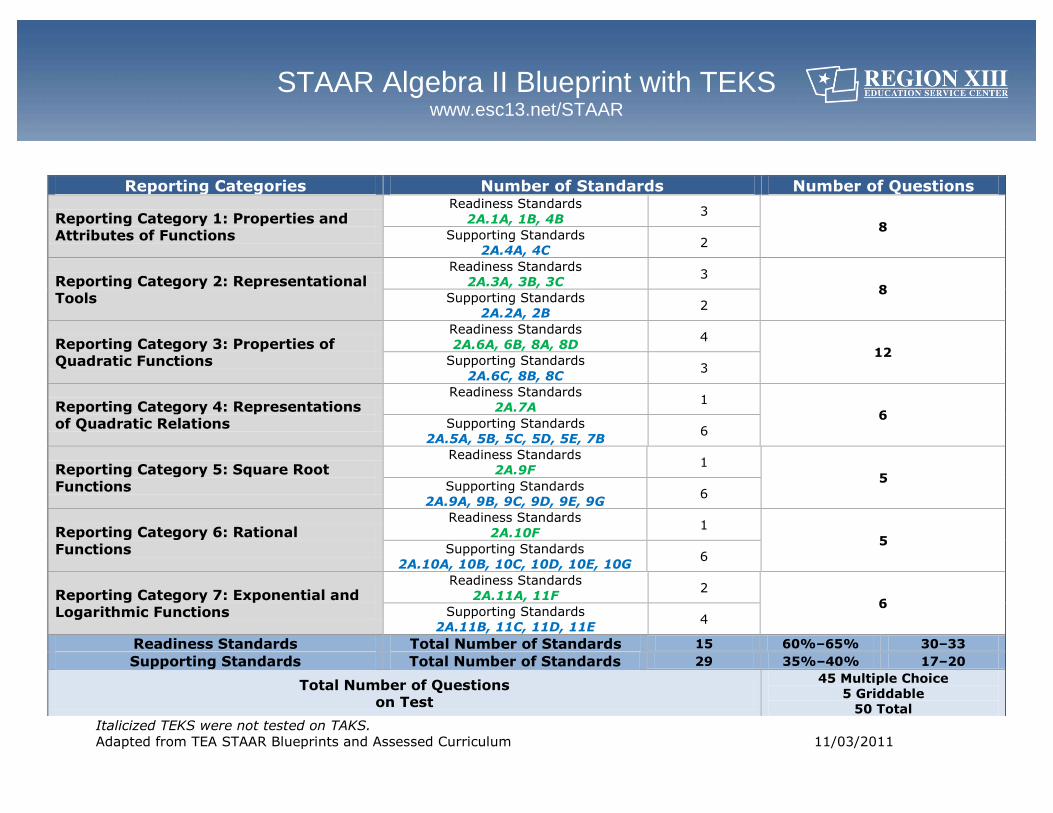
STAAR Algebra II Blueprint with TEKS www.esc13.net/STAAR
Italicized TEKS were not tested on TAKS.
Adapted from TEA STAAR Blueprints and Assessed Curriculum 11/03/2011
Reporting Categories Number of Standards Number of Questions
Reporting Category 1: Properties and Attributes of Functions
Readiness Standards
2A.1A, 1B, 4B 3
8 Supporting Standards
2A.4A, 4C 2
Reporting Category 2: Representational Tools
Readiness Standards
2A.3A, 3B, 3C 3
8 Supporting Standards
2A.2A, 2B 2
Reporting Category 3: Properties of Quadratic Functions
Readiness Standards
2A.6A, 6B, 8A, 8D 4
12 Supporting Standards
2A.6C, 8B, 8C 3
Reporting Category 4: Representations of Quadratic Relations
Readiness Standards
2A.7A 1
6 Supporting Standards
2A.5A, 5B, 5C, 5D, 5E, 7B 6
Reporting Category 5: Square Root
Functions
Readiness Standards
2A.9F 1
5 Supporting Standards
2A.9A, 9B, 9C, 9D, 9E, 9G 6
Reporting Category 6: Rational
Functions
Readiness Standards
2A.10F 1
5 Supporting Standards
2A.10A, 10B, 10C, 10D, 10E, 10G 6
Reporting Category 7: Exponential and Logarithmic Functions
Readiness Standards
2A.11A, 11F 2
6 Supporting Standards
2A.11B, 11C, 11D, 11E 4
Readiness Standards Total Number of Standards 15 60%–65% 30–33
Supporting Standards Total Number of Standards 29 35%–40% 17–20
Total Number of Questions on Test
45 Multiple Choice
5 Griddable
50 Total

State of Texas Assessments of
Academic Readiness
STAARTM
Algebra II2011 Released Test Questions
These released questions represent selected TEKS student expectations for each reporting category. These questions are samples only and do not represent all the student expectations eligible for assessment.
Copyright © 2011, Texas Education Agency. All rights reserved. Reproduction of all or portions of this work is prohibited without express written permission from the Texas Education Agency.

STAAR Algebra II 2011 ReleaseReleased Test Questions
Page 2
1
y
x
–5
–4
–3
–2
–1
2
3
4
5
−1 1−2−3−4−5 2 3 4 5
1
gf
The graph of the function g was obtained from the graph of the function f using a transformation as shown above. Based on the graph, which equation can be used to describe g(x) in terms of f(x)?
A g(x) І f(x) + 6
B g(x) І f(x + 6)
C g(x) І f(x) Ѝ 6
D g(x) І f(x Ѝ 6)

STAAR Algebra II 2011 ReleaseReleased Test Questions
Page 3
2 The graph of the function f is shown below.
−5
−4
−6
−7
−3
−2
−1
1
2
3
4
5
6
7
−1 1−2−3−4−5−6−7 2 3 4 5 6 7
y
x
Which grid shows the graph of f ˉẦ?
A
−5
−4
−6
−7
−3
−2
−1
1
2
3
4
5
6
7
−1 1−2−3−4−5−6−7 2 3 4 5 6 7
y
x
B
−5
−4
−6
−7
−3
−2
−1
1
2
3
4
5
6
7
−1 1−2−3−4−5−6−7 2 3 4 5 6 7
y
x
C
−5
−4
−6
−7
−3
−2
−1
1
2
3
4
5
6
7
−1 1−2−3−4−5−6−7 2 3 4 5 6 7
y
x
D
−5
−4
−6
−7
−3
−2
−1
1
2
3
4
5
6
7
−1 1−2−3−4−5−6−7 2 3 4 5 6 7
y
x
STAAR Algebra II 2011 ReleaseReleased Test Questions
Page 4
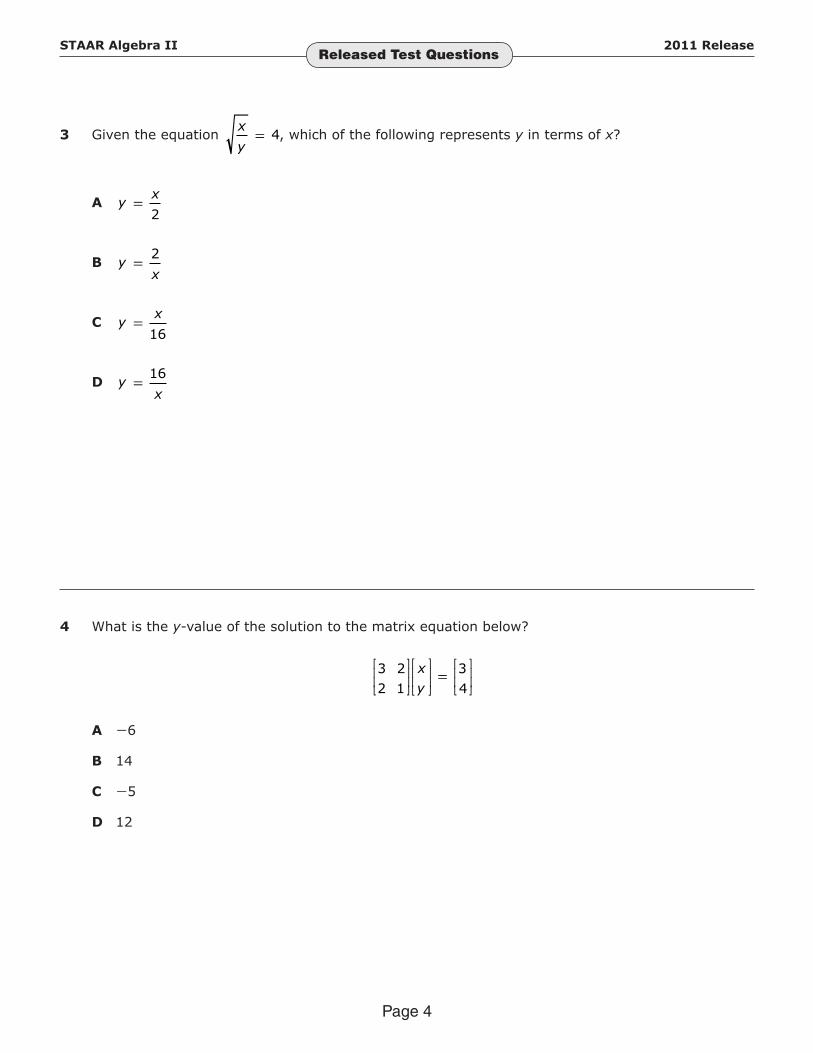
x3 Given the equation = 4, which of the following represents y in terms of x?y
A yx
=2
B yx
=2
C yx
=16
D yx
=16
4 What is the y-value of the solution to the matrix equation below?
3 22 1
34
=
xy
A Ѝ6
B 14
C Ѝ5
D 12
STAAR Algebra II 2011 ReleaseReleased Test Questions
Page 5
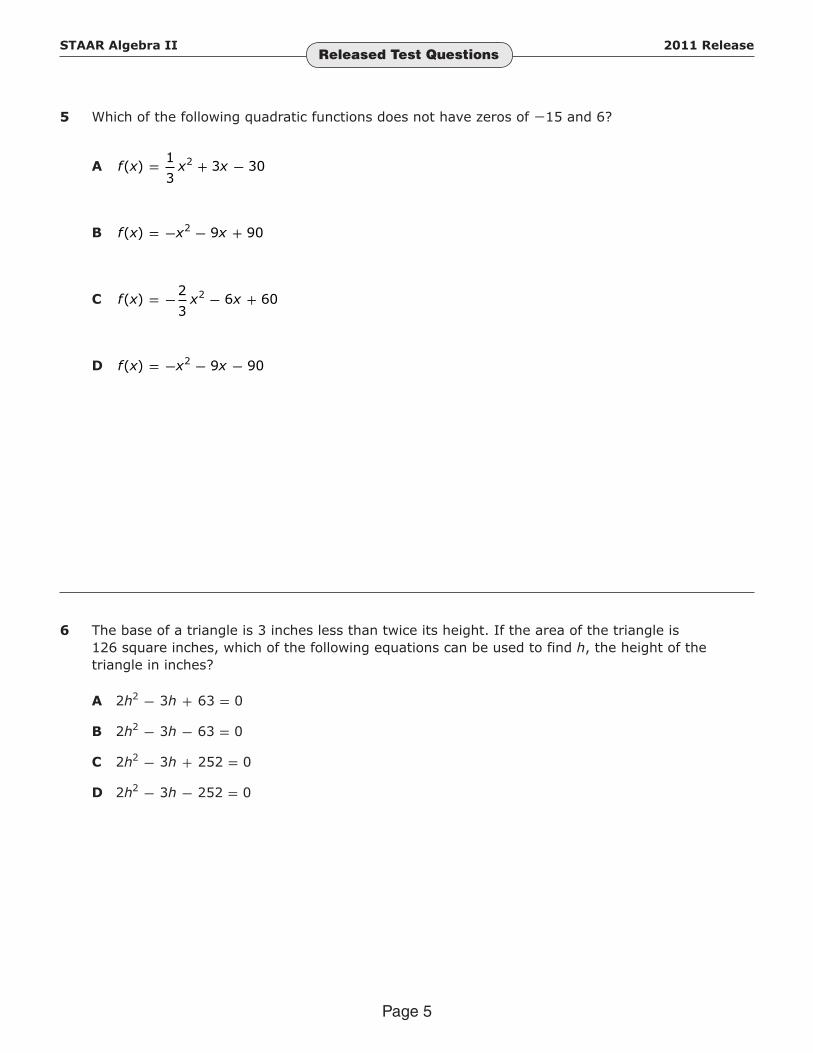
5 Which of the following quadratic functions does not have zeros of Ѝ15 and 6?
A f x x x( ) = + −1
33 302
B f x x x( ) = − − +2 9 90
C f x x x( ) = − − +2
36 602
D f x x x( ) = − − −2 9 90
6 The base of a triangle is 3 inches less than twice its height. If the area of the triangle is 126 square inches, which of the following equations can be used to find h, the height of the triangle in inches?
A 2hầ − 3h + 63 І 0
B 2hầ − 3h − 63 І 0
C 2hầ − 3h + 252 І 0
D 2hầ − 3h − 252 І 0
STAAR Algebra II 2011 ReleaseReleased Test Questions
Page 6
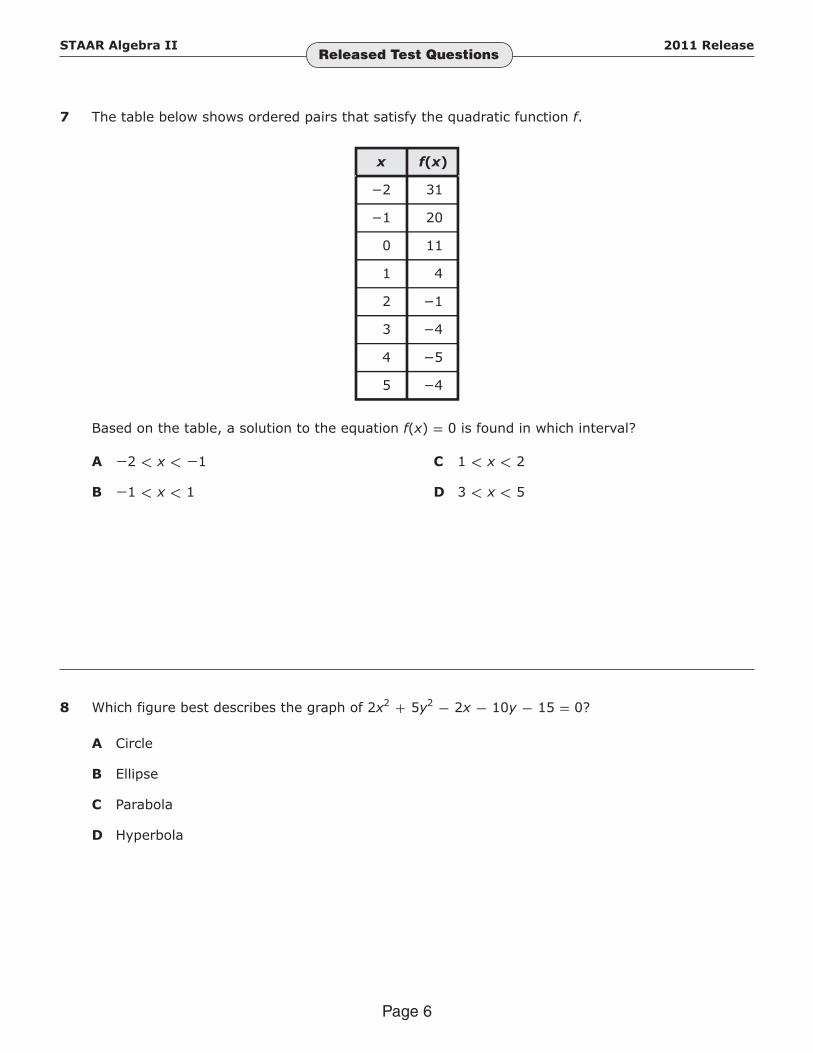
7 The table below shows ordered pairs that satisfy the quadratic function f.
x f(x)
−2
−1
0
1
2
3
4
5
31
20
11
4
−1
−4
−5
−4
Based on the table, a solution to the equation f(x) І 0 is found in which interval?
A Ѝ2 < x < Ѝ1
B Ѝ1 < x < 1
C 1 < x < 2
D 3 < x < 5
8 Which figure best describes the graph of 2xầ + 5yầ − 2x − 10y − 15 І 0?
A Circle
B Ellipse
C Parabola
D Hyperbola

STAAR Algebra II 2011 ReleaseReleased Test Questions
Page 7
9 The graph of the quadratic function f is shown on the grid below.
−5
−4
−6
−7
−3
−2
−1−1 1−2−3−4−5−6−7 2 3 4 5 6 7
y
x1
2
3
4
5
6
7
f
If the graph of f is translated 5 units to the right and 4 units down to create a new graph, which function best represents this new graph?
A g(x) І Ѝ(x + 3)ầ − 1
B g(x) І Ѝ(x − 3)ầ − 1
C g(x) І (3 − x)ầ + 1
D g(x) І (3 − x)ầ − 1
10 What value of p is a solution to the equation below?
8 1 3p − =
Record your answer and fill in the bubbles on your answer document.
STAAR Algebra II 2011 ReleaseReleased Test Questions
Page 8
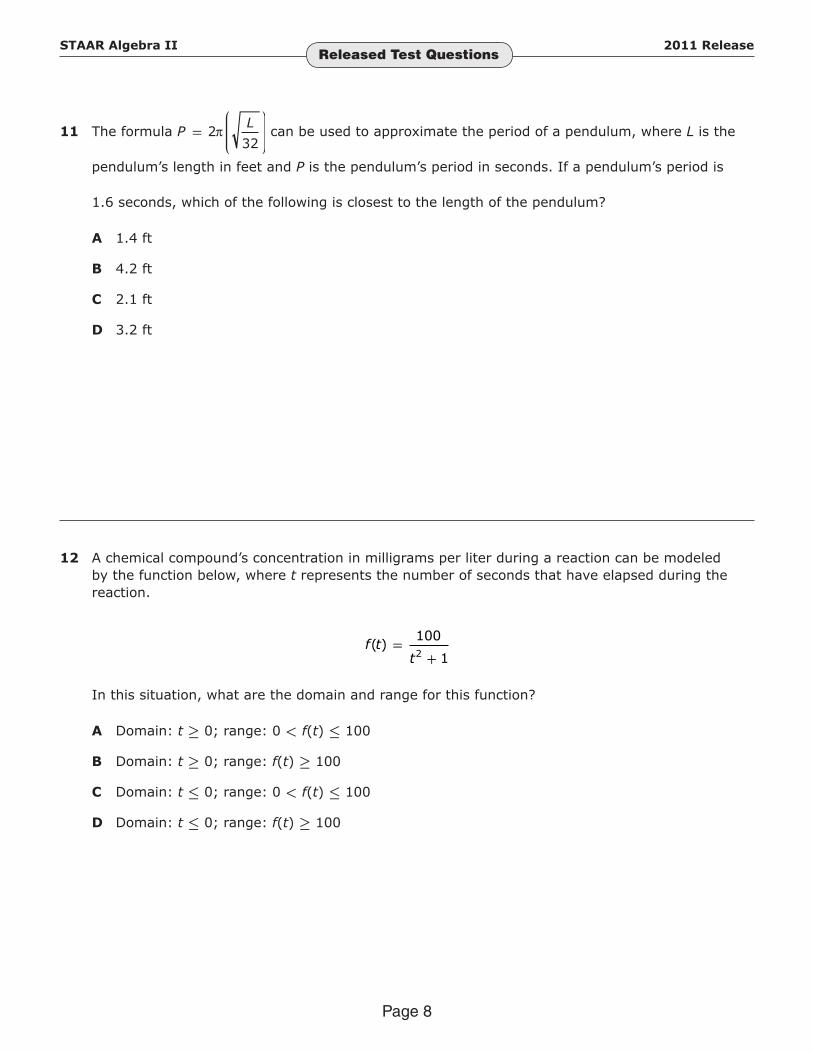
L11 The formula P = 2 can be used to approximate the period of a pendulum, where L is the 32
pendulum’s length in feet and P is the pendulum’s period in seconds. If a pendulum’s period is
1.6 seconds, which of the following is closest to the length of the pendulum?
A 1.4 ft
B 4.2 ft
C 2.1 ft
D 3.2 ft
12 A chemical compound’s concentration in milligrams per liter during a reaction can be modeled by the function below, where t represents the number of seconds that have elapsed during the reaction.
f tt
( ) =+
100
12
In this situation, what are the domain and range for this function?
A Domain: t ≥ 0; range: 0 < f(t) ≤ 100
B Domain: t ≥ 0; range: f(t) ≥ 100
C Domain: t ≤ 0; range: 0 < f(t) ≤ 100
D Domain: t ≤ 0; range: f(t) ≥ 100
STAAR Algebra II 2011 ReleaseReleased Test Questions
Page 9
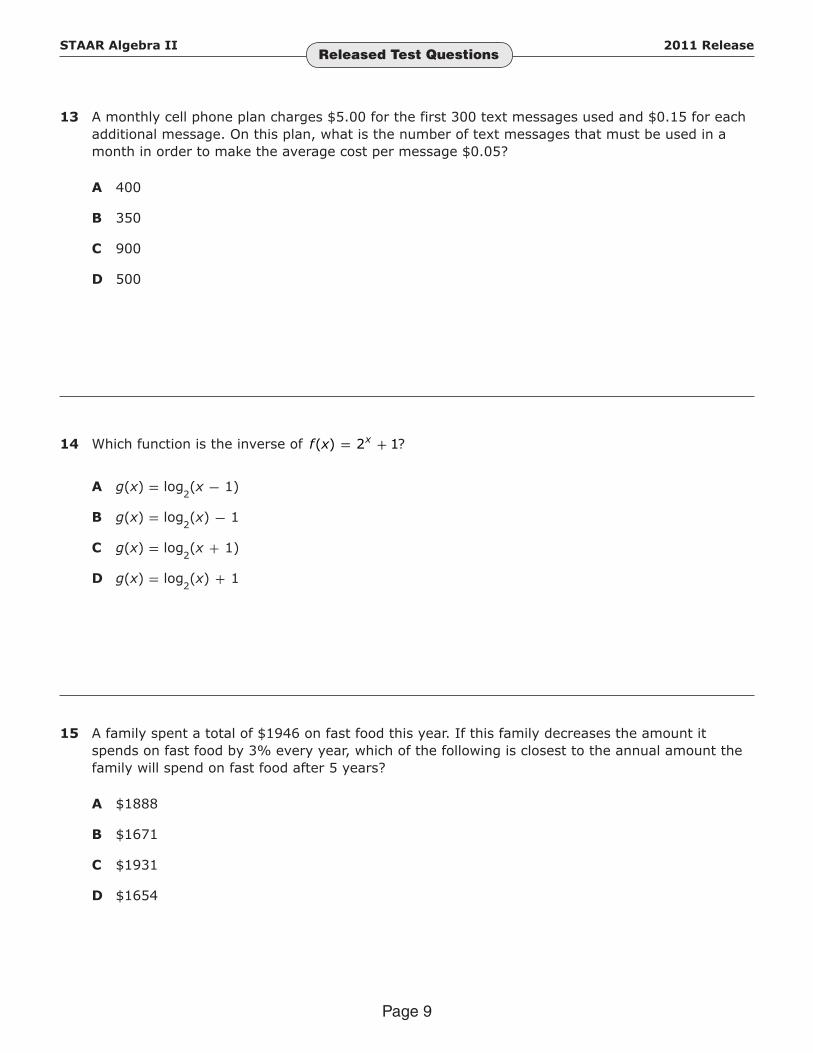
13 A monthly cell phone plan charges $5.00 for the first 300 text messages used and $0.15 for each additional message. On this plan, what is the number of text messages that must be used in a month in order to make the average cost per message $0.05?
A 400
B 350
C 900
D 500
14 Which function is the inverse of f(x) = 2x + 1?
A g(x) І logẂ(x − 1)
B g(x) І logẂ(x) − 1
C g(x) І logẂ(x + 1)
D g(x) І logẂ(x) + 1
15 A family spent a total of $1946 on fast food this year. If this family decreases the amount it spends on fast food by 3% every year, which of the following is closest to the annual amount the family will spend on fast food after 5 years?
A $1888
B $1671
C $1931
D $1654

STAAR Algebra II 2011 ReleaseAnswer Key
Item Number
Reporting Category
Readiness or Supporting
Content Student Expectation
Correct Answer
1 1 Readiness A.4(B) D
2 1 Supporting A.4(C) A
3 2 Supporting A.2(A) C
4 2 Readiness A.3(B) A
5 3 Supporting A.6(C) D
6 3 Readiness A.8(A) D
7 3 Readiness A.8(D) C
8 4 Supporting A.5(D) B
9 4 Supporting A.7(B) B
10 5 Supporting A.9(D) 0.25
11 5 Readiness A.9(F) C
12 6 Supporting A.10(C) A
13 6 Readiness A.10(F) A
14 7 Readiness A.11(A) A
15 7 Readiness A.11(F) B
For more information about the new STAAR assessments, go to www.tea.state.tx.us/student.assessment/staar/.
Page 10

STAAR ALGEBRA IIREFERENCE MATERIALS State of Texas
Assessments of Academic Readiness
STAARTM
GENERAL FORMULAS
Slope of a line my y
x x=
−
−2 1
2 1
Quadratic formula xb b ac
a=− −2 4
2
FACTORING
Difference of squares a b a b a b2 2− = − +( )(
Difference of cubes a b a b a ab b3 3 2− = − + +( )(
Sum of cubes a b a b a ab b3 3 2+ = + − +( )(
2)
2)
)
LOGARITHMS
Product log ( ) log logb b b
xy x= +
Quotient logb = −log log
b bx y
xy
Power log ( ) logb
rb
x r x=
y
CONIC SECTIONS
General form Ax Bxy Cy Dx Ey F2 2 0+ + + + + =
Circle ( ) ( )x h y k r− + − =2 2 2
Parabola ( ) ( )x h p y k− = −2 4 ( ) ( )y k p x h− = −2 4
Ellipse( ) ( )x h
a
y k
b
−+
−=
2
2
2
21
( ) ( )y k
a
x h
b
−+
−=
2
2
2
21
Hyperbola( ) ( )x h
a
y k
b
−−
−=
2
2
2
21
( ) ( )y k
a
x h
b
−−
−=
2
2
2
21
( )
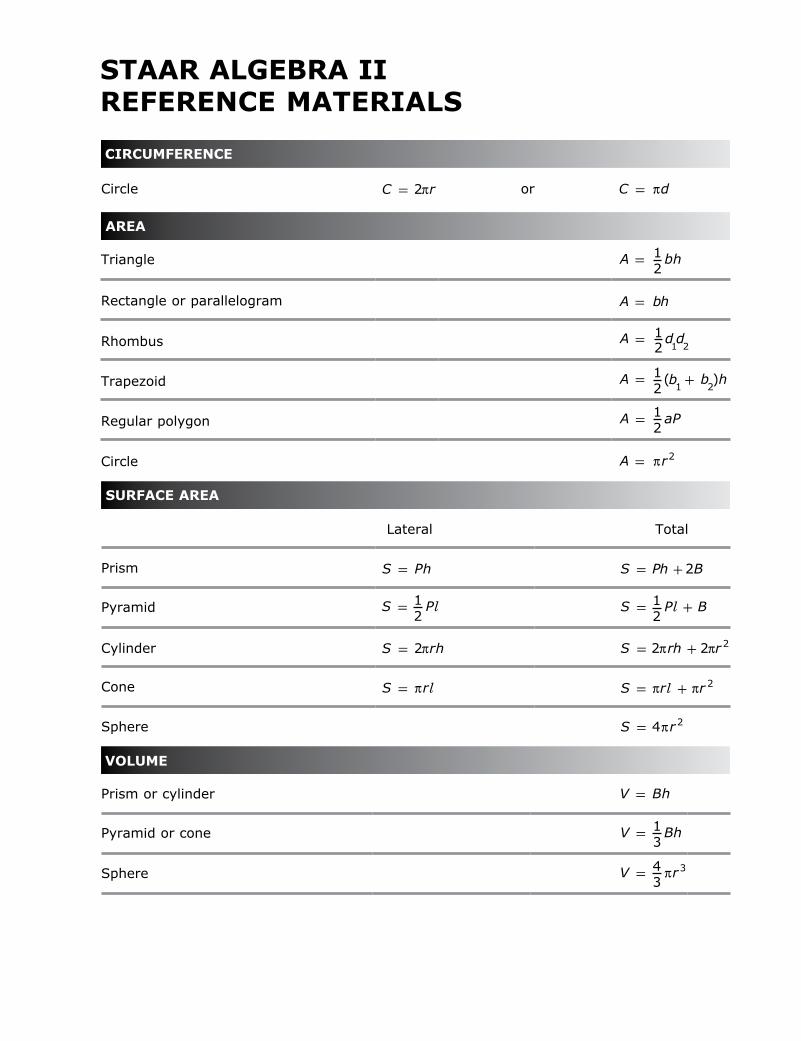
STAAR ALGEBRA IIREFERENCE MATERIALS
CIRCUMFERENCE
Circle orC r= 2π C d= π
AREA
A h= 12
bTriangle
A bh=Rectangle or parallelogram
A d d= 12 1 2Rhombus
A b+12 1
(b= h2Trapezoid
A aP= 12Regular polygon
A r= π 2Circle
SURFACE AREA
Latera Total
h S Ph B= +2Prism S P=
S P B= +l12
PlPyramid S = 12
S rh= +2 2πrhCylinder S = 2π
Cone S r= π l S r r= +π πl 2
Sphere S r= 4 2π
VOLUME
Prism or cylinder V Bh=
Pyramid or cone V Bh= 13
Sphere V r= 3π43
r2π
l
)
State of Texas Assessments of Academic Readiness (STAAR™) Performance Level Descriptors
Algebra II
Performance Level Descriptors
Students achieving Level III: Advanced Academic Performance can
• Interpret restrictions on the domain and range of a function (linear, quadratic, square root, rational, exponential, and logarithmic) and its inverse
• Evaluate the effectiveness of the various methods used to solve equations, inequalities, and systems of equations and/or inequalities
• Evaluate the strengths and weaknesses of each representation of a function
Students achieving Level II: Satisfactory Academic Performance can
• Determine the domain and range of a function (linear, quadratic, square root, rational, exponential, and logarithmic) and its inverse
• Determine and consider the reasonableness of numerical solutions to equations, inequalities, and systems of equations and/or inequalities using a variety of methods
• Formulate equations, inequalities, and systems of equations and/or inequalities to solve problems • Generate multiple representations of a function and use them to determine attributes of the function • Describe and use the relationship between an algebraic and geometric representation of a quadratic function or relation,
including conic sections • Analyze the effects of parameter changes on functional relationships (linear, quadratic, square root, rational,
exponential, and logarithmic) • Analyze situations modeled by linear, quadratic, square root, rational, exponential, and logarithmic functions
Students achieving Level I: Unsatisfactory Academic Performance can
• Determine the domain and range of a function (linear, quadratic, square root, rational, exponential, and logarithmic) represented by a table or a graph
• Find specific function values using algebraic and graphical methods • Generate a graph or a table of a function given in algebraic form • Describe the effects of parameter changes on linear, quadratic, and exponential functions
Texas Education Agency Student Assessment Division
April 2012