at the nexus of trade & investment - lse.ac.uk · at the nexus of trade & investment . the...
TRANSCRIPT

At the Nexus of Trade & Investment The EU-Japan Economic Partnership Agreement
Hosuk Lee-Makiyama ▪ July 2018

At the Nexus of Trade & Investment The EU-Japan Economic Partnership Agreement
2
This report was funded by the Government of Japan. The content of the report, including the opinions and conclusions, is independent of the Government of Japan and is that of the author alone. The research was commissioned via LSE Consulting, which was set up by the London School of Economics and Political Science to enable and facilitate the application of its academic expertise and intellectual resources. LSE Consulting LSE Enterprise Limited London School of Economics and Political Science Houghton Street London, WC2A 2AE
(T) +44 (0)20 7955 7128 (E) [email protected] (W) lse.ac.uk/consultancy

At the Nexus of Trade & Investment The EU-Japan Economic Partnership Agreement
3
Executive summary
The negotiations of the economic partnership agreement (EPA) between the European Union (EU) and Japan were finalised in December 2017 and are expected to swiftly come into force. Covering nearly one-third of global GDP, the EU-Japan EPA is one of the largest trade agreements ever completed.
In contrast to the other Asian economies, Japan was already open for foreign investors. However, the agreement cuts nearly all tariffs and creates a Euro-Pacific marketspace with common technical standards in key sectors, e.g. motor vehicles, life sciences, food products, clothing and ICT. Japan is also a regional hub for much of the trade, investments and regulatory developments in South-East Asia.
These cuts in trade costs for European business will further improve the return of investments in Japan, where the returns are already twice the average rate of European investments overseas. Also, economic theory and recent empirical studies on European firms support the link between trade liberalisation, which improves business environment and corporate profits, which in turn attract new foreign investments.
In addition, Abenomics has defeated core deflation, and the Japanese economy has already delivered its longest stretch of growth in 28 years. The size of the Japanese market is constantly undervalued: the size of private demand in Japan is $4.5 trillion (€3.6 trillion) making it the largest market in Asia- Moreover, Japan’s economy is growing at $850 (€691) per person.
These numbers raise an important question. European firms underinvest in Japan compared to their US competitors. In other words, Europe is disproportionately exposed to the macro-political and regulatory risks affecting rest of Asia and needs to diversify its investments.
The EU trade agreement is a step in that process, and across a number of metrics – investor openness, the rule of law, ease of doing business, product regulations, digital trade, corporate tax rates – Japan provides a more open and stable investor environment than its neighbours in the Far East.

At the Nexus of Trade & Investment The EU-Japan Economic Partnership Agreement
4
The report in numbers
Market potential
GDP growth (est.) of Japan, 2017: 1.8%
Consecutive quarters of Japanese GDP growth: 8 (by Q4, 2017)
GDP growth per year and capita: $850 (€691)
Final private consumption of Japan: $5.1 trillion (€4.2 tn)
Household consumption of Japan: $3.7 trillion (€3.0 tn)
Trade liberalisation
Average tariffs on imports from EU (weighted): 0.0% (after EPA)
GDP impact (est.) of Japan’s trade agreements (EU, TPP): 2.5%
Current size of foreign direct investment in Japan (% of GDP) 0.7%
Expected FDI increase from trade agreements (% of GDP) 0.6%
Investment climate
Gross domestic capital formation (% of Japanese GDP): 23%
Rate of return on EU direct investment in Japan: 6.6% —Equivalent average on investments outside of EU: 3.9%
Japan’s share of EU overseas investments (stock): 1.1% —Japan’s share of US overseas investments (stock): 1.7%
Statutory corporate income tax rate (2018) 23.2%
Market openness
Number of investor-state disputes involving Japan: 0
Number of foreign ownership restrictions: 0
Performance requirements on foreign investments: 0
Restrictiveness on foreign investments (0~1.00, 0 is least restrictive): 0.052 — OECD average: 0.067
Rule of law (0~1; 1 is least restrictive) 0.79 — East Asia & Pacific: 0.60
Score on Ease of doing business (0~100; 100 is least restrictive) 76 — East Asia & Pacific: 63
Economic freedom (0~100; 100 is least restrictive) 72 —Asia-Pacific average: 61
Product Market (sectoral) regulations (0~6; 0 is least restrictive): 1.41 — OECD average: 1.47

At the Nexus of Trade & Investment The EU-Japan Economic Partnership Agreement
5
Contents
Executive summary ............................................................................................ 3
The report in numbers ........................................................................................ 4
1. Why trade liberalisation matters for investments ........................................ 6
Europe–Japan: Open for business ..................................................................... 6 New linkages between trade and investments .................................................. 6
2. The impact of EU-Japan EPA on investments ............................................. 8
What the EU-Japan EPA entails .......................................................................... 8
Comparative perspectives on Japanese tariffs ................................................. 8 Investment creation through trade ...................................................................10
3. Growth and returns ................................................................................... 12
Dispelling the low-growth myth .........................................................................12
The paradox of missing FDIs in Japan .............................................................12 The overexposure towards macro-political risks in EU FDIs ...........................14
4. The investment climate ............................................................................ 16
The current baseline of restrictiveness ............................................................16
Stability of current openness ............................................................................16 Product and business regulations affecting returns .......................................18
Corporate taxation .............................................................................................20
5. Conclusions .............................................................................................. 21

At the Nexus of Trade & Investment The EU-Japan Economic Partnership Agreement
6
1. Why trade liberalisation matters for investments
Europe–Japan: Open for business
On December 8th, 2017, the negotiations of the economic partnership agreement (EPA) between the European Union (EU) and Japan were finalised. After nearly five years of negotiation, the agreement is now on track for swift ratification and entry into force.
Covering nearly one-third of global GDP, it is not just one of the largest trade agreements ever attempted. This new agreement is called an Economic Partnership Agreement – and it is called a partnership for a reason. The agreement is more than just a typical FTA and sets a new standard for market access and rules for non-discrimination in a time when the global investment climate is worsening.1
As pursuing globalisation and free trade is becoming more challenging, global foreign direct investments (FDI) also fell by minus 16% in 2017 by an estimated US$1.52 trillion, continuing the negative developments from the year before at minus US$1.81 trillion.2 However, the EPA sounds a clear political signal that Europe and Japan are open for business.
Attracting Japanese investments into Europe is a strategic imperative for the national economies of Europe. Unlike investments from emerging countries, investments from fully developed economies like Japan or the US comes with know-how that is often complementary to European R&D.
In the opposite direction, the Asia-Pacific is the most dynamic economic region of the new century for European businesses. Being able to invest and service the economic growth and increasing intra-regional trade in the Asia-Pacific region is instrumental for businesses when the European home market fails to deliver growth.
However, the openness of the Asian economies in the region varies between them considerably. Size of the domestic market and the degree of openness (and the stability of that openness) matter for investment decisions.
Some emerging markets display an impressive GDP growth – but if the growth happens on a relatively small market, it may not justify the market entry costs involved. Moreover, not all components of GDP growth are relevant to an investor or can be tapped into by a foreign entity due to market restrictions. This report provides comparative benchmarks on some select Asian markets.
New linkages between trade and investments
However, Japan is often characterised by low growth, high market entry costs and declining demographics. The same is said about Europe’s replacement rates or its economic recovery since the global financial crisis with continuing low capital formation.
1 World Bank Group, 2017|2018 Global Investment Competitiveness Report, Foreign Investor Perspectives and
Policy Implications, 2018 2 UNCTAD, Investment Trends Monitor, issue 28, January 2018
While global FDI fell by minus 16% in 2017, the EPA sounds a clear political signal that Europe and Japan are open for business

At the Nexus of Trade & Investment The EU-Japan Economic Partnership Agreement
7
For various types of overseas investors, trade agreements are often an event of low or lukewarm interest. Admittedly, OECD countries like the EU Member States and Japan are often sufficiently open with little or no foreign equity caps (FECs) as in the case of emerging countries that are still in the process of opening up their domestic markets.
Prior European-styled FTAs do not contain any investment provisions (due to internal competence issues). EU and UK firms already export over €58bn in goods and €28bn in services to Japan every year.3 Europe & UK’s investment stock in Japan already amounts to 98 billion Euro,4 on which it receives an annual net income of €9.8 billion (¥1.28 trillion).5 At 10% returns, it is already quite a handsome yield.
This report looks at how the EPA can generate investments – greenfield, FDI or M&A – activities despite those limitations. Since trade liberalisation improves on corporate profitability and returns by cutting tariffs or by achieving market-deep integration that reduces regulatory compliance costs arising from diverging product regulations, so-called non-tariff measures (NTMs).
The question whether trade liberalisation on goods and services actually lead to more investments: Both economies are already open. Comparison of key performance indicators shows this is the biggest market opening for Europe to date, and with the most diversified economy yet.
In addition, the EU-Japan EPA ties up two global hubs, each with its regional network of supply chains. To the West, there is the network built on preferential access to the European Single Market covering from the United Kingdom, via the Mediterranean basin, and to Ukraine; and in the East, it centres around Japan as the key founder of Comprehensive and Progressive Trans-Pacific Partnership (CPTPP) and with strong policy and investment ties with ASEAN (Association of South East Asian Nations).
Japan’s openness is clearly evident amongst Europe’s trade and investment partners in Asia when they are analysed using comparative benchmarks.
3 Eurostat, 2017 4 Eurostat, EU direct investment position (BPM6), 2015 (for comparison) 5 Ministry of Finance of Japan, Direct Investment Income, 2015CY (latest available year)
EU FDI stock in Japan already amounts to €98 billion, on which it receives an annual income of €9.8 billion.

At the Nexus of Trade & Investment The EU-Japan Economic Partnership Agreement
8
2. The impact of EU-Japan EPA on investments
What the EU-Japan EPA entails
As Japan was already open to European investor and maintained no relevant limitations on foreign investment, the EPA itself does not liberalise investments. Guarantees on investment protection are also typically dealt with in a separate investment treaty, which will accompany the EU-Japan EPA in due course.
Instead, the main benefits for European investors are not from ‘opening up’, but from lowered transaction costs and cost of operations on Asia’s largest consumer market.
The EU-Japan EPA substantially liberalises nearly all trade – not just “cheese for cars”, as it has been characterised in the press.6 Japan will eliminate customs duties on 97% of tariff lines on goods imported from the EU, whereof 90% are eliminated on the first day of entry into force. The remaining tariff lines are within agricultural products (such as pork, beef, wine, and many cheeses), are liberalised through tariff rate quotas (TRQs) or tariff reductions. In conclusion, the tariff savings will amount to €1 billion in customs duties per year based on current rate of trade.
Industrial (non-agricultural) tariffs on EU exports were on chemicals, plastics, cosmetics, textiles and clothing – including a de facto quota system on leather goods – areas all where the EU is highly competitive. The tariff cuts enable European affiliates in Japan to either increase their profit margins or adjust their prices to grow more competitive and expand their presence in the Japanese market.
On select products – for example on imported shoes – at least 30% of the import value can be reallocated into improving profit margins of a European producer or retailer. Even further margin increase – up to another 18% –7 could be achieved if the cost savings from harmonisation and trade facilitation is fully implemented.
In conclusion, even in an industry where gross profit margins are as high as 30~40%, the EPA creates a doubling of financial headroom for investment expansion.8
Comparative perspectives on Japanese tariffs
Although the EPA cuts applied tariffs that creates space or incentives for increased investments, it is important to bear in mind that the Japanese tariffs were already amongst the lowest in the industrialised world on industrial goods. Even prior to the EU-Japan EPA or CPTPP, Japan had 55% of its tariff lines at zero rates (figure 1), which is also the highest amongst the G20 economies.
6 Financial Times, EU and Japan finalise ‘cars for cheese’ trade deal, December 8th, 2017, accessed at:
https://www.ft.com/content/b48e4f3a-dc0e-11e7-a039-c64b1c09b482 7 Based on Copenhagen Economics 2009, estimating 37% in trade cost equivalents from NTMs where
approximately half of the cost was deemed actionable. 8 Author’s estimates; profit margins based on select Nikkei 225 stocks, Economist Intelligence Unit, 2003;
Ptojes, Thurik, 1993
Even in an industry where gross profit margins are as high as 30~40%, the EPA creates a doubling of financial headroom for investment expansion.

At the Nexus of Trade & Investment The EU-Japan Economic Partnership Agreement
9
Extensive duty-free trade already prior to the EU-Japan EPA
Figure 1. Percentage of zero-tariff lines
Source: UNCTAD TRAINS, 2017
The duty-free environment of Japan is further emphasised by the impact of EU-Japan EPA on European exports. The tariff cuts will drastically decrease the remaining tariffs tailored for European offensive interests as the weighted average (i.e. the duties Europe actually pays for its current trade) tariffs will be lowered from 3.3% to mere 0.01% (see figure 2).
Ambitious and comprehensive tariff cuts in the EU-Japan EPA
Figure 2. Weighted average on European exports to Japan (before and after EPA)
Source: Author’s calculations based on UNCTAD TRAINS (including agricultural TRQs),
European Commission
In short to medium term, closest next target market for Europe are Mercosur – which (at $2 trillion GDP) is half the size of Japan, with a considerably lower level of liberalisation; or a high-quality agreement with Australia, which stands at $1.2 trillion.9
Investments are not driven by improved fiscal conditions on imported goods. The Japanese regional network is not just supported by regional trade agreements (including
9 World Bank, WDI, 2016
55%
29%26%
0%
10%
20%
30%
40%
50%
60%
70%
80%
Japan East-Asia & Pacific World
3.33%
0.01%0.00%
1.00%
2.00%
3.00%
4.00%
Japan Pre-EPA Japan Post-EPA
The weighted average tariffs will be lowered from the current rate of 3.3% to mere 0.01%.

At the Nexus of Trade & Investment The EU-Japan Economic Partnership Agreement
10
CPTPP and FTA with ASEAN countries), but the investment is supported by its economic and geographic gravity, built through local investments, presence and partnerships in Asia. Historically speaking, Japan has traditionally functioned as the regional hub to many countries the countries in South-East Asia.
In addition, the EU-Japan EPA creates a high-end Euro-Pacific marketspace based on common technical standards and regulatory coherence that bars discriminatory regulations in a number of sector-specific areas, such as motor vehicles, life sciences, cosmetics, textiles and food products:
• Motor vehicles – the agreement aligns the EU and Japan to the UNECE safety and environmental standards through enhanced cooperation. European motor vehicles are henceforth subject to similar requirements in the EU and Japan, reducing double testing and certification. The agreement also allows new engine technologies, such as hydrogen-fuelled cars that are approved in the EU that can be exported to Japan without further modifications given they meet the requirements in the EPA.
• Life sciences – Through a number of unilateral reforms coinciding with the EU-Japan EPA, Japan and EU aligned the quality management systems (QMS) for medical devices, cutting the application times and costs for market approval. The previous system that hampered market introduction of EU pharmaceuticals, medical devices and cosmetics in Japan was also abolished on 1 January 2016.
• Textiles labelling – Japan and the EU have approximated their labelling systems, which previously required all garments to be relabelled before they go on sale in Japan.
• Financial services – disciplines on regulation and transparency of financial services, payment and clearing systems and specific rules curbing the market dominance of Japan Post.
• Government Procurement – the partnership provides further openness and enables participation in public tenders, including those of 48 core cities.
Investment creation through trade
Most provisions of traditional FTAs create investment opportunities at home, at production base, improving economies of scale from exportation. Intuitively, facilitating imports and exports incentivise cross-border transactions and should reduce the need for a local presence on overseas markets. Recent empirical studies have however shown that trade and investments are complementary – and the simple business case from the coming tariff cuts and trade costs shows how the improved profit margins can be used to establish new retail points, expand local support services or parts of the value-chain in the target market.
The developments since the conclusion of the EU-Korea FTA also supports the theory. To date, the EU-Korea FTA is the only agreement amongst EU’s current generation with ambitious regulatory chapters where sufficient time has passed to study the impact of FTAs on European outward FDI: But as it was an agreement that was negotiated before the investment competences were conferred to the EU institutions in the most recent EU treaty revisions, the Korea agreement is void of any investment provisions. Nonetheless, the
The EU-Japan EPA creates a high-end Euro-Pacific market-space based on common technical standards and regulatory coherence.

At the Nexus of Trade & Investment The EU-Japan Economic Partnership Agreement
11
investments (outward FDI flows) increased 55% while exports increased 20% –10 supporting the theory that removing trade barriers lead to a more investment-friendly environment.
In addition to previous FTAs, the EU-Japan EPA also contain investment promoting provisions such as the protection of trade secrets and minimum common rules on protection of regulatory test data for intellectual property; or movement of people for business purposes (‘mode 4’) covering intra-corporate transferees, both short and long-term visits for investors, service providers and independent professionals – even including their families.
The theory of trade driving investments is also supported by academic literature, which substantiates the argument that tariff reductions or providing regulatory certainty in FTAs promote investment flows.11 It has also been established using European firm-level data that FDI entry is almost always (in 90% of the cases) preceded by export entry into a foreign market. Thus, trade liberalisation leads to market entry, which in turn leads to FDIs since firm’s export experience in a foreign market has a positive effect on the probability that it starts investing in that market.12
Macroeconomic, political and legal uncertainties clearly affect the internationalisation strategy of investors – and these factors are the subjects of the remaining chapters of this report.
10 Eurostat, 2011 and 2015 (most recent data available) 11 Thangavelu, Findlay, The Impact of Free Trade Agreements on Foreign Direct Investment in the Asia-Pacific
Region', ERIA Research Project Report 2010-29, Jakarta: ERIA. pp.112-131. 12 Concosi, Sapir, Zanardi, The Internationalization Process of Firms: from Exports to FDI, ULB, December 2015

At the Nexus of Trade & Investment The EU-Japan Economic Partnership Agreement
12
3. Growth and returns
Dispelling the low-growth myth
Japan’s modest growth and deflation have been a permanent fixture in western business reporting for two decades, and the country has struggled to overcome long-standing deflation to the point that the ‘d-word’ is almost a part of its nation branding.
Its antidote was global economic recovery coinciding with the era of Abenomics – a policy package of monetary easing, fiscal craftsmanship and several separate strands of structural reform. Both Abenomics, and Japan’s ambitious intention to conclude two of the largest trade agreements ever attempted – with Europe and TPP – were met with scepticism on the opinion pages.
Much of Japan’s macroeconomic challenges are about expectations. The Economist noted in its appraisal of Abenomics that Japan is ‘not, by nature, a boastful country… and its economic pride has suffered many years of deflation, a form of macroeconomic self-deprecation, in which firms and workers continuously discount what they do’.13
Inarguably, boosting demand and deflationary mind-set is difficult to do. Nonetheless, Abenomics has succeeded way beyond past efforts to reboot the Japanese economy, and its initial critics (this author included) must admit Abenomics has defeated core deflation and boosted profits and dividends.
While the inflation may remain below the 2% target set for Bank of Japan, the overvaluation of the currency and undervaluation of its assets is corrected by and large. Although some long-term investors in Japan would argue that the currency appreciation is something of a luxury problem, Japanese yen has depreciated by 5 percent on widening interest differentials.
But most importantly, Japan’s GDP growth has picked up. At the time of writing, the most recent GDP numbers show eight quarters of consecutive growth, which the longest stretch of positive growth in Japan for 28 years, lifted by exports and full employment.14 Most projections see an improved outlook growth for Japan, e.g. IMF World Economic Outlook adjusting the real growth projections upwards for 2018 and 2019 by 0.5% and 0.1% respectively.
The paradox of missing FDIs in Japan
Increasing FDI into Japan is a part of the structural reforms. It is well established that the FDIs the host country benefits through increased competition, new know-how and linkages to overseas markets. Although Japan’s economy is driven by investments or capital formation – at 23% of GDP, it is above the level Eurozone or the US (both at 20%).
Despite investments being a major part of Japan’s economy, oversea capital has consistently played a marginal role. At just 0.7% of GDP, the levels of inward FDI are disproportionately low compared to other developed economies (figure 4).
13 The Economist, Three-piece dream suit, July 30th, 2016 14Cabinet Office, Quarterly Data October-December 2017, released February 14th, 2018
The longest stretch of positive growth in Japan for 28 years.
At the Nexus of Trade & Investment The EU-Japan Economic Partnership Agreement
13
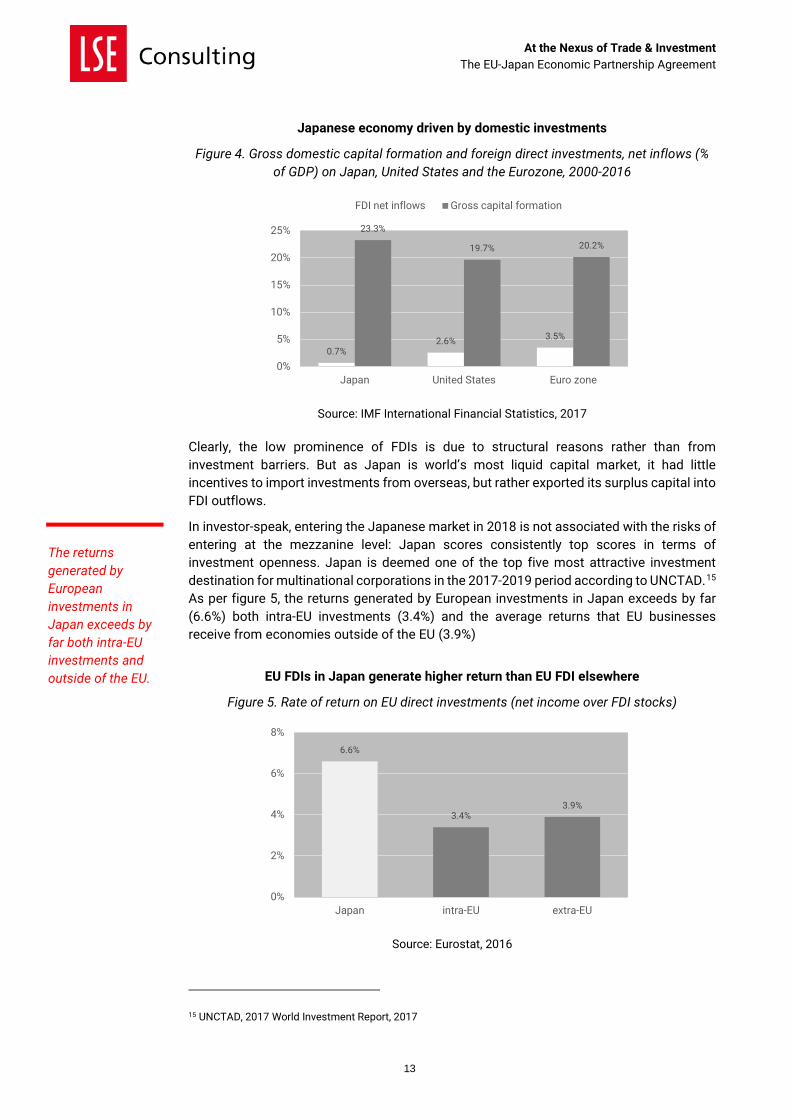
Japanese economy driven by domestic investments
Figure 4. Gross domestic capital formation and foreign direct investments, net inflows (% of GDP) on Japan, United States and the Eurozone, 2000-2016
Source: IMF International Financial Statistics, 2017
Clearly, the low prominence of FDIs is due to structural reasons rather than from investment barriers. But as Japan is world’s most liquid capital market, it had little incentives to import investments from overseas, but rather exported its surplus capital into FDI outflows.
In investor-speak, entering the Japanese market in 2018 is not associated with the risks of entering at the mezzanine level: Japan scores consistently top scores in terms of investment openness. Japan is deemed one of the top five most attractive investment destination for multinational corporations in the 2017-2019 period according to UNCTAD.15 As per figure 5, the returns generated by European investments in Japan exceeds by far (6.6%) both intra-EU investments (3.4%) and the average returns that EU businesses receive from economies outside of the EU (3.9%)
EU FDIs in Japan generate higher return than EU FDI elsewhere
Figure 5. Rate of return on EU direct investments (net income over FDI stocks)
Source: Eurostat, 2016
15 UNCTAD, 2017 World Investment Report, 2017
0.7%2.6% 3.5%
23.3%
19.7% 20.2%
0%
5%
10%
15%
20%
25%
Japan United States Euro zone
FDI net inflows Gross capital formation
6.6%
3.4%3.9%
0%
2%
4%
6%
8%
Japan intra-EU extra-EU
The returns generated by European investments in Japan exceeds by far both intra-EU investments and outside of the EU.

At the Nexus of Trade & Investment The EU-Japan Economic Partnership Agreement
14
In conclusion, Japan’s incentives for attracting FDIs are not for liquidity, but a more competitive and connected business environment. Neoclassical economists who studied Japan, such as Paul Krugman, have pointed to ‘the liquidity trap’,16 a condition in which the US and the EU found themselves after the global financial crisis. But the investment surplus laid the foundations to Japan graduating from an export-led economic model to an investment-driven one, which helped the country to come out on top with the changing paradigms of international trade – through global value-chains, emerging markets and digital trade – a transition which Europe is struggling to accomplish.
In many respects, Japan’s experience foretells what Europe itself must eventually do to deal with even worse demographics, stagnant demand and overleveraged public finances.
The overexposure towards macro-political risks in EU FDIs
Considering the unfettered access and relatively high rate return of investing in Japan is something that also becomes apparent once we compare the actual market size of the major economies in the Far East. Japan is the third largest markets in the world outside of the EU.
However, the composition of GDP is between them very different. Dynamic market economies like the US and Japan are dominated by consumption and capital formation – components that are actually accessible to a foreign investor, rather than trade surpluses, savings and government activities, that are less meaningful to foreign investors.
Similarly, emerging markets generate a substantial rate of GDP growth. The quality of that growth depends on whether it generated through new investments, or household and intermediate consumption by business.
Based on actual openness, Japan is the largest market in Asia
Figure 6. Market data on Japan
Japan
Market size
GDP (2016, constant $ exchange rates) $ 6.0 tn
—Final consumption (share of GDP) $ 4.5 tn (75.6%)
—Household consumption (share of GDP) $ 3.3 tn (55.8%)
Market growth
GDP growth per year $ 108 bn (1.8%)
GDP growth per capita $ 850/capita
Market exposure
Share of EU FDI outward stock 1.1%
Share of US FDI outward stock 2.2%
Source: World Bank, 2016; IMF WEO, 2018; Eurostat, 2016
16 Krugman, Japan’s trap, Princeton University, May 1998; also Monetary policy in a liquidity trap, New York
Times, April 11th, 2013
GDP components like trade surpluses, savings and government activities are less meaningful to foreign investors.

At the Nexus of Trade & Investment The EU-Japan Economic Partnership Agreement
15
According to data in figure 6, Japan is still Asia’s largest target market in terms of actual consumption by private businesses and individuals. Per capita growth (which in the end determines the spending power of consumers and businesses) is also the highest in the region.
Meanwhile, the quality of Japan’s GDP growth is set to improve even further in the coming period. The combined effect from EU-Japan EPA and CPTPP is projected to add 2.5% of real GDP, 17 which – adding to the existing GDP baseline up to 2019 – would more than double the GDP growth per capita.
However, the US FDI portfolio that places twice the weight to the Japanese market of the EU. As it unlikely the Japan market somehow benefits US investors, it begs the question: Are US businesses better suited for Japan and other sophisticated markets? Or is European outward FDI driven primarily by investors who deliberately choose to expand in less mature and less competitive economies?
If Europe is to maintain its position in the global value-chains, it is likely to readjust its FDI structure to a better balance between markets with high-end demand like Japan, and the emerging markets.
Conversely, Japanese investments overseas are overrepresented by the US, which accounts for 34% of all outward stocks, while only 23% is invested in the EU. The investment created by the EU-Japan EPA is in many regards a policy-induced normalisation of both Japanese and European investment patterns.
17 Analysis of Economic Impact of JAPAN-EU EPA and TPP 11,The Government Headquarters for the TPP, Japan、2017. Referenced in Japan Times, Government estimates new TPP and EU trade deals will boost
Japan’s GDP by ¥13 trillion, December 21, 2017
Japan can still claim to be Asia’s largest target market.

At the Nexus of Trade & Investment The EU-Japan Economic Partnership Agreement
16
4. The investment climate
The current baseline of restrictiveness
As explained in the previous section, the share of FDIs in the economy is not always a measurement on how open it is for foreign investments, but rather indicates the demand for capital. Foreign equity caps and other equity restrictions, investment screening and restrictions on key foreign personnel are imposed to control capital flows, preserving monopolies and state-owned enterprises (SOEs) or otherwise for the purpose of retaining control of market entry. As an alternative measurement of openness, the OECD measures the FDI regulatory restrictiveness in an index (figure 7).
One of the most economies to FDIs
Figure 7. FDI regulatory restrictiveness index, 2016
Source: OECD, 2016
Asian economies overall tend to be more FDI restrictive than the European economies who score around 0.004 (Luxembourg) to 0.106 (Austria). According to OECD data, Japan is the only Asian country to fall within the range of EU countries where there are no examples of expropriation, foreign equity caps being applied or use of performance requirements for foreign investors. Japan is also issuing guarantees that it will not do so in the future against European investors.18
Stability of current openness
While the OECD FDI restrictiveness index provides a quantified snapshot of the current situation, the increasing politicisation of FDIs and economic nationalism is likely to change the current degree of openness for investors in the world. And under periods of uncertainty,
18 EU-Japan EPA, chapter 8 section B
0.052
0.067
0
0.01
0.02
0.03
0.04
0.05
0.06
0.07
0.08
Japan OECD average
Asian economies overall tend to be more FDI restrictive than the European economies, with Japan being the only Asian country to fall within the EU range.
At the Nexus of Trade & Investment The EU-Japan Economic Partnership Agreement
17
legal stability matters for FDI flows, and surveys prove what all investors already know: Legal certainty have an impact on FDIs and internationalisation strategies.
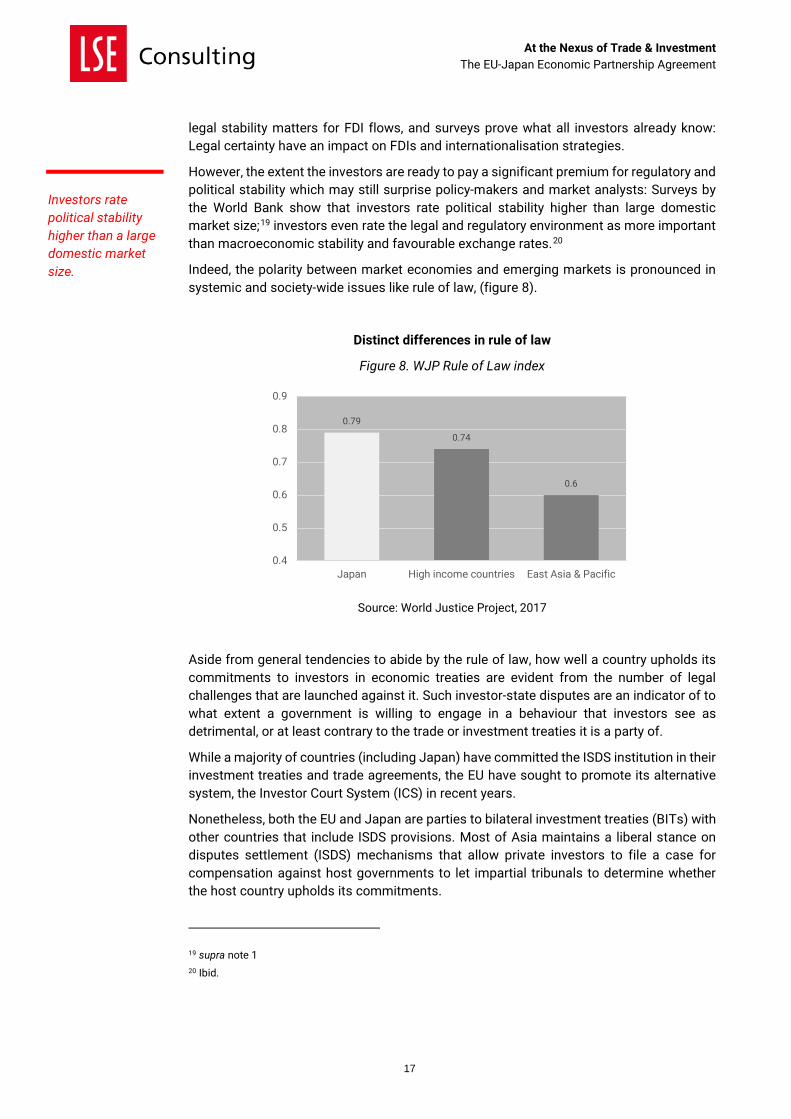
However, the extent the investors are ready to pay a significant premium for regulatory and political stability which may still surprise policy-makers and market analysts: Surveys by the World Bank show that investors rate political stability higher than large domestic market size;19 investors even rate the legal and regulatory environment as more important than macroeconomic stability and favourable exchange rates.20
Indeed, the polarity between market economies and emerging markets is pronounced in systemic and society-wide issues like rule of law, (figure 8).
Distinct differences in rule of law
Figure 8. WJP Rule of Law index
Source: World Justice Project, 2017
Aside from general tendencies to abide by the rule of law, how well a country upholds its commitments to investors in economic treaties are evident from the number of legal challenges that are launched against it. Such investor-state disputes are an indicator of to what extent a government is willing to engage in a behaviour that investors see as detrimental, or at least contrary to the trade or investment treaties it is a party of.
While a majority of countries (including Japan) have committed the ISDS institution in their investment treaties and trade agreements, the EU have sought to promote its alternative system, the Investor Court System (ICS) in recent years.
Nonetheless, both the EU and Japan are parties to bilateral investment treaties (BITs) with other countries that include ISDS provisions. Most of Asia maintains a liberal stance on disputes settlement (ISDS) mechanisms that allow private investors to file a case for compensation against host governments to let impartial tribunals to determine whether the host country upholds its commitments.
19 supra note 1 20 Ibid.
0.79
0.74
0.6
0.4
0.5
0.6
0.7
0.8
0.9
Japan High income countries East Asia & Pacific
Investors rate political stability higher than a large domestic market size.

At the Nexus of Trade & Investment The EU-Japan Economic Partnership Agreement
18
The forthcoming EU-Japan agreement has only a marginal impact on investment liberalisation, not least as Japan does not apply equity restrictions or cumbersome screening against each other. Also, EU FTAs have had very little impact on FDI restrictiveness – Korea notably lifted its only restrictions on wholly-owned telecom operators in its FTAs with the US and the EU;21 Peru’s investment regime did not change significantly due to the signing of the EU-Andean Community FTA in 2013.22 But perhaps more importantly, neither country saw their investment restrictiveness change for the worse since their FTAs with Europe.
After all, the stability depends on the discretionary powers that a government has at its disposal for state intervention, and trade agreements ensure investor freedoms and fair market rules: The EU-Japan EPA will contain best-to-date EU commitments on commercial presence (so-called mode 3, practically meaning foreign investments) for services providers,23 and disciplines against subsidies and state-owned enterprises.24 In addition, the EPA includes a chapter on antitrust and mergers that safeguards operational independence, non-discrimination and procedural effectiveness against private monopolies, unfair trade practices and M&As.25
Product and business regulations affecting returns
While an economy may be open and without any de facto barriers, the ease of doing business or sector regulations in an economy may vary considerably. Obviously, there are sound cases for government regulations of market activities to avoid various market failures, but these regulations can be designed to minimise compliance costs for businesses in various degrees – which in turn affect investment returns in that sector.
To begin, the cost or time required engaging in business activities incorporate aspects on regulatory efficiencies (for starting businesses, managing permits, labour freedom and price controls) affect investor returns across all businesses, domestic as well as foreign. Such procedural aspects of doing business have a bearing on the viability of start-ups as well as investment returns for multinationals.
Economic Freedom Index (figure 9a) measures a country’s regulatory efficiency (in addition to measure rule of law, government size and market openness), while World Bank’s Doing Business index (figure 9b) has become a benchmark for ease of starting a business and dealing with permits, registering property and setting up credits as well as enforcing rights of investors.
21 See inter alia Cooper, Manyin, Jurenas, Platzer, The Proposed US-South Korea Free Trade Agreement:
Provisions and Implications, Congressional Research Service, February 12th, 2010; OECD, FDI restrictiveness
index, 2016 22 OECD, 2014-2016 23 EU-Japan EPA, chapter 8 24 Ibid, chapter 12 and 13 25 Ibid, chapter 11
Trade agreements limit a sovereign’s ability to roll back on discrimination, expropriation and abuse.

At the Nexus of Trade & Investment The EU-Japan Economic Partnership Agreement
19
Major differences in investor and business freedom
Figure 9a. Economic Freedom Index
Source: Heritage/WSJ, 2018
Figure 9b. Ease of doing business scores
Source: World Bank, 2018
Aside from the general horizontal regulatory dimensions of business life, many products and industrial sectors are also heavily regulated. The regulatory efficiency of a specific sector and product regulations affect profitability even more than the efficiency of regulations that affect businesses in the early stages of their life cycles. Product specific regulations promote or inhibit competition through state interventions designed to favour certain producers, as well as through various legal and administrative barriers to start-ups or foreign entities.
OECD monitors the specific restrictiveness in product market regulations (PMRs) that follow the same patterns as the indices on the general business environment, with clear differences between OECD and non-OECD economies.
Major differences in quality of sector regulation and digital restrictions
Figure 10. Product Market Regulation (PMRs)
Source: OECD, 2013
72.3
61 61.1
50
60
70
80
Japan Asia-Pacific World
75.68
62.7
77.46
50
60
70
80
90
Japan East Asia &Pacific
OECD
1.41 1.47
2.12
0
0.5
1
1.5
2
2.5
Japan OECD non-OECD

At the Nexus of Trade & Investment The EU-Japan Economic Partnership Agreement
20
These annexes and joint bodies created by the EPA are designed to sustain the current level of coherence and openness to minimise internationalisation costs on very specific sectoral interests of either party.
Trade agreements limit how Japan and the EU can impose technical barriers to trade through horizontal disciplines that keep regulations non-discriminatory and transparent. But in addition, the EU-Japan EPA also sets up a joint-regulatory body between the regulators for informal cooperation and information exchange against unnecessary regulatory divergences to arise in the future.
Moreover, the EU-Japan EPA also include sector-specific annexes that are aimed at not just keeping regulations non-discriminatory, but also converge different standards and regulatory procedures to keep compliance cost down. On motor vehicles, life sciences, cosmetics, textiles, food products and financial regulation, the EU-Japan EPA does not just forestall future trade barriers but also create some rudimental coherence between the signatories on existing regulations.
The EU-Japan EPA also contains a chapter on e-commerce. But in addition, the EU and Japan are preparing mutual and reciprocal adequacy decision parallel to the EPA which will authorise businesses to transfer personal information of customers and employees to respective jurisdiction without any prior authorisation or user consent. The adequacy decisions will allow multinationals to operate one IT system globally for the entire organisation, thereby avoiding multiplication of overhead costs for IT.
As Japan is already one of the least restrictive economies in the world according to ECIPE digital trade restrictiveness index, and the fact that the EU only allow free flow of personal information to a few limited jurisdictions (such as Canada, Argentina, Israel and New Zealand) but none the major ICT economies, this has a considerable bearing on the productivity of traditional businesses and innovativeness of the digital economy for future applications within AI, connected industries and 5G development.
Corporate taxation
Corporate income taxation is rarely the topmost reason why businesses invest in or move to a certain location. There is a myriad of reasons why a corporation might decide to invest in a country, such as proximity to markets, growth potential, a need for infrastructure or services, subsidies, political risks, competition for talent, tariffs on inputs.
Across a number of surveys, low corporate taxes rarely make it into the top 10 lists of reasons why investors choose a certain location. While the opposite – i.e. overly aggressive treatment by tax authorities – is a reason why certain investment location is avoided.26
Obviously, corporate income taxes have a direct and palpable impact on corporate remittances. However, the Asian tax rates have seen a number of consecutive cuts, while the contributions from corporate taxes – i.e. the tax base – has actually expanded despite the cuts. The statutory corporate income tax rates in the region are naturally converged amongst the Asian economies around 20-30%, with Japan at the lower end of the scale with a central rate at 23.2% since 2018.
26 Lee-Makiyama, Ferracane, Geopolitics of Taxation, ECIPE, 2017
EU and Japan will authorise businesses to transfer personal information of customers and employees to respective jurisdiction without any prior authorisation or user consent.

At the Nexus of Trade & Investment The EU-Japan Economic Partnership Agreement
21
5. Conclusions
Against the backdrop of rising protectionism and unilateralism, the EU-Japan EPA is a signal that Europe and Japan will continue for openness. While attracting Japanese investments into Europe and the UK is a matter of growth and jobs, the FDIs into Japan is about continued structural reforms – the third arrow of Abenomics.
Economic theory, supported by empiric data, suggest that trade agreements can generate investments by improving corporate profitability, business climate and reducing uncertainties – and this is the biggest and the most diversified economy that opens up to European business since the Uruguay Round that established the WTO in the mid-1990s.
The current structure of EU outward FDI shows how it is subject to the macro-political risks and the volatility of emerging markets. Especially compared to the investment patterns of the US competitors, Europe invest less in Japan compared to emerging markets. Diversifying towards investments in markets with high-quality demand is essential to maintain Europe’s competitiveness in the coming business cycle.
The EU investments in Japan are already generating twice the return rate of EU FDIs on other markets. The EPA achieves, common technical standards in sectors like motor vehicles, life sciences, cosmetics, textiles and food products with the potential of doubling profit margins, a headroom which could be used for investments and further market expansion.
On Japan’s side, the liberalisation of EU-Japan EPA and TPP could double the GDP growth per capita in absolute terms – further increasing the attractiveness of Japan as an investment market.

LSE Consulting
LSE Enterprise Limited
London School of Economics and Political Science
Houghton Street
London, WC2A 2AE
(T) +44 (0)20 7955 7128
(W) lse.ac.uk/consultancy