ata research - teachers research 2017 a ... 72 roadmap to survey ... ata associate coordinator of...
TRANSCRIPT

ATA Research2017
www.teachers.ab.ca
A National Study of the Impact of Electronic Communication on Canadian School Leaders
Canadian Association of P r i n c i p a l s
association canadienne des directeurs d'école

© Copyright 2017ISBN 978-1-927074-48-0Unauthorized use or duplication without prior approval is strictly prohibited.Alberta Teachers’ Association11010 142 Street NW, Edmonton AB T5N 2R1Telephone 780-447-9400 or 1-800-232-7208www.teachers.ab.ca
Further information about the Association’s research is available from Lindsay Yakimyshyn at the Alberta Teachers’ Association; e-mail [email protected].

André Lanctôt, PhD candidate, and Linda Duxbury, PhD
A National Study of the Impact of Electronic Communication on
Canadian School Leaders

Contents
Preface ................................................................................................................................. 4It’s Urgent, But Is It Important? Principals and E-mail Overload ................................ 6 Study Objectives ......................................................................................................... 7 Theoretical Framework ............................................................................................. 8 Roadmap to the Report .............................................................................................. 9Methodology .................................................................................................................... 11 Stage 1: Act Nomination .......................................................................................... 11 Stage 2: Act Prototypicality ..................................................................................... 12 Stage 3: Validation and Evaluation ......................................................................... 12Sample Demographics .................................................................................................... 18
CAP Sample .............................................................................................................. 18 Summary ................................................................................................................... 22Work Demands ................................................................................................................ 23 Objective Indicators of Work Demand .................................................................. 23 Subjective Indicators of Work Demand ................................................................. 25 Role Ambiguity ........................................................................................................ 26 Role Conflict ............................................................................................................. 27 Summary: Work Demands of Respondents .......................................................... 28Control over Work ........................................................................................................... 29 Work Control ............................................................................................................ 29 Decision Latitude ..................................................................................................... 30 Skill Discretion ......................................................................................................... 31 Decision Authority .................................................................................................. 32 Summary: Control over Work ................................................................................ 32Electronic Communication............................................................................................ 33 Work Demands Associated with E-mail Use: Objective Data ............................ 34 Hours per Week Using E-mail ................................................................................ 34 Number of E-mails Sent and Received Each Week............................................... 35
Work Demands Associated with E-mail Use: Subjective Data ........................... 35 Proportion of Electronic Communication Classified as
“Urgent” Versus “Important” ................................................................................. 39 E-mail Overload ....................................................................................................... 41 Summary—Key Findings With Respect to E-mail Use ....................................... 42Key Outcomes .................................................................................................................. 43 Job Stress ................................................................................................................... 44 Perceived Stress ........................................................................................................ 45 Intent to Turnover .................................................................................................... 46 Absenteeism .............................................................................................................. 47 Summary—Outcomes ............................................................................................. 49Key Findings: Predictors and Outcomes ...................................................................... 50 Relationships Between E-mail Use and E-mail Overload:
Objective Measures .................................................................................................. 50 Relationships Between E-mail Use and E-mail Overload:
Subjective Measures ................................................................................................. 52 Prediction of Key Outcomes ................................................................................... 53Effective Management of Work-Related Electronic Communications ..................... 57 Workplace Changes ................................................................................................. 57 Personal Changes ..................................................................................................... 59 Summary ................................................................................................................... 60Conclusions and Recommendations ............................................................................. 61 Principals’ E-mail Use ............................................................................................. 61 E-mail Overload ....................................................................................................... 62 Relationship Between E-mail Use and Well-Being .............................................. 63 Recommendations ................................................................................................... 64Epilogue ............................................................................................................................ 65References ......................................................................................................................... 69Appendix A: Survey ........................................................................................................ 72 Roadmap to Survey .................................................................................................. 72 Survey ........................................................................................................................ 73

A National Study of Electronic Communication on Canadian School Leaders | 2017
4
Preface
This study represents the first instalment of a two-part study examining critical influences shaping the work lives of school leaders across Canada. The impetus for this work was The Future of the Principalship in Canada: A National Study (Alberta Teachers’ Association 2014b), which revealed that, while the principalship is rewarding with high levels of job satisfaction, growing complexities and expectations make this an increasingly challenging career.
To better understand the changing nature of the work of Canada’s school leaders, a two-phased research initiative was undertaken. The first phase was a study led by researchers from Carleton University on the effects of changing technology and electronic communications on the work life of Canadian school leaders. This phase of the research included a survey of Canadian principals conducted in spring 2016. For the second phase, researchers conducted another survey. The second survey focused on a variety of factors shaping the work of school leaders, such as the growing complexity and diversity of student populations, the impact of accountability regimes, the need to support teachers’ professional learning, and the marketization and commercialization of education.
This report, A National Study of the Impact of Electronic Communication on Canadian School Leaders, addresses the findings of the first survey. It represents the culmination of the work of André Lanctôt and Linda Duxbury, both of Carleton University. Publication of this study is part of a collaborative effort between the Canadian Association of Principals (CAP) and the Alberta Teachers’ Association (ATA). Former CAP president Tina Estabrooks was instrumental in designing and advancing the research project and facilitated the administration of both surveys. J-C Couture, ATA associate coordinator of research, coordinated the overall project and Lindsay Yakimyshyn, ATA administrative officer, led the final production of the research report.

ALBERTA TEACHERS’ ASSOCIATION
5
The study of the Canadian principals’ e-mail use uncovers a strong link between time spent on e-mail and e-mail overload. Principals spend 17 hours per week dedicated to e-mail, which is troubling. Furthermore, e-mail overload is an indicator of the health of an organization, since it is strongly associated with role overload and job stress. Given these findings, the researchers argue that it is important that organizations determine how best to help employees deal with the overload precipitated by electronic communication tools such as e-mail and address the organizational culture that tethers school leaders to tasks that do not enhance their capacity to do their work.
E-mail overload is symptomatic of broader international trends related to the ubiquity of electronic communication tools in the workplace. Therefore, we can look across other sectors and countries to consider appropriate policies, support and enforcement to optimize the use of these tools.
We encourage readers to consider the implications of this important study and to support the efforts of the research team and our organizations to advocate for optimal working conditions for school leaders across Canada.
Gordon R Thomas Maxine Geller Executive Secretary President Alberta Teachers’ Association Canadian Association of Principals
A National Study of Electronic Communication on Canadian School Leaders | 2017
6
Employees today can access their personal and work e-mails any time anywhere, and evidence suggests that many employees do just this. The following data from the Radicati Group suggest that e-mail use is “staggering” and the ability to connect pervasive:
• “In 2015, the number of e-mails sent and received per day total over 205 billion. This figure is expected to grow at an average annual rate of 3% over the next four years, reaching over 246 billion by the end of 2019” (Radicati Group 2015, 3).
• “The average corporate worker spends a quarter of his/her work day on various e-mail-related tasks. In comparison, the time spent in personal meetings accounts for about 14% of the typical day at the office, and phone conversations occupy only 9% of the typical workday” (Radicati Group 2009, 4).
Since 2012, the mobile e-mail market has continued to expand as consumer and business users are accessing their e-mail accounts from their mobile devices. In 2012, there were 730 million worldwide mobile e-mail users (Radicati Group 2012). While this expansion of the wireless market is expected to increase worker productivity, it has also reduced response time for decision makers (Radicati Group 2009).
Why has e-mail become the pervasive form of communication at work? A survey conducted by Purcell and Rainie (2014) that included employed Internet users found that most of these employees feel that e-mail is “very important” for doing their job—more important, in fact, than other forms of communication used in the workplace such as landline telephones, cellphones and social media sites. Taylor, Fieldman and Altman (2008, 159) have a different view and note “it seems that the move to this new era of communication is driven more by the immediate, practical advantages and the availability of the technology, rather than a rational assessment of its advantages and disadvantages.”
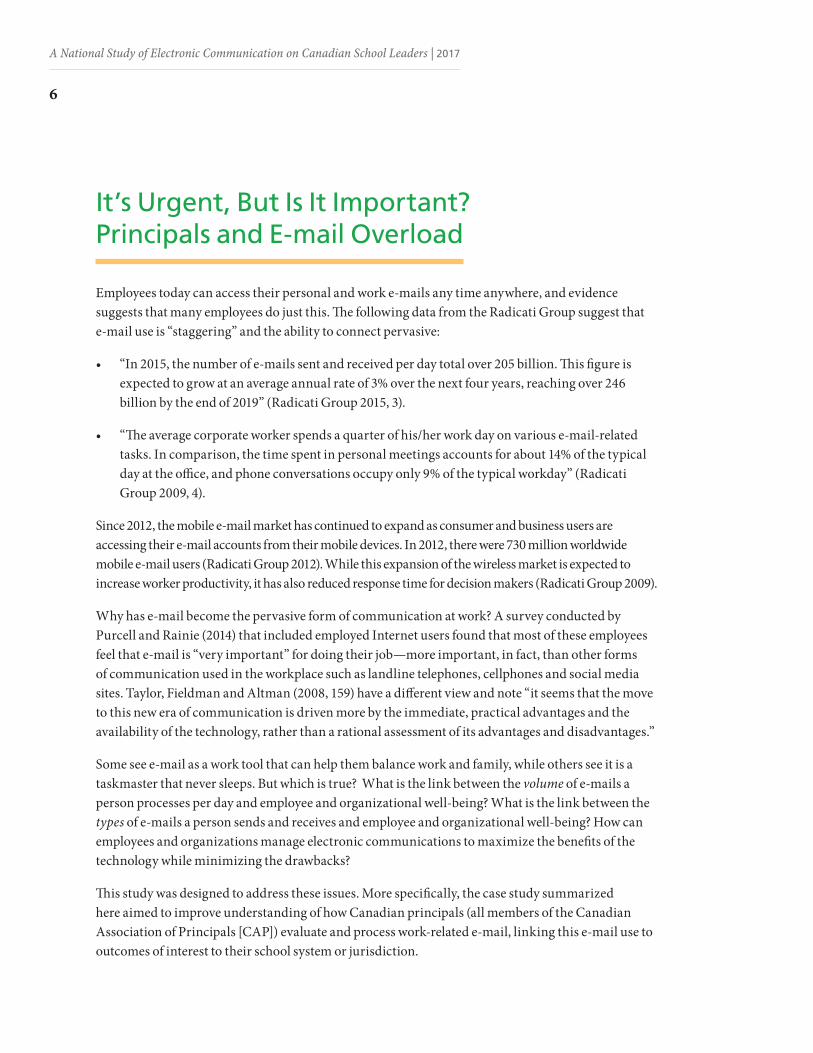
Some see e-mail as a work tool that can help them balance work and family, while others see it is a taskmaster that never sleeps. But which is true? What is the link between the volume of e-mails a person processes per day and employee and organizational well-being? What is the link between the types of e-mails a person sends and receives and employee and organizational well-being? How can employees and organizations manage electronic communications to maximize the benefits of the technology while minimizing the drawbacks?
This study was designed to address these issues. More specifically, the case study summarized here aimed to improve understanding of how Canadian principals (all members of the Canadian Association of Principals [CAP]) evaluate and process work-related e-mail, linking this e-mail use to outcomes of interest to their school system or jurisdiction.
It’s Urgent, But Is It Important? Principals and E-mail Overload
ALBERTA TEACHERS’ ASSOCIATION
7
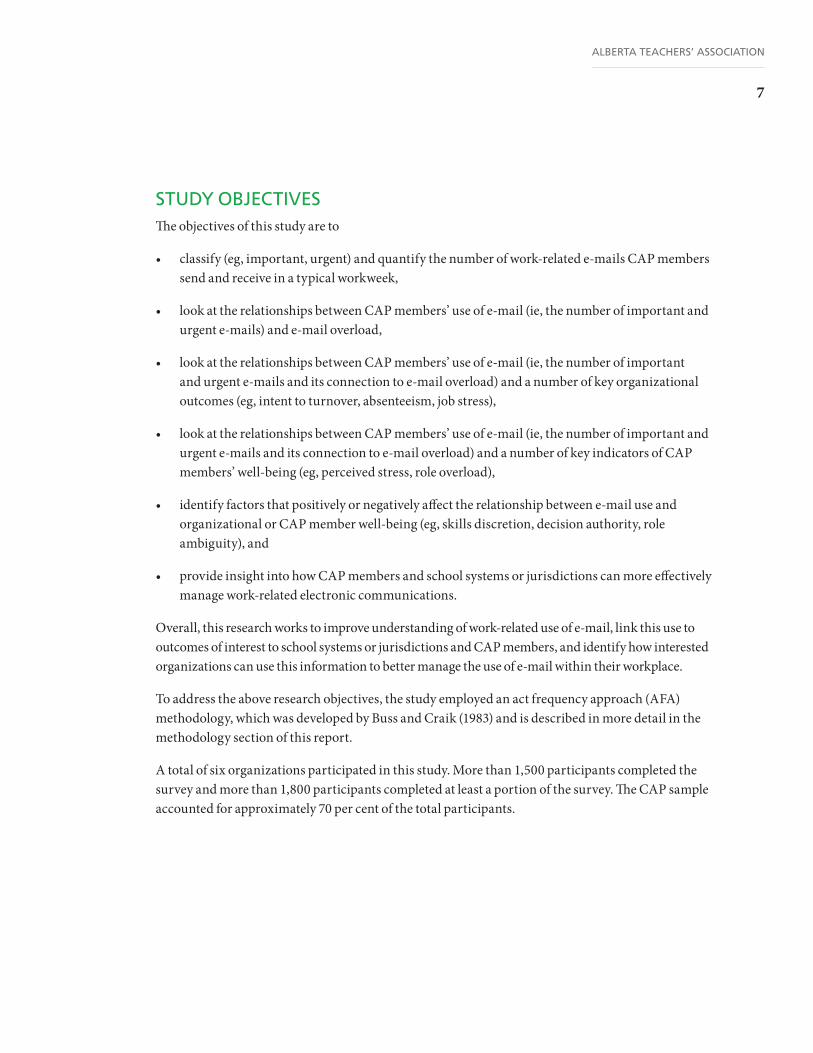
STUDY OBJECTIVES The objectives of this study are to
• classify (eg, important, urgent) and quantify the number of work-related e-mails CAP members send and receive in a typical workweek,
• look at the relationships between CAP members’ use of e-mail (ie, the number of important and urgent e-mails) and e-mail overload,
• look at the relationships between CAP members’ use of e-mail (ie, the number of important and urgent e-mails and its connection to e-mail overload) and a number of key organizational outcomes (eg, intent to turnover, absenteeism, job stress),
• look at the relationships between CAP members’ use of e-mail (ie, the number of important and urgent e-mails and its connection to e-mail overload) and a number of key indicators of CAP members’ well-being (eg, perceived stress, role overload),
• identify factors that positively or negatively affect the relationship between e-mail use and organizational or CAP member well-being (eg, skills discretion, decision authority, role ambiguity), and
• provide insight into how CAP members and school systems or jurisdictions can more effectively manage work-related electronic communications.
Overall, this research works to improve understanding of work-related use of e-mail, link this use to outcomes of interest to school systems or jurisdictions and CAP members, and identify how interested organizations can use this information to better manage the use of e-mail within their workplace.
To address the above research objectives, the study employed an act frequency approach (AFA) methodology, which was developed by Buss and Craik (1983) and is described in more detail in the methodology section of this report.
A total of six organizations participated in this study. More than 1,500 participants completed the survey and more than 1,800 participants completed at least a portion of the survey. The CAP sample accounted for approximately 70 per cent of the total participants.

A National Study of Electronic Communication on Canadian School Leaders | 2017
8
THEORETICAL FRAMEWORK
Karasek’s (1979) demand and control model of occupational stress (see Figure 1) provides the theoretical underpinnings for this study.
In Karasek’s model, workplace stress is a function of how demanding a person’s job is and how much control (eg, discretion, authority, decision latitude) the person has over their work responsibilities. According to Karasek, employees will experience job stress when the demands they face at work (eg, task difficulty, responsibility) exceed the amount of control they perceive they have over their work (eg, knowledge, authority, experience).
As shown in Figure 1, Karasek’s model uses work demands and perceptions of control at work to define four types of jobs, each of which is expected to be associated with different levels of job stress. Crossing the dimensions of strain and latitude, the four stress categories for jobs are as follows:
• High Strain Jobs: Employees in these types of jobs have low levels of control over work and high job demands. This combination is associated with high levels of stress.
• Active Jobs: Employees in these types of jobs have high levels of control over work and high job demands. This combination is associated with lower levels of stress.
• Passive Jobs: Employees in these types of jobs have low levels of control over work and low job demands. This combination is associated with low levels of stress.
• Low Strain Jobs: Employees in these types of jobs have high levels of control over work and low job demands. This combination is associated with the lowest levels of stress.
Figure 1: Karasek’s job strain model
Source: Adapted from Karasek and Theorell (1990)
Psychological demands
High
Job
Cont
rol Low Strain
Passive
Active
High Strain
High
Low
Low

ALBERTA TEACHERS’ ASSOCIATION
9
To better understand the extent to which e-mails impose work-related demands, such as role overload and e-mail overload, on Canadian principals, this study classifies e-mail communications as “important” and “urgent” and then links these demands to a number of indicators of strain. Also included in this study are several measures of control over work that enable investigation of the relationship between e-mail use and perceptions of control over work, as well as the extent to which perceptions of control over work buffer the relationship between demands and stress (as predicted by Karasek’s model). The ensuing analysis should, therefore, provide insight into which types of e-mail use are the most demanding, which contribute to higher levels of strain, and how organizations and principals can better manage the phenomena of increasing e-mail use.
ROADMAP TO THE REPORTThis report focuses on the study results as they relate to the CAP sample, comparing this group of respondents with the overall sample. Appendix A of this report includes a roadmap to the survey and the survey questions themselves.
This report is divided into the following nine sections:
Methodology: Included in this section is an outline of the methodology used in this study, a set of definitions of the key constructs, a description of how all constructs were operationalized within the study, and an overview of how the survey data were analyzed.
Sample demographics: This section provides an overview of who responded to the survey.
Work demands: This section reviews data that describe the work demands (eg, hours worked, role ambiguity, role conflict) of the principals who participated in the survey.
Control over work: This section reviews data that speak to perceptions of control over work (eg, work control, skill discretion, decision authority) for the principals who participated in the survey.
Electronic communication: This section begins by summarizing data analysis relating to e-mail use (ie, time spent processing e-mails, frequency of e-mails). It then categorizes this use into two groups, important electronic communications and urgent electronic communications, based on the measure developed using the AFA. Drawing from the CAP sample’s self-reports, this section also notes the proportion of important and/or urgent electronic communication received in a typical day by the participating principals and data on principals’ levels of e-mail overload.
Key outcomes: School systems or jurisdictions will only be motivated to address issues associated with the use of e-mail within their organization if this use has a measurable impact. Therefore, the survey addressed a number of measures of key organizational outcomes (eg, job stress, absenteeism) and principals’ mental health outcomes (eg, perceived stress). Key findings from the analysis of these data

A National Study of Electronic Communication on Canadian School Leaders | 2017
10
are provided in the section on outcomes. This section also includes analysis linking the study’s various measures of e-mail use (important versus urgent, volume, e-mail overload) to each of these outcomes.
Key findings: Predictors and outcomes: This section of the report is divided into two parts. The first part explores the relationship between e-mail overload and the objective and subjective indicators of e-mail use. The second part employs linear regression to determine the key predictors of e-mail overload, role overload, job stress, perceived stress and absenteeism.
Effective management of e-mail: This section summarizes key findings from the interviews conducted with employees that relate to how employees and employers can more effectively manage work-related electronic communications. The CAP sample did not participate in this portion of the study.
Conclusions and recommendations: The report concludes with a brief review of the report. It focuses on the key findings and implications to make recommendations on how school systems or jurisdictions can employ the study’s results to more effectively manage e-mail use in their organization.

ALBERTA TEACHERS’ ASSOCIATION
11
The study employed the act frequency approach (AFA), developed by Buss and Craik (1983), to create a tool to identify how employees evaluate the importance and the urgency of work-related electronic communications they send and receive. The AFA involves three distinct stages: (1) act nomination, (2) act prototypicality and (3) validation of the measure. Below is a detailed description of each of these stages and how they were employed in this study.
STAGE 1: ACT NOMINATIONIn the act nomination stage, respondents were asked to provide a list of characteristics, acts or behaviours that they felt best described an important or urgent electronic communication. The intent of this stage was to create an exhaustive list of the “acts” that characterize the domain of interest (ie, important and urgent e-mail).
The act nomination stage was completed in the study by conducting 30- to 45-minute interviews with 28 employees (managers, professionals and administrative staff) in two organizations (a public organization and a private firm). The questions asked to help create our exhaustive list of “acts” were
• What factors do you consider when deciding whether or not an e-mail/instant message (IM) that you have received (or are going to send) is an important e-mail/IM? In other words, what factors would cause you to think that an e-mail/IM is significant or of consequence? How do you typically respond to an e-mail/IM you consider to be important?
• What factors do you consider when deciding whether or not an e-mail/IM that you have received (are going to send) is an urgent e-mail/IM? In other words, what factors would cause you to think that it is critical that you deal with a particular e-mail/IM immediately? How do you typically respond to an e-mail/IM you consider to be urgent?
The responses regarding e-mail and IM questions are reported together in this report, as the responses focusing on e-mail were virtually identical to the answers relating to IM. In other words, respondents appeared to use the same cues to identify an important IM as they did to identify an important e-mail. For the purposes of this report, then, the term e-mail will be used to discuss the results for both e-mail and IM.
Once an exhaustive list of the characteristics of important and urgent e-mails was established (this was determined when no new “acts” or examples were identified by respondents), the researchers reviewed the completed list and removed redundancies, attitude statements and vague behaviours. This analysis resulted in a list of 35 factors that employees considered to be characteristic of an important e-mail and 38 factors that employees considered to be characteristic of an urgent e-mail.
Methodology
A National Study of Electronic Communication on Canadian School Leaders | 2017
12
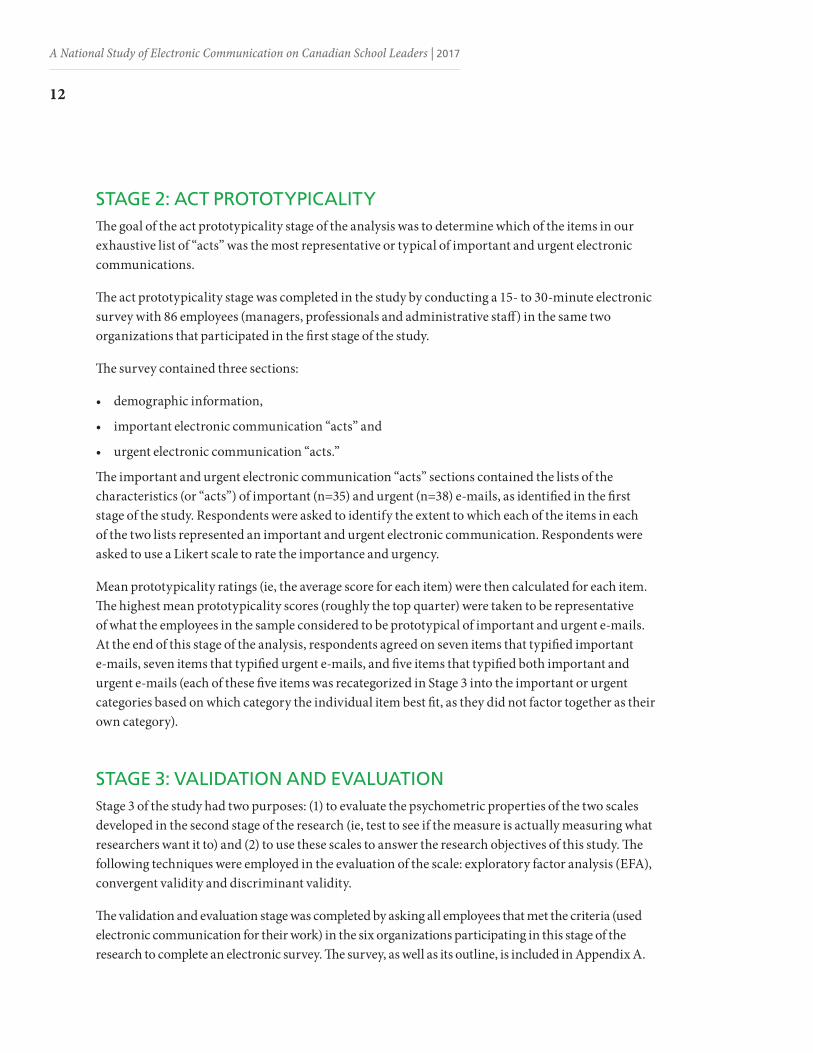
STAGE 2: ACT PROTOTYPICALITYThe goal of the act prototypicality stage of the analysis was to determine which of the items in our exhaustive list of “acts” was the most representative or typical of important and urgent electronic communications.
The act prototypicality stage was completed in the study by conducting a 15- to 30-minute electronic survey with 86 employees (managers, professionals and administrative staff) in the same two organizations that participated in the first stage of the study.
The survey contained three sections:
• demographic information,
• important electronic communication “acts” and
• urgent electronic communication “acts.”
The important and urgent electronic communication “acts” sections contained the lists of the characteristics (or “acts”) of important (n=35) and urgent (n=38) e-mails, as identified in the first stage of the study. Respondents were asked to identify the extent to which each of the items in each of the two lists represented an important and urgent electronic communication. Respondents were asked to use a Likert scale to rate the importance and urgency.
Mean prototypicality ratings (ie, the average score for each item) were then calculated for each item. The highest mean prototypicality scores (roughly the top quarter) were taken to be representative of what the employees in the sample considered to be prototypical of important and urgent e-mails. At the end of this stage of the analysis, respondents agreed on seven items that typified important e-mails, seven items that typified urgent e-mails, and five items that typified both important and urgent e-mails (each of these five items was recategorized in Stage 3 into the important or urgent categories based on which category the individual item best fit, as they did not factor together as their own category).
STAGE 3: VALIDATION AND EVALUATIONStage 3 of the study had two purposes: (1) to evaluate the psychometric properties of the two scales developed in the second stage of the research (ie, test to see if the measure is actually measuring what researchers want it to) and (2) to use these scales to answer the research objectives of this study. The following techniques were employed in the evaluation of the scale: exploratory factor analysis (EFA), convergent validity and discriminant validity.
The validation and evaluation stage was completed by asking all employees that met the criteria (used electronic communication for their work) in the six organizations participating in this stage of the research to complete an electronic survey. The survey, as well as its outline, is included in Appendix A.

ALBERTA TEACHERS’ ASSOCIATION
13
The survey contained five sections:
• demographic information,
• information about employees’ work,
• the demands of employees’ work,
• mental health and
• electronic communication questions (including our measure developed in stage 2).
In order to meet the second purpose of this phase—answering the study’s research objectives—the researchers employed the theoretical framework to select and sort constructs into predictors (something that can be used to predict the outcomes of interest), moderators (something that can be used to raise or lower the score of the outcomes) and outcomes (concepts that researchers are interested in being able to predict and hopefully manipulate). The constructs are represented in Figure 2, and information on the constructs, including a definition of each construct and how they were measured, is presented in Table 1.
For the most part, respondents were asked to use a five-point Likert scale to answer each of the questions in the survey. Researchers then calculated the “construct” score as a summed average of the responses. With few exceptions (see below), two sets of data are presented for each of the constructs. First, the mean and standard deviations (SD) of the construct were calculated. Second, the frequency
Objective Work Demands• Hours• SWAH
Absenteeism• per cent• #Days
Subjective Work Demands• Role conflict• Role ambiguity
Intent to Turnover
Decision AuthoritySkill Discretion
Perceived Stress
Job Stress
Objective E-mail Demands• Hours• # Received/Sent
Subjective Ecom Demands (Size and proportion)• Important• Urgent
Work RoleOverload
PerceivedControl Over
Work
E-mailOverload
Note: Ecom = Electronic communication
Figure 2: Predictive model of the relationship between constructs
A National Study of Electronic Communication on Canadian School Leaders | 2017
14
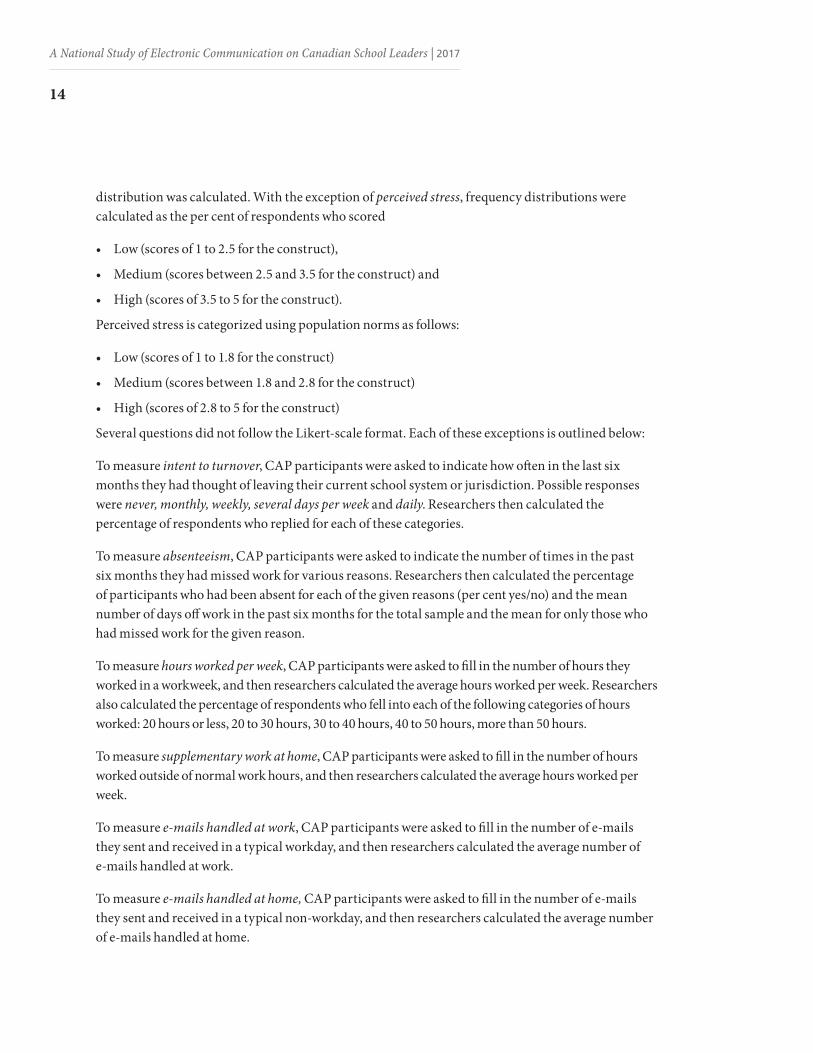
distribution was calculated. With the exception of perceived stress, frequency distributions were calculated as the per cent of respondents who scored
• Low (scores of 1 to 2.5 for the construct),
• Medium (scores between 2.5 and 3.5 for the construct) and
• High (scores of 3.5 to 5 for the construct).
Perceived stress is categorized using population norms as follows:
• Low (scores of 1 to 1.8 for the construct)
• Medium (scores between 1.8 and 2.8 for the construct)
• High (scores of 2.8 to 5 for the construct)
Several questions did not follow the Likert-scale format. Each of these exceptions is outlined below:
To measure intent to turnover, CAP participants were asked to indicate how often in the last six months they had thought of leaving their current school system or jurisdiction. Possible responses were never, monthly, weekly, several days per week and daily. Researchers then calculated the percentage of respondents who replied for each of these categories.
To measure absenteeism, CAP participants were asked to indicate the number of times in the past six months they had missed work for various reasons. Researchers then calculated the percentage of participants who had been absent for each of the given reasons (per cent yes/no) and the mean number of days off work in the past six months for the total sample and the mean for only those who had missed work for the given reason.
To measure hours worked per week, CAP participants were asked to fill in the number of hours they worked in a workweek, and then researchers calculated the average hours worked per week. Researchers also calculated the percentage of respondents who fell into each of the following categories of hours worked: 20 hours or less, 20 to 30 hours, 30 to 40 hours, 40 to 50 hours, more than 50 hours.
To measure supplementary work at home, CAP participants were asked to fill in the number of hours worked outside of normal work hours, and then researchers calculated the average hours worked per week.
To measure e-mails handled at work, CAP participants were asked to fill in the number of e-mails they sent and received in a typical workday, and then researchers calculated the average number of e-mails handled at work.
To measure e-mails handled at home, CAP participants were asked to fill in the number of e-mails they sent and received in a typical non-workday, and then researchers calculated the average number of e-mails handled at home.
ALBERTA TEACHERS’ ASSOCIATION
15
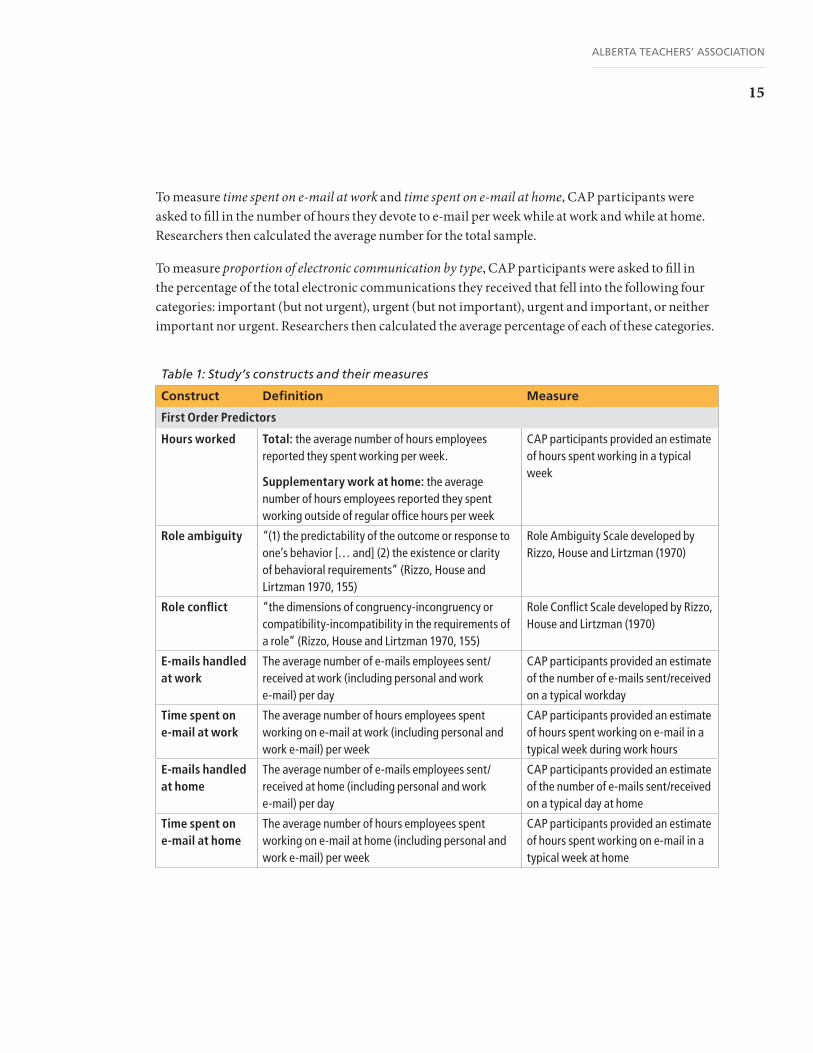
To measure time spent on e-mail at work and time spent on e-mail at home, CAP participants were asked to fill in the number of hours they devote to e-mail per week while at work and while at home. Researchers then calculated the average number for the total sample.
To measure proportion of electronic communication by type, CAP participants were asked to fill in the percentage of the total electronic communications they received that fell into the following four categories: important (but not urgent), urgent (but not important), urgent and important, or neither important nor urgent. Researchers then calculated the average percentage of each of these categories.
Table 1: Study’s constructs and their measures
Construct Definition Measure
First Order Predictors
Hours worked Total: the average number of hours employees reported they spent working per week.
Supplementary work at home: the average number of hours employees reported they spent working outside of regular office hours per week
CAP participants provided an estimate of hours spent working in a typical week
Role ambiguity “(1) the predictability of the outcome or response to one’s behavior [… and] (2) the existence or clarity of behavioral requirements” (Rizzo, House and Lirtzman 1970, 155)
Role Ambiguity Scale developed by Rizzo, House and Lirtzman (1970)
Role conflict “the dimensions of congruency-incongruency or compatibility-incompatibility in the requirements of a role” (Rizzo, House and Lirtzman 1970, 155)
Role Conflict Scale developed by Rizzo, House and Lirtzman (1970)
E-mails handled at work
The average number of e-mails employees sent/received at work (including personal and work e-mail) per day
CAP participants provided an estimate of the number of e-mails sent/received on a typical workday
Time spent on e-mail at work
The average number of hours employees spent working on e-mail at work (including personal and work e-mail) per week
CAP participants provided an estimate of hours spent working on e-mail in a typical week during work hours
E-mails handled at home
The average number of e-mails employees sent/received at home (including personal and work e-mail) per day
CAP participants provided an estimate of the number of e-mails sent/received on a typical day at home
Time spent on e-mail at home
The average number of hours employees spent working on e-mail at home (including personal and work e-mail) per week
CAP participants provided an estimate of hours spent working on e-mail in a typical week at home
A National Study of Electronic Communication on Canadian School Leaders | 2017
16
Table 1: Study’s constructs and their measures
Construct Definition Measure
Electronic communication (Ecom) demands
Important: An electronic communication with something of great significance, consequence or value
Urgent: An electronic communication requiring swift action
Electronic Communication Scale, developed with the AFA in this study
Proportion of Ecom by type
The proportion of e-mail received that fell into the following four categories: important, urgent, both urgent and important, or neither urgent nor important
CAP participants provided the per cent of their total Ecom for each of the four categories
Second Order Predictors
Role overload “having too many responsibilities and too little time in which to attend to them” (Higgins, Duxbury and Lyons 2010, 3)
Role overload instrument developed and tested by Duxbury et al (2010)
E-mail overload A specific type of information overload which is “defined as a condition in which the volume of information exceeds a person’s capacity to process it” (Thomas et al 2006, 255)
E-mail overload scale developed by Hogan and Fisher (2006)
Moderators
Work control “the amount of perceived control an individual has over their work (know how their work will be assessed, have some say over workload, work schedule etc.)” (Duxbury and Higgins 2012, 67)
A measure based on Dwyer and Ganster’s (1991) work control scale
Skill discretion “the degree to which the job involves: a variety of tasks, low levels of repetitiveness, occasions for creativity and opportunities to learn new things and develop special abilities” (LaChapelle 2008, 72)
Skill discretion questions from Karasek et al’s (1998) job content questionnaire
Decision authority
“the employee’s ability to make decisions about their own job, and their ability to influence their own work team and more general company policy” (LaChapelle 2008, 72)
Decision authority questions from Karasek et al’s (1998) job content questionnaire
ALBERTA TEACHERS’ ASSOCIATION
17
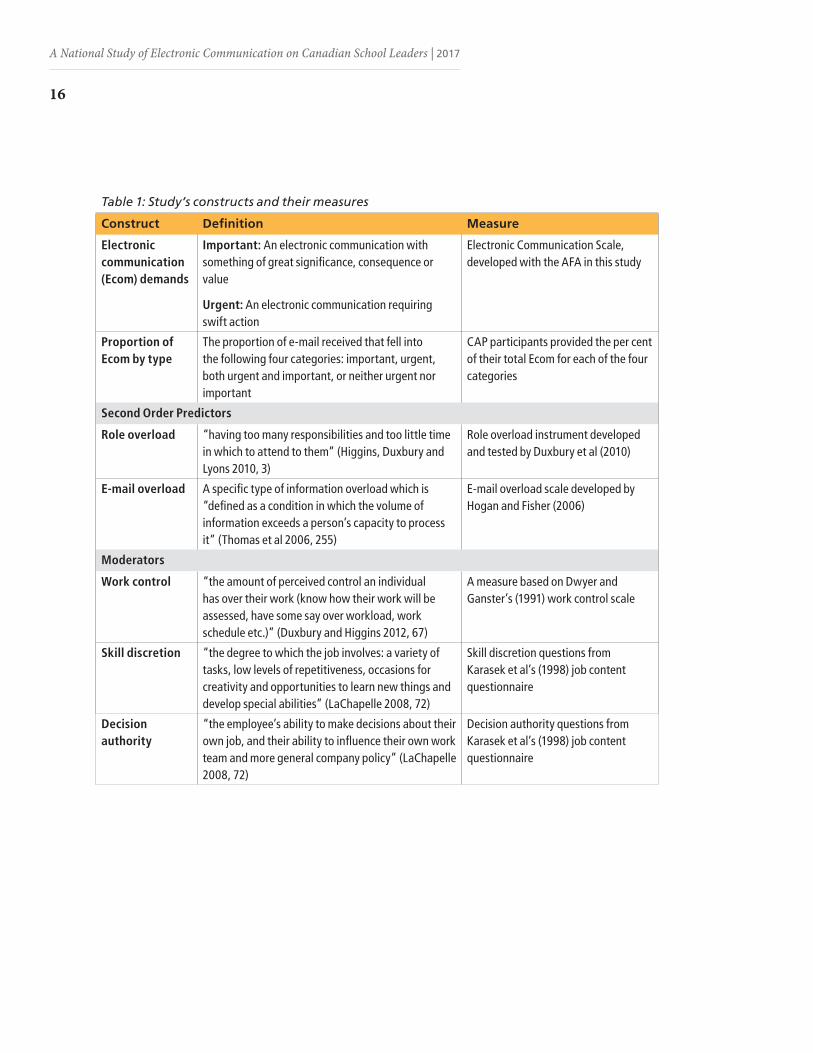
Table 1: Study’s constructs and their measures
Construct Definition Measure
Outcomes
Absenteeism Days missing from work due to each of the following: ill-health, child care, elder care, emotional fatigue
CAP participants indicated how many days in a six-month period they were absent for each of these four reasons
Intent to turnover
“an individual’s desire to leave an organization” (Duxbury and Higgins 2012, 47)
CAP participants indicated how often in the last six months they had thought of leaving their current organization
Perceived stress “the extent to which one perceives one’s situation to be unpredictable, uncontrollable and burdensome” (Duxbury and Higgins, 2012, 55)
Perceived stress scale developed by Cohen, Kamarck and Mermelstein (1983)
Job stress “the harmful physical and emotional responses that occur when the requirements of the job do not match the capabilities, resources, or needs of the worker” (NIOSH 2009)
Work tension scale developed by Cook et al (1981)
E-mail overload is a specific type of information overload— “a condition in which the volume of information exceeds a person’s capacity to process it.”(Thomas et al 2006, 255)
STOP

A National Study of Electronic Communication on Canadian School Leaders | 2017
18
Over 1,500 participants (including 1,150 CAP members) fully completed the survey. Over 1,800 participants (nearly 1,300 CAP members) completed at least part of the survey. Employees from six organizations participated in the study. The organizations were from the following organizational types: high school, college, the private sector and not for profit. The sample distribution by organizational type is reported in Table 2. Virtually all of the respondents worked in the educational sector.
CAP SAMPLEThis section describes the demographic characteristics of the CAP sample and highlights the major differences between CAP respondents and the rest of the survey respondents. For the remainder of this report, the non-CAP sample will refer to the total sample not including the CAP sample respondents.
Demographic data for the non-CAP sample and the CAP sample are summarized in Table 3.
Sample Demographics
Table 2: Sample distribution by organizational type1
Organizational Type Percentage
High school 70.3
College 18
Private sector 8.6
Not for profit 3
Table 3: Demographic data for the samples
Non-CAP Sample CAP SampleGender Male (%) Female (%)
32.767.3
58.241.6
Age (Mean, SD) 43.2 (10.7) 47.9 (7.1)
Age Gen Y (%) Gen X (%) Baby Boomer (%)
16.138.745.2
1.234.664.2
Education High school or less (%) College (%) University (%) Graduate degree (%)
18.228.935.317.6
- -
27.372.7
Years with current school system or jurisdiction (Mean, SD) 9.9 (8.9) 18.7 (8.4)
Years in current leader/administrator designation (Mean, SD) 5.2 (5.6) 5.4 (4.5)
Years of experience as a school leader/administrator (Mean, SD)
- 9.7 (6.0)
Current school leader/administrator designation (%) - 82.0
1 Percentages in tables may not add up to 100 per cent due to rounding.

ALBERTA TEACHERS’ ASSOCIATION
19
While nearly 70 per cent of the non-CAP sample respondents were female, nearly 60 per cent of the CAP respondents were male. The CAP sample was older than the non-CAP sample, with an average age of 47.9 years old and the majority being part of the Baby Boomer cohort. Almost none were from Gen Y. Figure 3 represents the frequency distributions by generational cohort.
The CAP sample had a high degree of formal education, with nearly three-quarters of the sample possessing at least one graduate degree. This education profile is consistent with the fact that the CAP respondents were all principals.
CAP respondents have spent a lot more time in their current organization than the non-CAP sample, with an average tenure of 18.7 years working for their current school system or jurisdiction. This, again, is consistent with the fact all CAP respondents were principals—a position that requires a lot of job experience. Notably, the SD was 8.4 years, reflecting how the CAP sample distribution is highly skewed (see Figure 4), with 42.8 per cent having worked for their current school system or jurisdiction for more than 20 years.

A National Study of Electronic Communication on Canadian School Leaders | 2017
20
On average, CAP respondents spent 5.4 years working in their leader/administrator designation. The years in current leader/administrator designation distribution is also highly skewed (see Figure 5), with one-third of the CAP sample having less than 2 years in their present position.
ALBERTA TEACHERS’ ASSOCIATION
21
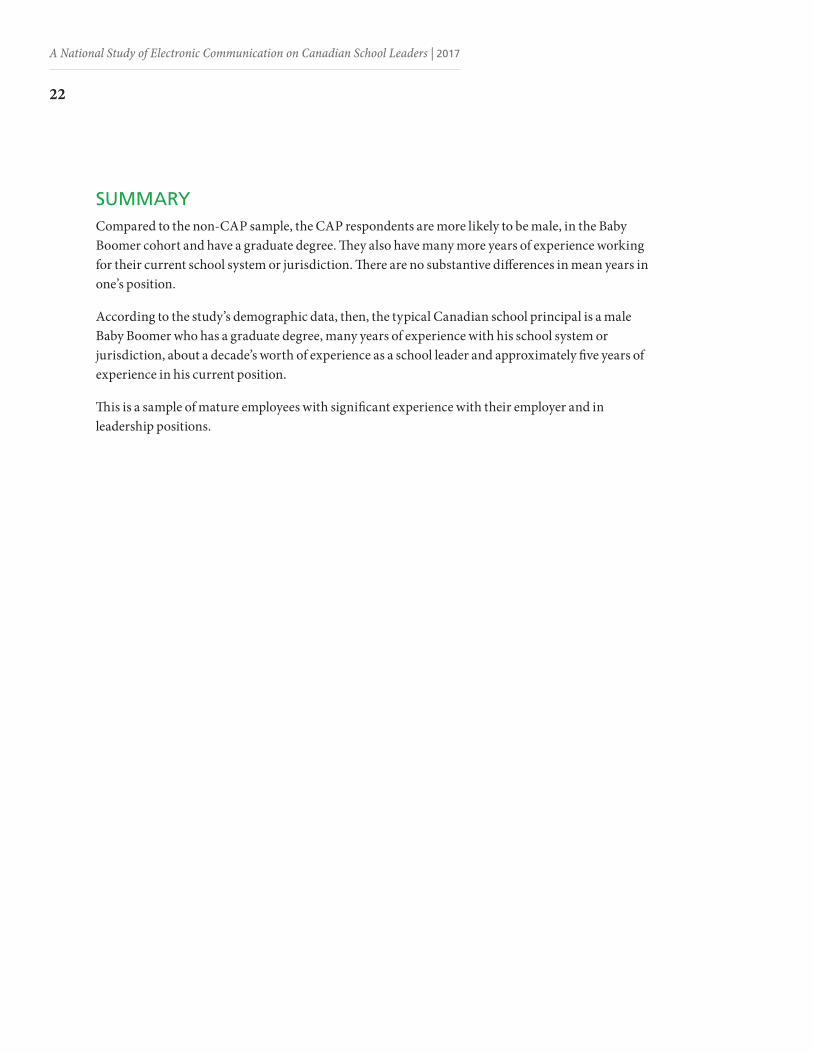
The average school leader/administrator designation, which represents the proportion of the respondent’s work that is designated as the work of a principal, was 82 per cent. Most CAP respondents fell within the 90 to 100 per cent designation category, highly skewing the sample.
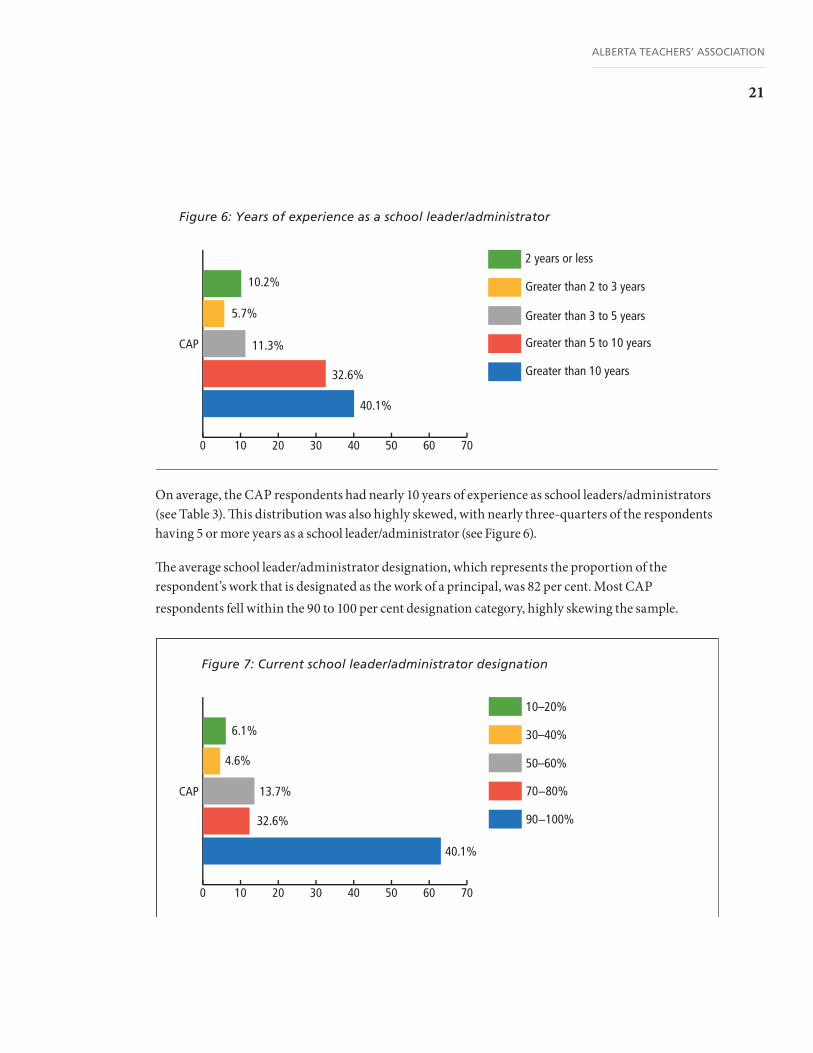
On average, the CAP respondents had nearly 10 years of experience as school leaders/administrators (see Table 3). This distribution was also highly skewed, with nearly three-quarters of the respondents having 5 or more years as a school leader/administrator (see Figure 6).
A National Study of Electronic Communication on Canadian School Leaders | 2017
22
SUMMARYCompared to the non-CAP sample, the CAP respondents are more likely to be male, in the Baby Boomer cohort and have a graduate degree. They also have many more years of experience working for their current school system or jurisdiction. There are no substantive differences in mean years in one’s position.
According to the study’s demographic data, then, the typical Canadian school principal is a male Baby Boomer who has a graduate degree, many years of experience with his school system or jurisdiction, about a decade’s worth of experience as a school leader and approximately five years of experience in his current position.
This is a sample of mature employees with significant experience with their employer and in leadership positions.

ALBERTA TEACHERS’ ASSOCIATION
23
According to Karesek (1979), work demands represent the psychological stressors in the work environment. These include factors such as time pressures, conflicting demands, pace of work, proportion of work performed under pressure and amount of time working.
This section of the report summarizes the work demands of the CAP members. Various indicators of work demands were included.
First, objective indicators of demand are reviewed. These are the amount of time CAP respondents spend each week in work-related activities and the amount of time they spend in supplemental work at home. Second, a subjective indicator of work demands—role overload—is considered. Role overload quantifies the extent to which work role expectations are reasonable, given the time and resources available. Third, data are reviewed that relate to several characteristics of the work and the work environment that are known to be associated with higher work demands, specifically role ambiguity and role conflict. The higher the role ambiguity and role conflict, the greater the work demands and the less control the principal has over his or her job.
All data in this section are represented in two ways: means with standard deviations (SD) (shown in tables) and frequency distributions (shown in figures).
OBJECTIVE INDICATORS OF WORK DEMANDThe survey asked the following questions to help determine the objective work demands of the respondents:
At present how many hours per week do you spend • in work-related activities,• in work-related activities at home outside regular office hours (ie, evenings or weekends)?
Responses to these questions (see Table 4 and Figure 8) reveal the amount of time principals devote to work. The higher the number of hours spent in work per week, the greater the workload. This information is noteworthy since it can indicate whether employees are being overloaded in terms of total hours working. Supplementary work at home is also worth attention. Higher amounts of time in supplementary work at home might suggest that work expectations are high and the employee cannot complete his or her work during regular work hours.
Work Demands

A National Study of Electronic Communication on Canadian School Leaders | 2017
24
Table 4: Hours of work-related activities
Work Demands Non-CAP Sample Mean (SD)
CAP Mean (SD)
Hours of work per week
Hours of supplementary work at home per week
40.3 (11.8)
9.5 (7.3)
50.1 (11.4)
10.9 (7.1)
Percentage performing supplementary work at home
77.6 98.5
As Table 4 shows, on average, CAP respondents worked 50.1 hours a week, well above the “40-hour work week.” As can be seen in Figure 8, more than one-third of the Canadian principals surveyed work more than 50 hours per week. These data indicate that those in the CAP sample spend more hours working per week than those in the non-CAP sample.
Nearly everyone in the CAP sample (98.5 per cent of the respondents) also performed supplementary work at home. On average, CAP respondents spent nearly 11 hours per week performing work at home outside of their regular work hours. This suggests that the work demands of principals are very high.
ALBERTA TEACHERS’ ASSOCIATION
25
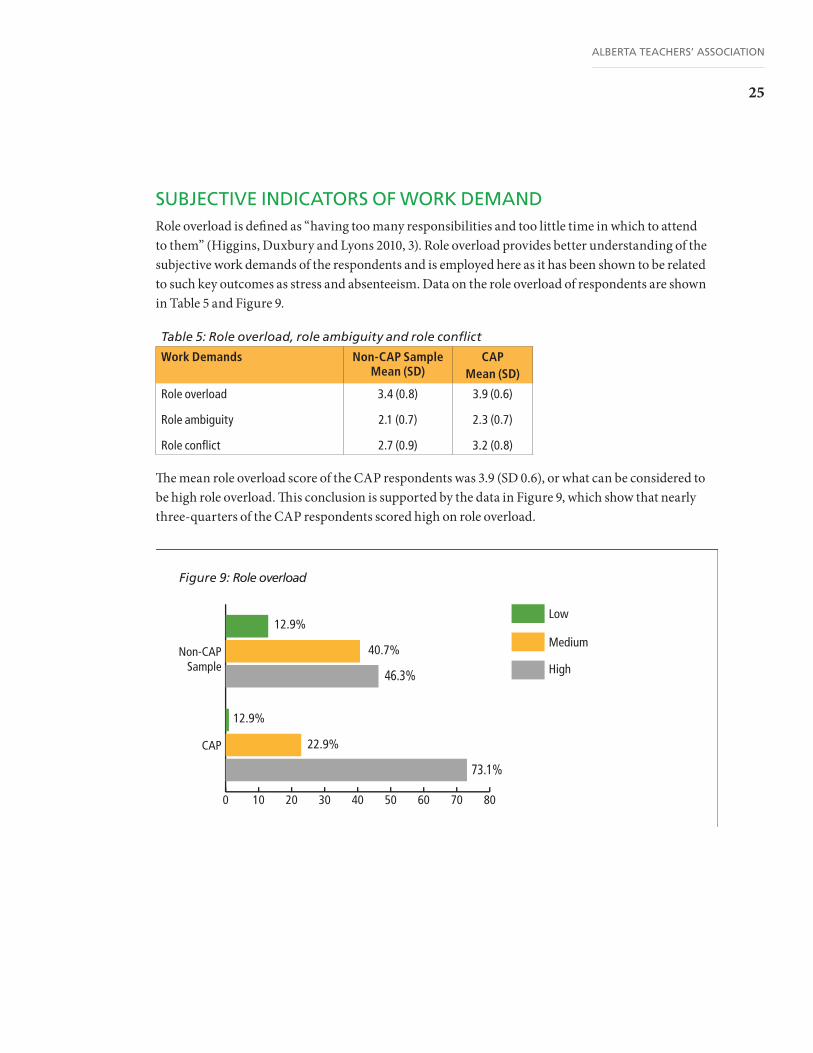
SUBJECTIVE INDICATORS OF WORK DEMAND Role overload is defined as “having too many responsibilities and too little time in which to attend to them” (Higgins, Duxbury and Lyons 2010, 3). Role overload provides better understanding of the subjective work demands of the respondents and is employed here as it has been shown to be related to such key outcomes as stress and absenteeism. Data on the role overload of respondents are shown in Table 5 and Figure 9.
Table 5: Role overload, role ambiguity and role conflict
Work Demands Non-CAP Sample Mean (SD)
CAP Mean (SD)
Role overload
Role ambiguity
Role conflict
3.4 (0.8)
2.1 (0.7)
2.7 (0.9)
3.9 (0.6)
2.3 (0.7)
3.2 (0.8)
The mean role overload score of the CAP respondents was 3.9 (SD 0.6), or what can be considered to be high role overload. This conclusion is supported by the data in Figure 9, which show that nearly three-quarters of the CAP respondents scored high on role overload.

A National Study of Electronic Communication on Canadian School Leaders | 2017
26
ROLE AMBIGUITY Role ambiguity is defined as “(1) the predictability of the outcome or response to one’s behavior […] and (2) the existence or clarity of behavioral requirements” (Rizzo, House and Lirtzman 1970, 155). Employees with high levels of role ambiguity typically report heavier work demands, as they often have to determine what they should be doing rather than how best to undertake the work. This can lead to employees using ineffective coping strategies, including avoidance tactics, which might connect to data that show that role ambiguity is often associated with such negative outcomes as stress and anxiety.
The role ambiguity of the CAP sample was fairly low, with a mean of 2.3 (SD 0.7) (see Table 5). As shown in Figure 10, about 70 per cent of CAP respondents have low role ambiguity, suggesting that role ambiguity does not contribute greatly to higher levels of work demands in this sample. On the contrary, on average, Canadian principals surveyed appear to have a relatively clear sense of their work objectives and how they will be evaluated with respect to meeting those objectives. They just do not have enough time to do it all.

ALBERTA TEACHERS’ ASSOCIATION
27
ROLE CONFLICT Role conflict refers to “the dimensions of congruency-incongruence or compatibility-incompatibility in the requirements of a role” (Rizzo, House and Lirtzman 1970, 155). Those experiencing high role conflict tend to have higher levels of employee stress and higher work demands as they are less effective in their jobs than those without such conflict. Moreover, role conflict has been linked to decreased employee satisfaction and decreased organizational effectiveness. The data show that the mean level of role conflict reported by those in the CAP sample is moderate or medium (see Table 5). The frequency data (see Figure 11) suggest that this mean score (approximately 3.0) can be attributed to the fact that the role conflict distribution in the CAP sample is slightly skewed in comparison with the non-CAP sample: just under 80 per cent of the CAP sample reported medium to high role conflict, and just over 20 per cent reported low role conflict.
The mean levels of role overload, role ambiguity and role conflict are all higher in the CAP sample than in the non-CAP sample. The distribution of these constructs is also somewhat different, with the majority (73 per cent) of the respondents in the CAP sample reporting high levels of role overload. The CAP sample also has higher levels of role clarity. With 40 per cent reporting high levels of role conflict, relatively few principals (compared to the non-CAP sample) reported low levels of role conflict. Taken together, these data suggest that the principals in the CAP sample have very high subjective work demands—higher than experienced by those in the non-CAP sample. Furthermore, the data indicate that these high workloads cannot be attributed to conflicting expectations or a lack of understanding of one’s role.

A National Study of Electronic Communication on Canadian School Leaders | 2017
28
SUMMARY: WORK DEMANDS OF RESPONDENTS The principals participating in this study have heavy work demands. The indicator of objective work demands shows that the CAP respondents work approximately 50 hours per week. Furthermore, virtually everyone in the CAP sample (98.5 per cent) performs supplementary work at home, spending an additional day and a half in work per week outside of regular office hours. The data on supplementary work at home imply that the CAP respondents cannot complete all of their work during their regular work hours and/or that there is an expectation that they will complete their work out of regular work hours.
The subjective measures corroborate the objective results, with the majority of the CAP sample reporting high levels of role overload and nearly 40 per cent reporting high levels of role conflict. At the same time, the data show that the majority of the CAP respondents have low levels of role ambiguity, a construct often linked to higher levels of role overload.

ALBERTA TEACHERS’ ASSOCIATION
29
Perceived control over work is a key construct in Karasek’s (1979) framework, which hypothesizes that those with higher perceived control over work are more able to cope with the work-related demands they face. Accordingly, included in the survey were a number of scales to provide insight into how much control our respondents perceive they have in terms of three indicators: work control, skill discretion and decision authority. The following section presents the data analysis of these indicators to assess the levels of control over work experienced by the principals in the CAP sample.
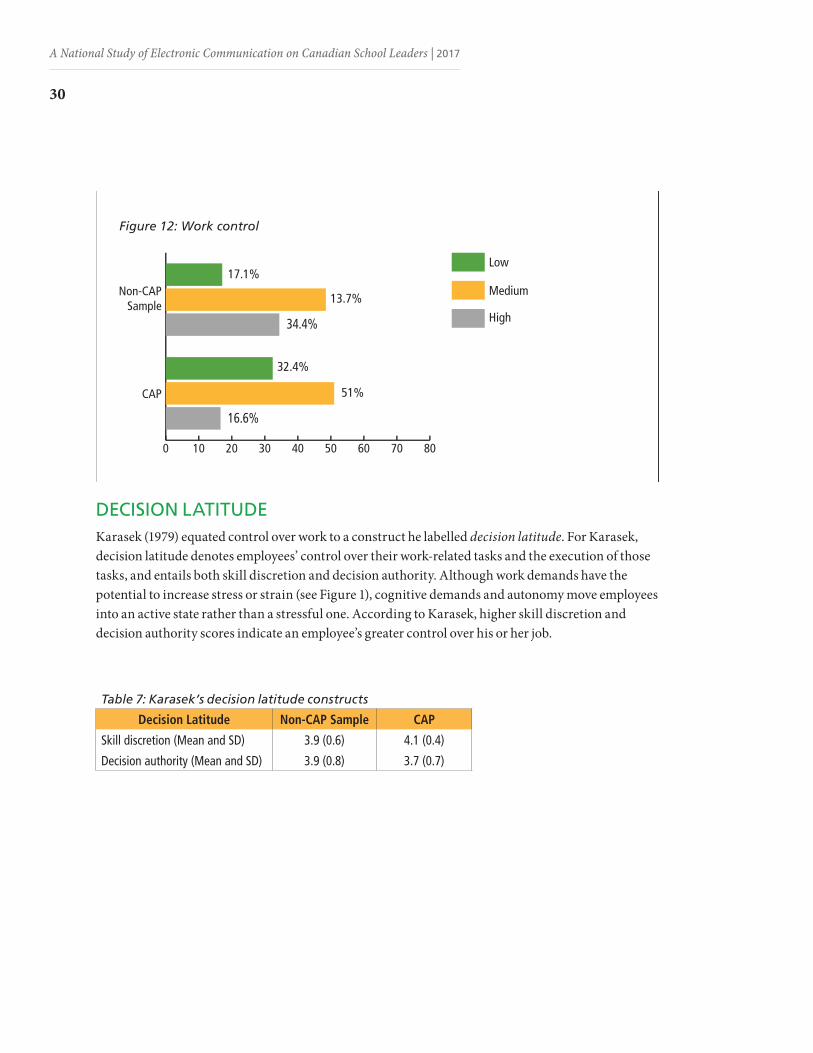
WORK CONTROLWork control is “the amount of perceived control an individual has over their work (ie, know how their work will be assessed, have some say over workload, work schedule etc.)” (Duxbury and Higgins 2012, 67). On average, CAP respondents report a work control score of 2.8 (SD 0.7) (see Table 6). The data in Figure 12 provide additional information on the sample’s perceived work control, showing that about half of the CAP sample report moderate levels of work control, nearly one-third report low work control and about 15 per cent report high levels of work control.
The results of the data analysis indicate that CAP members have moderate levels of control over work. Notably, the levels of work control reported by those in the CAP sample are significantly lower than the levels observed in the non-CAP sample. The frequency data show that respondents in the CAP sample are more likely than those in the non-CAP sample to report low levels of control over work and less likely to report high levels of control over work. Given their position of authority within a school, one might expect principals to have a higher degree of control over their work. This perceived lack of control, however, may stem more from external pressures than internal expectations. This interpretation of the data is consistent with the high role clarity reported earlier.
Table 6: Control over work
Work Demands Non-CAP Sample CAP
Work control (Mean and SD) 3.2 (0.8) 2.8 (0.7)
Control over Work
A National Study of Electronic Communication on Canadian School Leaders | 2017
30
DECISION LATITUDEKarasek (1979) equated control over work to a construct he labelled decision latitude. For Karasek, decision latitude denotes employees’ control over their work-related tasks and the execution of those tasks, and entails both skill discretion and decision authority. Although work demands have the potential to increase stress or strain (see Figure 1), cognitive demands and autonomy move employees into an active state rather than a stressful one. According to Karasek, higher skill discretion and decision authority scores indicate an employee’s greater control over his or her job.
Table 7: Karasek’s decision latitude constructs
Decision Latitude Non-CAP Sample CAP
Skill discretion (Mean and SD)
Decision authority (Mean and SD)
3.9 (0.6)
3.9 (0.8)
4.1 (0.4)
3.7 (0.7)

ALBERTA TEACHERS’ ASSOCIATION
31
SKILL DISCRETIONSkill discretion is “the degree to which the job involves: a variety of tasks, low levels of repetitiveness, occasions for creativity and opportunities to learn new things and develop special abilities” (LaChapelle 2008, 72). The CAP respondents report a high mean skill discretion score of 4.1 (SD 0.4) (see Table 7). The data in Figure 13 agree with this, as roughly 95 per cent of the CAP sample falls into the high skill discretion group. The CAP respondents have notably higher skill discretion than those in the non-CAP sample. These findings are not unexpected, given that the CAP sample is composed of principals who have a lot of work experience and are in positions of authority.

A National Study of Electronic Communication on Canadian School Leaders | 2017
32
DECISION AUTHORITY Decision authority refers to “the employee’s ability to make decisions about their own job, and their ability to influence their own work team and more general company policy” (LaChapelle 2008, 72). The CAP sample’s decision authority score indicates high control over work as well, with a mean score of 3.7 (SD 0.7) (see Table 7). However, as Figure 14 shows, this measure of work control is slightly lower than skill discretion, with nearly 30 per cent of the sample falling into the medium category of decision authority. Notably, the CAP sample scores slightly lower than the non-CAP sample in decision authority.
SUMMARY: CONTROL OVER WORKThe control over work measures indicate that the majority of the principals in the sample have relatively high levels of control of their job. The scores on both skill discretion and decision authority were very high. The respondents’ roles as principals might explain the high skill discretion and decision authority. At the same time, the sample’s normal distribution with respect to the work control measure and the lower scores in this construct in comparison with the non-CAP sample suggest that perceived control over work is probably better captured with the work control construct than with the measures used by Karasek (skill discretion and decision authority).

ALBERTA TEACHERS’ ASSOCIATION
33
One of the main objectives of this study was to classify the e-mails sent and received by respondents by their levels of importance and urgency, as well as to quantify the number of work-related e-mails that respondents process in a typical workweek. To meet this objective, a number of measures were included in the survey to assess respondents’ e-mail use and the work demands that such use is likely to impose on them.
The approach taken in this study to measure work demands associated with the use of e-mail is very similar to that taken to quantify total work demands. More specifically, the survey included several objective and subjective measures of the work demands imposed by e-mail. The objective measures are
• hours during workdays and non-workdays devoted to e-mail per week and
• number of e-mails sent and received each day.
The subjective measures are
• frequency of dealing with important and urgent e-mails (our measure),
• e-mail overload and
• proportion of all e-mails received by type (important, urgent, important and urgent, not urgent).
This section of the report is divided into two main parts: one focused on the objective data on e-mail use, and one on the subjective data on e-mail use.
Electronic Communication
A National Study of Electronic Communication on Canadian School Leaders | 2017
34
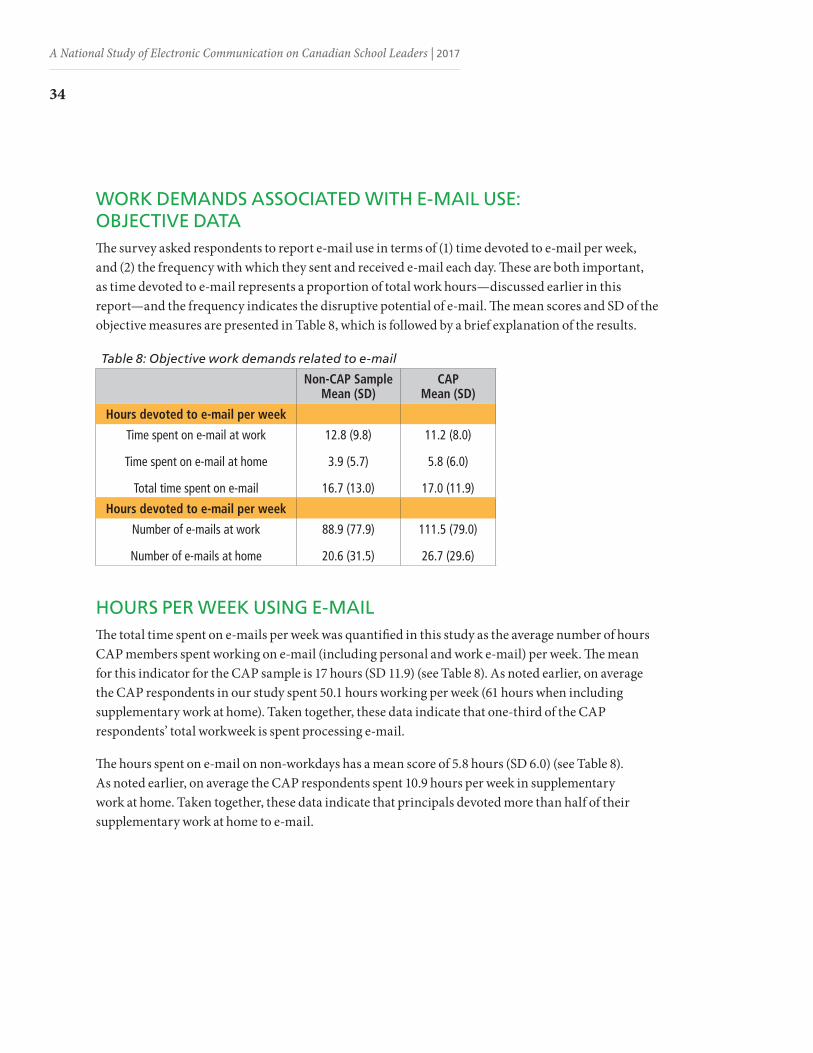
WORK DEMANDS ASSOCIATED WITH E-MAIL USE: OBJECTIVE DATAThe survey asked respondents to report e-mail use in terms of (1) time devoted to e-mail per week, and (2) the frequency with which they sent and received e-mail each day. These are both important, as time devoted to e-mail represents a proportion of total work hours—discussed earlier in this report—and the frequency indicates the disruptive potential of e-mail. The mean scores and SD of the objective measures are presented in Table 8, which is followed by a brief explanation of the results.
Table 8: Objective work demands related to e-mail
Non-CAP Sample Mean (SD)
CAP Mean (SD)
Hours devoted to e-mail per week
Time spent on e-mail at work
Time spent on e-mail at home
Total time spent on e-mail
12.8 (9.8)
3.9 (5.7)
16.7 (13.0)
11.2 (8.0)
5.8 (6.0)
17.0 (11.9)
Hours devoted to e-mail per week
Number of e-mails at work
Number of e-mails at home
88.9 (77.9)
20.6 (31.5)
111.5 (79.0)
26.7 (29.6)
HOURS PER WEEK USING E-MAILThe total time spent on e-mails per week was quantified in this study as the average number of hours CAP members spent working on e-mail (including personal and work e-mail) per week. The mean for this indicator for the CAP sample is 17 hours (SD 11.9) (see Table 8). As noted earlier, on average the CAP respondents in our study spent 50.1 hours working per week (61 hours when including supplementary work at home). Taken together, these data indicate that one-third of the CAP respondents’ total workweek is spent processing e-mail.
The hours spent on e-mail on non-workdays has a mean score of 5.8 hours (SD 6.0) (see Table 8). As noted earlier, on average the CAP respondents spent 10.9 hours per week in supplementary work at home. Taken together, these data indicate that principals devoted more than half of their supplementary work at home to e-mail.
ALBERTA TEACHERS’ ASSOCIATION
35
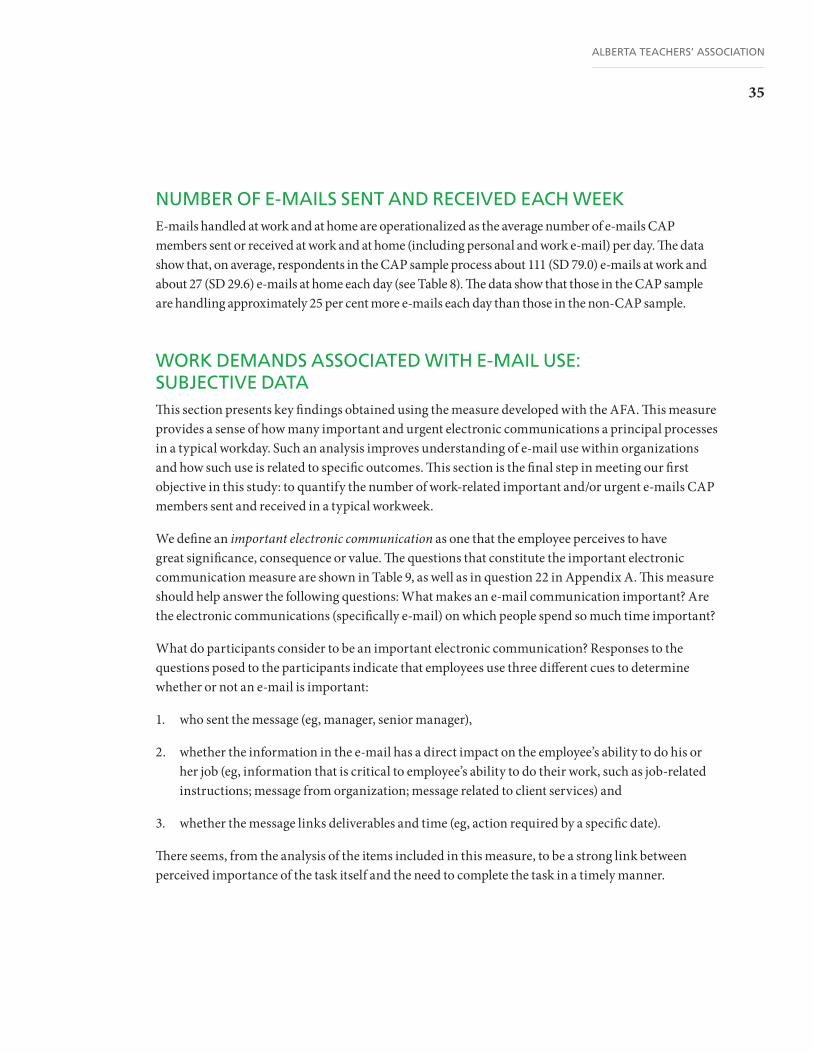
NUMBER OF E-MAILS SENT AND RECEIVED EACH WEEKE-mails handled at work and at home are operationalized as the average number of e-mails CAP members sent or received at work and at home (including personal and work e-mail) per day. The data show that, on average, respondents in the CAP sample process about 111 (SD 79.0) e-mails at work and about 27 (SD 29.6) e-mails at home each day (see Table 8). The data show that those in the CAP sample are handling approximately 25 per cent more e-mails each day than those in the non-CAP sample.
WORK DEMANDS ASSOCIATED WITH E-MAIL USE: SUBJECTIVE DATAThis section presents key findings obtained using the measure developed with the AFA. This measure provides a sense of how many important and urgent electronic communications a principal processes in a typical workday. Such an analysis improves understanding of e-mail use within organizations and how such use is related to specific outcomes. This section is the final step in meeting our first objective in this study: to quantify the number of work-related important and/or urgent e-mails CAP members sent and received in a typical workweek.
We define an important electronic communication as one that the employee perceives to have great significance, consequence or value. The questions that constitute the important electronic communication measure are shown in Table 9, as well as in question 22 in Appendix A. This measure should help answer the following questions: What makes an e-mail communication important? Are the electronic communications (specifically e-mail) on which people spend so much time important?
What do participants consider to be an important electronic communication? Responses to the questions posed to the participants indicate that employees use three different cues to determine whether or not an e-mail is important:
1. who sent the message (eg, manager, senior manager),
2. whether the information in the e-mail has a direct impact on the employee’s ability to do his or her job (eg, information that is critical to employee’s ability to do their work, such as job-related instructions; message from organization; message related to client services) and
3. whether the message links deliverables and time (eg, action required by a specific date).
There seems, from the analysis of the items included in this measure, to be a strong link between perceived importance of the task itself and the need to complete the task in a timely manner.
A National Study of Electronic Communication on Canadian School Leaders | 2017
36
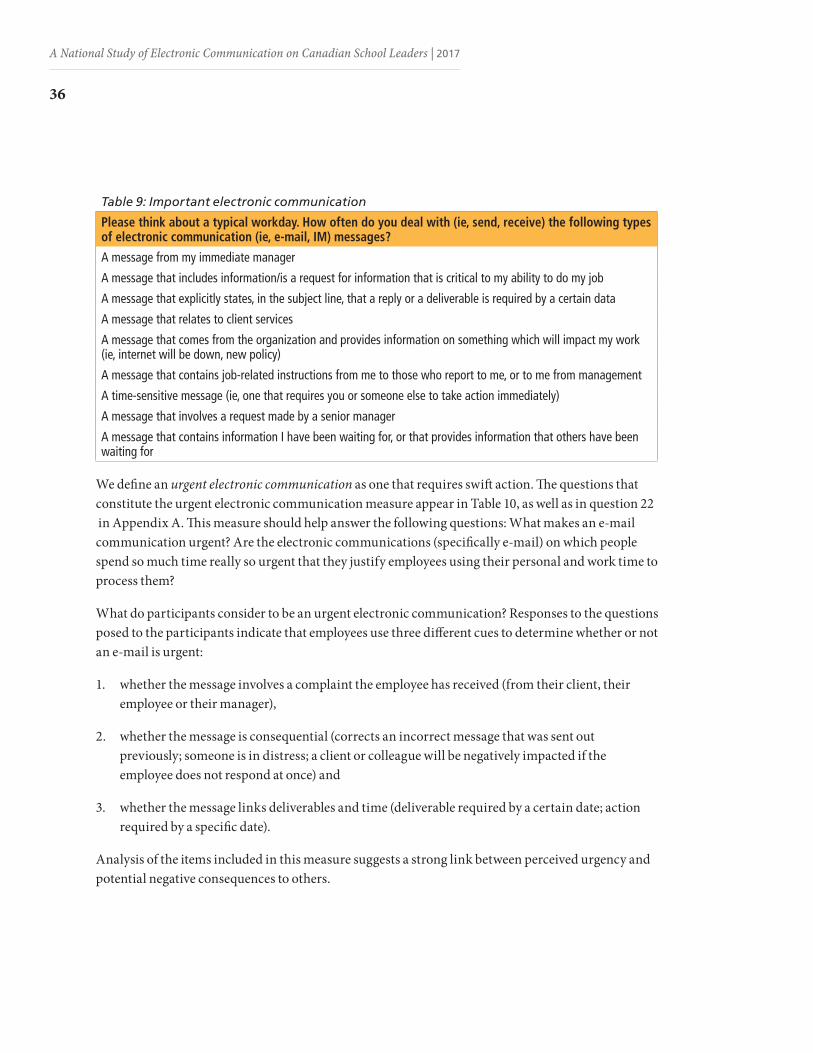
Table 9: Important electronic communication
Please think about a typical workday. How often do you deal with (ie, send, receive) the following types of electronic communication (ie, e-mail, IM) messages?
A message from my immediate manager
A message that includes information/is a request for information that is critical to my ability to do my job
A message that explicitly states, in the subject line, that a reply or a deliverable is required by a certain data
A message that relates to client services
A message that comes from the organization and provides information on something which will impact my work (ie, internet will be down, new policy)
A message that contains job-related instructions from me to those who report to me, or to me from management
A time-sensitive message (ie, one that requires you or someone else to take action immediately)
A message that involves a request made by a senior manager
A message that contains information I have been waiting for, or that provides information that others have been waiting for
We define an urgent electronic communication as one that requires swift action. The questions that constitute the urgent electronic communication measure appear in Table 10, as well as in question 22 in Appendix A. This measure should help answer the following questions: What makes an e-mail communication urgent? Are the electronic communications (specifically e-mail) on which people spend so much time really so urgent that they justify employees using their personal and work time to process them?
What do participants consider to be an urgent electronic communication? Responses to the questions posed to the participants indicate that employees use three different cues to determine whether or not an e-mail is urgent:
1. whether the message involves a complaint the employee has received (from their client, their employee or their manager),
2. whether the message is consequential (corrects an incorrect message that was sent out previously; someone is in distress; a client or colleague will be negatively impacted if the employee does not respond at once) and
3. whether the message links deliverables and time (deliverable required by a certain date; action required by a specific date).
Analysis of the items included in this measure suggests a strong link between perceived urgency and potential negative consequences to others.

ALBERTA TEACHERS’ ASSOCIATION
37
Table 10: Urgent electronic communication
Please think about a typical workday. How often do you deal with (ie, send, receive) the following types of electronic communication (ie, e-mail, IM) messages?
A message is a follow-up on a complaint from a client
A message is a follow-up on a complaint from an employee
A message is a follow-up on a complaint from my manager
A message involves someone who is in distress
A message involves trying to track down someone that you need to talk to urgently
A message involves correcting an incorrect message that was sent out previously (eg, wrong information was sent to someone)
A message relates to an issue where a client is (or will be) negatively impacted (especially if you do not respond)
A message involves sensitive issues (eg, colleague is fired; client, colleague, student is emotional)
Data showing the mean urgent and important electronic communication scores for the principals in the sample are shown in Table 11. Distributions scores are shown in Figures 15 (importance) and 16 (urgency). These data support the following observations. The CAP sample mean score for important electronic communication suggests that the CAP respondents process a moderate number of important e-mails each week. The data in Figure 15 support this conclusion: half of the CAP respondents perceive the e-mails they process each week to be moderately important.
Table 11: Subjective electronic communication demands on CAP members
Electronic Communication by Type Non-CAP Sample
Mean (SD)
CAP Mean (SD)
Important Electronic Communication Urgent Electronic Communication
2.9 (0.7) 1.9 (0.7)
2.9 (0.7) 2.1 (0.6)
E-mail overload 3.2 (1.0) 3.6 (0.7)

A National Study of Electronic Communication on Canadian School Leaders | 2017
38

ALBERTA TEACHERS’ ASSOCIATION
39
While most of the CAP sample perceive the e-mails they process to be of moderate or high importance, relatively few perceive the messages to be urgent. The CAP sample mean score for urgent electronic communication was 2.1 (SD 0.6), suggesting that the respondents in our CAP sample do not feel that many of the e-mails they process are urgent. This conclusion is consistent with the distribution data in Figure 16, which show that 75 per cent of respondents consider the electronic communications they handle in a typical week to be of low urgency. Only 3 per cent of the principals assigned high urgency ratings to the e-mails they process. Therefore, the e-mail related to supplementary work at home seems to be triggered more by the volume of communications processed in a typical workweek and the importance of the communications, not the urgency.
The originator of the e-mail factors into employees’ perception of its importance and urgency. The data in Table 12 show that the principals in our sample rarely process e-mails sent by government officials or school trustees. They also do not often deal with either complaints or compliments about their school. It is noteworthy, though, that principals receive e-mails from sales representatives more often than any others. School systems or jurisdictions may want to find a way to reduce such e-mails.
Table 12: Digital communication questions requested by CAP
Please think about a typical workday. How often do you deal with (ie, send, receive) the following types of digital communication (ie, e-mail, IM) messages?
Mean (SD)
A message from the superintendent 2.3 (0.9)
A message from government officials 1.8 (0.8)
A message from a school trustee 1.4 (0.6)
A message from a community member 2.0 (0.7)
A message from a sales representative 2.4 (1.0)
A message that is a complaint about your school 1.7 (0.7)
A message that is a compliment about you or your school 1.7 (0.7)
PROPORTION OF ELECTRONIC COMMUNICATION CLASSIFIED AS “URGENT” VERSUS “IMPORTANT”Also included in the survey was a question to gather respondents’ opinions on the proportion of electronic communication they received in a typical day that they considered to be
• important but not urgent,
• urgent but not important,
• urgent and important, and
• neither important nor urgent.
This measure was included to lend support to the validity of the study’s findings. Responses to this question are summarized in Table 13 and shown visually in Figure 17. These data show that the CAP

A National Study of Electronic Communication on Canadian School Leaders | 2017
40
respondents consider 40 per cent (SD 21.5) of e-mails they receive to be important but not urgent; another 30 per cent (SD 20.6) of e-mails are neither important nor urgent. These numbers align fairly closely with the important and urgent electronic communication scores obtained.
As noted earlier, the CAP respondents report spending a significant amount of time devoted to e-mail each week. The data in this section suggest that much of this time may be spent processing e-mails that are not important.
Table 13: Proportion of electronic communication received
Non-CAP Sample Mean (SD)
CAP Mean (SD)
Important (but not urgent) 40.5 (23.4) 40.3 (21.5)
Urgent (but not important) 14.9 (11.2) 14.7 (9.3)
Urgent and important 16.4 (14.3) 15.1 (11.8)
Neither important nor urgent 29.6 (23.9) 30.4 (20.6)

ALBERTA TEACHERS’ ASSOCIATION
41
E-MAIL OVERLOADE-mail overload is a specific type of information overload and is “defined as a condition in which the volume of information exceeds a person’s capacity to process it” (Thomas et al 2006, 255). Inclusion of this measure in this study enables examination of the relationship between time spent dealing with important and urgent e-mails and e-mail overload. Other possible predictors of e-mail overload in our study include the number of e-mails sent and received in a given day, the amount of time spent in e-mail on a typical workday, and the amount of time spent in e-mail on a typical non-workday.
Inclusion of this construct in this study also allows for examination of the extent to which e-mail overload predicts total levels of role overload, a construct known to be linked to the outcomes of interest (perceived stress, job stress, absenteeism and intent to turnover). Findings with respect to e-mail overload are shown in Figure 18. Analysis determined that the CAP respondents report moderately high mean scores for e-mail overload. The results show that 60 per cent of the principals reported high levels of e-mail overload and 30 per cent reported moderate levels of e-mail overload. These findings are consistent with the high number of hours per week that the sample spent on e-mail.

A National Study of Electronic Communication on Canadian School Leaders | 2017
42
SUMMARY—KEY FINDINGS WITH RESPECT TO E-MAIL USEThe objective data indicate that principals spend a lot of time on work-related e mail. The respondents in the CAP sample reported spending just over 11 hours per week (or 20 per cent of their work time) dedicated to e-mail at work and 6 hours dedicated to e-mail in supplementary work at home. In total, principals in the CAP sample reported spending approximately two workdays per week in e-mail related activities. They send and receive over 110 e-mails a day when working at the school and another 26 e-mails when in their home. The number of e-mails processed by the principals in the CAP sample was substantially higher than the number reported by employees in the non-CAP sample.
The subjective data indicate that the principals in the CAP sample evaluate the importance and urgency of the e-mails they process in a similar way as do those in the non-CAP sample. At the same time, the mean e-mail overload score for the CAP sample is significantly higher than that of the non-CAP sample. The difference is even more drastic when looking at the distribution of scores, which shows that the principals are far more likely than their counterparts in the non-CAP sample to report high levels of e-mail overload.
These results are somewhat troubling, given that about 30 per cent of the e-mails that CAP respondents process were perceived to be of low importance and about 70 per cent were considered to be of low urgency. This suggests that the high levels of e-mail overload observed in the CAP sample connect more to the volume of e-mails and the perceived importance of the e-mail than to the “real” urgency of such communications.
ALBERTA TEACHERS’ ASSOCIATION
43
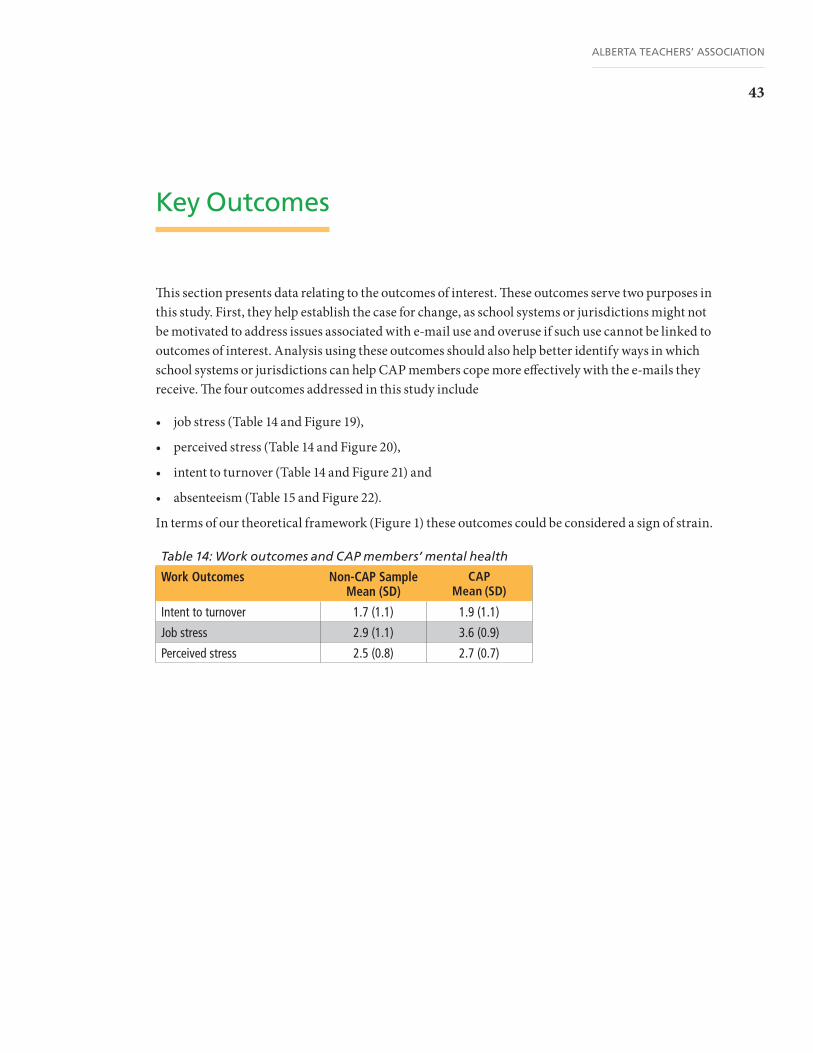
This section presents data relating to the outcomes of interest. These outcomes serve two purposes in this study. First, they help establish the case for change, as school systems or jurisdictions might not be motivated to address issues associated with e-mail use and overuse if such use cannot be linked to outcomes of interest. Analysis using these outcomes should also help better identify ways in which school systems or jurisdictions can help CAP members cope more effectively with the e-mails they receive. The four outcomes addressed in this study include
• job stress (Table 14 and Figure 19),
• perceived stress (Table 14 and Figure 20),
• intent to turnover (Table 14 and Figure 21) and
• absenteeism (Table 15 and Figure 22).
In terms of our theoretical framework (Figure 1) these outcomes could be considered a sign of strain.
Table 14: Work outcomes and CAP members’ mental health
Work Outcomes Non-CAP Sample Mean (SD)
CAP Mean (SD)
Intent to turnover 1.7 (1.1) 1.9 (1.1)
Job stress 2.9 (1.1) 3.6 (0.9)
Perceived stress 2.5 (0.8) 2.7 (0.7)
Key Outcomes
A National Study of Electronic Communication on Canadian School Leaders | 2017
44
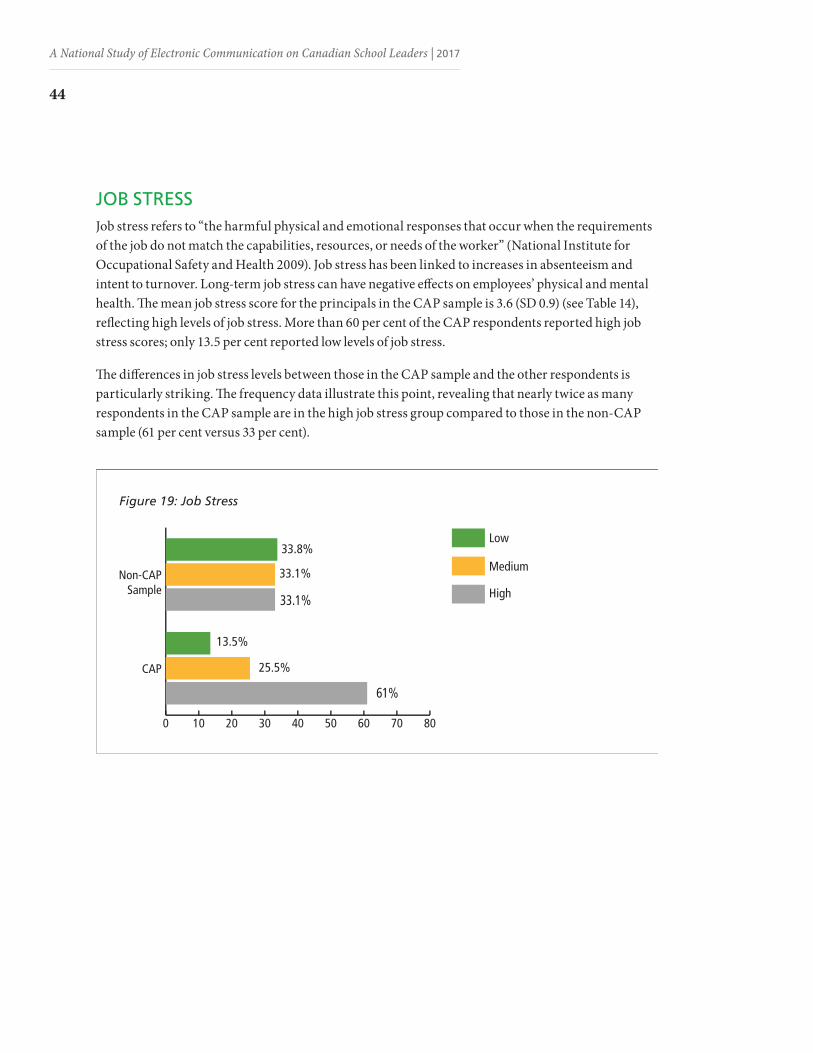
JOB STRESSJob stress refers to “the harmful physical and emotional responses that occur when the requirements of the job do not match the capabilities, resources, or needs of the worker” (National Institute for Occupational Safety and Health 2009). Job stress has been linked to increases in absenteeism and intent to turnover. Long-term job stress can have negative effects on employees’ physical and mental health. The mean job stress score for the principals in the CAP sample is 3.6 (SD 0.9) (see Table 14), reflecting high levels of job stress. More than 60 per cent of the CAP respondents reported high job stress scores; only 13.5 per cent reported low levels of job stress.
The differences in job stress levels between those in the CAP sample and the other respondents is particularly striking. The frequency data illustrate this point, revealing that nearly twice as many respondents in the CAP sample are in the high job stress group compared to those in the non-CAP sample (61 per cent versus 33 per cent).

ALBERTA TEACHERS’ ASSOCIATION
45
PERCEIVED STRESSPerceived stress is defined as “the extent to which one perceives one’s situation to be unpredictable, uncontrollable and burdensome” (Duxbury and Higgins 2012, 55). Perceived stress has been linked to absenteeism, intent to turnover and job dissatisfaction. CAP respondents reported moderate levels of stress.2 The distribution of the CAP sample stress scores show that stress was positively skewed, with nearly 90 per cent of the sample reporting high or moderate stress scores. Only 11 per cent of the principals surveyed reported low levels of perceived stress.
Although the mean perceived stress for the CAP sample is higher than for the non-CAP sample, the distribution shows that principals are less likely to be in the high perceived stress group than other respondents. In this case, the higher mean score can be attributed to the CAP sample being less likely to report low perceived stress and more likely to report medium perceived stress scores.
2 Because people tend to underreport their stress levels, this scale uses a score of 2.8 and above to delineate high levels of stress. This cut-off point was developed using population norms.

A National Study of Electronic Communication on Canadian School Leaders | 2017
46
INTENT TO TURNOVERIntent to turnover refers to “an individual’s desire to leave an organization” (Duxbury and Higgins 2012, 47). Turnover results in the loss of experienced workers, which in turn creates costs in retraining new workers and in possible decreases in morale as other employees have to work harder to compensate for the loss. While the mean intent to turnover score for the CAP sample is low (mean of 1.9 and SD of 1.1), the data shown in Figure 21 indicate that more than half of the principals in the sample consider leaving their organization at least once per month. The respondents in the principal sample report higher levels of intent to turnover than the non-CAP sample. This level of intent to turnover is problematic given the position of responsibility that these individuals occupy.
The strong link between high intent to turnover and low employee engagement is also worth consideration. While these principals may not leave their jobs, the frequency with which the majority of the respondents consider leaving their employment might have negative effects on the school environment, as leaders transmit “culture” through their own behaviour.

ALBERTA TEACHERS’ ASSOCIATION
47
ABSENTEEISMAlthough there are certainly some positives to absenteeism (eg, avoids the spread of illness, provides time to recover from fatigue), excessive absenteeism can be very costly for an organization in terms of productivity. In addition, it may be symptomatic of other issues in the workplace.
This study examined four types of absenteeism: absences related to illness, child care, elder care and fatigue (physical, emotional and mental). Data on the respondents’ absenteeism are presented in Table 15.
More than half of the CAP respondents reported that they were absent because of poor health, one-third reported child-related absences, one-fifth reported absences related to eldercare and nearly 40 per cent reported absences due to mental or physical fatigue. On average, CAP respondents missed about one day of work in a six-month period because of eldercare, childcare and emotional fatigue and nearly three days in a six-month period due to illness. Focusing exclusively on those who were absent due to the specific reasons provides further insight. With this parameter considered, in a six-month period respondents missed about three days of work due to emotional fatigue, nearly five days to attend to child care and/or ill health, and about three days due to elder care. These levels of absenteeism are notable.
Principals are more likely than their counterparts in the non-CAP sample to be absent for three of the four kinds of absenteeism explored in this study (fatigue—for which there is no difference—is the exception). The mean scores indicate that principals are absent due to child care more often than those in the non-CAP sample. The means for only those who were sick for a given reason suggest that principals have fewer absences than the non-CAP sample for health reasons and elder care. There was no difference between the samples in terms of fatigue-related absences.
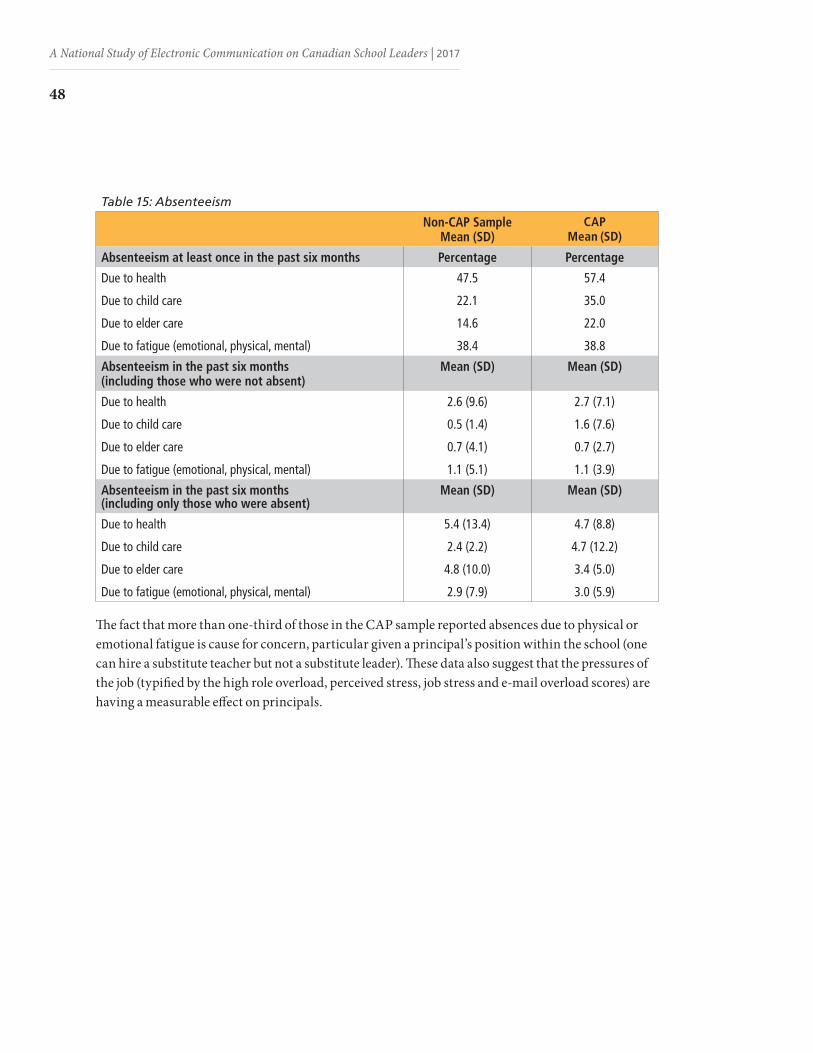
A National Study of Electronic Communication on Canadian School Leaders | 2017
48
Table 15: Absenteeism
Non-CAP Sample Mean (SD)
CAP Mean (SD)
Absenteeism at least once in the past six months Percentage Percentage
Due to health
Due to child care
Due to elder care
Due to fatigue (emotional, physical, mental)
47.5
22.1
14.6
38.4
57.4
35.0
22.0
38.8
Absenteeism in the past six months (including those who were not absent)
Mean (SD) Mean (SD)
Due to health
Due to child care
Due to elder care
Due to fatigue (emotional, physical, mental)
2.6 (9.6)
0.5 (1.4)
0.7 (4.1)
1.1 (5.1)
2.7 (7.1)
1.6 (7.6)
0.7 (2.7)
1.1 (3.9)
Absenteeism in the past six months (including only those who were absent)
Mean (SD) Mean (SD)
Due to health
Due to child care
Due to elder care
Due to fatigue (emotional, physical, mental)
5.4 (13.4)
2.4 (2.2)
4.8 (10.0)
2.9 (7.9)
4.7 (8.8)
4.7 (12.2)
3.4 (5.0)
3.0 (5.9)
The fact that more than one-third of those in the CAP sample reported absences due to physical or emotional fatigue is cause for concern, particular given a principal’s position within the school (one can hire a substitute teacher but not a substitute leader). These data also suggest that the pressures of the job (typified by the high role overload, perceived stress, job stress and e-mail overload scores) are having a measurable effect on principals.

ALBERTA TEACHERS’ ASSOCIATION
49
SUMMARY—OUTCOMESThe majority of the CAP respondents report low intent to turnover; still, more than half of them consider leaving their organization at least once per month, and more than one in five indicate high intent to turnover (consider leaving at least weekly). Further, the CAP sample’s level of intent to turnover is higher than that of the non-CAP sample.
Absenteeism due to emotional and mental fatigue and ill health is common in the CAP sample. Also notable are the data showing that high levels of job stress and perceived stress are experienced by about half of the principals in the CAP sample. Overall, these data indicate that the principalship might have negative effects on the health and well-being of many of those in the role. If not addressed, such issues might lead to succession planning crises in school districts in the next several years, particularly if the Baby Boomers currently occupying many of these positions retire and the job conditions make it difficult to recruit strong candidates to the positions.

A National Study of Electronic Communication on Canadian School Leaders | 2017
50
Key Findings: Predictors and Outcomes
This section of the report first explores the relationship between e-mail overload and the objective and subjective indicators of e-mail use. Then, linear regression is employed to determine the key predictors of e-mail overload, role overload, job stress, perceived stress and absenteeism.
RELATIONSHIPS BETWEEN E-MAIL USE AND E-MAIL OVERLOAD: OBJECTIVE MEASURESThe data in Figures 23 and 24 show that e-mail overload is more of a function of the number of e-mails processed on a typical workday than the number processed on a non-workday. Both numbers are, however, significant predictors of e-mail overload for the CAP sample. The scatter plot indicates that—in both cases—the more e-mails the principal processes, the higher their perception of e-mail overload.
Figure 23: E-mail overload and total number of e-mails sent and received on a typical workday
The data in Figure 25 indicate that e-mail overload is also strongly and positively associated with the number of hours per week principals spend processing e-mail, both at work and at home.
Examination of the scatter plots supports two conclusions. First, hours per week spent processing e-mail is a stronger predictor of e-mail overload than the number of messages processed—this
E-mail overload
Tota
l e-m
ails
sent
and
rece
ived
on
a wor
kday

ALBERTA TEACHERS’ ASSOCIATION
51
seems intuitive, given that different types of e-mail require varying amounts of time. Second, those in the CAP sample who spent 20 hours or more per week processing e-mails (at work and at home) experienced high levels of e-mail overload.
Figure 24: E-mail overload and total number of e-mails sent and received on a typical non-workday
Figure 25: E-mail overload and total hours spent on e-mail per week
E-mail overload
Tota
l e-m
ails
sent
and
rece
ived
on
a non
-wor
kday
E-mail overload
Tota
l hou
rs sp
ent o
n e-
mai
l

A National Study of Electronic Communication on Canadian School Leaders | 2017
52
RELATIONSHIPS BETWEEN E-MAIL USE AND E-MAIL OVERLOAD: SUBJECTIVE MEASURESThe data in Figures 26 and 27 (obtained using chi-square analysis) support a number of conclusions. First, e-mail overload is strongly associated with the perceived importance of the e-mail messages that one is expected to process. Second, e-mail overload is related to the perceived urgency of the e-mail messages that one is expected to process.
3 The “medium urgent e-mail” category was included in Figure 27 in order to show the relationship, as there was a very small percentage of e-mail considered to be highly urgent.

ALBERTA TEACHERS’ ASSOCIATION
53
PREDICTION OF KEY OUTCOMESRegression analysis was performed to determine the key predictors of the key outcomes included in this study. In statistics, linear regression is an approach for modelling the relationship between a scalar dependent variable (ie, outcomes) and one or more explanatory variables (or independent variables or predictors). The results of this analysis are shown in Table 16. Included in this table are the following statistics:
• R2, which reflects the amount of variation in the construct explained by the variables included in the regression. For example, the R2 in row one of Table 16 can be interpreted to mean that 13 per cent of the variation in e-mail overload can be explained by the six predictor variables listed in row one, column four.
• β represents the standardized regression coefficient. βj is the expected change in y for a one-unit change in xj when the other covariates are held fixed. This is sometimes called the unique effect of xj on y. The higher the β, the stronger relationship between this dependent variable and the outcome of interest, in this case e-mail overload.
• ∝ represents significance. Values below .05 typically indicate statistical significance. The first ∝ (column 3) refers to the significance of the prediction. The second ∝ (column) relates to the significance of the β coefficient.
E-mail overload is strongly associated with the perceived importance of the e-mail messages that one is expected to process.

A National Study of Electronic Communication on Canadian School Leaders | 2017
54
Table 16: Prediction of key outcomes
Outcome R2 ∝ Predictor β ∝E-mail overload .13 .000 Total e-mails sent/received: workday
Total e-mails sent/received: non-workdayHours per week in e-mail: workdayHours per week in e-mail: non-workdayImportant e-mailUrgent e-mail
.12-.01.15.05.17.05
.001ns
.000ns
.000ns
Role overload .44 .000 Hours per week in work-related activities: workHours per week in supplementary work at homeE-mail overloadRole conflictRole ambiguityControl over work
.10
.06
.28
.28
.27-.26
000.020.000.000ns
.000
Job stress .40 Hours per week in work-related activities: workHours per week in supplementary work at homeE-mail overloadRole conflictRole ambiguityControl over workRole overload
.01-.003.12.17.08
-.004.42
nsns
.000
.000
.004.ns
.000
Perceived stress .42 Hours per week in work-related activities: workHours per week in supplementary work at homeE-mail overloadRole conflictRole ambiguityControl over workRole overload
-.02-.04.10.16.19-.09.35
nsns
.000
.000
.000
.001
.000
The following conclusions can be drawn from the data in Table 16:
E-MAIL OVERLOAD
E-mail overload is a function of a principal’s perception of the importance of the e-mails they process and the total number of e-mails they process during a typical workday, as well as the number of hours they spend processing e-mail on workdays in a given week. These three factors are all equally important predictors of e-mail overload. Notably, the total number of e-mails processed on a non-workday does not predict e-mail overload; urgency was also not a significant predictor for this sample. The major difference between the CAP sample and the non-CAP sample was the analysis showing that for the non-CAP sample—but not for the sample of principals—urgency was the biggest predictor of e-mail overload (β of .27, Sig. of .000).

ALBERTA TEACHERS’ ASSOCIATION
55
These results indicate that e-mail overload is a function of the volume and perceived importance of e-mail for principals. But why should employers care about e-mail overload? The answer to this question is explored below.
E-MAIL OVERLOAD AND ROLE OVERLOAD
As noted earlier, higher levels of role overload have been found to be positively associated with negative consequences to the employee (eg, a decline in employee well-being) and, ultimately, the organization’s effectiveness.
One of the most important predictors of role overload was e-mail overload (β of .28), which was about equal to role conflict as a predictor. Role ambiguity was not found to be a significant predictor. Consistent with Karasek’s model, control over work was found to be negatively associated with role overload (β of -.26), meaning that—when the other variables included in this equation are taken into account—role overload is lower when the employee has higher levels of control over work.
Other significant predictors of role overload include hours in work per week and hours in supplementary work at home per week. It should be noted, however, that these objective measures of demand are not as strong predictors of role overload as are the subjective indicators, such as e-mail overload and role conflict.
The only difference of note between the two samples with respect to role overload is that respondents in the non-CAP sample reported e-mail overload as an even more important predictor of role overload than did those in the CAP sample.
Role overload is a significant predictor of two indicators of CAP members’ well-being included in our study: job stress (40 per cent of variation explained) and perceived stress (42 per cent of variation explained).
JOB STRESS
Job stress is a function of role overload above all else (β of .42) for the CAP sample. Job stress also increases with increases in e-mail overload and role conflict. Job stress is not significantly associated with hours in work per week, hours in supplementary work at home per week or control over work. It is, however, positively associated with role ambiguity. In other words, the more overloaded a CAP member feels (whether because they are overwhelmed by their work demands, by the amount and type of e-mail they process during the day, by role conflict, and/or by lack of role clarity) the higher his or her level of job stress. Finally, control over work does not seem to help prevent job stress for those with high levels of role overload and role conflict.
A National Study of Electronic Communication on Canadian School Leaders | 2017
56
PERCEIVED STRESS
Perceived stress is also a function of role overload above all else (β of .35) for the CAP sample. Other, albeit not as strong, predictors of perceived stress include role conflict, role ambiguity and e-mail overload (ie, subjective indicators of demands). While the two objective indicators of high work demand included in our analysis (hours in work per week and hours per week in supplementary work at home) predict levels of CAP member’s stress, the relationship is not as strong as was observed for the subjective indicators. Finally, more control over work seems to help principals cope with stress (β -.09).
DIFFERENCES BETWEEN SAMPLES
The following key differences can be noted between the CAP sample and the non-CAP sample. The relationship between hours in work and stress (β of -.15) was stronger in the non-CAP sample than in the CAP sample. Similarly, there was a stronger negative relationship between control over work and stress (β of -.19) in the non-CAP sample than in the CAP sample. Perceived stress was also less of a function of role overload for those in the non-CAP sample than it was in the CAP sample (β of .15).

ALBERTA TEACHERS’ ASSOCIATION
57
The interview phase of this study entailed the researchers asking participants questions to better understand how employees and employers can more effectively manage work-related electronic communication. This section of the report summarizes key findings relating to this issue.
At the beginning of this study, 29 interviews were conducted (14 at a college and 15 at a private sector firm) to collect information on urgent and important e-mails and to gather suggestions from the participants on dealing with work-related e-mail. The interviews took approximately 25 minutes for participants at the college and 45 minutes for the participants at the private sector firm.
This phase of the study did not include respondents from the CAP sample; however, select findings are reported here to provide some insight into the effects of e-mail on work life and into possible approaches to mitigate e-mail overload and, therefore, role overload. Of particular relevance are the participant responses to the following two questions:
“What one workplace change would help you better manage your use of electronic communication?” “What one personal change would help you better manage your use of electronic communication?”
Responses were content coded.
WORKPLACE CHANGESIn total, participants identified 28 different workplace changes that they felt would help them better manage their use of electronic communication. A significant number of the responses related to the following:
EXPECTATIONS
It would be helpful if
• the expectations regarding how quickly employees respond to messages were lowered (ie, access to e-mail should not result in an expectation to check and answer e-mails immediately) and
• additional staff were available to handle some of the e-mail load, at least during peak hours (ie, hiring a floater to respond to any straightforward e-mails).
Effective Management of Work-Related Electronic Communications
A National Study of Electronic Communication on Canadian School Leaders | 2017
58
TECHNOLOGY
It would be helpful if the organization
• invested in better spam blockers, as a lot of industry spam is still being received;
• had a more reliable wireless system; and
• developed a filter that separated messages into different inboxes—for instance, students’ e-mail from colleagues’ e-mail.
TRIAGING ELECTRONIC COMMUNICATIONS
A number of comments were subsequently categorized as “triaging electronic communication.” These comments all related to respondents feeling overwhelmed by the volume of work-related e-mails they were receiving and indicated that respondents needed the organization to help them manage messages. In particular, respondents noted that, because there were too many places that they were expected to monitor for messages (eg, Facebook, LinkedIn, Yammer, multiple e-mail accounts), the system was difficult to navigate. This also resulted in difficulty finding specific messages processed earlier and in receiving duplicate messages. The following typify the kinds of participant responses related to triaging electronic communications:
You can spend the whole day deciding what to read and what’s important and never get anything done.
Why can’t our system know that the user is looking at certain things and have them available? Facebook can do it, Google can do it. Maybe we should outsource to Google or Facebook to set up that kind of functionality within our organization.
The search function at work doesn’t help find messages that I have archived or put in a folder. Bing and Google seem to work very well. They understand how your brain works rather than you having to figure out the software.
Would help if they would organize the newsletter better so that the important stuff is easier to find (maybe put the new information at the top). A lot of time is spent (wasted) reading through older and unimportant stories to get to important ones.
TRAINING
Many respondents expressed frustration that the functionality of the technology was negated by people not knowing how to use their e-mail software correctly.
It would be helpful if the organization offered
• an e-mail webinar that would educate employees on how to better manage e-mail and on the e-mail tools they can use to organize their messages,

ALBERTA TEACHERS’ ASSOCIATION
59
• electronic communication etiquette training that would educate employees about when it is appropriate to send an e-mail, and
• training on how to write a “good e-mail message” (eg, improve clarity).
POLICIES
It would be helpful if the organization
• developed, implemented and enforced a set of policies around the management of electronic communication within the company.
Specific suggestions on policies included the following:
• create a consistent, clear messaging structure for sending items out;
• create policy regarding who should send messages, when and to whom (eg, policy on sending e-mails after work hours; policy on cc’ing those not affected by a message);
• create guidelines regarding requests for information and retractions of such requests; and
• create policy on how many sources one should contact asking for the same information.
Participants also suggested that enforcement of any policies established was important. For instance, reminders related to the who, what, when and to whom of proper e-mail use could be productive.
PERSONAL CHANGESParticipants identified 21 different ways in which they could make personal changes to better manage their use of electronic communication. Most comments related specifically to improving strategies related to managing e-mail and coping with e-mail overload.
Personal strategies to better manage their e-mail communication included
• become better at deleting messages,
• become more disciplined about setting up a specific time to respond to and manage e-mails,
• try to wait a certain amount of time (eg, an hour) before responding to e-mail to minimize the likelihood of sending follow-up e-mails pre-emptively,
• change the ring tone on personal phone to distinguish between personal and work e-mails,
• learn how to use and then employ the filtering system to have e-mails automatically go into specified folders instead of the inbox, and
• organize e-mails into folders upon receipt.

A National Study of Electronic Communication on Canadian School Leaders | 2017
60
Personal strategies to manage information overload included
• make an effort to avoid multitasking,
• shut down e-mail system during weekends and vacations,
• stop checking personal phone for e-mail (especially during meetings),
• take work-related e-mail off personal phone,
• use the “Do Not Disturb” status for IM when too busy to take messages,
• set a time aside each day to manage e-mails,
• engage in stress-reduction activities, and
• eliminate nonessential e-mail accounts.
SUMMARYParticipants commented that expectations regarding e-mail are unrealistic and/or unclear. Employees would like more help to manage their e-mail load. In proposing ways to reduce e-mail overload, nearly all of the respondents suggested increasing administration around e-mail (eg, training, policies and enforcement). In addition, nearly all respondents observed the need for personal discipline to stop multitasking while working and to avoid processing work-related e-mail during nonwork hours.

ALBERTA TEACHERS’ ASSOCIATION
61
PRINCIPALS’ E-MAIL USE The following conclusions can be drawn with respect to e-mail use by the principals who participated in the study.
The principals in the CAP sample reported spending a considerable amount of their time processing e-mail. In fact, the data from this study show that just over one-third of CAP respondents’ total workweek is spent processing e-mail. Time processing work-related e-mails does not occur just at work. The data from this study show that more than half of the time spent by CAP members in supplementary work at home is devoted to processing e-mail. In terms of volume, respondents in the CAP sample process approximately 112 e-mails each day at work and an additional 27 e-mails at home.
An important electronic communication is one that the employee perceives to have great significance, consequence or value. An urgent electronic communication is one that requires swift action. The following observations regarding important and urgent e-mails can be made:
• Most of the e-mails that the principals in the CAP sample process are perceived by the recipient to be of moderate or high importance.
• Relatively few e-mails that the principals in this CAP sample process are perceived to be urgent.
• The CAP respondents consider nearly one-third of the e-mails they process to be neither important nor urgent.
These data support the following conclusion: the high amount of time spent processing work-related e-mails by the individuals in the CAP sample is triggered by the volume of communications processed in a typical workweek and the importance of the communications, not the urgency.
Conclusions and Recommendations

A National Study of Electronic Communication on Canadian School Leaders | 2017
62
E-MAIL OVERLOAD E-mail overload is a specific type of information overload, “defined as a condition in which the volume of information exceeds a person’s capacity to process it” (Thomas et al 2006, 255). More than 60 per cent of the respondents in the CAP sample reported high levels of e-mail overload. Based on the data, the following conclusions can be drawn with respect to the relationship between e-mail overload and e-mail communications:
• E-mail overload is a function of the number of e-mails sent and received on a typical workday. The more e-mails a principal processes at work, the higher the e-mail overload.
• E-mail overload is also strongly and positively associated with the number of hours per week a principal spends processing e-mail at work. The more hours a principal spends processing e-mails at work, the higher the e-mail overload.
• Hours spent in e-mail per week is a stronger predictor of e-mail overload than the number of messages sent and received per week—a finding that makes intuitive sense given that it takes varying amounts of time to deal with different types of e-mails.
• Principals who spend 20 hours or more per week processing e-mails will likely experience high levels of e-mail overload.
• E-mail overload is strongly associated with the perceived importance of the e-mail messages that one is expected to process.
• E-mail overload is only moderately related to the perceived urgency of the e-mail messages that one is expected to process.

ALBERTA TEACHERS’ ASSOCIATION
63
RELATIONSHIP BETWEEN E-MAIL USE AND WELL-BEING The following observations regarding the relationship between e-mail use and employee well-being can be made:
• More than 60 per cent of the principals in the CAP sample reported high levels of job stress, and more than 70 per cent reported high levels of role overload.
• Nearly half of the principals reported high levels of perceived stress, and another 40 per cent reported moderate levels of perceived stress.
• Intent to turnover is fairly high in the CAP sample, with more than 20 per cent of the respondents indicating that they consider leaving their current school system or jurisdiction at least once per week.
• Absenteeism due to emotional and mental fatigue and ill health is common, and the number of days taken off per year due to ill health can be considered high.
When examining outcomes of interest, the following conclusions can be drawn from the data:
• Higher levels of role overload have been found to be positively associated with negative consequences to the employee (declines in employee well-being) and the organization’s effectiveness.
• The most important predictors of role overload were e-mail overload and role conflict.
• Control over work was found to be negatively associated with role overload.
• Hours in work per week and hours in supplementary work at home per week were significant predictors of role overload. Yet, these objective measures of demand are less strong as predictors of role overload than the subjective indicators, such as e-mail overload and role conflict.
• Role overload is a significant predictor of two indicators of CAP members’ well-being: job stress and perceived stress.
• Job stress is a function of role overload above all else. Job stress also increases with increases in e-mail overload and role conflict. Job stress is not significantly associated with hours in work per week, hours in supplementary work at home per week or control over work. It is, however, positively associated with role ambiguity.
• Perceived stress is a function of role overload above all else. Other predictors of perceived stress include role conflict, role ambiguity and e-mail overload.
• Hours in work per week and hours per week in supplementary work at home did not significantly predict levels of principals’ stress.
• Higher control over work helps principals cope with stress.

A National Study of Electronic Communication on Canadian School Leaders | 2017
64
RECOMMENDATIONSThe data show a strong link between time spent in e-mail at work and e-mail overload for principals. E-mail overload, in turn, is strongly associated with role overload, job stress and perceived stress. Given these relationships, it is important that school systems or jurisdictions determine how best to help principals manage e-mail overload.
The volume of messages and the perceived importance of the message drive e-mail overload, role overload and stress. At the same time, perceptions of control over one’s work help principals cope with the demands they face. Based on these results, we recommend that school systems or jurisdictions work to reduce the volume of e-mail that principals have to process in a given week through the use of appropriate policies, training and enforcement, as suggested by our interview participants. Appropriate policies and training should reduce the volume of e-mails received and, hence, the amount of time that principals need to devote to e-mail. Policies could also clear up ambiguities around e-mail expectations and instill in principals a greater sense of control over the times and the manner in which they process e-mail.
School systems or jurisdictions can also help manage principals’ e-mail overload by supporting personal changes. That is, organizations can encourage employees to set parameters around their use of e-mail at work and at home. If, as some participants suggested, stress-reduction activities might alleviate e-mail overload, school systems or jurisdictions could also promote opportunities for activities that foster wellness. Key for organizations wanting to lessen e-mail overload is the recognition that changing personal interactions with e-mail is difficult and needs to be reinforced by the organizational culture. For instance, no set of policies or personal changes will be successful if the school system or jurisdiction does not create an organizational culture that supports principals’ choice to avoid processing work-related e-mail at home.
Cultural shifts need to be led by and modelled at the top. Regardless of policy, an employee will likely not ignore a message sent by their supervisor or their supervisor’s supervisor after regular work hours—regardless of its perceived urgency. Cultural change also requires clear expectations on what constitutes appropriate and inappropriate e-mail, measurement of how people are actually using the system and the imposition of visible corrective actions when e-mail is being used inappropriately.
By alleviating e-mail overload, school systems or jurisdictions can begin to minimize role overload. This can lead to improved employee wellness, which may result in reduced stress, intent to turnover and absenteeism.

ALBERTA TEACHERS’ ASSOCIATION
65
THE INTERNATIONAL CONTEXTS OF THE IMPACT OF ELECTRONIC COMMUNICATION TOOLS
While this report focuses on the impact of electronic communication tools on the work life of Canadian school leaders, it also offers insights into the trends shaping the workplace nationally and internationally.
This study reinforces many of the conclusions of a growing body of research on the work life of school leaders. The Future of the Principalship in Canada: A National Study (Alberta Teachers’ Association 2014b, 11) found that the ubiquity of electronic communication tools was diminishing the quality of work life for principals in three key areas: the growing central management and surveillance of school operations, increasing expectations of parents and others to be available 24/7, and the pernicious use of social media among students—and in some cases among parents—that contributed to cyberbullying and the deterioration of school climates. On the international level, the TALIS 2013 Results: An International Perspective on Teaching and Learning, part of a series produced by the Organisation for Economic Co-operation and Development (2014), has helped to map the changing working conditions for school leaders as well as teachers. Policy pronouncements about the role of principals as instructional leaders are problematic given the reality that, in one study (ATA 2014a), school leaders struggled to find 6 hours in a 56-hour workweek to spend time in classrooms or in contact with teachers. The study also illustrated that 90 per cent of Canada’s school leaders report significant levels of work-related stress in a career that, while very rewarding, is increasingly unsustainable.
These challenges underscore many of the global policy trends of ongoing (and increasing) accountability, a growing authority dilemma, greater standardization of assessments, evaluation via fine-grained metrics (ie, data-driven decision making) and, overall, pressure to adopt a technocratic
Epilogue
The Greeks define two types of time: chronos and keiros. Chronos is regular, divisible time that can be measured in minutes, hours and years. Keiros is qualitative and measures moments and creative time. Keiros is essential for productive thinking, and good employers know they need to protect it.
—Linh Le
A National Study of Electronic Communication on Canadian School Leaders | 2017
66
approach to teaching and learning. These growing influences provide some of the context for the growing expectation that in many cases school leaders are available 24/7 to address the myriad factors that impact schools today. Moreover, these trends reinforce the conclusion of German sociologist Helga Nowotny (1994) that chronic “busy-ness” traps individuals in an “extended present”—spinning endlessly around the axis of now, at such a pace that we are unable to imagine or plan for the future. This offers a compelling description of the life of school leaders across Canada, and it points to potentially large gaps between the ideal and the reality when it comes to leadership priorities.
The proliferation of information and communication technologies, if ineffectively managed or regulated, can have an impact on the health of workers across all sectors. For example, in the UK, the amount of time people spend typing, texting, talking or gaming through smartphones, tablets and desktops is now more than time spent than sleeping (Miller 2014). Human capital experts argue that this constant supply of technology consumption can lead to decision paralysis due to increasing stress and lower productivity as people manage a broader range of data and communications and feel overwhelmed by feelings of never being able to disconnect from their work.
In a study (Teichmann et al 2013) of academic staff at a British university, the sources of pressure related to e-mail stress were examined with the pattern of emotional, cognitive and behavioural reactions in academic settings. Results suggest that e-mail stress was strongly related to workload and academics’ professional identity and personal life.
A comprehensive study (Future Work Centre 2015) in the UK of 2,000 people across a variety of industries, sectors and job roles made several conclusions about e-mail pressure and the impact of types of communication. The study found a moderate positive correlation between perceived e-mail pressure and negative work-to-home interference. Perceived e-mail pressure is significantly higher in people with caregiving responsibilities, which is well documented by work–life balance research literature on challenges when it comes to navigating the boundaries between work and home. The study found that individuals who rated e-mail more positively in terms of the flexibility it gives them and the productivity it facilitates were more likely to report higher levels of perceived e-mail pressure. This echoes the idea of e-mail as a double-edged sword—while respondents acknowledged the benefits of e-mail, they also experienced negative consequences.
ALBERTA TEACHERS’ ASSOCIATION
67
TAMING THE TIGER Due to pressure from the European Parliament, in 1999 the European Commission set out to analyze the additional psychosocial problems in the workplace not covered by existing legislation, such as stress, fatigue and aggression. In 2000, the commission presented the “Guidance on Work Related Stress,” which defined stress as “a pattern of emotional, cognitive, behavioral and physiological reactions to adverse and noxious aspects of work content, work organization and work environment” (cited in Natali et al 2008, 2). The guidance outlined important stress-prevention steps: (1) identification of work-related stress factors, their causes and health consequences; (2) analysis of the characteristics of exposures in relation to the outcomes; (3) design and implementation of intervention strategies by stakeholders; and (4) evaluation of short- and long-term results of interventions.
Evidence from Europe shows that working conditions increasingly play an important role in maintaining good mental health and lowering work stress (Leka and Kortum 2008). European stakeholders have worked toward creating a common set of regulations across Europe. Such regulation includes a European Working Time Directive that sets an 11-hour break every 24-hour period. Commentators have noted that the use of e-mail and texts and the ability to check them regardless of location and time can impede this regulation, compromising the duty of care that companies have to their employees.
While important progress has been made to advance the knowledge in relation to these issues, there are still gaps in the translation of this knowledge into effective practice at the enterprise level (Leka and Kortum 2008). Due to the many potential cofactors, establishing an appropriate methodology for stress evaluation is also difficult. Many of the European models for stress evaluation follow a holistic, global and participatory approach: the active role and the necessity of workers’ involvement should be emphasized.
Comparison of the European models, although limited due to sociocultural differences, offers ways into social dialogue to approach work stress assessment and prevention. For example, Italian legislation has introduced the mandatory assessment of work stress for each employer, while in France new laws on labour rights and conditions give employees the right to disconnect.4 In practice, this means employers will be required to set formal procedures to prevent work from encroaching on employees’ personal time. The French law builds on policies developed by German companies in conjunction with unions, such as Volkswagen’s policy of shutting down its e-mail servers after hours. Carmaker Daimler has also implemented a rule that employees are free to delete the messages they receive while on vacation.
4 Article 25 of France’s El Khmori Law, adopted in August 2016, introduces some measures that expand what constitutes a “normal” working week to 46 hours (but with rather generous compensation arrangements from the 36th hour onward), a financial ceiling for unjust dismissal and a redefinition of what unions can do in the case of disagreements and strikes.
A National Study of Electronic Communication on Canadian School Leaders | 2017
68
In the UK, the Trades Union Congress (TUC) shared skepticism over establishing measures that are not developed in consultation with employees. Suggesting that different organizations may need different solutions, union officials state that “where employers simply introduce policies on their own, however well-meaning they may be, they are unlikely to be successful” (BBC News 2011).
Despite the development of knowledge and activities on both the policy and practice levels in recent years, further work is also still needed to harmonize stakeholder perceptions in this area within EU member states (Iavicoli et al 2011). Initiatives that aim to promote workers’ health have not resulted in the positive impact experts and policy-makers anticipated (Leka et al 2008). At the organizational level, there is a clear need for the implementation of systematic and effective prevention strategies, linked to companies’ management practices (Leka et al 2010).
The international developments related to the impact of electronic communication tools on work life across several sectors—and ways governments have sought to implement legislation around these issues—provide important context for the Canadian study of school leaders. It is increasingly apparent from the research that the substantive issues related to the use of communication tools are rooted in organizational cultures and reflect broader societal contexts.
Two timely articles in the CAP Journal underscore the importance of understanding the impact of school culture, shaped by the principal, on work–life balance. In particular, a school climate that stresses the necessity of immediately responding to every request that appears urgent simply reflects the school leaders’ inability to model effective work–life balance (Swain 2017, 10). Focusing on e-mail, McCormack and Checkley (2017) offer practical strategies for managing the paradoxical emotional burdens associated with not responding to e-mail during “downtime,” while offering a thoughtful analysis of the impacts of the digital tether on stress and family life.
This study reinforces the need to continue to monitor and reflect on the work life of school leaders in increasingly digitally saturated environments. Future research efforts ought to consider the complex ecologies of schools nested in communities, as well as global changes, with technology continuing to grow in its influence and impact. In this respect we must remain mindful, as Marshall McLuhan reminds us, that we shape our tools and then our tools shape us. Therefore, future research ought to be grounded by the recognition that optimal conditions of practice for school leaders are not only critical to their work–life balance—the enduring benefits ultimately extend to the school-community that school leaders serve and to the success of students.
J-C Couture Associate Coordinator, Research
Alberta Teachers’ Association
ALBERTA TEACHERS’ ASSOCIATION
69
References
Alberta Teachers’ Association (ATA). 2014a. A Week in the Life of Alberta School Leaders. Edmonton, Alta: ATA.
———. 2014b. The Future of the Principalship in Canada: A National Study. Edmonton, Alta: ATA.
BBC News. 2011. “Volkswagen Turns Off Blackberry Email After Work Hours.” Available at http://bbc.in/2n7HObx (accessed March 15, 2017).
Buss, D M, and K H Craik. 1983. “The Act Frequency Approach to Personality.” Psychological Review 90, no 2: 105–26.
Cohen, S, T Kamarck and R Mermelstein. 1983. “A Global Measure of Perceived Stress.” Journal of Health and Social Behavior 24, no 4: 385–96.
Cook, J, S J Hepworth, T D Wall and P B Warr. 1981. A Compendium and Review of 249 Work Review Measures and Their Use. London: Academic Press.
Duxbury, L and C Higgins. 2012. Revisiting Work-Life Issues in Canada: The 2012 National Study on Balancing Work and Caregiving in Canada. Ottawa, Ont: Carleton University.
Dwyer, D J and D C Ganster. 1991. “The Effects of Job Demands and Control on Employee Attendance and Satisfaction.” Journal of Organizational Behavior 12, no 7: 595–608.
Future Work Centre. 2015. “You’ve Got Mail!” Available at www.futureworkcentre.com/wp-content/uploads/2015/07/FWC-Youve-got-mail-research-report.pdf or http://tinyurl.com/h6oast3 (accessed March 14, 2017).
Higgins, C A, L Duxbury and S T Lyons. 2010. “Coping With Overload and Stress: Men and Women in Dual-Earner Families.” Journal of Marriage and Family 72, no 4: 847–59.
Hogan, B, and D Fisher. 2006. “A Scale for Measuring E-Mail Overload.” Microsoft Research 7, no 9. Available at www.microsoft.com/en-us/research/wp-content/uploads/2016/02/tr-2006-65.pdf or http://tinyurl.com/mzvtnf5 (accessed March 3, 2017).
Iavicoli S, E Natali, P Deitinger, B Maria Rondinone, M Ertel, A Jain and S Leka. 2011. “Occupational Health and Safety Policy and Psychosocial Risks in Europe: The Role of Stakeholders’ Perceptions.” Health Policy 101, no 1: 87–94.

A National Study of Electronic Communication on Canadian School Leaders | 2017
70
Karasek, R A. 1979. “Job Demands, Job Decision Latitude, and Mental Strain: Implications for Job Redesign.” Administrative Science Quarterly 24, no 2: 285–308.
Karasek, R A, C Brisson, N Kawakami, I Houtman, P Bongers, and B Amick. 1998. “The Job Content Questionnaire (JCQ): An Instrument for Internationally Comparative Assessments of Psychosocial Job Characteristics.” Journal of Occupational Health Psychology 3, no 4: 322–55.
Karasek, R A and T Theorell. 1990. Healthy Work: Stress, Productivity, and the Reconstruction of Working Life. New York: Basic Books.
LaChapelle, N. 2008. The Structure of Concern: A Challenge for Thinkers. Lulu.com.
Leka, S, and E Kortum. 2008. “A European Framework to Address Psychosocial Hazards.” Journal of Occupational Health 50, no 3: 294–96.
Leka S, A Jain, G Zwetsloot and T Cox. 2010. “Policy-Level Interventions and Work-Related Psychosocial Risk Management in the European Union.” Work Stress 24, no 3: 298–307.
Leka S, A Jain, G Zwetsloot, M Vartia and K Pahkin. 2008. “Psychosocial Risk Management: The Importance and Impact of Policy Level Interventions.” In The European Framework for Psychosocial Risk Management: PRIMA-EF, ed S Leka and T Cox, 115–35. Nottingham, UK: Institute of Work, Health and Organisations. Available at www.prima-ef.org/uploads/1/1/0/2/11022736/prima-ef_ebook.pdf or http://tinyurl.com/lpgmpx2 (accessed March 15, 2017).
MacCormack, J and Checkley, D. 2017. “Waiting Until Monday: The Danger of Emailing During Downtime.” CAP Journal, winter: 12–14.
Miller, J. 2014. BBC News. “Britons Spend More Time on Tech Than Asleep, Study Suggests.” www .bbc.co.uk/news/technology-28677674 (accessed March 15, 2017).
Natali, E, B Rondinone, C Petyx and S Iavicoli. 2008. “The Perception of Psychosocial Risk Factors Among European Stakeholders.” Guidance Sheet number 5, 2. PRIMA-EF. Available at www.who .int/occupational_health/publications/05_Stakeholder%20Perceptions.pdf?ua=1 or http://tinyurl .com/nxj38yp (accessed March 15, 2017).
National Institute for Occupational Safety and Health (NIOSH). 1999. Stress … at Work. Center for Disease Control and Prevention, and US Department of Health and Human Services. Available at www.cdc.gov/niosh/docs/99-101/ (accessed March 17, 2017).

ALBERTA TEACHERS’ ASSOCIATION
71
Nowotny, H. 1994. Time: The Modern and Postmodern Experience. Trans N Plaice. Cambridge, UK: Polity.
Organisation for Economic Co-operation and Development (OECD). 2014. TALIS 2013 Results: An International Perspective on Teaching and Learning. Paris: OECD.
Purcell, K, and L Rainie. 2014. “Technology’s Impact on Workers.” PEW Research Center: Internet Science & Technology. Available at www.pewinternet.org/2014/12/30/technologys-impact-on -workers (accessed March 3, 2017).
Radicati Group. 2009. Email Statistics Report, 2009–2013. Ed Sara Radicati. Palo Alto, Calif: Radicati Group.
———. 2012. Email Statistics Report, 2012–2016. Ed Sara Radicati. Palo Alto, Calif: Radicati Group.
———. 2015. Email Statistics Report, 2015–2019. Palo Alto, Calif: Radicati Group.
Rizzo, J R, R J House and S I Lirtzman. 1970. “Role Conflict and Ambiguity in Complex Organizations.” Administrative Science Quarterly 15, no 2: 150–63.
Swain, G. 2017. “Work Life Balance and Principal/Vice-Principal Relationship.” CAP Journal, winter: 10–11
Taylor, H, G Fieldman and Y Altman. 2008. “E-mail at Work: A Cause for Concern? The Implications of the New Communication Technologies for Health, Wellbeing and Productivity at Work.” Journal of Organisational Transformation & Social Change 5, no 2: 159–73.
Teichmann, M, J Ilvest, M Lõhmus, M Merle and P Dondon. “Monday Morning E-mail Syndrome in University.” Available at www.wseas.us/e-library/conferences/2013/Rhodes/CIRCOM/CIRCOM-27 .pdf or http://tinyurl.com/kr9u42j (accessed March 14, 2017).
Thomas, G F, C L King, B Baroni, L Cook, M Keitelman, S Miller and A Wardle. 2006. “Reconceptualizing E-Mail Overload.” Journal of Business and Technical Communication 20, no 3: 252–87.

A National Study of Electronic Communication on Canadian School Leaders | 2017
72
Appendix A: Survey
ROADMAP TO SURVEY
Q) 1-7 Demographic information so that we can look at the differences between groups
Q) 8 Skill discretion questions (1, 2, 3, 5, 7, 9) and decision authority questions (4, 6, 8).
Q) 9 Work control questions
Q) 10 Turnover question
Q) 11 Absenteeism questions: (a) health, (b) child care, (c) elder care and (d) fatigue
Q) 12 Hours working: (a) total and (b) supplementary work at home (SWAH)
Q) 13 Role overload questions
Q) 14 Role conflict (1, 3, 4, 5, 7, 8, 10, 13) and role ambiguity (2, 6, 9, 11, 12, 14)
Q) 15 Perceived stress questions
Q) 16 Job stress questions
Q) 17 E-mail frequency on a typical workday: (a) received, (b) sent
Q) 18 E-mail frequency on a typical non-workday: (a) received, (b) sent
Q) 19 E-mail usage in terms of hours of time devoted to e-mail at work per week (both work- and nonwork-related e-mails)
Q) 20 E-mail usage in terms of hours of time devoted to e-mail at home per week (both work- and nonwork- related e-mails)
Q) 21 Important electronic communications (2, 3, 4, 5, 6, 7, 8, 15, 17) and urgent electronic communications (9, 10, 11, 12, 13, 14, 16, 18, 19)*
Q) 22 E-mail overload questions
Q) 23 Percent of electronic communication divided by type: important (but not urgent), urgent (but not important), urgent and important, and neither important nor urgent
NOTE: Any questions with *** in the survey are reverse coded (ie, scores of 5 and 4 are changed to 1 and 2 respectively)
*Q) 21 item 1 was removed, as it did not factor with either of the questions about important or urgent electronic communication.

ALBERTA TEACHERS’ ASSOCIATION
73
Survey
SECTION 1: DEMOGRAPHIC INFORMATIONThe following section of the questionnaire asks you to provide some demographic information about yourself that will be used to help us to interpret this question. Please indicate the response that best describes you.
1. What is your age? _____________ years old
2. What is your gender?
Female
Male
Other
3. How long have you worked for your current school system or jurisdiction (i.e. years of service)? ______ year(s)
4. How long have you held your current school leader/administrator designation? ______ year(s)
5. How many years of experience do you have as a school leader/administrator? _______year(s)
6. What is the highest education level you have completed?
Undergraduate degree
Master’s Degree
PhD
7. What is your current school leader/administration designation (if not full-time please indicate to the nearest 10 per cent of your designation)?
School administrator only
Combined classroom and administrative duties (If you indicated combined please indicate to the nearest 10 per cent your designation) ________

A National Study of Electronic Communication on Canadian School Leaders | 2017
74
8. In which province or territory are you currently working?
Yukon
Northwest Territories
Nunavut
British Columbia
Alberta
Saskatchewan
Manitoba
Ontario
Quebec
Newfoundland and Labrador
New Brunswick
Nova Scotia
Prince Edward Island

ALBERTA TEACHERS’ ASSOCIATION
75
SECTION 2: INFORMATION ABOUT YOUR WORKThe following questions ask about your experiences at your current place of work and with your current employer. For each of the following questions please select the response that most represents your situation at work.
(Note: *** Represents a question which is reverse scored)
9. Below is a list of statements that could be used to describe your work. Please indicate how strongly you agree with each statement.
StronglyDisagree
Disagree Neither Agree StronglyAgree
1) My job requires that I learn new things
1 2 3 4 5
2) ***My job involves a lot of repetitive work
1 2 3 4 5
3) My job requires me to be creative 1 2 3 4 5
4) My job allows me to make a lot of decisions on my own
1 2 3 4 5
5) My job requires a high level of skill 1 2 3 4 5
6) ***On my job, I have very little freedom to decide how I work
1 2 3 4 5
7) I get to do a variety of different things on my job
1 2 3 4 5
8) I have a lot of say about what happens on my job
1 2 3 4 5
9) I have an opportunity to develop my own special abilities
1 2 3 4 5

A National Study of Electronic Communication on Canadian School Leaders | 2017
76
10. In your current position at work:
Very Little
Little Moderate Much Very Much
How able are you to predict the amount of work you will have to do on any given day?
1 2 3 4 5
How much control do you have over how quickly or slowly you have to work?
1 2 3 4 5
How much control do you have over how much work you get done?
1 2 3 4 5
How much are things that affect you at work predictable, even if you can’t directly control them?
1 2 3 4 5
In general, how much overall control do you have over work and work-related matters?
1 2 3 4 5
11. In the past 6 months how often have you thought about leaving your organization to work elsewhere?
Never
Monthly
Weekly
Several days per week
Daily
12. In the last six months, how many days have you:
a) Been unable to work or carry out your usual activities because of health problems? _____ DAYS
b) Been unable to work or carry out your usual activities because of children-related problems? _____ DAYS
c) Been unable to work or carry out your usual activities because of problems concerning elderly relatives? _____ DAYS
d) Taken a day off because you were emotionally, physically or mentally fatigued? _____ DAYS

ALBERTA TEACHERS’ ASSOCIATION
77
SECTION 3: DEMANDS AT WORK The following questions ask about the demands of your work.
13. At present approximately how many hours per week do you spend:
a) in work-related activities? ______ hours per week
b) in work-related activities at home outside regular office hours (i.e., evenings or weekends)? ______ hours per week
14. Please indicate how often each of the following situations applies to you at work:
Rarely Sometimes StronglyAgree
How often does your job require you to work very fast?
1 2 3 4 5
How often does your job require you to work very hard?
1 2 3 4 5
How often do expectations at work mean that you cannot get everything done?
1 2 3 4 5
How often do the number of tasks you have to do at work exceed the amount of time you have to do them in?
1 2 3 4 5
How often do you feel emotionally exhausted from all you have to do at work?
1 2 3 4 5
How often do you feel physically exhausted from all you have to do at work?
1 2 3 4 5
How often do your colleagues make too many demands on you?
1 2 3 4 5
How often does your supervisor make too many demands on you?
1 2 3 4 5
How often do your clients make too many demands on you? (please leave this blank if it does not apply)
1 2 3 4 5
***How often do you have time to just sit and contemplate at work?
1 2 3 4 5
***How often do you experience periods where the work slows down?
1 2 3 4 5

A National Study of Electronic Communication on Canadian School Leaders | 2017
78
15. Please use the following scale to indicate how accurately each of the following statements describes your work?
Very Inaccurate
Somewhat Inaccurate
Uncertain Somewhat Accurate
Very Accurate
I have to do things that should be done differently
1 2 3 4 5
***There are clear, planned goals and objectives for my job
1 2 3 4 5
I have to bend or break a rule or policy in order to carry out an assignment
1 2 3 4 5
I receive assignments without adequate resources and materials to execute them
1 2 3 4 5
I receive incompatible requests from two or more people
1 2 3 4 5
***I know exactly what is expected of me
1 2 3 4 5
I work with two or more groups who operate quite differently
1 2 3 4 5
I work on unnecessary things 1 2 3 4 5***I feel certain about how much authority I have
1 2 3 4 5
I receive an assignment without the help I need to complete it
1 2 3 4 5
***I know that I have divided my time properly
1 2 3 4 5
***I know what my responsibilities are
1 2 3 4 5
I do things that are apt to be accepted by one person and not accepted by others
1 2 3 4 5
***Explanation is clear about what has to be done on my job
1 2 3 4 5

ALBERTA TEACHERS’ ASSOCIATION
79
SECTION 4: MENTAL HEALTHThe following questions assess work stress and overall levels of stress.
16. How often in the last three months have you:
Rarely Sometimes StronglyAgree
Been upset because something happened unexpectedly
1 2 3 4 5
Felt that you were unable to control important things in your life
1 2 3 4 5
Felt nervous or stressed 1 2 3 4 5
***Felt confident about your ability to handle your personal/family problems
1 2 3 4 5
***Felt that things were going your way 1 2 3 4 5
Found that you could not cope 1 2 3 4 5
***Been able to control irritations in your life 1 2 3 4 5
***Felt you were on top of things 1 2 3 4 5
Been angered because of things that happened outside of your control
1 2 3 4 5
Felt difficulties were piling up so high that you could not overcome them
1 2 3 4 5
17. Please indicate the extent to which you agree or disagree with each of the following statements:
Strong Disagree
Disagree Neutral Agree StronglyAgree
I work under a great deal of tension 1 2 3 4 5I have felt fidgety or nervous as a result of my job
1 2 3 4 5
If I had a different job, my health would probably improve
1 2 3 4 5
Problems associated with my job have kept me awake at night
1 2 3 4 5
I often ‘take my job home with me’ in the sense that I think about it when doing other things
1 2 3 4 5

A National Study of Electronic Communication on Canadian School Leaders | 2017
80
SECTION 5: ELECTRONIC COMMUNICATIONThe following questions ask about your experiences with electronic communications. For each of the following questions please select the response that most represents your situation
18. Please think about a typical work day and indicate in the space below approximately how many (work and non-work):
a) e-mails you receive ______ on a typical work day
b) e-mails you send? ______ on a typical work day
c) IMs you receive? ______ on a typical work day
d) IMs you send? ______ on a typical work day
19. Please think about a typical non-work day and indicate in the space below approximately how many (work and non-work):
a) e-mails you receive? ______ on a typical non-work day
b) e-mails you send? ______ on a typical non-work day
c) IMs you receive? ______ on a typical non-work day
d) IMs you send? ______ on a typical non-work day
20. Approximately how many hours per week do you devote to e-mail-related activities while at work (please include both work and non-work related e-mails)? ______ hours per week
21. Approximately how many hours per week do you devote to e-mail-related activities while at home (please include both work and non-work related e-mails)? ______ hours per week
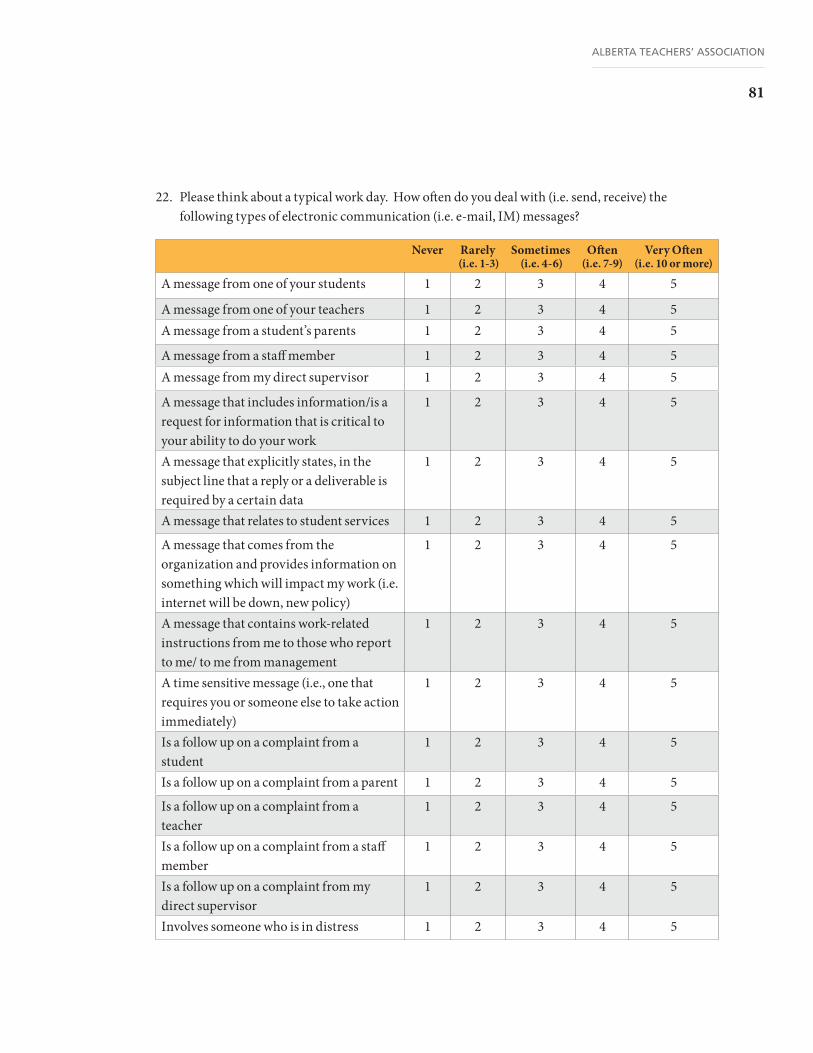
ALBERTA TEACHERS’ ASSOCIATION
81
22. Please think about a typical work day. How often do you deal with (i.e. send, receive) the following types of electronic communication (i.e. e-mail, IM) messages?
Never Rarely (i.e. 1-3)
Sometimes (i.e. 4-6)
Often (i.e. 7-9)
Very Often (i.e. 10 or more)
A message from one of your students 1 2 3 4 5
A message from one of your teachers 1 2 3 4 5A message from a student’s parents 1 2 3 4 5
A message from a staff member 1 2 3 4 5A message from my direct supervisor 1 2 3 4 5
A message that includes information/is a request for information that is critical to your ability to do your work
1 2 3 4 5
A message that explicitly states, in the subject line that a reply or a deliverable is required by a certain data
1 2 3 4 5
A message that relates to student services 1 2 3 4 5
A message that comes from the organization and provides information on something which will impact my work (i.e. internet will be down, new policy)
1 2 3 4 5
A message that contains work-related instructions from me to those who report to me/ to me from management
1 2 3 4 5
A time sensitive message (i.e., one that requires you or someone else to take action immediately)
1 2 3 4 5
Is a follow up on a complaint from a student
1 2 3 4 5
Is a follow up on a complaint from a parent 1 2 3 4 5
Is a follow up on a complaint from a teacher
1 2 3 4 5
Is a follow up on a complaint from a staff member
1 2 3 4 5
Is a follow up on a complaint from my direct supervisor
1 2 3 4 5
Involves someone who is in distress 1 2 3 4 5
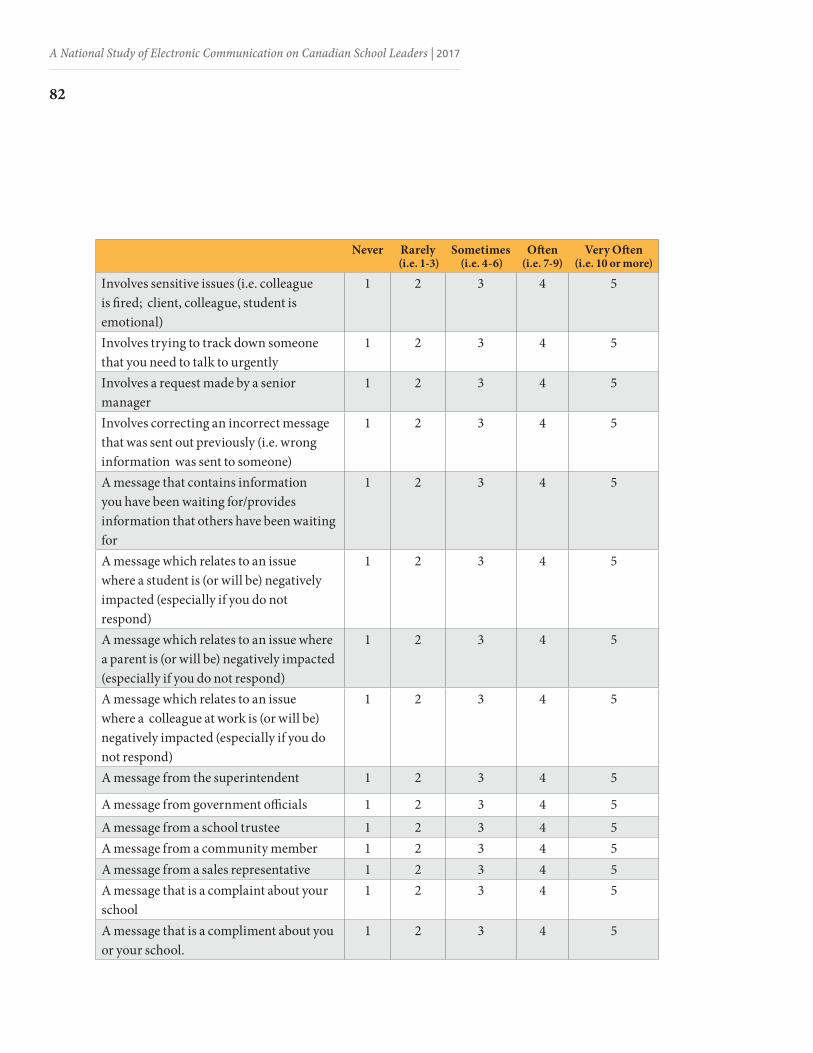
A National Study of Electronic Communication on Canadian School Leaders | 2017
82
Never Rarely (i.e. 1-3)
Sometimes (i.e. 4-6)
Often (i.e. 7-9)
Very Often (i.e. 10 or more)
Involves sensitive issues (i.e. colleague is fired; client, colleague, student is emotional)
1 2 3 4 5
Involves trying to track down someone that you need to talk to urgently
1 2 3 4 5
Involves a request made by a senior manager
1 2 3 4 5
Involves correcting an incorrect message that was sent out previously (i.e. wrong information was sent to someone)
1 2 3 4 5
A message that contains information you have been waiting for/provides information that others have been waiting for
1 2 3 4 5
A message which relates to an issue where a student is (or will be) negatively impacted (especially if you do not respond)
1 2 3 4 5
A message which relates to an issue where a parent is (or will be) negatively impacted (especially if you do not respond)
1 2 3 4 5
A message which relates to an issue where a colleague at work is (or will be) negatively impacted (especially if you do not respond)
1 2 3 4 5
A message from the superintendent 1 2 3 4 5
A message from government officials 1 2 3 4 5
A message from a school trustee 1 2 3 4 5A message from a community member 1 2 3 4 5A message from a sales representative 1 2 3 4 5A message that is a complaint about your school
1 2 3 4 5
A message that is a compliment about you or your school.
1 2 3 4 5

ALBERTA TEACHERS’ ASSOCIATION
83
23. Please indicate the extent to which you agree or disagree with each of the following statements.
Strong Disagree
Disagree Neutral Agree StronglyAgree
I feel I spend too much time keeping up with my mail
1 2 3 4 5
E-mail cuts into the time I wanted to spend on other tasks
1 2 3 4 5
I have trouble keeping up with e-mail on days I am away from my desk
1 2 3 4 5
I get too much e-mail 1 2 3 4 5
I spend too much time getting rid of unimportant messages
1 2 3 4 5
***I am satisfied with the strategy I use to keep up with my mail
1 2 3 4 5
When I return from vacation / time off, I feel overwhelmed when triaging my mail
1 2 3 4 5
Sometimes my e-mails may get lost or missed 1 2 3 4 5
The following question asks you about the number of important and/or urgent electronic communications you process (send, receive) each week. For the purposes of this study we define an important electronic communication as one with something of great significance, consequence or value and we define an urgent digital communication as one “requiting swift action”.
24. Please think about your typical work week. What percent of the electronic communications that you receive would you consider to be:
Important (but not urgent) ________ %
Urgent (but not important) ________ %
Urgent and important ________ %
Neither important nor urgent ________ %
100%

A National Study of Electronic Communication on Canadian School Leaders | 2017
84


ISBN 978-1-927074-48-0
COOR-104 2017 04
Canadian Association of P r i n c i p a l s
association canadienne des directeurs d'école