atlantic green chemicals
TRANSCRIPT

December 2011
BIFRÖST UNIVERSITY
Master’s Thesis- International Business
Atlantic Green Chemicals Site location study in Iceland
Indriði Waage
Supervisor Andri Ottesen

Executive Summary
About us
Atlantic Green Chemicals (AGC) is a company that is formed to execute green and
environmental chemical manufacturing projects, using renewable raw material as a feed stock
for its products and by using renewable energy source in the production of its products. This
newly constructed firm is looking for a possible industry site to build a factory and has
intended the location for its first plant to be in Western Europe. There are a few interesting
sites identified as suitable for a factory of this caliber both in Iceland and other Western
European countries. In Iceland’s case four sites are considered most attractive in regarding
satisfying energy source. Those are Bjarnarflag in Norðurþing municipal on the north-east
coast, the industrial site at Grundartangi in Hvalfjöður, a new industrial site at Helguvík in
Reykjanes peninsular and in Djúpivogur municipal on the east coast.
AGC is a spin-off company from the research and consulting firm Efnaferli ehf (Icelandic
Process Development, IPD) with the purpose to develop implement and execute projects on
the field of “green” chemical industries in Iceland and/or elsewhere. IPD was formed in 1997
to research various chemical processes that would be suitable for medium scale chemical
plant productions. Gunnlaugur Friðbjarnarson: is the founder and key inventor of Icelandic
Process Development Ltd. Since 2007 IPD has operated a sophisticated fully staffed pilot
plant in Reykjavik for the proof of processes and the verification and characterization of
utilities, energy, and specific consumption parameters. This pilot plant is well suited to
develop and test various kinds of catalysts and process conditions, by using hydrogen and a
variety of biomass feed stock. Rannis (Icelandic Research Council) granted IPD a 3 years
support in 2008 for testing and catalyst’s developments. One of the results from operating the
pilot plant resulted in a newly achieved process patent, registered in Iceland in January 2011.
This patent has already been filed and is pending internationally (PCT). The patent involves
processes using glycerin and other sugars to produce renewable chemicals, such as glycerin,
which delivers mainly and with high selectivity propylene glycol and ethylene glycol,
valuable and in high demand commodities. This process is considered more efficient and
environmentally friendly than prevailing glycols processes based on petrochemicals sources.
About the technology:
The technology implemented for this project will be the proprietary and newly patented
process of IPD and licensed to AGC. Process based on this technology reduces the emission
of greenhouse effect generating carbon dioxide compared to conventional production methods

that uses petrochemicals as feedstock. Not only is the project economical feasible, it also has
environmental benefits that both have market value that can lead to cost effective funding
from EU-green grant programs or green-tech. investment funds.
Base Case
The first steps in raising a factory capable of producing 30.000 tons per annum of products in
an industrial scale plant in Iceland. Within two years’ time plan is to double the size of that
factory again to the production capabilities of 65.000 tons per annum, and after five years
from initial first step was taken the final expansion would take place and the production
capability will reach 125.000 tons per annum. The engineering, procurement and construction
cost for the overall glycerin purification and conversion plant is estimated to be around EUR
15, 3 million. This total installed cost has an estimated accuracy of -10/+35 % according to
IPD estimation.
The project is based on three phases:
Phase I: Small scale industrial plant
Investment: EUR 17.8 million
Total production at full capacity: 30.000 tons
Total sales value -: EUR 33,1 million
Phase II: Operational in year 3
Additional Investment: EUR 15 million
Additional production at full capacity: 35.000 tons
Total sales value: EUR 71,7 million
Phase III: Operational in year 5
Additional Investment: EUR 19,9 million
Additional production at full capacity: 60.000 tons
Total sales value: EUR 137.9 million
The total investment for Phase I, Phase II and Phase III is EUR 52,7 million, expected to
produce 125.000 MT of products with a total sales value of EUR 137.9 million.

Results and conclusion AGC plant converts glycerin - a by-product from bio diesel production into propylene and
ethylene glycols with chemical processes that rely on use of steam and hydrogen. This
process in based on 9 years research and verified technology demonstration that has been
patented and is one of a kind worldwide. This process is highly profitable due to two
developments: Glycerin prices have dropped drastically due to EU tax policies that require
use bio fuel for transport of 5,75% of total transportation fuels used in EU. This proportion
will increase to 10% by 2020. Hence, there is a foreseeable supply of Glycerin as bi-product
from bio diesel production at affordable prices over the next ten years or so. However, the
products propylene and ethylene glycols have until now been derivatives from oil production,
made in oil refineries and have to the large extent followed the world price of oil. Due to EU
policies products that are made from renewable and waste recourse have priority over such
products and can even be sold at premium over equivalent products, this should apply to AGC
products.
Capex and Opex model was constructed for all the four cases. The dependent variables were
assumed the same for all the four cases. These were labor cost, construction cost, raw material
cost, income from products sold abroad, and foreign marketing, logistics and storage cost.
The independent variables were case specific as they were different for each case. These were
electricity cost for electrolyzing hydrogen or alternatively cost of purchasing hydrogen as a
bi-product or cost of abstracting hydrogen from non-condensable gases at geothermal sites.
Cost of steam and logistics and storage cost. Several cost assumption were made based on
references from reputable sources and NPV and IRR were calculated for each site. The
required WACC is set at 15% for these four cases. The result from these calculations are that
Bjarnarflag/Helguvík that assumes abstraction of hydrogen from non-condensable gases and
non-transmission tariffs of electricity scores the highest with 98,4% IRR and NPV EUR
96.921.861. The second highest score is at the Grundartangi site where it is assumed that
hydrogen can be purchased from Proposed Sodium Chloride factory as a bi-product the IRR
for that site is 93.2% and the NPV is EUR 95.347.804. The third site option is Helguvík
where AGC is going to buy waste heat as steam from the Icelandic Silica Factory. This option
yields IRR of 86, 2% and NPV of EUR 89.427.385. The forth option is Djúpivogur which
were storage tanks and buildings could be donated. This option yields IRR of 74, 3% and
NPV of EUR 68.844.894.

Even though all sites obviously yield acceptable outcomes which is 50% IRR (the higher end
of accuracy limit in addition to 15% WAAC) , one shall keep in mind the accuracy of this
study is -10% and + 35%. It is not unusual that total cost for erecting a new chemical plant
can overrun up to 40% thus large contingency I need or more studies, bids and calculations
are clearly needed to tighten the outcome accuracy figures. Confirmed bids and detailed
estimates will have to be conducted and analyses. A special study has to be made what is the
most economical method of abstracting hydrogen from non-condensable geothermal gases at
Bjarnarflag. Kemira, the Sodium Chloride factory has not given confirmed answer if they will
build their plant in Iceland or elsewhere. No formal price negotiations have been conducted
and the purchasing price of hydrogen is at this stage only an educated guess and best estimate.
Helguvík case is the one that is the best developed at this time and these costs there are most
researched. MOU has already been signed with the Icelandic Silica Corporation with some
steam price and quantity indications. Price of electricity is based on two contracts of
equivalent quantity from HS Orka. A premise has already been secured at Helguvík Harbor
and Environmental Impact Assessment is expected to pass in February 2012. Furthermore,
option B was studied for Helguvík in case contracts with ISC would fall through, and that was
to have the factory based next to Reykjanes Geothermal Power Plant where there is
abundance of steam and because of co-locations with the power plant no transmission tariff
would apply. However storage facility and sea logistics would still remain in Helguvík. This
option yielded almost same outcome as option A, in spite of more transportation and
somewhat more storage capacity.
The recommendations from this study are as follows.
a) Continue developing the case for Helguvík as the primary option. The outcome meets
required cut off rate above of 50% IRR. The costs figures have the least inaccuracy
out of these four cases. The company need to get a firm budget quotes and perform
basic engineering to further tighten of cost estimates. The plant is next to largest urban
area where access to skilled labor, mostly mechanics and tradesmen, is guaranteed.
The plant is only 5 minutes from the International Airport which is very important as
financing of the plant is planned to be largely from international sources. Furthermore,
the company plans to sell its alcoholic products as a fuel blend additive, which is
about 80% distributed out of Reykjavik. A lot of oxygen is a bi-product of the
electrolysis process. The Reykjanes area is probably the best locations for selling such
gases, especially the airport that might become a customer, but also local fish farmers.
b) Economical and technical feasibility study should be conducted at the earliest
convince on the optimal methodology and technical verification on how to abstract
hydrogen from non-condensable geothermal gases at proposed new Bjarnarflag power
plant. AGC should apply for a grant for this study from National Power Company,
Ministry of Industry or the Energy fund. AGC should furthermore follow closely
development in H2S cleaning systems for the non-condensable gases at the proposed
Bjarnarflag geothermal power plant. It is possible that for cleaning of H2S the National
Power Company uses so called Klaus method would be used that hydrocracks the
hydrogen out of the H2S while solidifying the sulfur. This process could yield
hydrogen that can be used for industrial processes.
c) AGC should follow closely developments if Kemira is going to build plant in
Grundartangi and have hydrogen available as a bi-product. The company should
engage in price negotiation and be ready to move their plant to Grundartangi if prices
are too good to miss. AGC should furthermore work with Kemira in developing option
to abstraction steam for their production, which could come through steam boiler from
the Elkem Ferro-silica plant.
Team and partners Dr. Andri Ottesen, Chief Executive Officer
Magnús Magnússon, Chief Engineer
Gunnlaugur Friðbjarnarson, founder and key inventor of Icelandic Process Development Ltd
About Project Preparation
The current owners of the project are seeking interested investors to participate. The next
steps in the project are to form a project preparation group of specialists who further design,
negotiate and form contractual basis about utilities, raw material supplies and site specifics
and capital costs. Furthermore, to gather and collect information and data with the objective to
enable the decision for project’s Phase I initiation before end of 2012. An important task of
the project preparation is to start working on the documentation delivery for the official
permitting processing of the project. It is important to be able to start this soon as the
authorization processing in Iceland normally takes 6-10 months. The cost to reach this
objective is estimated at EUR 1.000.000. Simultaneously AGC would seek strategic partners
for the operation of the project as well as potential investors for the second phase.

Abstract Chemical industry has been a very important industry in the western hemisphere for the last
century or so. Today the chemical industry in Iceland is a relatively new concept and has
evolved very slowly in recent time mostly because the basic infrastructure for industry of that
caliber is in many parts not progressing as fast it has the potential to do. In Iceland there is an
opportunity to move the chemical industry into new highs with available low energy prices,
feasible land, good harbor-and road connections, and with growingly educated work force.
This research provides a financial valuation of raising a glycerin to glycol factory in four
locations in Iceland. These locations are Helguvík, Grundartangi, Bjarnarflag and Djúpivogur.
Each location has something unique to offer in comparison so valuation is bound to reflect
different opportunities. A standard profitability assessment method with 10 year operational
time period provides a very positive net present value and internal rate of return at each
location.

Table of Contents 1. Introduction ............................................................................................................................ 1
Research Question ................................................................................................................................. 2
Description of the research ................................................................................................................ 2
The objective of the research ............................................................................................................ 2
Research Method.................................................................................................................................... 3
Limitations ................................................................................................................................................ 3
2. AGC ....................................................................................................................................... 4
About AGC ............................................................................................................................ 4
The Officers at AGC ................................................................................................................................ 5
International partners ......................................................................................................................... 7 The project .............................................................................................................................. 8
About the Cost and time ................................................................................................................... 10 About the Risks .................................................................................................................... 10
Locations Risk ...................................................................................................................................... 10
Operational Risk .................................................................................................................................. 11
Permitting Risk .................................................................................................................................... 11
Technological and Scale Up Risks ................................................................................................. 11
Project Cost Risk .................................................................................................................................. 12 About the technology: .......................................................................................................... 12 The process ........................................................................................................................... 13
The products ......................................................................................................................... 14 About product application .................................................................................................... 16
Market prices of raw material and products ............................................................................ 16
3. Literature view ..................................................................................................................... 17 PESTEL ................................................................................................................................ 17
Political environment ........................................................................................................................ 18
Economic environment .................................................................................................................... 19
Social-cultural environment ........................................................................................................... 19
Technical environment ..................................................................................................................... 19
Natural environment ......................................................................................................................... 20
Legal environment.............................................................................................................................. 20 NPV ...................................................................................................................................... 20
IRR ....................................................................................................................................... 21
4. Framework of this analysis ................................................................................................. 22 Similar cost between locations ............................................................................................. 22
Currency ................................................................................................................................................. 22
Employees .............................................................................................................................................. 22
Marketing cost, license fee and cost of catalyst ....................................................................... 24
Various fixed cost ................................................................................................................................ 24 Different between locations ................................................................................................. 25
Investment cost ................................................................................................................................... 25
Finance and funding .......................................................................................................................... 26
Transport ............................................................................................................................................... 26
Energy ..................................................................................................................................................... 28
Key companies in energy production sector ............................................................................ 30
Key companies in energy distribution sector .......................................................................... 31
5. Helguvík ............................................................................................................................... 38
Investment in Helguvík ...................................................................................................... 39
Pro forma financials ........................................................................................................... 40
Summary of projected financial return ...................................................................................... 41
Profitability analyses ......................................................................................................................... 42
6. Grundartangi ....................................................................................................................... 44
Investment in Grundartangi .............................................................................................. 45
Pro forma financials ........................................................................................................... 46
Summary of projected financial return ...................................................................................... 48
Profitability analyses ......................................................................................................................... 50
7. Bjarnarflag ........................................................................................................................... 51
Investment in Bjarnarflag .................................................................................................. 53
Pro forma financials ........................................................................................................... 54
Summary of projected financial return ...................................................................................... 56
Profitability analyses ......................................................................................................................... 58
8. Djúpivogur ........................................................................................................................... 59
Harbor facility: ..................................................................................................................................... 59
Investment in Djúpivogur ................................................................................................................ 59
Pro forma financials ........................................................................................................... 60
Summary of projected financial return ...................................................................................... 61
Profitability analyses ......................................................................................................................... 63
9. Conclusions .......................................................................................................................... 64
10. Bibliography ....................................................................................................................... 65
Appendix – Helguvík............................................................................................................... 69
Fundamentals ..................................................................................................................... 69
Profit and loss ..................................................................................................................... 75
Cash flow and equity .......................................................................................................... 78
Tanks building estimates ................................................................................................... 80
Appendix – Grundartangi ....................................................................................................... 81
Fundamentals ..................................................................................................................... 81
Profit and loss ..................................................................................................................... 85
Cash flow and equity .......................................................................................................... 88
Additional ............................................................................................................................ 90
Appendix – Bjarnarflag ........................................................................................................... 91
Fundamentals ..................................................................................................................... 91
Profit and loss ..................................................................................................................... 95
Cash flow and equity .............................................................................................................. 98
Appendix - Djúpivogur ......................................................................................................... 100
Fundamentals .....................................................................................................................................100
Profit and Loss ...................................................................................................................................105
Cash flow and equity ........................................................................................................................108
Appendix A ............................................................................................................................ 110 A.1 ...................................................................................................................................... 110 A.2 ...................................................................................................................................... 110
A3 ....................................................................................................................................... 112 A.4 ...................................................................................................................................... 114 A.5 ...................................................................................................................................... 115 A.6 ...................................................................................................................................... 116 A.7 ...................................................................................................................................... 117
Appendix B ............................................................................................................................ 118
B.1 ...................................................................................................................................... 118 B.2 ...................................................................................................................................... 118
Appendix C ............................................................................................................................ 124 C.1 ...................................................................................................................................... 124 C.2 ...................................................................................................................................... 125
C.3 ....................................................................................................................................... 126
Appendix D ............................................................................................................................ 129
D.1 ...................................................................................................................................... 129
Appendix E ............................................................................................................................. 130
E.1 ...................................................................................................................................... 130
Pictures Picture 1 Shows Landsnets distribution network in Iceland 2010 (Landsnet, 2011). .............. 31
Picture 1 Shows a possible location[X] for a glycol producing plant in Helguvík .................. 38
Picture 1 Norðurþing municipal Source:Invalid source specified.. ......................................... 51
Figures Figure 1 Simplified version of the process and production of the AGC plant in Iceland ........ 13
Figure 3 Shows the PESTEL framework (Aubert & Frigstad, 2007, p. 25). ........................... 18
Figure 4 Shows additional cost using small distributors (Landsnet (b), 2011). ...................... 33
Figure 5 Shows annual consumption in Europe: 500 MWh < consumption < 2 000 MWh;
excluding VAT (Eurostat, 2011). ............................................................................................. 37
Equations Equation 1 Shows the formula for NPV (Ross et al, 2008, p. 101). ....................................... 21
Equation 2 Shows Internal Rate of Return (Ross et al, 2008, p. 170) ...................................... 21

Tables Table 1 Shows project timeline - capacity - investment: ........................................................... 9
Table 2 Shows Estimated project timeline by IDP .................................................................... 9
Table 3 Shows G2G - Raw material usage/Product(s) distribution ......................................... 14
Table 4 Shows Estimated product price and raw material price .............................................. 16
Table 5 Shows currency rates (ISK to :) use in this report (SI, 2011). .................................... 22
Table 6 Employment - phase 1 + additional workers for expanding to Phase 2 and 3: ........... 23
Table 7 Shows AGC marketing cost, license fee and cost of catalyst ..................................... 24
Table 8 Shows AGC various fixed cost ................................................................................... 24
Table 9 Shows Investment estimate - phase 1, 2 and 3 ............................................................ 25
Table 10 Shows AGC expected funding .................................................................................. 26
Table 11 Shows freight cost - logistics: .................................................................................. 28
Table 12 Shows the three main power consumption factors to AGC factory ......................... 29
Table 13 Shows the cost of connection with the transmission grid ........................................ 31
Table 14 Shows Landsnet Transmission charges for intensive users ...................................... 32
Table 15 Shows how strain affects transmission cost ............................................................. 34
Table 16 Shows Power consumption by electrolyser ............................................................... 35
Table 17 Shows thermal energy usage estim. for a prod. capacity of 30.000 ton per year. .... 36
Table 18 Shows AGC Investment estimate at Helguvík- phase 1, 2 and 3 ............................. 39
Table 19 Shows IPD estimated investment, equity and loan capital structure at Helguvík ..... 40
Table 20 Shows financial assumptions in the Helguvík project ............................................. 40
Table 21 Shows power consumption at Helguvík project........................................................ 41
Table 22 Shows estimated profit and loss from Helguvík project .......................................... 41
Table 23 Shows estimated IRR and NPV from Helguvík project ........................................... 43
Table 24 Shows AGC Investment estimate at Grundartanga- phase 1, 2 and 3 ...................... 45
Table 25 Shows IPD estimated invest., equity and loan capital structure at Grundartangi .... 46
Table 26 Shows financial assumptions in the Grundartangi project ....................................... 46
Table 27 Shows expected power consumption of AGC factory .............................................. 47
Table 28 Shows estimated profit and loss from Grundartangi project .................................... 49
Table 29 Shows estimated IRR and NPV from Grundartangi project .................................... 50
Table 30 Shows AGC Investment estimate at Bjarnarflagi- phase 1, 2 and 3 ......................... 53
Table 31 Shows IPD estimated investment, equity and loan capital structure at Bjarnarflag 54
Table 32 Shows financial assumptions in the Bjarnarflag project .......................................... 54
Table 33 Shows estimated power consumption at Bjarnarflag ............................................... 55
Table 34 Shows trucking cost expected between Húsavík and Bjarnarflag ............................ 56
Table 35 Shows estimated profit and loss from Bjarnarflag project ....................................... 57
Table 36 Shows estimated IRR and NPV from Bjarnarflag project ........................................ 58
Table 37 Shows AGC investment estimate at Djúpivogur - phase 1, 2 and 3: ....................... 60
Table 38 Shows IPD estimated investment, equity and loan capital structure at Djúpivogur . 60
Table 39 Shows financial assumptions in the Djúpivogur project .......................................... 61
Table 40 Shows estimated power consumption at G2G factory .............................................. 61
Table 41 Shows profit and loss during 6 years period expected ............................................. 62
Table 42 Shows estimated IRR and NPV from Djúpavogur project ...................................... 63

List of Abbreviations
NPV Net Present Value
IRR Internal Rate of Return
EUR Euro
USD US Dollar
GBP British Pound
ISK Icelandic Krona
NOR Norwegian Krona
KW Kilowatt
KWh Kilowatt hour
MW Megawatt
MT Metric Ton
1
1. Introduction
The purpose of doing this analysis is to determine if a business opportunity is possible, in fact
practical and viable. This study undertakes such approach as to make a realistic look at both
positive and negative aspects of the business opportunity, but adds to it by looking at some
aspects that might increase the value of the project and make it more profitable in the future.
One angle of this study is to examine the competitive environment of Iceland towards other
suitable sites like Delfzijl in the Nederland and Nepic in the North England. Both those sites
have in common is that they are a developed chemical parks and as such have both good
excess to feedstock, skilled labor and world class facilities in the field. In addition they use on
location industrial byproducts to decrease cost and enhance protection of the environment as a
result. Invest Iceland Agency commissioned a report (Investum, 2009) in 2009 that
demonstrates what elements successful chemical parks would comprise of. The result that
such parks would be possess harbor facility that could facility large cargo ships, have large
storage areas, sophisticated drainage and effluence system but most important access to
affordable electricity, steam and hydrogen (either as a bi-product from other chemical plants
or as derivative from natural gas). Last but not least the park will have to be connected to
international market via train network or equivalent land transport system.
It is obvious that Iceland is in a disadvantage in this regards mainly as there is no tradition for
clusters of chemical plants at this magnitude, there is a shortage of skilled labor for industries
and specialization is clearly needed. Iceland is fair away from the world markets and there are
no gas/hydrogen sources in place in Iceland. All logistics becomes difficult and costly along
with storage facility and pricy inventory management system. The only means of transport to
and from international markets are through large ocean vessels that require large inventory
systems at each side.
What Iceland has to offer is renewable electricity to heavy industries at price that is only one
third of the average cost in Europe, steam from geothermal sources at only one fifth of
common European prices. Land is also much more affordable and thanks to the currency
crises in 2008 even labor cost and professional services in Iceland has become affordable and
competitive. The main purpose of this study is to gather information and calculate if the
advantage of building energy intensive chemical plant, mainly Propylene Glycol Plant in
Iceland in comparison to sites at chemical parks in England and Holland.

2
Four cases were constructed, studied and evaluated: Helguvík Harbor, Grundartangi,
Djúpivogur and Husavik/Bjarnarflag. Each location has a harbor that can accommodate at
least 10.000Ton transport vessel. Helguvík Harbor location is next to the proposed Icelandic
Silica Factory that can provide steam at affordable rate. In Helguvík is also depot of tanks at
the harbor that can be used to store raw materials and products. Grundartangi site is oldest
established area for heavy industry in Iceland which aluminum smelter and ferrosilicon
factory and proposed Sodium Chloride factory that has hydrogen as a side product. That
company has expressed interest in selling that hydrogen to AGC at affordable rate.
Húsavík/Bjarnarflag, is where Húsavík would be the harbor and the tank storage area and
Bjarnarflag is next to a geothermal power plant where one third of volume and one tenth of
weight of the non-condensable gases that are used for power production is natural occurring
hydrogen that can be abstracted, cleaned and used for production, furthermore, as the AGC
plant would be built next to a geothermal power plant and thus no transmission tariff of
electricity would apply. Djúpivogur has tanks and buildings that the municipality is likely to
donate partially or fully to such operations.
Research Question
The research question put forward is the following:
Where is the most suitable site location in Iceland for raising AGC Ltd. factory and does
outcome of financial and risk analysis compete with building the factory in Holland or
England?
Description of the research
My interest in this research was sparked during a summer course “International Trade and
Emerging Markets” at Bifröst University, Iceland. In that course we the students were
introduced to proposed raising a factory in three different locations: Delfzijl in Nederland,
Bordeaux in France, and Fray Bentos in Uruguay. It emerged that a similar approach would
take place in Iceland and a search for suitable building site was needed. The topic is
interesting as it involves investment in Iceland and completely new industry that could add
more volume to Icelandic industrialization.
The objective of the research
The object of this report is to obtain and to analyze more knowledge of suitable location site
for AGC factory in Iceland if one could be identified. The study will attempt to use
financially recognized methods to value each location and to find what will be the best
solution for AGC in Iceland according to those valuations methods.

3
Research Method
The research study will be based up on two measurements tools; gathered quantitative
secondary data from published internet web sites and qualitative data that will be gathered
through e-mails and telephone calls during the fall period September to November. By
twinning those two measurements methods together it will hopefully result in a clear
conclusion whereas the idea is that the two will support each other and add value to the
research.
Limitations
In a preliminary study like this assumption are made to further advance the project. Using
assumption in such way will always cause inaccuracy in calculations and therefore the
conclusions are not as reliable as attempted, but could still give a pretty fair value of the job
that was at hand. This study is a concept screening for the proposed plant and very little is
known other than what type it is and what capacity it will generate. Because of limited
available information and amount of estimates in this study a wide accuracy should be
expected and more advantaged research should be made if the conclusions are considered
profitable.

4
2. AGC
About AGC Atlantic Green Chemicals (AGC) is a company that is formed to execute green and
environmental chemical manufacturing projects, using renewable raw material as a feed stock
for its products and by using renewable energy source in the production of its products. This
newly constructed firm is looking for a possible industry site to build a factory and has
intended the location for its first plant to be in Western Europe. There are a few interesting
sites identified as suitable for a factory of this caliber both in Iceland and other Western
European countries. In Iceland’s case four sites are considered most attractive in regarding
satisfying energy source. Those are Bjarnarflag in Norðurþing municipal on the north-east
coast, the industrial site at Grundartangi in Hvalfjöður, a new industrial site at Helguvík in
Reykjanes peninsular and in Djúpivogur municipal on the east coast.
AGC is a spin-off company from the research and consulting firm Efnaferli ehf (Icelandic
Process Development, IPD) with the purpose to develop implement and execute projects on
the field of “green” chemical industries in Iceland and/or elsewhere. IPD was formed in 1997
to research various chemical processes that would be suitable for medium scale chemical
plant productions. Gunnlaugur Friðbjarnarson: is the founder and key inventor of Icelandic
Process Development Ltd. He graduated as a chemical engineer from the Karlsruhe
University, Germany, in 1986 where he studied, among other fields, process design and
separation technology, thermodynamics and Fisher-Tropsch catalysis.
Gunnlaugur is a specialist in green chemistry and heterogeneous catalysis process technology
and has collected over 25 years’ experience in chemical plant design, engineering, project
management, manufacturing and product development. After graduation he spent two years as
a branch manager of the Icelandic Fisheries Laboratories branch in East Iceland. Thereafter,
he founded and managed a company, Kraftlýsi Ltd, which specialized in marine food
supplements and marine oils.
After 9 years of running his own company he returned back to consulting engineering and
was a member of a design team for some of the largest geothermal projects in Iceland
working under the auspices of VGK Ltd, where he worked for almost 9 years. Gunnlaugur
was the main process designer for a polyol plant that was built by Global Bio-Chem in China
in 2005, using sorbitol as a feedstock. He managed and coordinated the design, supervised
construction and was responsible for the start-up of the plant.

5
In 2006 to 2007 he became on-site engineer in El Salvador for the construction of an ORC-
binary cycle power plant which was built by Enex Ltd, an Icelandic power plant technology
provider. In Q3 of 2007 he became the project coordinator for the site preparation of a
geothermal deep drilling project of Geysir Green Energy in Bavaria, Germany. At the end of
2008 Gunnlaugur decided to explore his interests within green chemistry full time and has
since then dedicated his efforts on the chemical technology company Icelandic Process
Development Ltd which he founded in 2006.
Since 2007 IPD has operated a sophisticated fully staffed pilot plant in Reykjavik for the
proof of processes and the verification and characterization of utilities, energy, and specific
consumption parameters. This pilot plant is well suited to develop and test various kinds of
catalysts and process conditions, by using hydrogen and a variety of biomass feed stock.
Rannis (Icelandic Research Council) granted IPD a 3 years support in 2008 for testing and
catalyst’s developments. One of the results from operating the pilot plant resulted in a newly
achieved process patent, registered in Iceland in January 2011. This patent has already been
filed and is pending internationally (PCT). The patent involves processes using glycerin and
other sugars to produce renewable chemicals, such as glycerin, which delivers mainly and
with high selectivity propylene glycol and ethylene glycol, valuable and in high demand
commodities. This process is considered more efficient and environmentally friendly than
prevailing glycols processes based on petrochemicals sources.
The Officers at AGC
Dr. Andri Ottesen, Chief Executive Officer
Mr. Ottesen graduated from the International School of Management, Paris, France in 2007
with Ph.D. in the field of International Business Management. He was also a Graduate Fellow
from Stanford, USA, in 2002 and in Leipzig University, Germany, where he received a grant
from the German Ministry of Educations (DAAD). He graduated in 1999 with MA in
Commerce from Otaru University, Japan, with grant from the Japanese Ministry of
Educations (Monbusho). In 1996 he graduated with MBA from California State University,
Fullerton on a scholarship from the American Marketing Association. In 1995 he graduated
from the same school with degree in International Business and Foreign Languages. Currently
Mr. Ottesen is the director of business operations at Carbon Recycling International (CRI) in
Iceland, the world first factory that converts industrially emitted CO2 to renewable methanol.
Before joining CRI Mr. Ottesen was the Managing Director of Seed Forum Iceland and
“Klak” which is the Center for Entrepreneurship, Reykjavík, Iceland. He was head of

6
division/budget analyst for the Icelandic Ministry of Finance for 6 years where his
responsibilities where to approve the national budget towards ministries of employments and
natural resources. Mr. Ottesen is a member of the Icelandic Crisis Respond Unit and has
served as appointed Major in Kosovo in 2003 where he was an Economic Advisor to NATO.
Mr. Ottesen has taught regularly at the University of Iceland, University of Reykjavík,
University of Bifröst and Icelandic Agricultural University, all located in Iceland. In 2010 he
was qualified as Assistant Professor at University of Iceland. His teaching subjects are
Marketing, Finance, Entrepreneurship, International and Macro Economics, Strategy and
Leadership.
Magnús Magnússon, is Chief Engineer at AGC
Mr. Magnússon graduated with M.Sc. in Exploitation of Materials in 1979 and has BSc in
Mechanical Engineering in 1978 from the University of Leeds, England. He has qualified
various management courses which include quality management, reengineering and
negotiating technique. He was certified from The US National Training Branch to audit
Haccp systems. Process improvement leader series certificate form PMI, USA in 2006. He
graduated with Mechanical Engineering degree from the Technical Collage of Iceland. He
was the Director of Project at CRI where his responsibility was to build the world’s first CO2
to Fuel factory at Grindavík Iceland. He was Chief Executive Officer of Almenna Consulting
Engineers. Mr. Magnússon was a partner and a Senior Consultant at Deloitte & Touche
Management Solutions Ltd. in Iceland. He was Managing Director of Reykjanes Geo-
Chemicals Ltd, where he reconstructed the financing of the company and was involved in the
startup in a new product from precipitated silica. Mr. Magnússon was heavily involved in the
Icelandic fishing industry where his profile includes the Head of Production and Marketing at
ÚA Plc. (one of Icelandic leading fishing process company), Production Manager at
Síldarvinnslan Plc., Fjarðarbyggð.
Mr. Magnússon was a lecturer at University of Iceland, The Technical Collage of Iceland and
to United Nations University in Iceland during 1980-2000 on Quality Management,
Operational Research and Statistical Control.

7
International partners
Godavari Biorefineries Ltd. is owned by Somaiya Group and is
the 2nd-3rd largest sugar mill operator in India. Its production is
now 475 thousand Tons (2010) of sugar and sugar derived
products. Godavari had an interest to build a glycol plant in
India using sugar as feed stock (Somaiya, 2011). Those plans
turned to be unprofitable due to drastic rise of sugar price in
2009-2010. Godavari has expressed interest in participating in a
European project in an MOU after IPD suggested using glycerin
instead of sugar in the manufacturing unit. Godavari
Biorefineries has supported and cooperated with IPD for over 3
years on the field of sugar to glycol technology developing
platform. Somaiya has strong operational ties to Helm and
Vinmar and has expressed interest as bringing them in as
minority co-investors.
Icelandic Process Development (IPD) has initiated and
concluded a letter of interest for the potential of selling and
distributing glycol products with Helm AG. The letter of interest
states that Helm AG is obligated to sell all off AGC products at
market value at the cost of 5% sales fee for Helm AG. Helm
AG was founded in 1900 but since 1950 the company´s focus
has been on chemical trading. Today Helm AG is an
international chemicals distribution and marketing company,
located in Hamburg, Germany, with operations in over 30
countries and a yearly turnover around EUR 8 billion (Helm
AG, 2011).
Vinmar International Ltd. is an international distributing
company of chemicals and polymers located in Huston, Texas in
the United States. The company was founded in 1978 and
operates as a subsidiary of Vinmar Group. Vinmar International

8
also offers market analysis and counseling in various fields such
as logistics, marketing and sales and so forth. In 2006 the
company shifted its focus to added fuels trading, specializing in
ethanol and natural gas liquids. Vinmar International operations
arena is worldwide. (Vinmar International ltd., 2011).
The Perstorp Group is a world leader in several sectors of the
specialty chemicals market. Perstorp focuses on performance
culture that creates resource-efficient and environmentally
sustainable solutions for business clients within selected niches
of organic and polymer chemistry. Perstorp offers many
innovative chemical solutions. In their role for an application or
product competitiveness, using specially formulated chemicals,
they give their products elements of surprise in the marketplace.
Perstorp is operating a medium sized biodiesel operation at their
headquarter location in Stenungsund, Sweden (Perstorp Group,
2011) and can provide up to 30.000 tons per annum of 97%
technical grade glycerin.
The project
The first steps in raising a factory capable of producing 30.000 tons per annum of products in
an industrial scale plant in Iceland. Within two years’ time plan is to double the size of that
factory again to the production capabilities of 65.000 tons per annum, and after five years
from initial first step was taken the final expansion would take place and the production
capability will reach 125.000 tons per annum. The engineering, procurement and construction
cost for the overall glycerin purification and conversion plant is estimated to be around EUR
17, 8 million. This total installed cost has an estimated accuracy of -10/+35 % according to
IPD estimation. Further investments are needed in some of the locations and in others they
will be reduced. But in every location there is need for connectors for energy as AGC factory
can be regarded as an intensive user of energy, but do not fully reach the intensive users
category which is required by law until for filling 10 MW criteria or 80 GWhours.

9
Table 1 Shows project timeline - capacity - investment:
Production capacity in tpa
Year/description: Phase 1 Phase 2 Phase 3 Total
(Feasibility study cost 1 M.euro) Investment - EURO: 17.851.423
15.000.000
19.900.000
52.751.423
Capacity - tons(products): 30.000
35.000
60.000
125.000
0 1
30.000 100%
30.000
2
30.000 100%
30.000
3
30.000 100% 35.000 100%
65.000
4
30.000 100% 35.000 100%
65.000
5
30.000 100% 35.000 100% 60.000 100% 125.000
6
30.000 100% 35.000 100% 60.000 100% 125.000
7
30.000 100% 35.000 100% 60.000 100% 125.000
8
30.000 100% 35.000 100% 60.000 100% 125.000
9
30.000 100% 35.000 100% 60.000 100% 125.000
10
30.000 100% 35.000 100% 60.000 100% 125.000
Further benefits to mention are low costs for land rent, competitive construction market, and
access to highly skilled, experienced and educated labor and management personnel. In
general the efficiency of Icelandic workforces is considered high. The time schedule for
designing and building the plant is estimated 13-15 months from the project’s execution
decision date.
The purpose of the small scale plant is to bridge, transform and verify technology concepts
prior to the construction of a large scale industrial unit
Table 2 Shows Estimated project timeline by IDP
Year 2012 2013 2014 2015 2016 2017
Permitting
Phase 1
Construction
Operation Phase 2
Construction
Operation Phase 3
Construction
Operation

10
Phase II:
G2G-Plant-II: Modular designed plant producing about 100 tons/day or 35.000 tons per
annum of products.
Estimated cost is EUR 15 million with an accuracy of about -10/+35 %. Start-up and
commissioning is possible in Q1 2016.
Cost and time figures have to be re-evaluated in a detailed feasibility study.
Phase III:
G2G-Plant-III: Modular designed plant producing ca. 370 t/day or approximately 120.000
tons per annum of products.
Estimated cost is EUR 19, 9 million and the accuracy estimate at this time is -10/+50 %.
The commissioning and the plant startup are possible 2017-2018. Cost and time figures have
to be evaluated in a detailed feasibility study.
Further expansion plans in terms of multiple plants.
About the Cost and time
Preliminary estimate of the investment cost of the Phase I am EUR 17, 8 million which will
yield 30.000 tons of products with a total sales value (at full capacity) of EUR 33, 1 million.
The accuracy of those estimates is considered to be in the range -10%/+35%. Initially 1,0
million Euros is needed to finish necessary contracts, permitting, and to start the front
engineering design (FEED) intended to be finished by mid of 2012. After the execution of
FEED, that will include budget prices for several major equipment, the accuracy of the cost
estimate will subsequently improve and can likely be -10%/+20%. If detail design and the
ordering of key equipment with a long lead time can be realized in end of 2012, the physical
construction is scheduled for mid of 2013 to enable production by end of 2013.
About the Risks
Locations Risk
One of the risk factors related to an Icelandic location is the current rater volatile political
environment due to and after a bank meltdown in late 2008. Recent and rapid changes around
governmental regulations have affected several projects and project preparation. For example,
cooperative taxes have increased from 15% in 2005 to 20% in 2011. Also an Icelandic
location is subject to changes in freight costs and the development in crude oil pricing which

11
affects both feedstock and cost of product delivery. On the other hand the product prices will
develop in a relation to petrochemical raw material prices, so price increase in crude oil will
also result in an increase in product prices. This will more than compensate for the variations
in freight costs due to changes based on fuel cost variations.
Operational Risk
The main operational risk of this project is price fluctuation of crude glycerin and that crude
glycerin will increase more proportionally than the glycols being manufactured. As crude
glycerin is a by-product of biodiesel production a likely scenario is that supply will increase
with EU target by 2020 of doubling the use of renewable fuels. Competing use of glycerin are
methanol production by companies such as MCN in Netherlands, which converts glycerin to
methanol and new processes of the chemical company Solvay making epichlorhydrin, which
is intermediate chemical for plastics. Methanol is a relatively cheap chemical, so BioMCN
will unlikely be able to follow rising price of glycerin unless up to a certain level, so this will
dampen the raw material market.
Market prices for propylene glycol are expected to rise correlated to oil price as the main raw
material for conventional propylene glycol is propylene a directly derived petrochemical
product, thus hedging the price fluctuations of crude glycerin.
Permitting Risk
Permits need to be obtained by the local and national government. The most important
permits are environmental impact assessment and operational permits. Most of the sites are
already developed as industrial areas except for Djúpavogur, and no harmful emission will
come from the factory. Obtaining these permits is standard procedure, but this must be
adapted towards the specific site conditions and site requirements. However, these procedures
that are depending on local authorities might take more than one year to obtain, therefore they
might possess some scheduling risk. Necessary permits are however usually achievable well
within a year when projects are related to renewable industries in Iceland.
Technological and Scale Up Risks
Technological risks are believed to be mainly related to performance and lifetime
characteristics of the catalysts and catalysis systems, thus requesting decent and long time and
fundamental testing of catalysts to be applied. Reflecting IPD experience in process scaling
up projects using adherent reaction systems the scaling up risk has showed little deflection
towards the proportioning of the equipment and systems, but more related to unexpected
process fluid contamination, lack in material quality or due to poor operators skills.
12
In this project the catalyst candidate is commercially available, specially adapted for this
particular process by IPD. It has been extensively tested both by the manufacturer and also by
IPD. Testing runs for over 8000 hours or for one year have been realized. IPD has developed
special process features with this catalyst and tested it for 2000 hours under strain conditions.
The results obtained from those tests were outstanding and partially used to achieve process
patent. As part of the patent process all results have scrutinized by the patent authorities and
IP legal office.
Project Cost Risk
The presented Phase I project cost estimate, at the current stage of the project preparations, of
MEUR 17, 8 has -10%/+ 35% inaccuracy. The next pre-engineering work will deliver more
accurate numbers given the site specific information specifics. Even though in worst case
analysis of the project cost, the project profitability still looks promising as the EBITA
exceeds 35%, thus the project economy shows rather little dependency on variations in capital
cost.
About the technology: The technology implemented for this project will be the proprietary and newly patented
process of IPD and licensed to AGC. Process based on this technology reduces the emission
of greenhouse effect generating carbon dioxide compared to conventional production methods
that uses petrochemicals as feedstock. Not only is the project economical feasible, it also has
environmental benefits that both have market value that can lead to cost effective funding
from EU-green grant programs or green-technology investment funds.
The history of the idea to produce glycols by hydro-treating of glycerol steams from IPD
participations in two related projects. The former project was a pilot test executed in South
Africa for almost three years in 2001 to 2003. The aim of that project was to use sugars from
sugarcane mill to convert to glycols. The later project was executed in China over the period
from 2003-2005, with the aim to process corn glucose to glycols. This project was rated for as
10.000 MT per year demonstration unit. The experience and know-how from the processes
further lead to independent improvements and verification of new catalyst systems and
subsequent process technologies. In 2008 IPD build its own pilot plant for catalyst testing and
process development. Prove of process was achieved in 2009 that lead to a granted patent in
January 2011.

13
In test systems of this kind catalyst performances, in particular; yield, product selectivity,
hydrogen usage and catalyst lifetime characteristics are measured. This leads in general to an
effective scale-up of chemical processes of various kinds.
The process
Production process involves the pre-handling of glycerol; it is mixed with water and brought
into the reaction system as it comes into contact with specific solid catalyst along with
hydrogen. Additionally the process also needs the help of a catalyst, in this case it is alkali-
hydroxide but in small quantities to maintain the conditions and to ease the rapid reaction of
the preferred way. The hydrogen is piped into the system as well as other feeding chemicals
and the conditions thus created are to convert glycerin into glycol and some other alcohols.
The remaining production process is primarily to isolate and strengthening of the products
formed.
Figure 1 Simplified version of the process and production of the AGC plant in Iceland
The main elements of the process essentially constitute the bulk of the production which is
based on evaporation, thickening and distillation. These are relatively large heat users.
Hydrogen would be produced by conventional electrolysis or possibly lead to the processing
from other manufacturer in the area that had a by-product hydrogen. All water and other

14
unreacted materials are circulated and the process is thereby to maximize yield and utilization
of the materials.
In addition to liquid products, methane formulates in the productions process. This is a new
domestic source of methane, the energy medium suitable for cars. By using certain parcel of
circulating gases in the thinking process for the methane, the methane rate is increased to >
90% v / v. This process would increase methane production in Iceland and would bring in a
more stable stream of the product, as the other producer of methane in Iceland is using a
landfill area in Álftanes (in Reykjavík) and is therefore limited by both time and space.
The products The main products of AGC are shown in Table 3 below, but consist mainly of two kinds of
glycols; Propylene glycol (86 % of production by weight) and Ethylene glycol (11 %). The
remaining 3 % of the production are a mixture of second generation bio-ethanol and bio-
methanol and in addition to that some methane will be generated as gaseous by-product. In
this research it is assumed that those productions products would be the same in all locations.
Table 3 Shows G2G - Raw material usage/Product(s) distribution
distribute
Phase 1 Phase 2 Phase 3 Total
Raw material / products weight MT/year MT/year MT/year MT/year
Production capacity
30.000 35.000 60.000 125.000
Crude Glycerin (crude 80%) 41.209 48.077 82.418 171.703
Net feedstock Glycerin (100 %) 32.967 38.462 65.934 137.363
Methane 1,5 % of feed Glycerin 495 577 989 2.060
Methanol
2,0%
600 700 1.200 2.500
Ethanol propanol 1,0% 300 350 600 1.250
Total Alcohols.
3,0%
900 1.050 1.800 3.750
Propylene glycol
86,0%
25.800 30.100 51.600 107.500
Ethylene glycol 11,0% 3.300 3.850 6.600 13.750
Total liquid Products.
100,0%
30.000 35.000 60.000 125.000
Total liquid products - excluding methane: 30.000 35.000 60.000 125.000
Propylene glycol is used as a base compound in poly-glycol ethers and in polyurethane- and
polyester-resin formulations. Examples of products using propylene glycols are insulation
foam compounds, furniture, automobile interiors, resin in reinforced fiber glass for boat hulls

15
and rubber compounds for shoes. Propylene glycol is also used as surface active ingredient in
cosmetics, hygienic and pharmaceutical products.
Propylene glycol is a colorless, viscous liquid at room temperature. It doesn't have a true
freezing point, but becomes glasslike at -50°C, and it can lower the freezing point of water to
about -60°C. Propylene glycol is essentially nontoxic (generally accepted as a food product)
in comparison to ethylene glycol with its acute toxicity to mammals. Hence, the share of
propylene glycols of the U.S. and European aviation deicer market has grown significantly.
Companies like Union Carbide, Lyondell, Kilfrost and Clariant are among the major players
in the market. Shortages in supplies of propylene glycol lead to temporary closing of several
national airports in Europe late 2010. Affected airports were among others Heathrow,
Amsterdam, Frankfurt and Charles de Gaulle.
The market price in September 2011 was around EUR 1.250 pr MT free delivered in North-
West Europe (Rangarajan, 2011).
Ethylene glycol is used as a base compound in polyester formulations such as PET–bottles
and textile products, it is best known as radiator coolant liquid and antifreeze. Estimated
world market size in 2010 is 19.9 million metric tons (SRI Consulting, 2011) and the market
price in 2011 where around EUR 1230 pr MT free delivered North-West Europe.
Ethylene glycol has been the standard for antifreezes and deicers for decades because of its
relative low cost. It is a colorless, slightly viscous liquid with a freezing point of -13°C, and it
can lower the freezing point of water to about -50°C. Today the more environmental
propylene glycol is preferred.
The market price in June 2011 was around EUR 1.230 pr MT free delivered in North-West
Europe (ICIS (a), 2011).
Bio Methanol and Ethanol is currently blended into gasoline in Europe. European directives
require increasing percent of renewable fuels to be blended into gasoline, currently around 6%
of energy value, to be increased to 10% by 2020. Incentive programs such as tax discount and
pay back policies have been put in place in most of the EU countries to reach these goals.
Second and third generation of bio fuels from byproducts or emissions are given preference
for tax incentives. According to European Directive 2009/28/EC (European Parliament, 2009)
46, 5 million m3 should be blended into either diesel or gasoline by 2020, that requirement is
only met today by 24, 5 million m3 of biodiesel and 1, 9 million m3 of ethanol that is mostly
imported from Brazil.

16
About product application
Propylene glycol can be the main component for de-icing for aircrafts. Chloride salts
deicers are prohibited for use in aviation because of corrosive characteristic. Therefore
historically mixtures of Ethylene glycol and Propylene glycol have usually been used. Glycols
and other deicing chemicals are efficient freezing-point depressants. They act as an agent to
lower the freezing point of the solvent. Today, Propylene glycol is the main component of
aircraft deicers (about 80%), 10% is water and 10 % other chemicals. Typical application of
deicing fluid is to spray on critical surfaces of an aircraft, such as the wings, flaps, and
fuselage. It is heated to 65°C - 80°C and sprayed on aircraft surfaces at high pressure to melt
or remove ice, snow, or sometimes just defrost.
Market prices of raw material and products
Table 4 Shows Estimated product price and raw material price
1 Source: Rajiv Rangarajan, Director Somaiya Biorefinaries BV - Head trader for chemicals in Holland Office. Visit to Iceland 4. September
2011 (Rangarajan, 2011). 2 Source: Rajiv Rangarajan, Director Somaiya Biorefinaries BV - Head trader for chemicals in Holland Office. Visit to Iceland 4. September
2011 (Rangarajan, 2011).
3 Source: Rajiv Rangarajan, Director Somaiya Biorefinaries BV - Head trader for chemicals in Holland Office. Visit to Iceland 4. September 2011 (Rangarajan, 2011).
4 Source: Andri Ottesen Director of Business Operations CRI. E-mail 11.desember.2011. Sold for domestic use. 5 Source: Andri Ottesen Director of Business Operations CRI. E-mail 11.desember.2011. Sold for domestic use. 6 Source: IPD estimates
Chemicals: Price Phase 1 Phase 2 Phase 3 Total
Total value in Euro
Raw materials Crude Glycerin (80 %), ex factory 2801 11.538.462 13.461.538 23.076.923 48.076.923
Glycols
Propylene glycol
1.1502
29.670.000 34.615.000 59.340.000 123.625.000
Ethylene glycol 8503 2.805.000 3.272.500 5.610.000 11.687.500
32.475.000 37.887.500 64.950.000 135.312.500
Alcohols
Ethanol
7004
210.000 245.000 420.000 875.000
Methanol 7005 420.000 490.000 840.000 1.750.000
700
630.000 735.000 1.260.000 2.625.000
Gas
Methane (0,714 kg/Nm3) 4006 197.802 230.769 395.604 824.176
Total - without methane: 33.105.000 38.622.500 66.210.000 137.937.500
Total - average price pr MT
1.104 1.104 1.104 1.104
Total revenume - with methane 33.302.802 38.853.269 66.605.604 138.761.676
17
Market prices of the raw material and AGC products are based on prices during the period
May to September 2011 in the western European markets. The accuracy of those prices is
limited due to little or no public listing of those prices. There is of course volatility present at
the European markets, and those prices have the tendency to increase or decrease, but do not
have effect on selection of location for AGC factory. Our international business partner
HELM has guaranteed the sale of our main products the glycols and alcohols at the price of
5% of market value.
3. Literature view
This project is based more on the field of realistic approach than academic theories, and there
for it will lack the depth of academic fulfillment that otherwise would be have given this
report both structural and deeper validation. There is however a few theoretic approaches that
will be examined in this report and used to build foundation for conclusion about each
location and to give final assessment about the results.
There are both external and internal factors that all firms need take notice of and base their
future strategy with those factors in mind. The external factors are related to forces in a firm’s
external environment, and such can lead to new growth opportunities or can form of threats.
Example of a new opportunity is when a company can exploit the difference between
countries or/and geographical regions to achieve economies of scale in broadening the size of
the market they serve. Example of threat could be the entry of a new competitor on the market
that can weaken the position of existing firms. Internal factors are conditions within the firm
itself. Example of an opportunity from within could be a firm’s desire to exploit and employ
its resources and competences and the threat could be the threat of matching the firm’s
resources and competence to the marked. (Boddy, 2008, pp. 119-127) (Aubert & Frigstad,
2007, pp. 18-20).
PESTEL The aim is to analyze the external environment of a firm by applying the PESTEL framework.
The model is divided into six categories that represent the most influential factors in the
firm’s environment which are indicated as; political, economic, social-cultural, technological,
environmental and legal factors. The model can be regarded as a checklist about how to
evaluate the firm’s environment and as the macro-environmental forces changes over time it
is imperative to understand the key drivers of change and the impact they have on particular

18
The external environment of a
firm
Political
Economic
Socio-cultural
Technological
Environmental
Legal
industries. PESTEL analysis relies on past events and experiences, and from a prescriptive
strategy view it can be used to forecast about the future, but should be focused on things that
do have impact or are most likely to change and affect the firm (Lynch, 2009, bls. 82-83).
Political environment
The political system in a country has a major influence on how businesses and industries
operate. Political factors are closely linked to economic factors especially in how they allocate
resources and deal with property ownership. In many words political stability and type of
government are political factors that can determine attractiveness of the market. As seen here
in Iceland political and social events can have deep impact on profitability firms as the whole
economy can be stained with political risk (Boddy, 2008, p. 121).
Sovereign risk which could arise from policies and decisions of the government,
Lack of consistent legislation and effective policies.
Corruption within the government or/and local municipality
International risk that are linked to developments to the international political arena
Policies towards foreign companies acquiring local firms
Patent and intellectual property policy
Figure 2 Shows the PESTEL framework (Aubert & Frigstad, 2007, p. 25).

19
Economic environment
Economic environment is both at local level and international level of a country. It includes
economic development and has significant impact on firm’s activities in the market place and
the size of the market. Example of economic development is could be income per head of the
population or measure of gross domestic production (GDP). To operate in the economic
environment firms need to adapt to a veracity of many opportunities or/and obstacles, to name
a few; currency rates, interest rate and inflation rate, that are likely to considerably affect a
firm’s revenues and future growth.
Unemployment rate
Labor cost
Stock market values
Currency exchange controls
Social-cultural environment
Social-cultural factors have most effect on firms and industries when there is a change in form
of increase or decrease in population of the country. Another similar factor could be if the
population is aging which could indicate more demand for healthcare or the average age could
be lowering which would indicate more demand on daycare and education. Cultural barrier
can be an obstacle for firms moving between countries or country sites, as the difference can
be in form of religion, old traditions and languages (Hollensen, 2011, bls. 242). Other
important factors are (Boddy, 2008, p. 120):
Lifestyle in changes
Levels of education
Levels of healthcare
Gender equality
Technical environment
For a firm it is of most importance how well the basic infrastructure in the country is made.
Infrastructure is basically the physical facilities that support all economic activities (Boddy,
2008, p. 124). So what we call basic infrastructure in each country we are referring to
example:
Road system
Telecommunications system

20
Volume and stability of power system
Ports
Airports
Natural environment
For the business context the natural environment has increasingly become a factor that
represents an opportunity or threat. One of the key issues is the consideration of natural
resources on what is renewable and what is not. Example of this could be oil which is not a
renewable resource but geothermal power is renewable. More and more firms adapt to this
new environmental friendly practices as a result of the demand from the market which is a
part of the changed lifestyle in the western hemisphere. There has been increased demand of
more environmental friendly products from the public and government. A special interest has
been shown from international agencies over the recent years in issues evolving the protection
of the environment (Boddy, 2008, p. 125).
Environmental laws
Waste disposal
Environmental governance
Legal environment
Every country has its own laws and regulations that the government creates for the firms and
industries so they can operate in the economy without collision. A change in regulation can
affect operation of a firm in the market both for the better or worse for the firm. Example of
this could be if the government would put a tariff on import on beef, it could benefit some
producer within the industry, but could damage the sales on imported beef for importers and
the distributers. Example of legal factors that could affect the market is (Boddy, 2008, p. 97):
Tax laws
Labor laws
Competitive laws
Consumers protection laws
NPV The Net Present Value (NPV) method is used for measuring the profitability assessment of
investment over period of time. In the most general terms, the NPV criterion method can be
divided into four subtopics or time analysis periods: present worth method, future worth

21
method, annual worth method, and capitalized worth method (Remer & Nieto, 1995, p. 82).
The present worth method that is used in this report is in most fundamental way, can be
descript as the present value of all cash inflows is compared to the present value of all cash
outflows associated with the investment project. What is called the NPV rule indicates that
investment is should be accepted if the NPV is greater than zero and subsequently to reject
project that if the NPV is lower than zero (Ross, Westerfield, Jaffe, & Bradford, 2008, p.
162). In calculating the NPV the user must determine the interest rate used in discounting the
cash flow, and in most cases the rate is at where the investors can alternatively invest their
money, i.e. the return of the most preferable alternative investment. Another important factor
is the planned horizon of the project which has to be determined as well, and subsequently the
cash flows for each period of the planning horizon projected (Remer & Nieto, 1995).
Equation 1 Shows the formula for NPV (Ross, Westerfield, Jaffe, & Bradford, 2008, p. 101).
Where
CI = Net cash flow at the end of period T.
i = interest rate of the project
T= Service life of the project
When comparing mutually exclusive alternatives the investors need to select the one that has
the greatest positive NPV. But when comparing alternatives it is of most important to use the
same interest rate and equal time periods for all alternatives investments. (Remer & Nieto,
1995, p. 85).
IRR The Internal Rate of Return is most important alternative to NPV method. The IRR is
calculated both on project and equity.
One of basic rationale behind the IRR method is that is provides a single number which
summarizes the merits of a project and does not depend on anything except the cash flow of
the project. Note that the single number does not depend on the interest rate prevailing in the
capital market, but much rather that the number is internal or intrinsic to the project and does
NPV
Equation 2 Shows Internal Rate of Return (Ross, Westerfield, Jaffe, & Bradford, 2008, p. 170)

22
not depend on anything other than the cash flow of the project. The general rule of IRR is to
accept projects if IRR is greater than the discount rate and reject the project if the IRR is less
than the discount rate. (Ross, Westerfield, Jaffe, & Bradford, 2008, pp. 169-171).
4. Framework of this analysis In this analysis there is used the same excel model in all different locations. In our search for
finding profitable location for AGC factory, the focus is mainly on the big cost drivers and
other cost is mostly fixed. The following chapter is therefore in two fields of exploring this
excel model, the first field is about big and expensive cost drivers that vary from location to
location. And the other is about the smaller field that does not affect the big picture as much
or is important but is similar to all locations.
Similar cost between locations
Currency
In forming this analysis it was crucial to synchronize currency to a fixed level. There are few
currencies that are used trough out this report and that can be problematic do to volatility at
the financial markets. To asses that problem the decision was taken to use fixed numbers as
shown here below.
Table 5 Shows currency rates (ISK to :) use in this report (SI, 2011).
USD
116,0
EUR
159,0
GBP
183,0
NKR
21,00
Those currencies are chosen and fixed in this analysis to ease calculations and neutralize
fluxions in currencies. Those numbers were chosen as a result of taking the average position
each currency had against the Icelandic krona (buy) during the time period 1st of September
2011 and 11th
of November 2011.
Employees
The staffing of the company and what requirement each job holds is based on estimates by
Icelandic Process Development. As seen in the tables below the staffing requirements are
based on three phases. The first phase requires 22 people, the second requires 30 people and
the third requires 39 people.

23
Table 6 Employment - phase 1 + additional workers for expanding to Phase 2 and 3:
Unit cost Phase 1 Phase 2 Phase 3
Description pr year Number Euro Number Euro Number Euro
Managing Director
58.1257 1 58.125 Production Dir. 55.3508 1 55.350 Laboratory Dir. 49.0509 1 49.050 Line staff
24.90010 12 298.800 4 99.600 4 99.600
Maintenance
41.25011 2 82.500 1 41.250 2 82.500
Quality assurance 40.95012 2 81.900 1 40.950 1 40.950
Office workers
41.55013 1 41.550 1 41.550
0
Various 27.75014 2 55.500 2 55.500 1 27.750
Total:
22 722.775 9 278.850 8 250.800
Phase 2 - total staff and cost: 31 1.001.625
Phase 3 - total staff and cost: 39 1.252.425
The table shows the additional employee cost each phase ads and in what field of expertise
the increasing numbers are. The wages are based upon surveys from selective workers unions
within this year, but are mostly from the first months of the year 2011. In all cases the
medium salary in same or similar field was used except in the case of managing director and
production director the highest amount was used as in those two cases the higher wages are
more likely to give better example of current market structure on wages due to the difficulty
of the new industry. In all location the need will be the same for staff and the decision was
made that the same amount of wages will be used in all locations. There are of course
differences in wage structure in Iceland and it is very probable that ground staff in Bjarnarflag
or Djúpavogur would be willing to work for lower wages than in Helguvík or Grundartanga,
but at the same time that would be the opposite problem regarding very skilled or highly
educated employees in management and supervision. It is there for a likely scenario that
wages structure would be on level terms regarding location in Iceland.
7 Framkvæmdast/önnur stjórnunarstörf (VR, 2011, p. 6).
8 Sviðsstjórar (VR, 2011, p. 6).
9 Vöruþróun og hugbúnaður** (VFI, 2011, p. 19).
10 Framleiðsla eða pökkun (VR, 2011, p. 7). Note: without extra % because of sifts
11 Eftirlit (TFÍ, 2011, p. 18).
12 Eftirlit (VFI, 2011, p. 19)..
13 Hag- og viðskiptafræðingar (VR, 2011, p. 6).
14 Gæslu-, lager- og framleiðslustörf (VR, 2011, p. 7).

24
Marketing cost, license fee and cost of catalyst
Marketing cost, license fee and cost of catalyst as shown below are based on recommendation
from IPD and representative of Somaiya Biorefineries in Holland. Included in the marketing
cost is storage for AGC products in Rotterdam and unloading cost propylene and ethylene
glycols. As indicated earlier our international partner Helm has guaranteed the sales of AGC
products in the international market but at the cost of 5% of the sales price.
Table 7 Shows AGC marketing cost, license fee and cost of catalyst
Desription
Phase 1 Phase 2 Phase 3 Total
Marketing cost: 4,0% of sales:
1.332.112 1.554.131 2.664.224 5.412.500
Royalty: 1% of sales 1% Euro per t product.: 331.050 386.225 662.100 1.379.375
Catalyst cost 40 Euro per t product.: 1.200.000 1.400.000 2.400.000 5.000.000
The royalty cost is the exclusive fee for the design and process license that belongs to IPD
owner Mr. Friðbjarnarson.
Various fixed cost
In the table below there is a list of some various cost that will be very similar between
locations, the only variable that do behave differently are maintenance and insurance because
they are calculated here as a percentage of the total investment and therefore will change
between locations, however that fact will not have significance to the choice of location and
therefore it is of less concern than other factors.
Table 8 Shows AGC various fixed cost
Phase 1 Phase 2 Phase 3 Total
Maintenance: 4,0% of investment: 606.747 600.000 860.000 2.066.747
Insurance:
0,75% of investment: 113.765 112.500 161.250 387.515
Travels - staff: 7000 Euro per person 28.000 7.000 7.000 42.000
Telephone: 400 Euro per person 8.800 3.600 3.200 15.600
IT system:
1700 Euro per person 37.400 15.300 13.600 66.300
Security:
estimate
60.000 15.000 15.000 90.000
Auditing and consulting:
estimate
70.000 17.500 35.000 122.500
Various cost: estimate 184.942 154.180 219.010 558.132
Total - various fixed cost:
1.109.654 925.080 1.314.060 3.348.794
Percentage of total sales:
3,0% 2,1% 1,8% 2,2%

25
Other important aspects of the business plan are as follows:
Energy usage is based on an estimate made by Icelandic Process Development.
Other cost factors are based on experience from industrial projects in Iceland, Europe
and America or is an estimate made by Icelandic Process Development.
Different between locations
In this category are the most costly factors to the new factory. The following cost drivers
affect the investment or/and operations depending on location. In many locations there is not
much difference individually between investments but the cost can change the financial
structure significantly.
Investment cost
The following table shows what IPD assessments of probable investment cost for the 1 phase.
Those buildings mentions below are what IPD identifies for required need in building the
G2G factory of 30.000 tons capacity. The need for investment cost for phases 2 and 3 are
identified as well but not in details, but additional hydrogen electrolyser and storage tanks are
need for expanded operations..
Table 9 Shows Investment estimate - phase 1, 2 and 3
Phase 1 - 30.000 tons capacity: Euro Depreciation
Design, engineering, construction management:
1.500.000 9% 10,0% Land, building and premises:
1.200.000 7% 3,0%
Storage tanks:
1.400.000 8% 10,0% Hydrogen electrolyser:
3.000.000 18% 12,5%
Evaporators and distillation:
3.800.000 23% 10,0% Other fixtures and fittings:
3.200.000 19% 10,0%
Contingency: 2.500.000 15% 10,0%
Total: -10 % /+35% accuracy
16.600.000 100% 1.651.000 annually
Year 0-2
Phase 2 - 35.000 tons capacity:
Total investment: -10 % /+35% accuracy
15.000.000
9,9%
Year 3-4
Phase 3 - 60.000 tons capacity:
Total investment: -15/+-50 % accuracy
20.700.000
9,9%
Year 5-6
At some sites there will be change from this table either added or withdrawn investments that
will be suited to each location. Initial investment is one of the key areas of our research as we
look at each location, with the purpose of valuating the total investment needed and assess
them toward operations.
It is possible to decrease the estimated investment cost in Phase I: Firstly, if AGC could build
the Phase I of the project where it would have access to hydrogen from external source. By

26
that the investment would be decreased by about EUR 2, 4 million or to EUR 14, 1 million.
Secondly, it could be an option, depending on location, to hire tank space. Our estimated
investment in tanks is EUR 2, 4 million. This figure could be decreased by about EUR 1
million lowering the possible total investment cost to approximately EUR 13, 1 million.
Thirdly if AGC could build its distillation unit close to a geothermal site or build Phase 1 of
the project where it would have access to steam from external source. Those cost lowering
options are however site dependent on locations as following analysis in later chapter will
show.
Investment estimate are estimated by Icelandic Process Development.
Depreciation is in line with Icelandic laws.
Finance and funding
Financing the three phases will be divided between loan capital and equity. In the phase 1 the
aim is to get finance from investors up to 75% of the total amount needed for that phase. We
assume that loan capital would be 25% of the needed capital and preferably from Godavari as
a bridge loan as we have indication about that from their representatives. As the expansion of
the factory in phase 2 and 3 occurs AGC factory will be generating profit and revenues and
the need for equity capital grows less and loan capital grows cheaper.
Table 10 Shows AGC expected funding
Investment Equity Loan capital
Euro % Euro % Euro
Phase 1 16.600.000 100% 12.450.000 25% 4.150.000
Phase 2 15.000.000 100% 3.000.000 80% 12.000.000 Phase 3 20.700.000 100% 4.140.000 80% 16.560.000
Loan capital is expected to be 8 year loans with an interest rate that is 600 points +
libor.
Transport
In the field of transport it is assumed that the sea freight and land transport that AGC would
receive the same price in all locations. We have confirmation from Nesskip that their prices
are based on the ton in the cargo but not the distance. We have some conformation from
Olíudreifing that those prices we received are valid but in the case of Djúpavogur we only
assume that Olíudreifing can offer us the service needed at that location.

27
Sea transport:
Nesskip hf. is an Icelandic company founded in 1974 in
Seltjarnarnes and is a leading company in Iceland in ship
broking, agency services and consultancy. From the early start
the company has been heavily involved in transporting pumice,
salt, and fishmeal and fish oil. Today Nesskip hf. is a subsidiary
of Wilson ASA in Bergen, Norway (Nesskip hf., 2011). Wilsons
ASA focuses on short sea segment within Europe and operates
around 112 vessels ranging from 1.500 – 10.000 deadweight
tonnage (dwt) (Wilson ASA, 2011). Shipping between Iceland
and Europe is vital for our operation and we have had
discussions with Neskip who are one of the leading companies
in Iceland in leasing bulk ships. We have made an inquiry about
what price we could expect for importing glycerin in to Iceland
and exporting glycols out of Rotterdam. The price would be 25
Euro’s if we import 3500mts Rotterdam-Akranes in combination
with 2500mts export Akranes-Rotterdam.
Land transport:
Olíudreifing ehf. (ODR) was founded in 1994 by Olíuverslun
Íslands hf and Olíufélagið hf. to reduce operational cost of
distribution. ODR´s main role is to store and distribute
petroleum products for the owners and specialized maintenance
for service stations and own equipment (ODR, 2011). ODR
leases oil tanks in two locations where AGC is currently looking
into, in Helguvík and in Húsavík. In discussions between AGC
and ODR about possibility of AGC leasing the tanks form ODR
for its glycol production, ODR has established price for leasing
two 16 ton tanks and one 4 ton tank would cost 36.000 euros per
month. AGC needs transportation inland for its liquid products
and ODR is ideal candidate as it operations include the whole
Iceland. ODR indicates that the average cost per liter would be
0, 0077 euro (1, 18 ikr) in transport and the company would
allocate two trucks with trailers to the service.

28
Table 11 Shows freight cost - logistics:
Description Euro/MT
NW-Europe-Iceland, liquid cargo
2515 Trucking - factory to harbor - liquid cargo 7,4216 Trucking & Storage factory to depot - alcohols 16,517 Piping- factory to depot - methane 4018
Sea freight is very sensitive to load size. Freight cost for 1.250 tons cargo lots is 50 Euro/MT
where’s freight cost for 25.000 tons lots is 15 Euro/MT.
Energy
The power usage of the G2G process can be split into three in the initial phase:
a) Electrical usage (H2 production 2/3 of the total): About 35 million kWh or 35 GWh/a
The main advantage of an Icelandic location is the access to energy at favorable prices: The
electrical energy is 2 euro cents per kWh (Investum, 2009), but additional price for
connection to the electricity grid is due and depends on which transmission company is
distributing the electricity to the user’s location. It is possible to make a special arrangement
with the Icelandic power companies to buy what is referred to as non-priority electricity.
There is a possibility of an occasional cut-off but in our case that is not an issue as the G2G
process is not sensitive to electrical cut-offs.
The G2G process is not a large user of electrical power except for the production of hydrogen
which is a major utility material in the process. If the hydrogen is produced on site by
electrolysis, the electrical power consumption is significant.
The Icelandic electric market is divided into two separate entities by law. The production of
electricity is in competitive environment and users can purchase the electricity from many
sources. The distribution network is how ever subjected to patent licensing and every user has
to connect to local distribution.
b) Thermal power usage – equivalent to: About 70 million kWh or 70 GWh/a
By locating the factory close to a source of geothermal heat the thermal energy cost will be
lowered considerably compared to what it costs if we use electricity, oil or gas or other
combustible materials.
15
Source: Már Gunnarson transport manager at Nesskip -email dated 30.09.2011 16
Source: ODR email to Andri Ottesen 17
Source: ODR email to Andri Ottesen 18
Source: IPD estimates

29
c) Hydrogen power usage:
There is no available source of hydrogen in Iceland in enough quantity to sustain the process
of AGC factory for all the three phases, but there have been signs that the well-known
international industrial company Kemira is keen on raising a bleaching factory in either Bakki
or Grundartangi. One of Kemira by-products is hydrogen in enough quantity for AGC to buy
their by-product at a fair price, and therefore lower the cost of electricity.
The table below shows how IPD estimates the energy needs of the AGC factory and gives the
reader a clearer view of those three factors that are so important for the operations. The table
here is not accurate and does not relate to all the locations, but only to give the reader a notion
of how it works.
Table 12 Shows the three main power consumption factors to AGC factory
Phase 1 Phase 2 Phase 3 Total
Transmission cost
149.186 285.850 559.180 994.216
Electrical consumption - full capacity: kW 1.180 2.360 4.720 8.260
Number of hours:
8.300 8.300 8.300
Gigawatthours: 9,794 19,588 39,176 68,6
Electrical cost -Euro/kWh 0,023 0,023 0,023
Total cost at full capacity: Euro
374.448 736.374 1.460.228 2.571.050
Thermal power consumption: kW
8.500 17.000 34.000 59.500
Converted to steam equiv. (t/h, 12 bar): t/h
14 28 56 97
Operating hours per year: 8.300 8.300 8.300
Cost of steam equivalent: Euro pr ton 15 6 6
Total thermal power cost at full capacity: Euro
1.731.682 1.385.345 2.770.691 5.887.718
Hydrogen power consumption: Nm3/hour
900 1.800 3.600 6.300
Converted to t/h
0,08 0,16 0,32 0,567
Number of hours
8.300 8.300 8.300
Cost of hydrogen: Euro pr. Ton 700 700 700
Total hydrogen power cost at full capacity: Euro
470.610 941.220 1.882.440 3.294.270
Tank storage rental (Euro Per Year)
200.000 300.000 600.000 1.100.000
Thermal power generated with electricity:
Gigawatthours - efficiency 1,1 77,6 155,2 310,4 543,2

30
Key companies in energy production sector
Landsvirkjun (LV): Is a private company founded in 1965 and
is in full ownership of the Icelandic government and as such
operates under specific law dated from the year 1983 (Alþingi,
2009). LV is by far biggest producer of sustainable energy in
Iceland with about 75% share of total electric production and
with production sites spaced all around the country
(Landsvirkjun, 2011). Produced close to 12, 6 terawatt hours of
in the year 2010 and is one of 10 largest energy production
companies of sustainable energy in Europe (Landsvirkjun (b),
2011, p. 14).
Orkuveita Reykjavíkur (OR): Is a private company in the
majority ownership of some the biggest municipal in the south-
west peninsular including Reykjavík municipal. The operating
area is the Southwest-coast and Western part of Iceland. OR
operates four main power plants in Iceland: two geothermal
power plants Hellisheiðarvirkjun (213 MW) and
Nesjavallavirkjun (120 MW), and two hydropower plants
Elliðaárvirkjun (3,2 MW ) and Andakilsárvirkjun (11,4 MW)
(Orkuveita Reykjavíkur, 2011).
HS-Orka hf: Is the third largest company in the Icelandic
electric production market. The company was founded in 1974
by local municipalities in Reykjanes peninsular. Today HS-Orka
is in majority ownership of Magma Energy Sweden AB (75% of
shares) and Jarðvarmi (25% of shares). HS-Orka produces
electricity from two geothermal sites Svartsengi (75 MW) and
Reykjanesvirkjun (100 MW), and produces electricity (4 MW)
and steam (12 bar) in Kalka. Kalka is a sustainable incineration
that burns waste in special high-temperature furnaces which
operates in accordance with EU directives (HS-Orka, 2010).

31
Key companies in energy distribution sector
In all the locations in this report there is a need for investment in connectors that runs between
the AGC factory and the energy distribution companies. These investments may vary between
locations but in this report the same assumption will be used for all locations. According to
Landsnet information we will use the following evaluation to estimate the cost for connector
for the distance of 1 kilometer (Ásmundsson, 2011).
Table 13 Shows the cost of connection with the transmission grid
Connectors to the transmission grid
Underground cable 66 kV - 35 MVA 226.415 €
primary station 66 kV 522.013 €
Total cost 748.428 €
Picture 1 Shows Landsnets distribution network in Iceland 2010 (Landsnet, 2011).

32
Landsnet: Is a private company in the majority ownership of
LV (64, 73% shares) and RARIK (22, 51% shares). The
company operates under a concession arrangement and is
subject to regulation by the National Energy Authority
(Orkustofnun), which determines the revenue framework which
the company tariffs are based on. The company was established
on the basis of the 2003 Electricity Act. The company owns and
operates all of the Icelandic major electricity transmission
system and administers its system operations. All power stations
with the capacity to produce 7 MW or more are legally obligated
to be connected to Landsnet power grid. Landsnet focuses on
customers that are large intensive users and small distributers
(Landsnet, 2011).
Table 14 Shows Landsnet Transmission charges for intensive users
Phase 1 Phase 2 Phase 3
Tariff Tariff Tariff
Delivery Charge 39.029 € €/year 39.029 € 39.029 € 39.029 € Capacity charge 20.650 € €/MW
127.618 € 255.236 € 510.473 €
Energy charge 1,045 € €/MWh
53.588 € 107.177 € 214.353 €
Ancillary services 0,162 € €/MWh
8.297 € 16.595 € 33.189 €
Transmission losses 0,368 € €/MWh 18.872 € 37.745 € 75.489 €
Total
247.405 € 455.781 € 872.533 €
The table above shows the traditional tariff for companies that are intensive users.
Rafmagnsveitur ríkisins (RARIK): Is a private company in
the ownership of the Icelandic government. The company was
established in 1946 with the purpose of developing various
power projects throughout Iceland. In 2006 the company was
changed to RARIK ltd. and now focuses on distributing
electricity to smaller customers. RARIK distribution network
has close to 90% share of reach in rural areas in Iceland
(RARIK ltd., 2011).

33
HS-Veitur: Is a private company in the majority ownership of
Reykjanesbær (66, 7% of shares), OR (16, 5% of shares) and
Hafnarfjarðarbær (15, 4% of shares). The company is the largest
distributer in the Reykjanes peninsula, in Árnessýslu and in
Vestmannaeyjar. The company was founded in 1974 by local
municipalities in Reykjanes peninsular and was part of HS Orka
until the new energy laws in 2005 separated them into two
companies (HS Veitur, 2011).
As AGC G2G factory fails to reach the requirements of Landsnet of using over10 MW or at
least 80 GWh per year in phase 1 in all locations, the factory needs to use small distributers
like HS Veitur and RARIK and has to pay additional fees for their service. There is a
possibility to connect to Landsnet from the start, but to do so AGC has to reach approximately
the capacity of over 10 MW or 80 GWh within 3 years. .
Figure 3 Shows additional cost using small distributors (Landsnet (b), 2011).
Surcharge = Initial cost * Annual percentage * Share in stepped-down cost
Energy amount * Energy charge + Power * Power charges
Initial cost Signifies the starting cost on account of voltage step-down, here in Euro
Annual percentage Refers to the percentage of the initial cost (to be collected each
year) and other financial cost associated
Share in stepped-down voltage cost Amounts to 80% of the stepping-down expense
Energy amount Is the customer’s annual amount of energy, in MWh
Energy charges The charges for energy to power intensive users,
according the Landsnet tariff
Power
Stands for the customer's agreed peak power
Power charges Charges for power to power intensive users, according to Landsnet tariff

34
By putting in the numbers in the equation we find the Surcharge:
46,12% = 1.273.83519 * 0,08220 * 0,8
51.29421 * 1, 04522 + 6.18023 * 20.65024
By identifying the surcharge it is possible to finalize the model to find the total cost of
transmission for the AGC factory. By using the model in table 16 we can establish by some
accuracy the final cost.
Table 15 Shows how strain affects transmission cost
Usages
Load capacity 6,18 MW
Energy 51.294 MWh
Utilization 8.300 hrs.
ISK/EUR 159,00 ISK kr.
Tariff for intensive users
Delivery Charge 39.029 EUR per year
Capacity charge 20.650 EUR per MW per year
Energy charge 1,04 EUR per MWh
Ancillary services 0,1618 EUR per MWh
Transmission losses 0,3679 EUR per MWh
Intensive users strain
Delivery Charge 0 EUR per year
Capacity charge 9.523 EUR per MW per year
Energy charge 0,48 EUR per MWh
Ancillary services 0,0000 EUR per MWh
Transmission losses 0,0000 EUR per MWh
Additional fee
Delivery charge 0 EUR
Capacity charge 58.851 EUR
Energy charge 24.712 EUR
Total for transmission 83.564 EUR
19
Source: Guðmundur Ingi Ásmundsson Deputy CEO at Landsnet ,email dated 08.11.2011. Landsnet estimated
cost* 20
Source: Guðmundur Ingi Ásmundsson Deputy CEO at Landsnet ,email dated 08.11.2011. 21
Source: IPD estimates 22
Source: Landsnet tariff (Landsnet (b), 2011). 23
Source: IPD estimates 24
Source: Landsnet tariff (Landsnet (b), 2011).

35
Up dated tariff
Delivery Charge 39.029 EUR per year
Capacity charge 30.173 EUR per MW per year
Energy charge 1,53 EUR per MWh
Ancillary services 0,1618 EUR per MWh
Transmission losses 0,3679 EUR per MWh
Total tariff
Delivery charge 39.029 EUR
Capacity charge 186.469 EUR
Energy charge 78.301 EUR
Ancillary services 8.297 EUR
Transmission losses 18.872 EUR
Total for transmission 330.968 EUR
If we compare total cost in phase 1 in table 5 and the total cost in table 6 we can conclude
that the strain is increasing the cost by 25, 25%.
Table 16 below shows the basic estimate of the electrical usage in a small scale industrial
production unit producing 30.000 tons of glycols and alcohols per annum.
Table 16 Shows Power consumption by electrolyser
Power Consumer/Equipment/device Power Consumption Installed Power
kW kW
Hydrogen electrolyser for a 2 x 480 Nm3/h, 30 tones production capacity 5.000 6.000
Main hydrogen compressor 250 300
Auxiliary compressor 80 100
Vapor compressor(MVR) 300 400
Circulation pump, water removal unit 15 20
Main feed pump 50 30
Cooling water circulation pump 45 60
Distillation tower-1 5 7
Distillation tower-2 20 25
Distillation tower-3 10 15
Distillation tower-4 10 10
Thin film evaporator 40 50
Lights, ventilation etc. 30 40
Various systems 300 400
Office, controls etc. 25 30
Intermediate sum 1.180 1.487
Contingency 10% 618 748,7
Total 6.180 7.487
Total without electrolyser 1.180 1.487
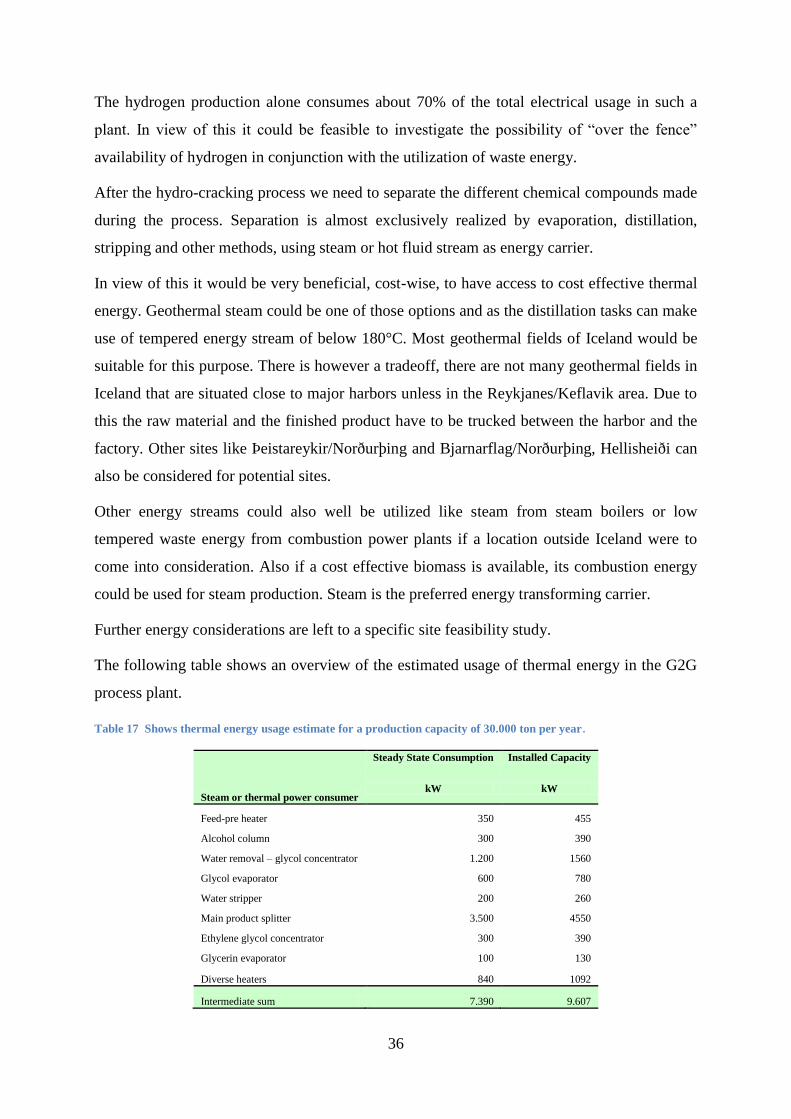
36
The hydrogen production alone consumes about 70% of the total electrical usage in such a
plant. In view of this it could be feasible to investigate the possibility of “over the fence”
availability of hydrogen in conjunction with the utilization of waste energy.
After the hydro-cracking process we need to separate the different chemical compounds made
during the process. Separation is almost exclusively realized by evaporation, distillation,
stripping and other methods, using steam or hot fluid stream as energy carrier.
In view of this it would be very beneficial, cost-wise, to have access to cost effective thermal
energy. Geothermal steam could be one of those options and as the distillation tasks can make
use of tempered energy stream of below 180°C. Most geothermal fields of Iceland would be
suitable for this purpose. There is however a tradeoff, there are not many geothermal fields in
Iceland that are situated close to major harbors unless in the Reykjanes/Keflavik area. Due to
this the raw material and the finished product have to be trucked between the harbor and the
factory. Other sites like Þeistareykir/Norðurþing and Bjarnarflag/Norðurþing, Hellisheiði can
also be considered for potential sites.
Other energy streams could also well be utilized like steam from steam boilers or low
tempered waste energy from combustion power plants if a location outside Iceland were to
come into consideration. Also if a cost effective biomass is available, its combustion energy
could be used for steam production. Steam is the preferred energy transforming carrier.
Further energy considerations are left to a specific site feasibility study.
The following table shows an overview of the estimated usage of thermal energy in the G2G
process plant.
Table 17 Shows thermal energy usage estimate for a production capacity of 30.000 ton per year.
Steam or thermal power consumer
Steady State Consumption Installed Capacity
kW kW
Feed-pre heater 350 455
Alcohol column 300 390
Water removal – glycol concentrator 1.200 1560
Glycol evaporator 600 780
Water stripper 200 260
Main product splitter 3.500 4550
Ethylene glycol concentrator 300 390
Glycerin evaporator 100 130
Diverse heaters 840 1092
Intermediate sum 7.390 9.607

37
Contingency 15% 1.109 1.441
Total 8.499 11.048
Total steam equivalent[t/h, 12 bar] 13,9 18,1
The energy cost for a comparable factory in Europe is likely to be EUR 2-4 million higher
than in the Icelandic case. The location cost for Iceland in terms of transport from/back to
Europe is estimated EUR 1, 5 million in comparison.
Figure 4 Shows annual consumption in Europe: 500 MWh < consumption < 2 000 MWh; excluding VAT (Eurostat,
2011).
The location advantage for Iceland is therefore Euro 1, 0- 2, 0 million taken into consideration
lower construction, labor and other site benefits. Common electrical power prices for
industrial units in Europe are in the range from € 61-180 MW per hour. Furthermore steam
costs if produced on site in a steam boiler, using natural gas as a feedstock, are estimated to be
€ 25-30/ton steam (12 bar).
As has been explained the energy cost is probably one of the most important factors in
deciding to invest. There are also other factors worth looking into including:
Devaluation of the ISK following the banking crisis in 2008 has improved the
environment of all export oriented industries in Iceland.
Wages and salaries are much lower in Iceland than elsewhere in W-Europe.
A stable and well educated workforce.
Corporate tax is currently 20 % (2011).
No restrictions on currency movements on new investments.
Located between the US and the European market.
0,00 20,00 40,00 60,00 80,00
100,00 120,00 140,00 160,00 180,00 200,00
Bo
snia
an
d …
Bu
lgar
ia
Esto
nia
Fin
lan
d
Turk
ey
Ro
man
ia
Fran
ce
Swed
en
Cro
atia
Hu
nga
ry
Un
ited
Kin
gdo
m
Latv
ia
Slo
ven
ia
Po
rtu
gal
Den
mar
k
Luxe
mb
ou
rg
Gre
ece
Po
lan
d
Net
her
lan
ds
Lith
uan
ia
Bel
giu
m
EU-2
7
No
rway
Cze
ch R
epu
blic
Spai
n
Euro
are
a (5
)
Irel
and
Ger
man
y
Slo
vaki
a
Ital
y
Cyp
rus
Mal
ta
Electricity prices in Europe the first half of 2011 in €/MWh

38
5. Helguvík Helguvík is a part of Reykjanesbæ municipal on the south-west
peninsular of Iceland. The municipal was formed in 1994 when
Keflavík, Njarðvík and Hafnir amalgamated into one municipal.
Helguvík is on the outskirt of Keflavík from the north site. In
Reykjanesbær there are currently 13 thousand inhabitants where the
main occupation is in the fishing industry and in the services sector
mainly around Keflavik airport (Reykjanesbær, 2011).
Helguvíkurhöfn: Length of pier is 150 meters and maximum length
of overall allowed ship is 200 meters. Depth is 10 meters. Distance from center of
Reykjanesbær is 4 kilometers (Reykjaneshöfn, 2011).
About the project in Helguvík
Among the advantages of
locating a glycol plant in
Helguvík is an access to a
favorable industrial site close
to one of the deepest harbor
in Iceland. There are many
advantages to raising AGC
factory in Helguvík,
excellent roads and within 5
kilometers to International
Airport in Keflavík.
Furthermore, due to the recent announce of the execution of a silicon project in Helguvík of
“The Icelandic Silicon Corporation” there will be a potential for a synergy through a thermal
source. The Silicon operation will start by middle of year 2013 and will deliver excess energy
in the form of hot water and economical supply of steam from their waste energy recovery
system.
One of the main utility parameter is steam and will therefore be more easily available as
“steam-over the fence”. This particular site gives a possibility for cheap construction lot for
the erecting of plant systems and product storages within several hundreds of meters from
harbor dock, which enables the pumping of both feedstock and products via pipes. Raw
material storage can be rented from an existing tank terminal, which enables economical sea
Picture 2 Shows a possible location[X] for a glycol producing plant in
Helguvík

39
transportation in larger lots. The distance from Icelandic Silicon Corporation site is about 400
meters which is considered to be the length of a steam pipeline connecting those two with
thermal energy service also has the potential of offering and the sharing of some other utilities
(AGC ehf, 2011). Helguvík has the potential to develop further and in future the municipal
hopes that sustainable industry will be part of the economy and possible future music will be
advanced Chemical Park in Helguvík. At this moment the process has already begun in
Helguvík, as the process of assessment of environmental effects has already begun and
evaluation is expected soon.
Investment in Helguvík In addition to all needed buildings and machines that were identified in the initial IPD
estimated valuation. There is a shortage of tanks for the processed products and by IPD
estimate there is need for one tank at the size of 4000m3, another tank at the size of 2500m
3
and finally one tank the size of 1000m3. The increases the investments are needed in the
beginning of the project.
Table 18 Shows AGC Investment estimate at Helguvík- phase 1, 2 and 3
Phase 1 - 30.000 tons capacity: Euro Depreciation
Connector to Landsnet
748.428 4% 10,0% Design, engineering, construction management:
1.500.000 8% 10,0%
Land, building and premises:
1.200.000 7% 3,0% Storage tanks:
1.902.995 11% 10,0%
Hydrogen electrolyser:
3.000.000 17% 12,5% Evaporators and distillation:
3.800.000 21% 10,0%
Other fixtures and fittings:
3.200.000 18% 10,0% Contingency: 2.500.000 14% 10,0%
Total: -10 % /+35% accuracy
17.851.423 100% 1.701.300 annually
Year 0-2
Phase 2 - 35.000 tons capacity:
Total investment: -10 % /+35% accuracy
15.000.000
9,5%
Year 3-4
Phase 3 - 60.000 tons capacity:
Total investment: -15/+-50 % accuracy
19.900.000
9,5%
Year 5-6
The additional change of extra tanks does raise the volume of capital needed. The initial
expected investment had been calculated by IPD as EUR 16. 6 million and there of equity
need expected to be EUR 12.450 million, and loan capital EUR 4.150 million. The new
estimates show however that investment needed is EUR 17.851 million. With this new
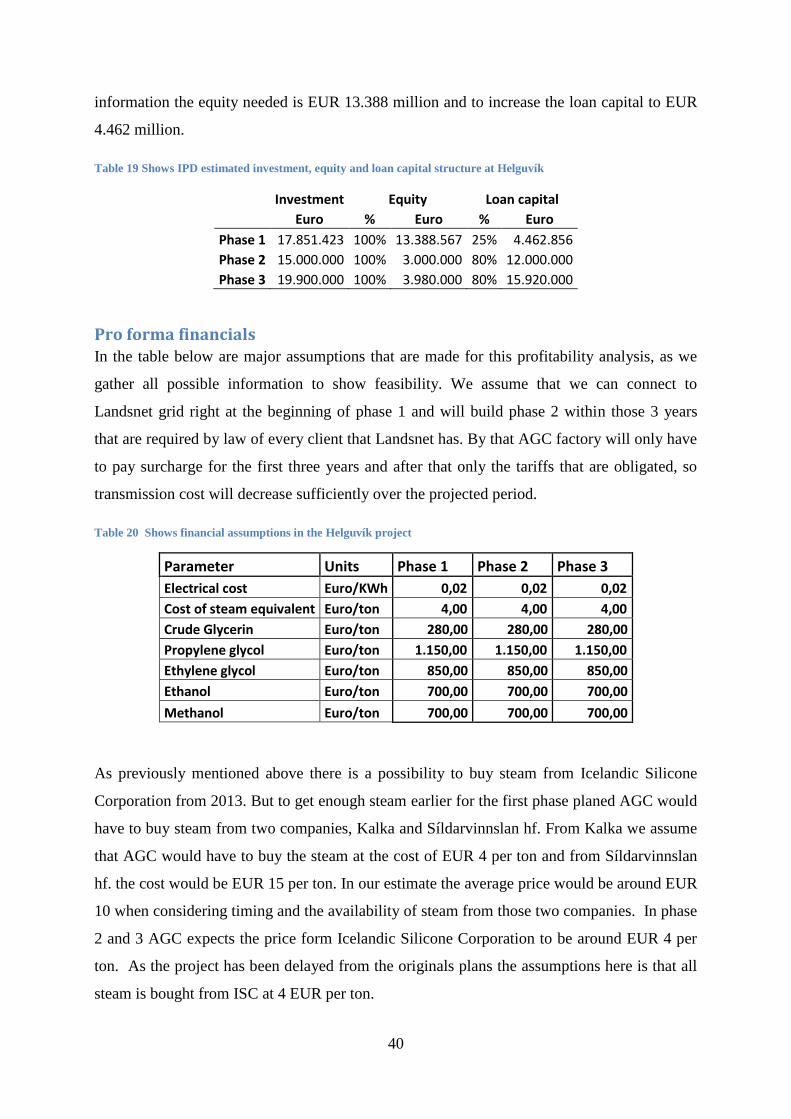
40
information the equity needed is EUR 13.388 million and to increase the loan capital to EUR
4.462 million.
Table 19 Shows IPD estimated investment, equity and loan capital structure at Helguvík
Investment Equity Loan capital
Euro % Euro % Euro
Phase 1 17.851.423 100% 13.388.567 25% 4.462.856 Phase 2 15.000.000 100% 3.000.000 80% 12.000.000 Phase 3 19.900.000 100% 3.980.000 80% 15.920.000
Pro forma financials In the table below are major assumptions that are made for this profitability analysis, as we
gather all possible information to show feasibility. We assume that we can connect to
Landsnet grid right at the beginning of phase 1 and will build phase 2 within those 3 years
that are required by law of every client that Landsnet has. By that AGC factory will only have
to pay surcharge for the first three years and after that only the tariffs that are obligated, so
transmission cost will decrease sufficiently over the projected period.
Table 20 Shows financial assumptions in the Helguvík project
Parameter Units Phase 1 Phase 2 Phase 3
Electrical cost Euro/KWh 0,02 0,02 0,02
Cost of steam equivalent Euro/ton 4,00 4,00 4,00
Crude Glycerin Euro/ton 280,00 280,00 280,00
Propylene glycol Euro/ton 1.150,00 1.150,00 1.150,00
Ethylene glycol Euro/ton 850,00 850,00 850,00
Ethanol Euro/ton 700,00 700,00 700,00
Methanol Euro/ton 700,00 700,00 700,00
As previously mentioned above there is a possibility to buy steam from Icelandic Silicone
Corporation from 2013. But to get enough steam earlier for the first phase planed AGC would
have to buy steam from two companies, Kalka and Síldarvinnslan hf. From Kalka we assume
that AGC would have to buy the steam at the cost of EUR 4 per ton and from Síldarvinnslan
hf. the cost would be EUR 15 per ton. In our estimate the average price would be around EUR
10 when considering timing and the availability of steam from those two companies. In phase
2 and 3 AGC expects the price form Icelandic Silicone Corporation to be around EUR 4 per
ton. As the project has been delayed from the originals plans the assumptions here is that all
steam is bought from ISC at 4 EUR per ton.

41
Table 21 Shows power consumption at Helguvík project
Phase 1 Phase 2 Phase 3 Total
Transmission cost
330.968 455.781 872.533 1.659.283
Electrical consumption(w.electrolyzer) - full capacity: kW 6.180 12.360 24.720 43.260
Number of hours:
8.300 8.300 8.300
Gigawatthours: 51,3 102,6 205,2 359,1
Electrical cost -Euro/kWh 0,023 0,023 0,023
Total cost at full capacity: Euro
1.510.730 2.815.305 5.591.581 9.917.617
Thermal power consumption: kW
8.500 17.000 34.000 59.500
Converted to steam equiv. (t/h, 12 bar): t/h
14 28 56 97
Operating hours per year: 8.300 8.300 8.300
Cost of steam equivalent: Euro pr ton 4 4 4
Total thermal power cost at full capacity: Euro
461.782 923.564 1.847.127 3.232.473
Tank storage rental (Euro Per Year)
120.000 240.000 480.000 840.000
Thermal power generated with electricity:
Gigawatthours - efficiency 1,1 77,6 155,2 310,4 543,2
Summary of projected financial return
By calculating the assumptions from the pro forma figure and intertwining them with IPD
other estimations, we have opportunity to estimate the profit and loss for the first 6 years or
until AGC factory has the capabilities to reach full productions capacity.
Table 22 Shows estimated profit and loss from Helguvík project
EUR Year 1 Year 2 Year 3 Year 4 Year 5 Year 6
Total sales - CIF:
33.105.000 33.105.000 71.727.500 71.727.500 137.937.500 137.937.500
Marketing cost:
1.324.200 1.324.200 2.869.100 2.869.100 5.517.500 5.517.500
Total sales, net 31.780.800 31.780.800 68.858.400 68.858.400 132.420.000 132.420.000
Variable cost:
Cost of raw material:
11.538.462 11.538.462 25.000.000 25.000.000 48.076.923 48.076.923
Sea freight cost:
1.653.301 1.653.301 2.865.722 2.865.722 4.822.128 4.392.870
Product trucking cost: 199.781 199.781 432.858 432.858 832.419 832.419
Electrical cost:
1.510.730 1.510.730 4.326.035 4.326.035 9.917.617 9.917.617
Thermal energy cost:
461.782 461.782 1.385.345 1.385.345 3.232.473 3.232.473
Catalyst cost
1.648.352 1.648.352 3.571.429 3.571.429 6.868.132 6.868.132
Royalty:
317.808 317.808 688.584 688.584 1.324.200 1.324.200
17.330.215 17.330.215 38.269.973 38.269.973 75.073.892 74.644.633
52% 52% 53% 53% 54% 54%
Fixed cost:
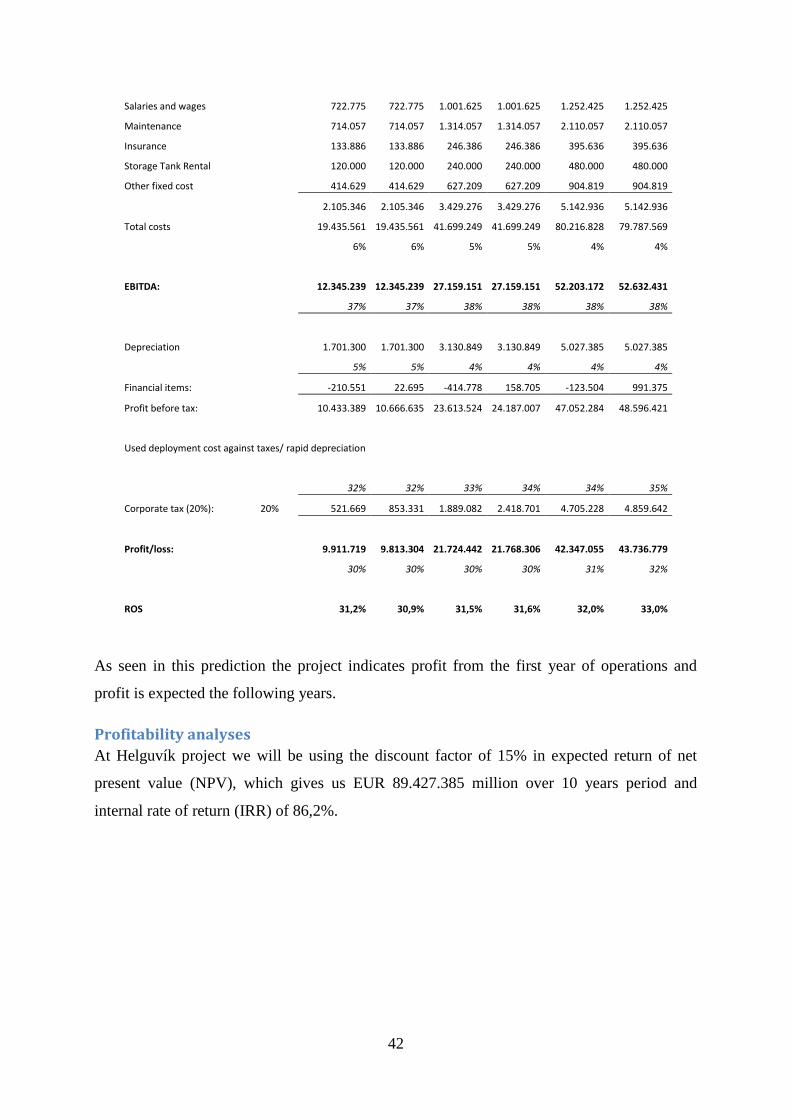
42
Salaries and wages
722.775 722.775 1.001.625 1.001.625 1.252.425 1.252.425
Maintenance
714.057 714.057 1.314.057 1.314.057 2.110.057 2.110.057
Insurance
133.886 133.886 246.386 246.386 395.636 395.636
Storage Tank Rental
120.000 120.000 240.000 240.000 480.000 480.000
Other fixed cost
414.629 414.629 627.209 627.209 904.819 904.819
2.105.346 2.105.346 3.429.276 3.429.276 5.142.936 5.142.936
Total costs
19.435.561 19.435.561 41.699.249 41.699.249 80.216.828 79.787.569
6% 6% 5% 5% 4% 4%
EBITDA:
12.345.239 12.345.239 27.159.151 27.159.151 52.203.172 52.632.431
37% 37% 38% 38% 38% 38%
Depreciation
1.701.300 1.701.300 3.130.849 3.130.849 5.027.385 5.027.385
5% 5% 4% 4% 4% 4%
Financial items:
-210.551 22.695 -414.778 158.705 -123.504 991.375
Profit before tax:
10.433.389 10.666.635 23.613.524 24.187.007 47.052.284 48.596.421
Used deployment cost against taxes/ rapid depreciation
32% 32% 33% 34% 34% 35%
Corporate tax (20%): 20%
521.669 853.331 1.889.082 2.418.701 4.705.228 4.859.642
Profit/loss:
9.911.719 9.813.304 21.724.442 21.768.306 42.347.055 43.736.779
30% 30% 30% 30% 31% 32%
ROS
31,2% 30,9% 31,5% 31,6% 32,0% 33,0%
As seen in this prediction the project indicates profit from the first year of operations and
profit is expected the following years.
Profitability analyses
At Helguvík project we will be using the discount factor of 15% in expected return of net
present value (NPV), which gives us EUR 89.427.385 million over 10 years period and
internal rate of return (IRR) of 86,2%.

43
Table 23 Shows estimated IRR and NPV from Helguvík project
0-1 Year 0 Year 1 Year 2 Year 3 Year 4 Year 5 Year 6
Revenue:
31.780.800 31.780.800 68.858.400 68.858.400 132.420.000 132.420.000
Operational Cost:
19.435.561 19.435.561 41.699.249 41.699.249 80.216.828 79.787.569
Share capital: 1000000 14.388.567 14.388.567 17.388.567 17.388.567 21.368.567 21.368.567 21.368.567
Investment: -1000000 -17.851.423 -15.000.000 -19.900.000
Loan capital: 4.462.856 12.000.000 15.920.000
Operational Capital Need 100000 100.000
New Equity needed -1000000 -13.288.567 0 -3.000.000 0 -3.980.000 0 0
Income:
26.484.000 31.780.800 62.678.800 68.858.400 121.826.400 132.420.000
Operational cost: 900000
-17.815.931 -19.435.561 -39.843.942 -41.699.249 -77.007.029 -79.823.341
Cash Flow from Operations 900000
8.668.069 12.345.239 22.834.858 27.159.151 44.819.371 52.596.659
Equity Inflow :
-1000000 -13.288.567
-3.000.000
-3.980.000
Principal Payment of loans:
0 -594.540 -594.540 -2.193.176 -2.193.176 -4.314.033 -4.314.033
Financial items:
0 -210.551 22.695 -414.778 158.705 -123.504 991.375
Corporate tax: -521.669 -853.331 -1.889.082 -2.418.701 -4.705.228
Free Cash flow to equity -1000000 -13.288.567 7.862.978 8.251.725 19.373.573 19.255.598 37.963.133 44.568.773
280
IRR 86,2%
NPV 89.427.385 15%
Cash at beginning of period
100.000 100.000 7.962.978 19.214.703 38.588.276 61.823.874 99.787.008
Cast at end of period 100.000 7.962.978 19.214.703 38.588.276 61.823.874 99.787.008 144.355.781
Interest income:
82.914 279.477 594.407 1.032.572 1.661.899 2.510.602
Interest paid on long term loans: -293.465 -256.782 -1.009.185 -873.866 -1.785.402 -1.519.227
Finical items - total:
-210.551 22.695 -414.778 158.705 -123.504 991.375

44
6. Grundartangi Grundartangi is located in Hvalfjarðarsveit in Hvalfjörður, which is in
Faxaflóa area on the west coast of Iceland, within 49 km from
Reykjavík. Grundartangi is an industrial site that has been developing
as a part of Faxaflóahafnir (Associated Icelandic Ports (AIP)), which is
an independently operated company in ownership of some of the
largest municipals on the southwest coast, one of which being the City
of Reykjavík. The landmass is a former agricultural field and the total area is about 439
hectares, of which some 311 hectares may be developed as building sites from now, and 50
hectares can be additionally be created by landfills with ease. The port was opened in 1978 to
serve the Elkem Island which is a ferrosilicon plant and since then the site has grown
considerably. In 1998 a new aluminum smelter was launched by Norðurál at the site and in
2006 it was enlarged further. According to AIP four sites have been allocated for smaller
companies, but remaining area for further development is around 160 hectares (AIP, 2011).
The harbor facilities:
The harbor was open in 1978 with the arrival of Elkem Island. Since 1978 the quay has gone
through two enlargements, first in 1998 and the second in 2006. The total length of the quay
is now 670 meters and the depth is from 10 to 14 meters (AIP, 2011).
Road connections:
The industrial site at Grundartangi is very close to the national highway and within 49
kilometers distance from Reykjavík which makes this site very attractive considering that
available work force is within 40 minutes’ drive from location. Another noteworthy factor is
the short distance between Grundartangi and Keflavík International Airport which is about 90
kilometers (AIP, 2011).
Kemira: Was founded Finland in year 1920 as a state own
chemical plant that was mainly producing sulphuric acid. In the
years around 1950 the company began to move towards
production of industrial chemicals and began expanding their
production with new chemical factories around Finland. Kemira
began operating in the international level in the beginning of the 1960s and has expanded
increasingly since then. Kemira was changed in 1994 and today Kemira is a private company

45
listed in the Helsinki Stock Exchange (since 1994) as the state of Finland is the major
shareholder with about 53, 8% of the company shares. Kemira has long experience and state-
of-the-art knowledge about bleaching additives used in chemical and mechanical pulp
production and in deinked pulp bleaching. The optimized use and effectiveness of these
chemicals is always tested at each pulp process (Kemira, 2011).
Kemira is planning to raise a bleaching chemical factory in Iceland and is looking at two
locations, Grundartangi and Bakki. Grundartangi is considered more favorable site of the two
because it is has more basic infrastructure in place and is more advanced as an industry site.
Kemira does not have to undertake environmental assessment for raising their factory either
in Bakki or in Grundartangi. But at Grundartangi the main problem for Kemira is the lack of
electricity on the south and west coast of Iceland. There might be a solution to this problem as
currently HS Orka and Norðurál have a case in the arbitral tribunal in Sweden (where Magma
Energy the majority owner of HS Orka has the address for service) about agreement HS Orka
selling Norðurál electricity in Helguvík. If HS Orka wins this case in Sweden than the
company has enough electricity for Kemira, but HS Orka loses this case at Swedish court than
Kemira is forced to move its focus to Bakki.
Investment in Grundartangi There are few benefits that are gained by locating AGC factory at Grundartangi if Kemira has
the opportunity build their factory at that location. By having Kemira operations at
Grundartangi there is no need for hydrogen electrolyser and that does lower the investment
cost significantly at phases. However the location does require additional investment for
building tanks for storages of raw material and products.
Table 24 Shows AGC Investment estimate at Grundartanga- phase 1, 2 and 3
Phase 1 - 30.000 tons capacity: Euro Depreciation
Connector to RARIK
748.428 5% 10,0% Design, engineering, construction management:
1.500.000 9% 10,0%
Land, building and premises:
1.200.000 8% 3,0% Storage tanks:
2.917.926 18% 10,0%
Hydrogen electrolyser:
0 0% 12,5% Evaporators and distillation:
3.800.000 24% 10,0%
Other fixtures and fittings:
3.200.000 20% 10,0% Contingency: 2.500.000 16% 10,0%
Total: -10 % /+35% accuracy
15.866.354 100% 1.502.635 annually
Year 0-2

46
Phase 2 - 35.000 tons capacity:
Total investment: -10 % /+35% accuracy
13.000.000
9,5%
Year 3-4
Phase 3 - 60.000 tons capacity:
Total investment: -15/+-50 % accuracy
17.900.000
9,5%
Year 5-6
But initial expected investment had been calculated by IPD as EUR 16. 6 million and there of
equity need is expected to be EUR 12.450 million, and loan capital EUR 4.150 million. The
new estimates show however that investment needed is EUR 15.866 million. With this new
information the equity needed is EUR 11.399 million and to increase the loan capital to EUR
3.966 million.
Table 25 Shows IPD estimated investment, equity and loan capital structure at Grundartangi
Investment Equity Loan capital
Euro % Euro % Euro
Phase 1 15.866.354 100% 11.899.765 25% 3.966.588 Phase 2 13.000.000 100% 2.600.000 80% 10.400.000 Phase 3 17.900.000 100% 3.580.000 80% 14.320.000
Pro forma financials In the table below are major assumptions that are made for this profitability analysis. The
following assumptions are based on the presence of Kemira at that location; otherwise the
project would not be of any benefits at all to other locations and there for of no interest either
IPD or AGC.
Table 26 Shows financial assumptions in the Grundartangi project
Parameter Units Phase 1 Phase 2 Phase 3
Electrical cost Euro/KWh 0,023 0,023 0,023
Cost of steam equivalent Euro/ton 15 6 6
Crude Glycerin Euro/ton 280 280 280
Propylene glycol Euro/ton 1150 1150 1150
Ethylene glycol Euro/ton 850 850 850
Ethanol Euro/ton 700 700 700
Methanol Euro/ton 700 700 700
With Kemira operating at Grundartangi the possibility that AGC factory could buy all or part
of the hydrogen that Kemira produces as a byproduct.

47
As shown in table above the investment at Grundartangi is little bit lower than originally
expected in AGC plans and this is due to the fact that no hydrogen electrolyser is needed at
the location and that availability of hydrogen from Kemira factory close to AGC factory.
Kemira is expected to produce hydrogen in the quantity of at least 4000m3 per hour and that is
more than enough for AGC factory needs. IPD and AGC representatives have informally
discussed with Kemira representatives about the possibility of selling hydrogen to AGC
factory and the indications have been quite positive. Kemira is willing to sell AGC their
byproduct hydrogen at the price of EUR 700 per ton if AGC factory is close to Kemira
production.
Table 27 Shows expected power consumption of AGC factory
Phase 1 Phase 2 Phase 3 Total
Transmission cost
149.186 285.850 559.180 994.216
Electrical consumption(w.electrolyzer) - full capacity: kW 1.180 2.360 4.720 8.260
Number of hours:
8.300 8.300 8.300
Gigawatthours: 9,794 19,588 39,176 68,6
Electrical cost -Euro/kWh 0,023 0,023 0,023
Total cost at full capacity: Euro
374.448 736.374 1.460.228 2.571.050
Thermal power consumption: kW
8.500 17.000 34.000 59.500
Converted to steam equiv. (t/h, 12 bar): t/h
14 28 56 97
Operating hours per year: 8.300 8.300 8.300
Cost of steam equivalent: Euro pr ton 15 6 6
Total thermal power cost at full capacity: Euro
1.731.682 1.385.345 2.770.691 5.887.718
Hydrogen power consumption: Nm3/h
900 1.800 3.600 6.300
Converted to t/h
0,08 0,16 0,32 0,567
Number of hours
8.300 8.300 8.300
Cost of hydrogen: Euro pr. Ton 700 700 700
Total hydrogen power cost at full capacity: Euro
470.610 941.220 1.882.440 3.294.270
Tank storage rental (Euro Per Year)
0 0 0 0
Thermal power generated with electricity:
Gigawatthours - efficiency 1,1 77,6 155,2 310,4 543,2

48
There is no available steam in any form at Grundartangi at this moment, but for the first phase
of the AGC factory there will be enough hydrogen production from Kemira factory. IPD
estimates that Kemira is releasing 4000m3 of hydrogen per hour and that would be sufficient
to use 3000m3 of hydrogen to produce steam and use 1000m
3 of hydrogen in the reaction to
the glycol. The price for hydrogen produced steam is expected to be EUR 15 per ton. For the
second and third phase calls for bigger solution and the possibility is that Elkem Ísland does
produce enough heat in their production but for AGC factory there would have to be added
steam boilers to Elkem factory. If Elkem would build the steam boilers at their premises as
IPD expects the price of steam per ton would around EUR 6 so that Elkem would be able to
receive adequate revenues from their investment in those steam boilers.
Summary of projected financial return
By calculating the assumptions from the pro forma figure and intertwining them with IPD
other estimations, we have the opportunity to estimate the profit and loss for the first 6 years
or until AGC factory has the capabilities to reach full productions capacity.
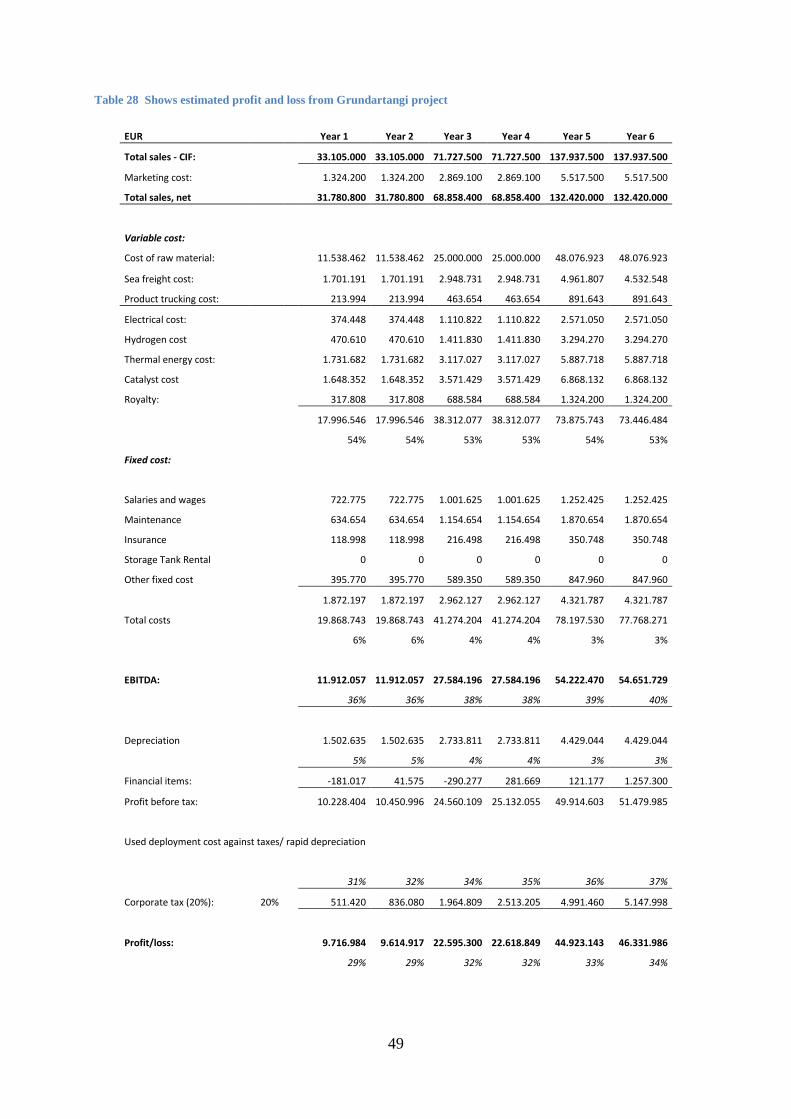
49
Table 28 Shows estimated profit and loss from Grundartangi project
EUR Year 1 Year 2 Year 3 Year 4 Year 5 Year 6
Total sales - CIF:
33.105.000 33.105.000 71.727.500 71.727.500 137.937.500 137.937.500
Marketing cost:
1.324.200 1.324.200 2.869.100 2.869.100 5.517.500 5.517.500
Total sales, net 31.780.800 31.780.800 68.858.400 68.858.400 132.420.000 132.420.000
Variable cost:
Cost of raw material:
11.538.462 11.538.462 25.000.000 25.000.000 48.076.923 48.076.923
Sea freight cost:
1.701.191 1.701.191 2.948.731 2.948.731 4.961.807 4.532.548
Product trucking cost: 213.994 213.994 463.654 463.654 891.643 891.643
Electrical cost:
374.448 374.448 1.110.822 1.110.822 2.571.050 2.571.050
Hydrogen cost
470.610 470.610 1.411.830 1.411.830 3.294.270 3.294.270
Thermal energy cost:
1.731.682 1.731.682 3.117.027 3.117.027 5.887.718 5.887.718
Catalyst cost
1.648.352 1.648.352 3.571.429 3.571.429 6.868.132 6.868.132
Royalty:
317.808 317.808 688.584 688.584 1.324.200 1.324.200
17.996.546 17.996.546 38.312.077 38.312.077 73.875.743 73.446.484
54% 54% 53% 53% 54% 53%
Fixed cost:
Salaries and wages
722.775 722.775 1.001.625 1.001.625 1.252.425 1.252.425
Maintenance
634.654 634.654 1.154.654 1.154.654 1.870.654 1.870.654
Insurance
118.998 118.998 216.498 216.498 350.748 350.748
Storage Tank Rental
0 0 0 0 0 0
Other fixed cost
395.770 395.770 589.350 589.350 847.960 847.960
1.872.197 1.872.197 2.962.127 2.962.127 4.321.787 4.321.787
Total costs
19.868.743 19.868.743 41.274.204 41.274.204 78.197.530 77.768.271
6% 6% 4% 4% 3% 3%
EBITDA:
11.912.057 11.912.057 27.584.196 27.584.196 54.222.470 54.651.729
36% 36% 38% 38% 39% 40%
Depreciation
1.502.635 1.502.635 2.733.811 2.733.811 4.429.044 4.429.044
5% 5% 4% 4% 3% 3%
Financial items:
-181.017 41.575 -290.277 281.669 121.177 1.257.300
Profit before tax:
10.228.404 10.450.996 24.560.109 25.132.055 49.914.603 51.479.985
Used deployment cost against taxes/ rapid depreciation
31% 32% 34% 35% 36% 37%
Corporate tax (20%): 20%
511.420 836.080 1.964.809 2.513.205 4.991.460 5.147.998
Profit/loss:
9.716.984 9.614.917 22.595.300 22.618.849 44.923.143 46.331.986
29% 29% 32% 32% 33% 34%

50
As seen on table above this is a very profitable project and shows very good profit for the first
6 years of operations, and the possibly to increase further in the next 10 years or so.
Profitability analyses
At Grundartangi project the discount factor of 15% is used in expected return of net present
value (NPV), which gives us EUR 95.347.804 million over 10 years period and internal rate
of return (IRR) of 93,2%.
Table 29 Shows estimated IRR and NPV from Grundartangi project
0-1 Year 0 Year 1 Year 2 Year 3 Year 4 Year 5 Year 6
Revenue:
31.780.800 31.780.800 68.858.400 68.858.400 132.420.000 132.420.000
Operational Cost:
19.868.743 19.868.743 41.274.204 41.274.204 78.197.530 77.768.271
Share capital: 1000000 12.899.765 12.899.765 15.499.765 15.499.765 19.079.765 19.079.765 19.079.765
Investment: -1000000 -15.866.354 -13.000.000 -17.900.000
Loan capital: 3.966.588 10.400.000 14.320.000
Operational Capital Need 100000 100.000
New Equity needed -1000000 -11.799.765 0 -2.600.000 0 -3.580.000 0 0
Income:
26.484.000 31.780.800 62.678.800 68.858.400 121.826.400 132.420.000
Operational cost: 900000
-18.213.014 -19.868.743 -39.490.416 -41.274.204 -75.120.586 -77.804.043
Cash Flow from Operations 900000
8.270.986 11.912.057 23.188.384 27.584.196 46.705.814 54.615.957
Equity Inflow :
-1000000 -11.799.765
-2.600.000
-3.580.000
Principal Payment of loans:
0 -528.428 -528.428 -1.913.912 -1.913.912 -3.821.617 -3.821.617
Financial items:
0 -181.017 41.575 -290.277 281.669 121.177 1.257.300
Corporate tax: -511.420 -836.080 -1.964.809 -2.513.205 -4.991.460
Free Cash flow to equity -1000000 -11.799.765 7.561.541 8.313.784 20.148.116 20.407.145 40.492.168 47.060.180
280
IRR 93,2%
NPV 95.347.804 15%
Cash at beginning of period
100.000 100.000 7.661.541 18.575.325 38.723.441 62.710.585 103.202.753
Cast at end of period 100.000 7.661.541 18.575.325 38.723.441 62.710.585 103.202.753 150.262.933
Interest income:
79.815 269.802 589.222 1.043.080 1.706.142 2.606.472
Interest paid on long term loans: -260.832 -228.228 -879.499 -761.411 -1.584.966 -1.349.172
Finical items - total:
-181.017 41.575 -290.277 281.669 121.177 1.257.300

51
7. Bjarnarflag Bjarnarflag is in Norðurþing municipality on the north-east coast of Iceland, Landsvirkjun
and the Icelandic government, where the industrial ministry and Invest in Iceland agency are
the most active players. Norðurþing is in Northeast
Iceland, a large area stretching from the north east
coast into the glaciers in the central highlands.
Norðurþing Municipality was formed in a merger of
four small municipalities in the election year of 2006
(Norðurþing, 2011). Húsavík (population of 2.229) is
the largest town in Norðurþing with about 80% of
population of the municipal and is mostly famous for
tourism (whale watching) and services. Previously it
was known for its fishing industry where the main
source of employment in Húsavík lay along other light
industry and services to surrounding farmers in the
area. The total population in Norðurþing is 2.926 and
has been decreasing about 16% since 1990 (Hagstofa Íslands, 2011). The new town council of
Norðurþing municipality which was elected in 2010 election, have been persistently lobbying
for developing future industry cites in Bakki area. The town council and Atvinnuþróunarfélag
Þingeyjinga (AÞ) (e. North-East Iceland Development Agency) have been following up every
lead to gain fortune.
There has been much speculation about the future of this site from politicians and media alike
but new arriving industries have been put under pressure to build up their businesses by the
Icelandic government, Norðurþing municipal and Landsvirkjun to use the geothermal energy
that is available in Bjarnarflag, Þeistareykir and Krafla. At least 10 interested parties of power
intensive users are viewing Bakki as a possible site for their operation according to Edvarð
Guðnason (Guðnason, 2011) at Landsvirkjun.
Roads
The significance of roads is crucial to the project of Bjarnarflag as the distance between
Bjarnarflag and Húsavík is considerable higher than in other locations that are investigated in
this report. As does the fact that it may be problematic to interest skilled and educated work
Picture 3 Norðurþing municipal
Source:Invalid source specified..
52
force to work at location such as Bjarnarflag due to the length of distance from populated
areas such as Húsavík or Akureyri.
The highway nr.87 is named Kísilvegur and connects Húsavík and Mývatnssveit. A private
road in the ownership of Landsvirkjun links highway nr.87 and Krafla area. The distance
between Húsavík (Bakki) and Bjarnarflag is about 69 kilometers and Vegagerðin provides
snowplowing at least two days per week during winter time.
A gravel road is currently under construction between Húsavík and Þeistareykjum and future
plans are that new layer of paved surface will come around when decisions are made about
what kind of services level the area will need from Vegagerðinn. It is estimated that the road
will be close to 28 kilometers (Reynisson, 2011).
A road tunnel in the area between Akureyri and Húsavík are currently in the process of
funding constructed at Vaðlaheiði. This road tunnel will shorten the road between Akureyri
and Húsavík considerably, taking the road from 91 km to 75 km or 16 km, but more
importantly the road tunnel will take out the equation of difficulty of hazardous winter
weather that frequently accurse the area and will shorten the time of traveling by 10 minutes
and there for making traveling between Akureyri and Húsavík take around 51 minutes, an
improvement of 10 minutes. The current estimate of increased traffic between Akureyri and
Húsavík due to this project is around 21% and it will strengthen Akureyri as a leading town in
the northern part of Iceland. Full construction of Vaðlaheiðargöng is expected to take at least
3 years from now. (Reinhardsson, 2006, pp. 2 - 8).
Harbor
The harbor facilities are good at Húsavík. The depth at the harbor is 10 meters and the longest
peer is 130 meters, with future possibility to increase the depth to 12 meters and the length of
the peer to 180 meters so up to 40.000 ton cargo/bulk ships can dock according to managing
director of NEIDA (Reynisson, 2011).
Labor force
In our estimate we presume that the labor force that is available to work at the G2G factory
would be mostly based on the local residents in the area of Reykjahlíð. Those residents at
Reykjahlíð used to formed the labor source in Silicon factory at Mývatn but where closed in
2004.

53
Investment in Bjarnarflag This site is located inland of Norðurþing and can easily be described as a “greenfield” project
as there are no facilities or infrastructure to add to the factory. But locating close to
Bjarnarflag power plant gives AGC factory lower cost of energy as the closeness eliminates
transmissions fees to Landsnet or the small distributors in the area. It also gives AGC
opportunity to use otherwise unused steam from the power plant and as well as hydrogen
which is expected to be around 1100m3 at the site. The investment at Bjarnarflag is expected
to be lower in the phase 1 beginning because of availability of hydrogen, but the amount of
hydrogen was not expected to be enough quantity for phase 2 and 3. However today it is
expected to have enough hydrogen for phase 2 and 3 as well. There for the expected
investment cost of EUR 2 million in phase 2 and EUR 4 million in phase 3 are withdrawn
from our calculation. AGC needs to invest in connectors between the factory and Bjarnarflag
power plant and the cost is expected to be around EUR 748. 428.
Table 30 Shows AGC Investment estimate at Bjarnarflagi- phase 1, 2 and 3
Phase 1 - 30.000 tons capacity: Euro Depreciation
Connectors to Bjarnarflag power plant
748.428 5% 10% Design, engineering, construction management:
1.500.000 10% 10,0%
Land, building and premises:
1.000.000 7% 3,0% Storage tanks:
2.537.327 17% 10,0%
Hydrogen electrolyser:
0 0% 12,5% Evaporators and distillation:
3.800.000 25% 10,0%
Other fixtures and fittings:
3.200.000 21% 10,0% Contingency: 2.500.000 16% 10,0%
Total: -10 % /+35% accuracy
15.285.755 100% 2.132.160 annually
Year 0-2
Phase 2 - 35.000 tons capacity:
Total investment: -10 % /+35% accuracy
16.000.000
13,9%
Year 3-4
Phase 3 - 60.000 tons capacity:
Total investment: -15/+-50 % accuracy
17.900.000
13,9%
Year 5-6
AGC needs to build 2 extra storage tanks at the size of 5000m3 at the facilities in Bjarnarflag
and rent some old storage tanks in Húsavík for both glycerin and the glycols. The investment
at Bjarnarflag is expected to be around EUR 15.285 million, there of EUR 11.464 million in
equity and further EUR 3.821 million in loan capital.

54
Table 31 Shows IPD estimated investment, equity and loan capital structure at Bjarnarflag
Investment Equity Loan capital
Euro % Euro % Euro
Phase 1 15.285.755 100% 11.464.316 25% 3.821.439 Phase 2 16.000.000 100% 3.200.000 80% 12.800.000 Phase 3 17.900.000 100% 3.580.000 80% 14.320.000
Pro forma financials In the table below there are major assumptions that are made for this profitability analysis.
The following assumptions are based on the opportunity to connect to Bjarnarflag power plant
and be able to retain the resources that the power plant is producing. Bjarnarflag is operational
power plant and there for has advantage of Þeistárreykir which is not operational and is still
under construction.
Table 32 Shows financial assumptions in the Bjarnarflag project
Parameter Units Phase 1 Phase 2 Phase 3
Electrical cost Euro/KWh 0,023 0,023 0,023
Cost of steam equivalent Euro/ton 1,25 1,25 1,25
Crude Glycerin Euro/ton 280 280 280
Propylene glycol Euro/ton 1150 1150 1150
Ethylene glycol Euro/ton 850 850 850
Ethanol Euro/ton 700 700 700
Methanol Euro/ton 700 700 700
There are advantages of siting AGC factory at Bjarnarflag are very interesting when
considering the elements of low cost of electricity, steam and hydrogen are realized as seen in
table 33.

55
Table 33 Shows estimated power consumption at Bjarnarflag
Phase 1 Phase 2 Phase 3 Total
Electrical consumption(w.electrolyzer) - full capacity: kW 1.180 7.360 19.720 28.260
Number of hours:
8.300 8.300 8.300
Gigawatthours: 9,8 61,1 163,7 234,6
Electrical cost -Euro/kWh 0,023 0,023 0,023
Total cost at full capacity: Euro
225.262 1.405.024 3.764.548 5.394.834
Thermal power consumption: kW
8.500 17.000 34.000 59.500
Converted to steam equiv. (t/h, 12 bar): t/h
14 28 56 97
Operating hours per year: 8.300 8.300 8.300
Cost of steam equivalent: Euro pr ton 1,25 1,25 1,25
Total thermal power cost at full capacity: Euro
144.307 288.614 577.227 1.010.148
Hydrogen power consumption: Nm3/h
900 1.800 3.600 6.300
Converted to t/h
0,08 0,16 0,32 0,567
Number of hours
8.300 8.300 8.300
Cost of hydrogen: Euro pr. Ton 700 700 700
Total hydrogen power cost at full capacity: Euro
470.610 941.220 1.882.440 3.294.270
Tank storage rental (Euro Per Year)
432.000 432.000 432.000 1.296.000
Thermal power generated with electricity: Gigawatthours - efficiency 1,1 77,6 155,2 310,4 543,2
In this estimate the hydrogen process cost is considered to be mainly in equipment to refine
the hydrogen, and no additional investment would be needed and other than already stated in
the investment, but cost of purifying the hydrogen is estimated by IPD to be around 700 per
ton.
Transport
Because of Bjarnarflag location extra transportation cost is expected. The table below shows
the expected cost of transportation between Húsavík and Bjarnarflag where the price is
expected to be around EUR 7, 42 per ton. There are two roads available for trucking between
Húsavík and Bjarnarflag. The main road is Kísilvegur which is operational about 75% of the
year but has limitations during the harsh winters and therefore forces the trucks with trailers
to use Reykjadalsvegur which is about 20 kilometers longer than Kísilvegur.
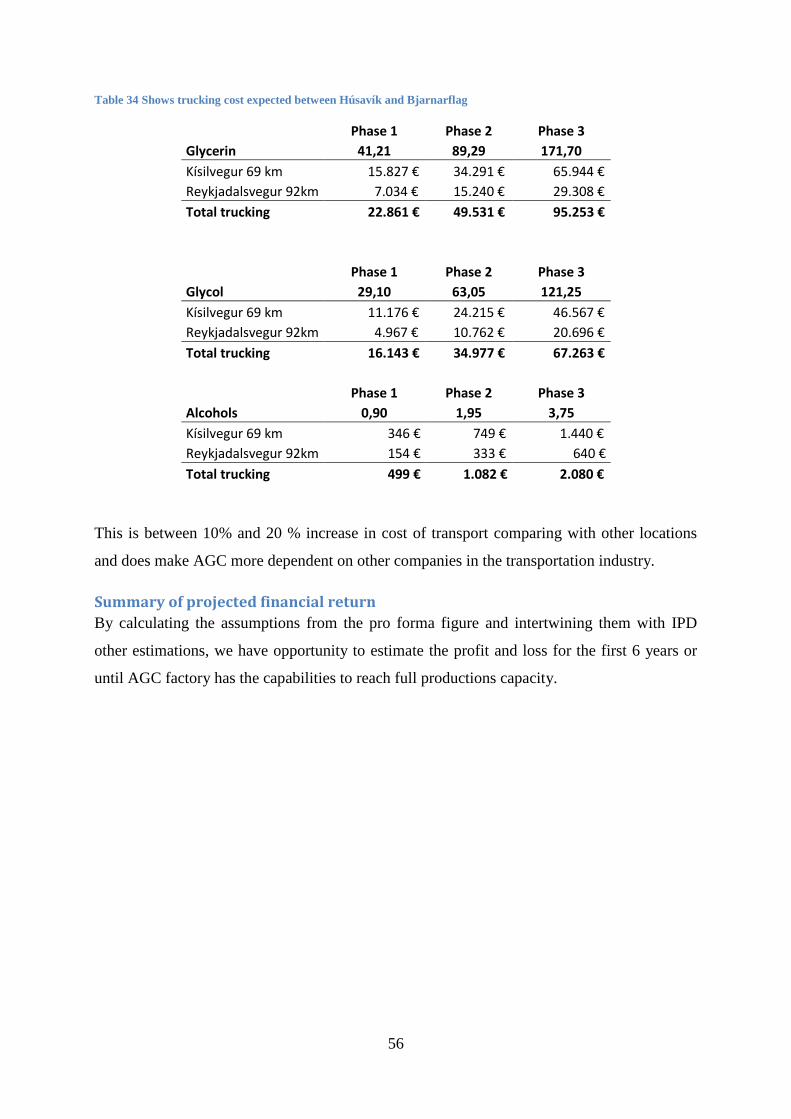
56
Table 34 Shows trucking cost expected between Húsavík and Bjarnarflag
Phase 1 Phase 2 Phase 3
Glycerin 41,21 89,29 171,70
Kísilvegur 69 km 15.827 € 34.291 € 65.944 € Reykjadalsvegur 92km 7.034 € 15.240 € 29.308 €
Total trucking 22.861 € 49.531 € 95.253 €
Phase 1 Phase 2 Phase 3
Glycol 29,10 63,05 121,25
Kísilvegur 69 km 11.176 € 24.215 € 46.567 € Reykjadalsvegur 92km 4.967 € 10.762 € 20.696 €
Total trucking 16.143 € 34.977 € 67.263 €
Phase 1 Phase 2 Phase 3 Alcohols 0,90 1,95 3,75
Kísilvegur 69 km 346 € 749 € 1.440 € Reykjadalsvegur 92km 154 € 333 € 640 €
Total trucking 499 € 1.082 € 2.080 €
This is between 10% and 20 % increase in cost of transport comparing with other locations
and does make AGC more dependent on other companies in the transportation industry.
Summary of projected financial return
By calculating the assumptions from the pro forma figure and intertwining them with IPD
other estimations, we have opportunity to estimate the profit and loss for the first 6 years or
until AGC factory has the capabilities to reach full productions capacity.
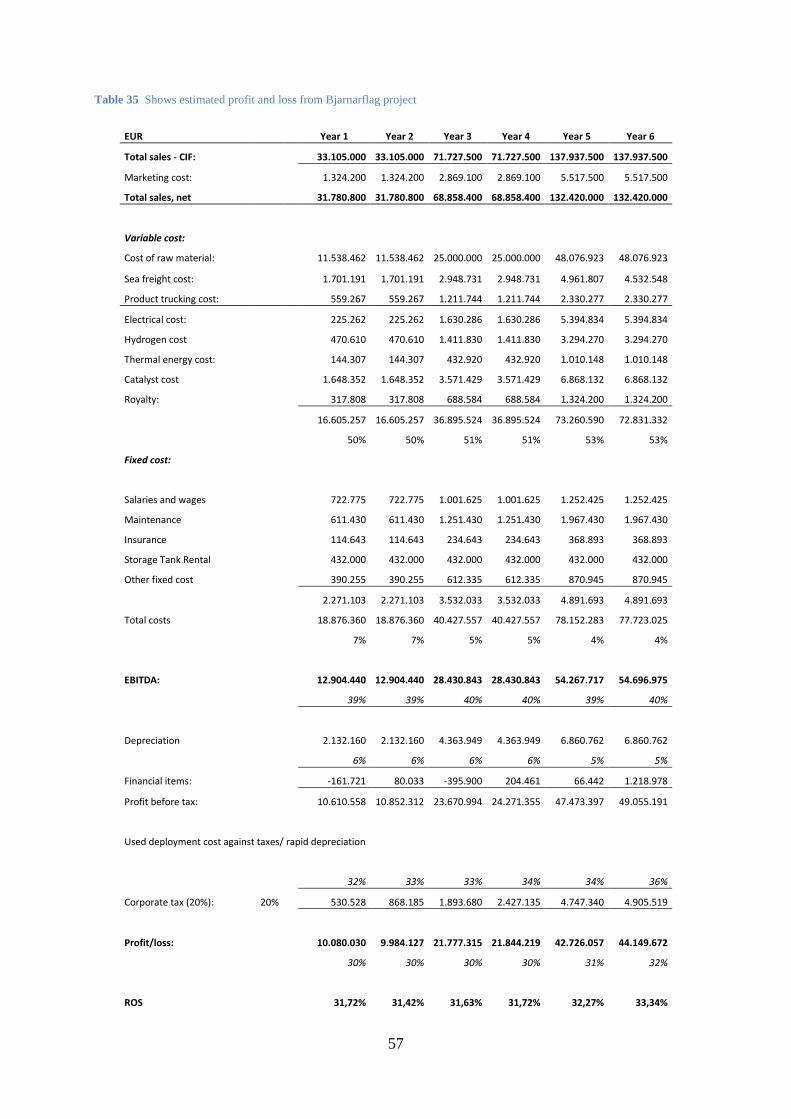
57
Table 35 Shows estimated profit and loss from Bjarnarflag project
EUR Year 1 Year 2 Year 3 Year 4 Year 5 Year 6
Total sales - CIF:
33.105.000 33.105.000 71.727.500 71.727.500 137.937.500 137.937.500
Marketing cost:
1.324.200 1.324.200 2.869.100 2.869.100 5.517.500 5.517.500
Total sales, net 31.780.800 31.780.800 68.858.400 68.858.400 132.420.000 132.420.000
Variable cost:
Cost of raw material:
11.538.462 11.538.462 25.000.000 25.000.000 48.076.923 48.076.923
Sea freight cost:
1.701.191 1.701.191 2.948.731 2.948.731 4.961.807 4.532.548
Product trucking cost: 559.267 559.267 1.211.744 1.211.744 2.330.277 2.330.277
Electrical cost:
225.262 225.262 1.630.286 1.630.286 5.394.834 5.394.834
Hydrogen cost
470.610 470.610 1.411.830 1.411.830 3.294.270 3.294.270
Thermal energy cost:
144.307 144.307 432.920 432.920 1.010.148 1.010.148
Catalyst cost
1.648.352 1.648.352 3.571.429 3.571.429 6.868.132 6.868.132
Royalty:
317.808 317.808 688.584 688.584 1.324.200 1.324.200
16.605.257 16.605.257 36.895.524 36.895.524 73.260.590 72.831.332
50% 50% 51% 51% 53% 53%
Fixed cost:
Salaries and wages
722.775 722.775 1.001.625 1.001.625 1.252.425 1.252.425
Maintenance
611.430 611.430 1.251.430 1.251.430 1.967.430 1.967.430
Insurance
114.643 114.643 234.643 234.643 368.893 368.893
Storage Tank Rental
432.000 432.000 432.000 432.000 432.000 432.000
Other fixed cost
390.255 390.255 612.335 612.335 870.945 870.945
2.271.103 2.271.103 3.532.033 3.532.033 4.891.693 4.891.693
Total costs
18.876.360 18.876.360 40.427.557 40.427.557 78.152.283 77.723.025
7% 7% 5% 5% 4% 4%
EBITDA:
12.904.440 12.904.440 28.430.843 28.430.843 54.267.717 54.696.975
39% 39% 40% 40% 39% 40%
Depreciation
2.132.160 2.132.160 4.363.949 4.363.949 6.860.762 6.860.762
6% 6% 6% 6% 5% 5%
Financial items:
-161.721 80.033 -395.900 204.461 66.442 1.218.978
Profit before tax:
10.610.558 10.852.312 23.670.994 24.271.355 47.473.397 49.055.191
Used deployment cost against taxes/ rapid depreciation
32% 33% 33% 34% 34% 36%
Corporate tax (20%): 20%
530.528 868.185 1.893.680 2.427.135 4.747.340 4.905.519
Profit/loss:
10.080.030 9.984.127 21.777.315 21.844.219 42.726.057 44.149.672
30% 30% 30% 30% 31% 32%
ROS
31,72% 31,42% 31,63% 31,72% 32,27% 33,34%

58
The Bjarnarflag project looks promising and offers good profit the first 6 years of operations.
Profitability analyses
The Bjarnarflag project is using the discount factor of 15% in expected return of net present
value (NPV), which gives us EUR 96.921.861 million over 10 years period and internal rate
of return (IRR) of 98,4%.
Table 36 Shows estimated IRR and NPV from Bjarnarflag project
0-1 Year 0 Year 1 Year 2 Year 3 Year 4 Year 5 Year 6
Revenue:
31.780.800 31.780.800 68.858.400 68.858.400 132.420.000 132.420.000
Operational Cost:
18.876.360 18.876.360 40.427.557 40.427.557 78.152.283 77.723.025
Share capital: 1000000 12.464.316 12.464.316 15.664.316 15.664.316 19.244.316 19.244.316 19.244.316
Investment: -1000000 -15.285.755 -16.000.000 -17.900.000
Loan capital: 3.821.439 12.800.000 14.320.000
Operational Capital Need 100000 100.000
New Equity needed -1000000 -11.364.316 0 -3.200.000 0 -3.580.000 0 0
Income:
26.484.000 31.780.800 62.678.800 68.858.400 121.826.400 132.420.000
Operational cost: 900000
-17.303.330 -18.876.360 -38.631.624 -40.427.557 -75.008.556 -77.758.797
Cash Flow from Operations 900000
9.180.670 12.904.440 24.047.176 28.430.843 46.817.844 54.661.203
Equity Inflow :
-1000000 -11.364.316
-3.200.000
-3.580.000
Principal Payment of loans:
0 -509.091 -509.091 -2.214.302 -2.214.302 -4.122.008 -4.122.008
Financial items:
0 -161.721 80.033 -395.900 204.461 66.442 1.218.978
Corporate tax: -530.528 -868.185 -1.893.680 -2.427.135 -4.747.340
Free Cash flow to equity -1000000 -11.364.316 8.509.858 8.744.854 20.568.789 20.947.322 40.335.143 47.010.834
280
IRR 98,4%
NPV 96.921.861 15%
Cash at beginning of period
100.000 100.000 8.609.858 20.554.712 41.123.500 65.650.822 105.985.965
Cast at end of period 100.000 8.609.858 20.554.712 41.123.500 65.650.822 105.985.965 152.996.798
Interest income:
89.566 299.909 634.258 1.097.996 1.764.998 2.663.206
Interest paid on long term loans: -251.287 -219.876 -1.030.158 -893.535 -1.698.556 -1.444.228
Finical items - total:
-161.721 80.033 -395.900 204.461 66.442 1.218.978

59
8. Djúpivogur Djúpivogur is an old fishing and merchant town on the east
coast in Iceland. This town has always been a relatively
small town with the population around 447 the 1st of
December 2010 (SIS, 2011) if we compare them to the
neighboring towns such as Höfn í Hornafirði or
Eskifjörður, but it´s inhabitants have been resourceful by
convening trading and fishing industry over the years.
Service sector is growing mainly due to increasing tourism
over the past few years (Djúpavogshreppur, 2011). Over
the years the town has seen the fishing quota been sold out
of the municipality do to various economic factors. There is an opportunity to take advantages
of the situation as buildings and tanks that are not in use there are available at Djúpivogur and
the municipality would welcome new business to the region. One of the problems in
connection with selecting Djúpivogur is the lack of skilled work force and it would probably
be problematic to secure highly educated work force in upper management that a factory of
this caliber needs.
Harbor facility:
There are two piers in Djúpavogur (Djúpavogshreppur, 2011):
Djúpavogshöfn – Length of pier is 80 meters and maximum length of overall allowed ship is
120 meters. Depth is 5, 5 meters. Distance from centrum of Djúpivogur is 300 meters.
Gleðivík – Length of pier is 75 meters and maximum length of overall allowed ship is 110
meters. Distance from centrum of Djúpivogur is 1 kilometer.
Roads
Djúpivogur is very close to the highway and the distance to Höfn the next populated area is
103 kilometers and to Breiðdalsvík is 64 kilometers. There is little use of the highway as the
harbor is within 300 meters distance from the factory.
Investment in Djúpivogur
There are many advantages to build AGC factory at Djúpivogur. One of them is availability
of buildings and tanks that can easily be changed into a fully operational factory. Available
buildings and tanks do make this opportunity more feasible, but with no available steam or

60
hydrogen at our disposal the investment does require additional investment of steam boiler
and there is need for one additional tank of 5000m3 for storage. Building AGC factory at
Djúpivogur the capital investment cost is expected around EUR 18.105 million as shown
below by using IPD estimated building needs.
Table 37 Shows AGC investment estimate at Djúpivogur - phase 1, 2 and 3:
Phase 1 - 30.000 tons capacity: Euro Depreciation
Steam boiler
2.188.679 12% 10,0% Connector to Landsnet
748.428 4% 10,0%
Design, engineering, construction management:
1.000.000 6% 10,0% Land, building and premises:
400.000 2% 3,0%
Storage tanks:
1.268.664 7% 10,0% Hydrogen electrolyser:
3.000.000 17% 12,5%
Evaporators and distillation:
3.800.000 21% 10,0% Other fixtures and fittings:
3.200.000 18% 10,0%
Contingency: 2.500.000 14% 10,0%
Total: -10 % /+35% accuracy
18.105.771 100% 1.857.577 annually
Year 0-2
Phase 2 - 35.000 tons capacity:
Total investment: -10 % /+35% accuracy
15.000.000
10,3%
Year 3-4
Phase 3 - 60.000 tons capacity:
Total investment: -15/+-50 % accuracy
21.900.000
10,3%
Year 5-6
As seen in the table below the investment is high in the first phase, estimated EUR 18.105
million and the need equity is EUR 13.579 million and loan capital EUR 4.526 million.
Table 38 Shows IPD estimated investment, equity and loan capital structure at Djúpivogur
Investment Equity Loan capital
Euro % Euro % Euro
Phase 1 18.105.771 100% 13.579.328 25% 4.526.443 Phase 2 15.000.000 100% 3.000.000 80% 12.000.000 Phase 3 21.900.000 100% 4.380.000 80% 17.520.000
Pro forma financials In table 39 below are major assumptions that are made for this profitability analysis.

61
Table 39 Shows financial assumptions in the Djúpivogur project
Parameter Units Phase 1 Phase 2 Phase 3
Electrical cost Euro/KWh 0,023 0,023 0,023
Cost of steam equivalent Euro/ton 15 15 15
Crude Glycerin Euro/ton 280 280 280
Propylene glycol Euro/ton 1150 1150 1150
Ethylene glycol Euro/ton 850 850 850
Ethanol Euro/ton 700 700 700
Methanol Euro/ton 700 700 700
The main problem which our project in Djúpivogur is facing is the lack of steam and/or
hydrogen, which makes all processes rely totally on electricity. At Djúpivogur AGC factory
would have to use electricity to produce steam at the cost of 15 EUR per ton.
Table 40 Shows estimated power consumption at G2G factory
Phase 1 Phase 2 Phase 3 Total
Transmission cost
330.968 455.781 872.533 1.659.283
Electrical consumption- full capacity: kW
6.180 12.360 24.720 43.260
Number of hours:
8.300 8.300 8.300
Gigawatthours: 51,3 102,6 205,2 359,1
Electrical cost -Euro/kWh 0,02 0,02 0,02
Total cost at full capacity: Euro
1.510.730 2.815.305 5.591.581 9.917.617
Thermal power consumption: kW
8.500 17.000 34.000 59.500
Converted to steam equiv. (t/h, 12 bar): t/h
14 28 56 97
Operating hours per year: 8.300 8.300 8.300
Cost of steam equivalent: Euro pr ton 15 15 15
Total thermal power cost at full capacity: Euro
1.731.682 3.463.364 6.926.727 12.121.773
Tank storage rental (Euro Per Year)
200.000 200.000 200.000
Thermal power generated with electricity:
Gigawatthours - efficiency 1,1 77,6 155,2 310,4 543,2
In Djúpivogur the energy cost is estimated around 9% of portion of sales in the first phase and
will rise to 12% in the second phase and finally will be around 14% when it reaches the third
phase of the project.
Summary of projected financial return
By calculating the assumptions from the pro forma figure and intertwining them with IPD
other estimations, we have the opportunity to estimate the profit and loss for the first 6 years
or until AGC factory has the capability to reach full productions capacity.

62
Table 41 Shows profit and loss during 6 years period expected
EUR Year 1 Year 2 Year 3 Year 4 Year 5 Year 6
Total sales - CIF:
33.105.000 33.105.000 71.727.500 71.727.500 137.937.500 137.937.500
Marketing cost:
1.324.200 1.324.200 2.869.100 2.869.100 5.517.500 5.517.500
Total sales, net 31.780.800 31.780.800 68.858.400 68.858.400 132.420.000 132.420.000
Variable cost:
Cost of raw material:
11.538.462 11.538.462 25.000.000 25.000.000 48.076.923 48.076.923
Sea freight cost:
1.701.191 1.701.191 2.948.731 2.948.731 4.961.807 4.532.548
Product trucking cost: 207.821 207.821 450.279 450.279 865.922 865.922
Electrical cost:
1.510.730 1.510.730 4.326.035 4.326.035 9.917.617 9.917.617
Thermal energy cost:
1.731.682 1.731.682 5.195.045 5.195.045 12.121.773 12.121.773
Catalyst cost
1.648.352 1.648.352 3.571.429 3.571.429 6.868.132 6.868.132
Royalty:
317.808 317.808 688.584 688.584 1.324.200 1.324.200
18.656.045 18.656.045 42.180.104 42.180.104 84.136.373 83.707.115
56% 56% 59% 59% 61% 61%
Fixed cost:
Salaries and wages
722.775 722.775 1.001.625 1.001.625 1.252.425 1.252.425
Maintenance
724.231 724.231 1.324.231 1.324.231 2.200.231 2.200.231
Insurance
135.793 135.793 248.293 248.293 412.543 412.543
Storage Tank Rental
200.000 200.000 300.000 300.000 600.000 600.000
Other fixed cost
417.045 417.045 629.625 629.625 926.235 926.235
2.199.844 2.199.844 3.503.774 3.503.774 5.391.434 5.391.434
Total costs
20.855.889 20.855.889 45.683.877 45.683.877 89.527.807 89.098.549
7% 7% 5% 5% 4% 4%
EBITDA:
10.924.911 10.924.911 23.174.523 23.174.523 42.892.193 43.321.451
33% 33% 32% 32% 31% 31%
Depreciation
1.857.577 1.857.577 3.396.515 3.396.515 5.643.364 5.643.364
6% 6% 5% 5% 4% 4%
Financial items:
-228.391 -22.621 -512.445 -16.259 -535.591 406.402
Profit before tax:
8.838.942 9.044.713 19.265.562 19.761.749 36.713.238 38.084.489
Used deployment cost against taxes/ rapid depreciation
27% 27% 27% 28% 27% 28%
Corporate tax (20%): 20%
441.947 723.577 1.541.245 1.976.175 3.671.324 3.808.449
Profit/loss:
8.396.995 8.321.136 17.724.317 17.785.574 33.041.914 34.276.040
25% 25% 25% 25% 24% 25%
ROS
26,42% 26,18% 25,74% 25,83% 24,95% 25,88%

63
Profitability analyses
In the Djúpavogur project we are using the discount factor of 15% in expected return of net
present value (NPV), which gives us EUR 68.844.894 million over 10 years period and
internal rate of return (IRR) of 74,3%.
Table 42 Shows estimated IRR and NPV from Djúpavogur project
0-1 Year 0 Year 1 Year 2 Year 3 Year 4 Year 5 Year 6
Revenue:
31.780.800 31.780.800 68.858.400 68.858.400 132.420.000 132.420.000
Operational Cost:
20.855.889 20.855.889 45.683.877 45.683.877 89.527.807 89.098.549
Share capital: 1000000 14.579.328 14.579.328 17.579.328 17.579.328 17.579.328 17.579.328 17.579.328
Investment: -1000000 -18.105.771 -15.000.000 -21.900.000
Loan capital: 4.526.443 12.000.000 17.520.000
Operational Capital Need 100000 100.000
New Equity needed -1000000 -13.479.328 0 -3.000.000 0 -4.380.000 0 0
Income:
26.484.000 31.780.800 62.678.800 68.858.400 121.826.400 132.420.000
Operational cost: 900000
-19.117.899 -20.855.889 -43.614.878 -45.683.877 -85.874.146 -89.134.320
Cash Flow from Operations 900000
7.366.101 10.924.911 19.063.922 23.174.523 35.952.254 43.285.680
Equity Inflow :
-1000000 -13.479.328
-3.000.000
-4.380.000
Principal Payment of loans:
0 -603.011 -603.011 -2.201.647 -2.201.647 -4.535.655 -4.535.655
Financial items:
0 -228.391 -22.621 -512.445 -16.259 -535.591 406.402
Corporate tax: -441.947 -723.577 -1.541.245 -1.976.175 -3.671.324
Free Cash flow to equity -1000000 -13.479.328 6.534.699 6.857.332 15.626.252 15.035.372 28.904.833 35.485.103
280
IRR 74,3%
NPV 68.844.894 15%
Cash at beginning of period
100.000 100.000 6.634.699 16.492.031 32.118.283 51.533.655 80.438.488
Cast at end of period 100.000 6.634.699 16.492.031 32.118.283 51.533.655 80.438.488 115.923.590
Interest income:
69.255 237.820 499.876 860.221 1.357.114 2.019.257
Interest paid on long term loans: -297.646 -260.441 -1.012.321 -876.480 -1.892.705 -1.612.855
Finical items - total:
-228.391 -22.621 -512.445 -16.259 -535.591 406.402

64
9. Conclusions
The purpose this analysis was to determine if a business opportunity is possible, in fact
practical and viable. In this study steps were taken to make this approach as to make a
realistic looking as possible, and have tried to take in both positive and negative aspects of the
business opportunity. Four cases were constructed, studied and evaluated: Helguvík Harbor,
Grundartangi, Djúpivogur and Husavik/Bjarnarflag. Each location has a harbor that can
accommodate at least 10.000Ton transport vessel.
Capex and Opex model was constructed for all the four cases. The dependent variables were
assumed the same for all the four cases. These were labor cost, construction cost, raw material
cost, income from products sold abroad, and foreign marketing, logistics and storage cost.
The independent variables were case specific as they were different for each case. These were
electricity cost for electrolyzing hydrogen or alternatively cost of purchasing hydrogen as a
bi-product or cost of abstracting hydrogen from non-condensable gases at geothermal sites.
Cost of steam and logistics and storage cost. Several cost assumption were made based on
references from reputable sources and NPV and IRR were calculated for each site. The
required WACC is set at 15% for these four cases. The result from these calculations are that
Bjarnarflag/Helguvík that assumes abstraction of hydrogen from non-condensable gases and
non-transmission tariffs of electricity scores the highest with 98,4% IRR and NPV EUR
96.921.861. The second highest score is at the Grundartangi site where it is assumed that
hydrogen can be purchased from Proposed Sodium Chloride factory as a bi-product the IRR
for that site is 93.2% and the NPV is EUR 95.347.804. The third site option is Helguvík
where AGC is going to buy waste heat as steam from the Icelandic Silica Factory. This option
yields IRR of 86, 2% and NPV of EUR 89.427.385. The forth option is Djúpivogur which
were storage tanks and buildings could be donated. This option yields IRR of 74, 3% and
NPV of EUR 68.844.894.
Even though all sites obviously yield acceptable outcomes, one shall keep in mind the
accuracy of this study is -10% and + 35%. More studies, bids and calculations are clearly
needed to tighten the outcome accuracy figures. Confirmed bids and detailed estimates will
have to be conducted and analyses.

65
10. Bibliography AGC ehf. (2011, may). LÍFALKÓHÓL OG GÝKÓLVERKSMIÐJA - VIÐ
HELGUVÍKURHÖFN, REYKJANESBÆ MAT Á UMHVERFISÁHRIFUM. Retrieved
agust 18, 2011, from rafhladan.is:
http://rafhladan.is/bitstream/handle/10802/1894/22_Tillaga%20a%c3%b0%20mats%c
3%a1%c3%a6tlun%20AGC.pdf?sequence=1
AIP. (2011). Fréttir. Retrieved oktober 10, 2011, from faxafloahafnir.is:
http://faxafloahafnir.is/faxafloahafnir/en/controls/advertisement/?ew_6_cat_id=52382
&ew_6_p_id=22702778
AIP, F. (2011). Grundartangi port and industrial area .Basic information. Retrieved oktober
13, 2011, from faxafloahafnir.is:
http://faxafloahafnir.is/faxafloahafnir/en/controls/advertisement/?ew_6_cat_id=52382
&ew_6_p_id=22702778
Alþingi. (2009, january 1). Lög um Landsvirkjun. Retrieved oktober 2011, 2011, from
althingi.is: http://www.althingi.is/dba-
bin/prentaloguti.pl?lnr=1983042&utg=136a&pdf=PDF
Aubert, A., & Frigstad, A. (2007). Strategic analysis of Statoil’s international
competitiveness. Bergen: Norwegian School of Economics and Business
Administration.
Ásmundsson, G. I. (2011, november 22). Phone calls and e-mails during the timeperiod 1
oktober to 22 november 2011. (I. Waage, Interviewer)
Boddy, D. (2008). Management An Intorduction 4th Edition. Harlow: Prentice Hall.
Chinn, H., & Kumamoto, T. (2011, july). Propylene Glycols. Retrieved september 10, 2011,
from chimical.ihs.com: http://chemical.ihs.com/CEH/Public/Reports/690.6000/
Djúpavogshreppur. (2011, november 10). Höfnin. Retrieved november 11, 2011, from
djupivogur.is: http://www.djupivogur.is/hofnin/?pageid=1746
European Parliament. (2009, may 5). DIRECTIVE 2009/28/EC OF THE EUROPEAN
PARLIAMENT AND OF THE COUNCIL of 23 April 2009. Retrieved desember 6,
2011, from eur-lex.europa.eu: http://eur-
lex.europa.eu/LexUriServ/LexUriServ.do?uri=OJ:L:2009:140:0016:0062:en:PDF
Eurostat. (2011, november). Energy price statistics. Retrieved desember 11, 2011, from
eurostat.eu.europa.eu:
http://epp.eurostat.ec.europa.eu/statistics_explained/images/5/5c/Energy_prices_YB20
12.xls

66
Guðnason, E. (2011, oktober 10). Telephone call about energy price and steam in Iceland. (I.
Waage, Interviewer)
Hagstofa Íslands. (8. september 2011). Mannfjöldi eftir kyni, aldri og sveitarfélögum 1998-
2011 - Sveitarfélagaskipan 1. janúar 2011 . Sótt 8. september 2011 frá hagstofa.is:
http://www.hagstofa.is/?PageID=2593&src=/temp/Dialog/varval.asp?ma=MAN02005
%26ti=Mannfj%F6ldi+eftir+kyni%2C+aldri+og+sveitarf%E9l%F6gum+1998%2D20
11+%2D+Sveitarf%E9lagaskipan+1%2E+jan%FAar+2011+++%26path=../Database/
mannfjoldi/sveitarfelog/%26lang=3%26unit
Helm AG. (2011). Facts and Figures. Retrieved oktober 23, 2011, from helmag.com:
http://www.helmag.com/en/helm-ag/facts-and-figures.html
Hollensen, S. (2011). Global Marketing: A decision-oriented approach. 5th. Edition. Harlow:
Pearson Education Limited.
HS Veitur. (2011). About HS Veitur. Retrieved oktober 14, 2011, from hsveitur.is:
http://www.hsveitur.is/english/HSCompanyInfo/HSCompanyOwners.aspx
HS-Orka. (2010). Um HS-Orku. Retrieved oktober 23, 2011, from hsorka.is:
http://www.hsorka.is/default.aspx
ICIS (a). (2011, may 2). Sample report-Ethylene (Europe). Retrieved september 4, 2011, from
icispricing.com: http://www.icispricing.com/il_shared/Samples/SubPage49.asp
ICIS (b). (2011, febrúar). Sample Report - Ethanol (Europe). Retrieved júlí 21, 2011, from
icispricing.com: http://www.icispricing.com/il_shared/Samples/SubPage108.asp
ICIS (c). (2011, may). Sample report-Methanol (Europe). Retrieved september 4, 2011, from
icispricing.com: http://www.icispricing.com/il_shared/Samples/SubPage57.asp
Investum. (2009, agust). Diversified Usage of Renewable Energy in Iceland - analysis of
alternative energy intensive sectors. Retrieved agust 18, 2011, from invest.is:
http://www.invest.is/resources/Files/invest_is/Publications/AltEnergy.pdf
Kemira. (2011). Kemira - Bleaching Additives. Retrieved september 14, 2011, from
kemira.com:
http://www.kemira.com/en/solutionsproducts/pages/bleachingadditives.aspx?breadcru
mbparent=auto
Landsnet (b). (2011). Netmáli. Retrieved november 14, 2011, from landsnet.is:
http://www.landsnet.is/Uploads/document/Netmali/B9%20_á%20vef.pdf
Landsnet. (2011). About Landsnet. Retrieved november 9, 2011, from landsnet.is:
http://www.landsnet.is/index.aspx?GroupId=1210&TabId=1220
Landsvirkjun (b). (2011). Ársskýrsla 2010. Retrieved oktober 23, 2011, from landsvirkjun.is:
http://www.landsvirkjun.is/media/um-landsvirkjun/LV_arsskyrsla_2010.pdf

67
Landsvirkjun. (2011). Um Landsvirkjun. Retrieved oktober 23, 2011, from landsvirkjun.is:
http://www.landsvirkjun.is/um-landsvirkjun/
Lynch, R. (2009). Strategic Management. Edinburgh Gate: Prentice Hall.
Nesskip hf. (2011). About Nesskip. Retrieved september 29, 2011, from nesskip.is:
http://en.nesskip.is/?c=webpage&id=10&lid=6&option=links
Norðurþing. (2011). about us. Retrieved september 11, 2011 , from nordurthing.is:
http://www.nordurthing.is/en/moya/page/the-municipality/
ODR, O. e. (2011). English - Olíudreifing. Retrieved oktober 14, 2011, from odr.is:
http://www.odr.is/english/
Orkuveita Reykjavíkur. (2011). Energy and Environment. Retrieved oktober 14, 2011, from
or.is: http://www.or.is/English/EnergyandEnvironment/
Perstorp Group. (2011). About Perstorp. Retrieved oktober 14, 2011, from perstorp.com:
http://www.perstorp.com/
Rangarajan, R. (2011, september 4). Meeting with AGC representatives. (A. Ottesen,
Interviewer)
RARIK ltd. (2011). Rarik. Retrieved oktober 14, 2011, from rarik.is:
http://rarik.is/english/rarik
Reinhardsson, H. (2006). VAÐLAHEIÐARGÖNG - MAT Á SAMFÉLAGSÁHRIFUM.
Húsavík: Þekkingarsetur Þingeyinga.
Remer, D. S., & Nieto, A. P. (1995). A compendium and comparison of 25 project evaluation
techniques. Part 1: Net present value and rate of return methods . International
Journal of Production Economics 42 , 79-96.
Reykjanesbær. (2011). Um Reykjanesbæ. Retrieved oktober 14, 2011, from reykjanesbaer.is:
http://www.reykjanesbaer.is/um-reykjanesbae/saga
Reykjaneshöfn. (2011). Helguvíkurhöfn. Retrieved oktober 14, 2011, from reykjaneshofn.is:
http://www.reykjaneshofn.is/Hafnir/Helguvik/
Reynisson, R. (2011, oktober 12). Svar við tölvupósti. (I. Waage, Interviewer) Norðurþing,
Iceland.
Ross, S., Westerfield, R., Jaffe, J., & Bradford, D. (2008). Modern Financial Management -
Eighth Edition. New York: McGraw-Hill.
SI, S. Í. (2011, november 14). Exchange rate - Time series. Retrieved november 14, 2011,
from sedlabanki.is: http://www.sedlabanki.is/?PageID=286
SIS, S. í. (2011). Sveitarfélög - Djúpavogshreppur. Retrieved november 11, 2011, from
samband.is: http://www.samband.is/sveitarfelogin/austurland/djupavogshreppur/

68
Somaiya, G. B. (2011). about us. Retrieved september 4, 2011, from somaiya.com:
http://www.somaiya.com/pages/aboutgsm.htm
SRI Consulting. (2011, january). Ethylene Glycol. Retrieved desember 6, 2011, from
chemical.ihs.com: http://chemical.ihs.com/WP/Public/Reports/eg/
TFÍ, T. Í. (2011). KJARAKANNANIR. Retrieved oktober 1, 2011, from tfi.is:
http://www.tfi.is/media/kjaramal/Kjarak_TFI_feb_2011.pdf
VFI, V. Í. (2011). Kjarakannanir. Retrieved oktober 1, 2011, from vfi.is:
http://www.vfi.is/media/kjaramal/Kjarak_SV_feb_2011.pdf
Vinmar International ltd. (2011). Vinmar international ltd. Retrieved oktober 23, 2011, from
vinmar.com: http://www.vinmar.com/index.htm
VR, V. R. (2011, september). Launatölurnar 2011 . Retrieved oktober 20, 2011, from vr.is:
http://www.vr.is/Uploads/VR/launakonnun_2011/launakonnun_2011_baeklingur_vefu
r.pdf
Wilson ASA. (2011). Reliable, flexible and competitive at sea. Retrieved september 29, 2011,
from wilsonship.no:
http://www.wilsonship.no/web/wilsonweb.nsf/pages/x_y_z.html?open&qm=wcm_2,1,
0,0,0,0

69
Appendix – Helguvík
Fundamentals 1) Project timeline - capacity - investment:
Production capacity in tpa
Year/description: Phase 1 Phase 2 Phase 3 Total
(Feasibility study cost 1 M.euro) Investment - EURO: 17.851.423
15.000.000
19.900.000
52.751.423
Capacity - tons(products): 30.000
35.000
60.000
125.000
0 1
30.000 100%
30.000
2
30.000 100%
30.000
3
30.000 100% 35.000 100%
65.000
4
30.000 100% 35.000 100%
65.000
5
30.000 100% 35.000 100% 60.000 100% 125.000
6
30.000 100% 35.000 100% 60.000 100% 125.000
7
30.000 100% 35.000 100% 60.000 100% 125.000
8
30.000 100% 35.000 100% 60.000 100% 125.000
9
30.000 100% 35.000 100% 60.000 100% 125.000
10
30.000 100% 35.000 100% 60.000 100% 125.000
2) G2G - Raw material usage/Product(s) distribution
Distrib.
Phase 1 Phase 2 Phase 3 Total
Raw material / products weight MT/year MT/year MT/year MT/year
Production capacity
30.000 35.000 60.000 125.000
Crude Glycerin (crude 80%) 41.209 48.077 82.418 171.703
Net feedstock Glycerin (100 %) 32.967 38.462 65.934 137.363
Methane 1,5 % of feed Glycerin 495 577 989 2.060
Methanol
2,0%
600 700 1.200 2.500
Ethanol propanol 1,0% 300 350 600 1.250
Total Alcohols.
3,0%
900 1.050 1.800 3.750
Propylene glycol
86,0%
25.800 30.100 51.600 107.500
Ethylene glycol 11,0% 3.300 3.850 6.600 13.750
Total liquid Products.
100,0%
30.000 35.000 60.000 125.000
Total liquid products - excluding methane: 30.000 35.000 60.000 125.000

70
3) Estimated product price and raw material price - based on prices in September 2010.
Euro/ton
Chemicals: Price Tons/a Phase 1 Phase 2 Phase 3 Total
Total value in Euro
Raw materials Crude Glycerin (80 %), ex-factory 280 NW-Europe 11.538.462 13.461.538 23.076.923 48.076.923
Glycols
Propylene glycol
1.150 NW-Europe 29.670.000 34.615.000 59.340.000 123.625.000
Ethylene glycol 850 NW-Europe 2.805.000 3.272.500 5.610.000 11.687.500
1.303 1083 32.475.000 37.887.500 64.950.000 135.312.500
Alcohols
Ethanol
700 NW-Europe 210.000 245.000 420.000 875.000
Methanol 700 NW-Europe 420.000 490.000 840.000 1.750.000
700
630.000 735.000 1.260.000 2.625.000
Gas
Methane (0,714 kg/Nm3) 400 NW-Europe 197.802 230.769 395.604 824.176
Total - without methane: 33.105.000 38.622.500 66.210.000 137.937.500
Total - average price pr MT
1.104 1.104 1.104 1.104
Total revenue - with methane 33.302.802 38.853.269 66.605.604 138.761.676
4) Freight cost - logistics:
Description Euro/MT
NW-Europe-Iceland, liquid cargo
25
Sea freight is very sensitive Trucking - factory to harbor - liquid cargo 7,42
to size. 15 Euro/MT
Trucking & Storage factory to depot - alcohols 16,5
for 15.000 t lots and
Piping- factory to depot - methane 40 50 Euro/MT for 1.250 t lots.
5) Currency rates ISK to:
USD
116
EUR
159
GBP
183
NKR
21

71
6) Investment estimate - phase 1, 2 and 3:
Phase 1 - 30.000 tons capacity: Euro Depreciation
Connector to Landsnet
748.428 4% 10,0% Design, engineering, construction management:
1.500.000 8% 10,0%
Land, building and premises:
1.200.000 7% 3,0% Storage tanks:
1.902.995 11% 10,0%
Hydrogen electrolyser:
3.000.000 17% 12,5% Evaporators and distillation:
3.800.000 21% 10,0%
Other fixtures and fittings:
3.200.000 18% 10,0% Contingency: 2.500.000 14% 10,0%
Total: -10 % /+35% accuracy
17.851.423 100% 1.701.300 annually
Year 0-2
Phase 2 - 35.000 tons capacity:
Total investment: -10 % /+35% accuracy
15.000.000
9,5%
Year 3-4
Phase 3 - 60.000 tons capacity:
Total investment: -15/+-50 % accuracy
19.900.000
9,5%
Year 5-6
7) Power consumption:
Phase 1 Phase 2 Phase 3 Total
Transmission cost
330.968 455.781 872.533 1.659.283
Electrical consumption(w.electrolyzer) - full capacity: kW 6.180 12.360 24.720 43.260
Number of hours:
8.300 8.300 8.300
Gigawatthours: 51,3 102,6 205,2 359,1
Electrical cost -Euro/kWh 0,023 0,023 0,023
Total cost at full capacity: Euro
1.510.730 2.815.305 5.591.581 9.917.617
Thermal power consumption: kW
8.500 17.000 34.000 59.500
Converted to steam equiv. (t/h, 12 bar): t/h
14 28 56 97
Operating hours per year: 8.300 8.300 8.300
Cost of steam equivalent: Euro pr ton 4 4 4
Total thermal power cost at full capacity: Euro
461.782 923.564 1.847.127 3.232.473
Tank storage rental (Euro Per Year)
120.000 240.000 480.000 840.000
Thermal power generated with electricity:
Gigawatthours - efficiency 1,1 77,6 155,2 310,4 543,2
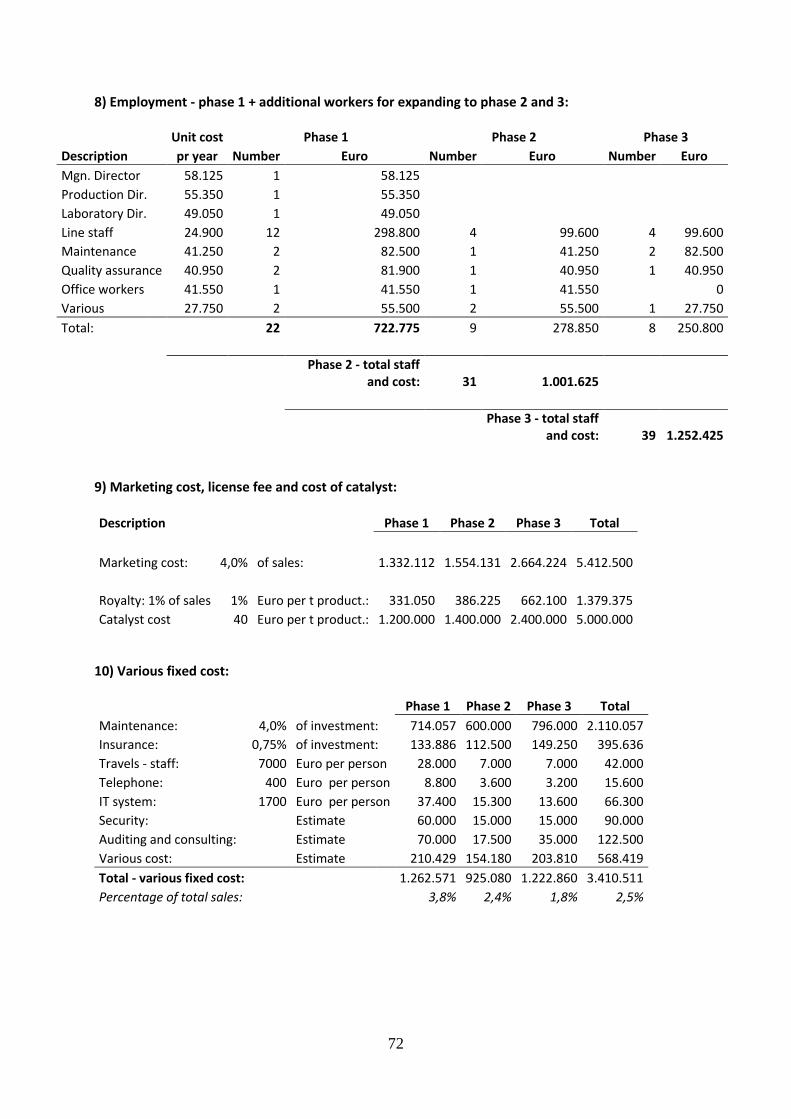
72
8) Employment - phase 1 + additional workers for expanding to phase 2 and 3:
Unit cost Phase 1 Phase 2 Phase 3
Description pr year Number Euro Number Euro Number Euro
Mgn. Director 58.125 1 58.125 Production Dir. 55.350 1 55.350 Laboratory Dir. 49.050 1 49.050 Line staff
24.900 12 298.800 4 99.600 4 99.600
Maintenance 41.250 2 82.500 1 41.250 2 82.500
Quality assurance 40.950 2 81.900 1 40.950 1 40.950
Office workers 41.550 1 41.550 1 41.550
0
Various 27.750 2 55.500 2 55.500 1 27.750
Total:
22 722.775 9 278.850 8 250.800
Phase 2 - total staff and cost: 31 1.001.625
Phase 3 - total staff and cost: 39 1.252.425
9) Marketing cost, license fee and cost of catalyst:
Description
Phase 1 Phase 2 Phase 3 Total
Marketing cost: 4,0% of sales:
1.332.112 1.554.131 2.664.224 5.412.500
Royalty: 1% of sales 1% Euro per t product.: 331.050 386.225 662.100 1.379.375
Catalyst cost 40 Euro per t product.: 1.200.000 1.400.000 2.400.000 5.000.000
10) Various fixed cost:
Phase 1 Phase 2 Phase 3 Total
Maintenance: 4,0% of investment: 714.057 600.000 796.000 2.110.057
Insurance:
0,75% of investment: 133.886 112.500 149.250 395.636
Travels - staff: 7000 Euro per person 28.000 7.000 7.000 42.000
Telephone: 400 Euro per person 8.800 3.600 3.200 15.600
IT system:
1700 Euro per person 37.400 15.300 13.600 66.300
Security:
Estimate
60.000 15.000 15.000 90.000
Auditing and consulting:
Estimate
70.000 17.500 35.000 122.500
Various cost: Estimate 210.429 154.180 203.810 568.419
Total - various fixed cost:
1.262.571 925.080 1.222.860 3.410.511
Percentage of total sales:
3,8% 2,4% 1,8% 2,5%

73
11) Transmission cost from Landsnet
Phase 1 Phase 2 Phase 3
Tariff Tariff Tariff
Delivery Charge 39.029 € €/year 39.029 € 39.029 € 39.029 € Capacity charge 20.650 € €/MW
127.618 € 255.236 € 510.473 €
Energy charge 1,045 € €/MWh
53.588 € 107.177 € 214.353 €
Ancillary services 0,162 € €/MWh
8.297 € 16.595 € 33.189 €
Transmission losses 0,368 € €/MWh 18.872 € 37.745 € 75.489 €
Total
247.405 € 455.781 € 872.533 €
12) Model to calculate strain
Startup cost 1.273.835 € Percent per year 0,08 Portion of startup cost 0,80 MWh 51.294 € Energy charge 1,04 € MW 6,18
Capacity charge 20.650 €
Surcharge 46,12%

74
13) Model to calculate Landsnet tariff with strain
Usages
Load capacity 6,18 MW
Energy 51.294 MWh
Utilization 8.300 hrs.
ISK/EUR 159,00 kr.
Tariff for intensive users
Delivery Charge 39.029 EUR per year
Capacity charge 20.650 EUR per MW per year
Energy charge 1,04 EUR per MWh
Ancillary services 0,1618 EUR per MWh
Transmission losses 0,3679 EUR per MWh
Intensive users strain
Delivery Charge 0 EUR per year
Capacity charge 9.523 EUR per MW per year
Energy charge 0,48 EUR per MWh
Ancillary services 0,0000 EUR per MWh
Transmission losses 0,0000 EUR per MWh
Additional fee
Delivery charge 0 EUR
Capacity charge 58.851 EUR
Energy charge 24.712 EUR
Total for transmission 83.564 EUR
Up dated tariff
Delivery Charge 39.029 EUR per year
Capacity charge 30.173 EUR per MW per year
Energy charge 1,53 EUR per MWh
Ancillary services 0,1618 EUR per MWh
Transmission losses 0,3679 EUR per MWh
Total tariff
Delivery charge 39.029 EUR
Capacity charge 186.469 EUR
Energy charge 78.301 EUR
Ancillary services 8.297 EUR
Transmission losses 18.872 EUR
Total for transmission 330.968 EUR

75
Profit and loss Sales, freight cost and marketing cost in €uro
Description: Year 1 Year 2 Year 3 Year 4 Year 5 Year 6 Year 7 Year 8 Year 9 Year 10
i) Glycols: Phase 1:
32.475.000 32.475.000 32.475.000 32.475.000 32.475.000 32.475.000 32.475.000 32.475.000 32.475.000 32.475.000
Phase 2:
37.887.500 37.887.500 37.887.500 37.887.500 37.887.500 37.887.500 37.887.500 37.887.500
Phase 3:
64.950.000 64.950.000 64.950.000 64.950.000 64.950.000 64.950.000
32.475.000 32.475.000 70.362.500 70.362.500 135.312.500 135.312.500 135.312.500 135.312.500 135.312.500 135.312.500
Product:
Glycols - sea freight:
623.081 623.081 1.080.008 1.080.008 1.817.321 1.817.321 1.817.321 1.817.321 1.817.321 1.817.321
Glycols - trucking:
184.931 184.931 400.683 400.683 770.544 770.544 770.544 770.544 770.544 770.544
ii) Alcohols: Phase 1
630.000 630.000 630.000 630.000 630.000 630.000 630.000 630.000 630.000 630.000
Phase 2
735.000 735.000 735.000 735.000 735.000 735.000 735.000 735.000
Phase 3
1.260.000 1.260.000 1.260.000 1.260.000 1.260.000 1.260.000
630.000 630.000 1.365.000 1.365.000 2.625.000 2.625.000 2.625.000 2.625.000 2.625.000 2.625.000
Alcohols - trucking:
14.850 14.850 32.175 32.175 61.875 61.875 61.875 61.875 61.875 61.875
Total sales
33.105.000 33.105.000 71.727.500 71.727.500 137.937.500 137.937.500 137.937.500 137.937.500 137.937.500 137.937.500
iii) Glycerin: Phase 1
11.538.462 11.538.462 11.538.462 11.538.462 11.538.462 11.538.462 11.538.462 11.538.462 11.538.462 11.538.462
Feedstock Phase 2
13.461.538 13.461.538 13.461.538 13.461.538 13.461.538 13.461.538 13.461.538 13.461.538
Phase 3
23.076.923 23.076.923 23.076.923 23.076.923 23.076.923 23.076.923
11.538.462 11.538.462 25.000.000 25.000.000 48.076.923 48.076.923 48.076.923 48.076.923 48.076.923 48.076.923
35% 35% 35% 35% 35% 35% 35% 35% 35% 35%
Crude Glycerin – sea freight:
1.030.220 1.030.220 1.785.714 1.785.714 3.004.808 2.575.549 2.575.549 2.575.549 2.575.549 2.575.549
iv) Sea freight - total:
1.653.301 1.653.301 2.865.722 2.865.722 4.822.128 4.392.870 4.392.870 4.392.870 4.392.870 4.392.870
Trucking - total:
199.781 199.781 432.858 432.858 832.419 832.419 832.419 832.419 832.419 832.419
Tank storage rental
120.000 120.000 240.000 240.000 480.000 480.000 480.000 480.000 480.000 480.000
Total freight and storage cost:
1.973.082 1.973.082 3.538.580 3.538.580 6.134.547 5.705.289 5.705.289 5.705.289 5.705.289 5.705.289

76
Energy cost
v) Electricity:
Phase 1 1.510.730 1.510.730 1.510.730 1.510.730 1.510.730 1.510.730 1.510.730 1.510.730 1.510.730 1.510.730
Phase 2
2.815.305 2.815.305 2.815.305 2.815.305 2.815.305 2.815.305 2.815.305 2.815.305
Phase 3 5.591.581 5.591.581 5.591.581 5.591.581 5.591.581 5.591.581
1.510.730 1.510.730 4.326.035 4.326.035 9.917.617 9.917.617 9.917.617 9.917.617 9.917.617 9.917.617
vi) Thermal energy:
Phase 1 461.782 461.782 461.782 461.782 461.782 461.782 461.782 461.782 461.782 461.782
Phase 2
923.564 923.564 923.564 923.564 923.564 923.564 923.564 923.564
Phase 3 1.847.127 1.847.127 1.847.127 1.847.127 1.847.127 1.847.127
461.782 461.782 1.385.345 1.385.345 3.232.473 3.232.473 3.232.473 3.232.473 3.232.473 3.232.473
vii) Total energy cost:
1.972.512 1.972.512 5.711.381 5.711.381 13.150.089 13.150.089 13.150.089 13.150.089 13.150.089 13.150.089
Proportion of sales:
6% 6% 8% 8% 10% 10% 10% 10% 10% 10%

77
Estimated profit and loss account:
EUR Year 1 Year 2 Year 3 Year 4 Year 5 Year 6 Year 7 Year 8 Year 9 Year 10
Total sales - CIF:
33.105.000 33.105.000 71.727.500 71.727.500 137.937.500 137.937.500 137.937.500 137.937.500 137.937.500 137.937.500
Marketing cost:
1.324.200 1.324.200 2.869.100 2.869.100 5.517.500 5.517.500 5.517.500 5.517.500 5.517.500 5.517.500
Total sales, net 31.780.800 31.780.800 68.858.400 68.858.400 132.420.000 132.420.000 132.420.000 132.420.000 132.420.000 132.420.000
Variable cost:
Cost of raw material:
11.538.462 11.538.462 25.000.000 25.000.000 48.076.923 48.076.923 48.076.923 48.076.923 48.076.923 48.076.923
Sea freight cost:
1.653.301 1.653.301 2.865.722 2.865.722 4.822.128 4.392.870 4.392.870 4.392.870 4.392.870 4.392.870
Product trucking cost: 199.781 199.781 432.858 432.858 832.419 832.419 832.419 832.419 832.419 832.419
Electrical cost:
1.510.730 1.510.730 4.326.035 4.326.035 9.917.617 9.917.617 9.917.617 9.917.617 9.917.617 9.917.617
Thermal energy cost:
461.782 461.782 1.385.345 1.385.345 3.232.473 3.232.473 3.232.473 3.232.473 3.232.473 3.232.473
Catalyst cost
1.648.352 1.648.352 3.571.429 3.571.429 6.868.132 6.868.132 6.868.132 6.868.132 6.868.132 6.868.132
Royalty:
317.808 317.808 688.584 688.584 1.324.200 1.324.200 1.324.200 1.324.200 1.324.200 1.324.200
17.330.215 17.330.215 38.269.973 38.269.973 75.073.892 74.644.633 74.644.633 74.644.633 74.644.633 74.644.633
52% 52% 53% 53% 54% 54% 54% 54% 54% 54%
Fixed cost:
Salaries and wages
722.775 722.775 1.001.625 1.001.625 1.252.425 1.252.425 1.252.425 1.252.425 1.252.425 1.252.425
Maintenance
714.057 714.057 1.314.057 1.314.057 2.110.057 2.110.057 2.110.057 2.110.057 2.110.057 2.110.057
Insurance
133.886 133.886 246.386 246.386 395.636 395.636 395.636 395.636 395.636 395.636
Storage Tank Rental
120.000 120.000 240.000 240.000 480.000 480.000 480.000 480.000 480.000 480.000
Other fixed cost
414.629 414.629 627.209 627.209 904.819 904.819 904.819 904.819 904.819 904.819
2.105.346 2.105.346 3.429.276 3.429.276 5.142.936 5.142.936 5.142.936 5.142.936 5.142.936 5.142.936
Total costs
19.435.561 19.435.561 41.699.249 41.699.249 80.216.828 79.787.569 79.787.569 79.787.569 79.787.569 79.787.569
6% 6% 5% 5% 4% 4% 4% 4% 4% 4%
EBITDA:
12.345.239 12.345.239 27.159.151 27.159.151 52.203.172 52.632.431 52.632.431 52.632.431 52.632.431 52.632.431
37% 37% 38% 38% 38% 38% 38% 38% 38% 38%
Depreciation
1.701.300 1.701.300 3.130.849 3.130.849 5.027.385 5.027.385 5.027.385 5.027.385 5.027.385 5.027.385
5% 5% 4% 4% 4% 4% 4% 4% 4% 4%
Financial items:
-210.551 22.695 -414.778 158.705 -123.504 991.375 2.185.239 3.396.265 4.625.537 5.841.251
Profit before tax:
10.433.389 10.666.635 23.613.524 24.187.007 47.052.284 48.596.421 49.790.285 51.001.311 52.230.583 53.446.297
Used deployment cost against taxes/ rapid depreciation
32% 32% 33% 34% 34% 35% 36% 37% 38% 39%
Corporate tax (20%): 20%
521.669 853.331 1.889.082 2.418.701 4.705.228 4.859.642 5.476.931 6.120.157 6.267.670 7.482.482
Profit/loss:
9.911.719 9.813.304 21.724.442 21.768.306 42.347.055 43.736.779 44.313.353 44.881.154 45.962.913 45.963.816
30% 30% 30% 30% 31% 32% 32% 33% 33% 33%
ROS
31,2% 30,9% 31,5% 31,6% 32,0% 33,0% 33,5% 33,9% 34,7% 34,7%

78
Cash flow and equity
The following cash flow is based on the following assumptions:
Investment Equity Loan capital
Euro % Euro % Euro
Phase 1 17.851.423 100% 13.388.567 25% 4.462.856 Phase 2 15.000.000 100% 3.000.000 80% 12.000.000 Phase 3 19.900.000 100% 3.980.000 80% 15.920.000
Interest rate:
Euro loans: Libor: 0,17% Premium: 6,00% Total: 6,17%
Euro deposits:
Total: 2,06%
Income:
Estimated length of time of receivables: 2 months 16,67% of the annual income
Cost:
Estimated length of time of payables: 1 months 8,33% of the annual cost
8 years
Year Beginning of 0 1 2 3 4 5 6 7 8 9 10
Loan 1+first year interest
4.756.321
Principal
-594.540 -594.540 -594.540 -594.540 -594.540 -594.540 -594.540 -594.540
Interests: -293.465 -256.782 -220.099 -183.416 -146.732 -110.049 -73.366 -36.683
Loan 2 + first year interest
12.789.087
Principal
-1.598.636 -1.598.636 -1.598.636 -1.598.636 -1.598.636 -1.598.636 -1.598.636 -1.598.636
Interests: -789.087 -690.451 -591.815 -493.179 -394.543 -295.907 -197.272 -98.636
Loan 3 + first year interest
16.966.855
Principal
-2.120.857 -2.120.857 -2.120.857 -2.120.857 -2.120.857 -2.120.857
Interest: -1.046.855 -915.998 -785.141 -654.284 -523.427 -392.571
* Loans are paid out at the beginning of the year and accrue interest that year.

79
Atlantic Green Chemicals - Glycerin to glycols - G2G
0-1 Year 0 Year 1 Year 2 Year 3 Year 4 Year 5 Year 6 Year 7 Year 8 Year 9 Year 10
Revenue:
31.780.800 31.780.800 68.858.400 68.858.400 132.420.000 132.420.000 132.420.000 132.420.000 132.420.000 132.420.000
Operational Cost:
19.435.561 19.435.561 41.699.249 41.699.249 80.216.828 79.787.569 79.787.569 79.787.569 79.787.569 79.787.569
Share capital: 1000000 14.388.567 14.388.567 17.388.567 17.388.567 21.368.567 21.368.567 21.368.567 21.368.567 21.368.567 21.368.567 21.368.567
Investment: -1000000 -17.851.423 -15.000.000 -19.900.000
Loan capital: 4.462.856 12.000.000 15.920.000
Operational Capital Need 100000 100.000
New Equity needed -1000000 -13.288.567 0 -3.000.000 0 -3.980.000 0 0 0 0 0 0
Income:
26.484.000 31.780.800 62.678.800 68.858.400 121.826.400 132.420.000 132.420.000 132.420.000 132.420.000 132.420.000
Operational cost: 900000
-17.815.931 -19.435.561 -39.843.942 -41.699.249 -77.007.029 -79.823.341 -79.787.569 -79.787.569 -79.787.569 -79.787.569
Cash Flow from Operations 900000
8.668.069 12.345.239 22.834.858 27.159.151 44.819.371 52.596.659 52.632.431 52.632.431 52.632.431 52.632.431
Equity Inflow :
-1000000 -13.288.567
-3.000.000
-3.980.000
Principal Payment of loans:
0 -594.540 -594.540 -2.193.176 -2.193.176 -4.314.033 -4.314.033 -4.314.033 -4.314.033 -3.719.493 -3.719.493
Financial items:
0 -210.551 22.695 -414.778 158.705 -123.504 991.375 2.185.239 3.396.265 4.625.537 5.841.251
Corporate tax: -521.669 -853.331 -1.889.082 -2.418.701 -4.705.228 -4.859.642 -5.476.931 -6.120.157 -6.267.670
Free Cash flow to equity -1000000 -13.288.567 7.862.978 8.251.725 19.373.573 19.255.598 37.963.133 44.568.773 45.643.995 46.237.732 47.418.318 48.486.519
280
IRR 86,2%
NPV 89.427.385 15%
Cash at beginning of period
100.000 100.000 7.962.978 19.214.703 38.588.276 61.823.874 99.787.008 144.355.781 189.999.775 236.237.507 283.655.824
Cast at end of period 100.000 7.962.978 19.214.703 38.588.276 61.823.874 99.787.008 144.355.781 189.999.775 236.237.507 283.655.824 332.142.344
Interest income:
82.914 279.477 594.407 1.032.572 1.661.899 2.510.602 3.438.290 4.383.140 5.346.236 6.332.458
Interest paid on long term loans: -293.465 -256.782 -1.009.185 -873.866 -1.785.402 -1.519.227 -1.253.051 -986.875 -720.699 -491.206
Finical items - total:
-210.551 22.695 -414.778 158.705 -123.504 991.375 2.185.239 3.396.265 4.625.537 5.841.251

80
Tanks building estimates Tank building estimates
Tank construction 2500m3 212.068 €
Sump and sewage system, filling station, fences 95.932 €
Piping to outer harbor 39.426 €
Fire extinguishing system with foam for methanol 93.029 €
Pumping system with a control house 36.439 €
Scada system 37.834 €
Miscellaneous and contingency 85.841 €
Design management 33.764 €
Total 634.332 €
Tank construction 1000m3 84.827 €
Sump and sewage system, filling station, fences 38.373 €
Piping to outer harbor 15.770 €
Fire extinguishing system with foam for methanol 37.212 €
Pumping system with a control house 14.575 €
Scada system 15.134 €
Miscellaneous and contingency 34.336 €
Design management 13.506 € Total 253.733 €
Tank construction 4000m3 339.308 €
Sump and sewage system, filling station, fences 153.491 €
Piping to outer harbor 63.082 €
Fire extinguishing system with foam for methanol 148.846 €
Pumping system with a control house 58.302 €
Scada system 60.535 €
Miscellaneous and contingency 137.345 €
Design management 54.022 €
Total 1.014.931 €

81
Appendix – Grundartangi
Fundamentals 1) Project timeline - capacity - investment:
Production capacity in tpa
Year/description: Phase 1 Phase 2 Phase 3 Total
(Feasibility study cost 1 M.euro) Investment - EURO: 15.866.354
13.000.000
17.900.000
46.766.354
Capacity - tons(products): 30.000
35.000
60.000
125.000
0 1
30.000 100%
30.000
2
30.000 100%
30.000
3
30.000 100% 35.000 100%
65.000
4
30.000 100% 35.000 100%
65.000
5
30.000 100% 35.000 100% 60.000 100% 125.000
6
30.000 100% 35.000 100% 60.000 100% 125.000
7
30.000 100% 35.000 100% 60.000 100% 125.000
8
30.000 100% 35.000 100% 60.000 100% 125.000
9
30.000 100% 35.000 100% 60.000 100% 125.000
10
30.000 100% 35.000 100% 60.000 100% 125.000
2) G2G - Raw material usage/Product(s) distribution
Distrib.
Phase 1 Phase 2 Phase 3 Total
Raw material / products weight MT/year MT/year MT/year MT/year
Production capacity
30.000 35.000 60.000 125.000
Crude Glycerin (crude 80%) 41.209 48.077 82.418 171.703
Net feedstock Glycerin (100 %) 32.967 38.462 65.934 137.363
Methane 1,5 % of feed Glycerin 495 577 989 2.060
Methanol
2,0%
600 700 1.200 2.500
Ethanol propanol 1,0% 300 350 600 1.250
Total Alcohols.
3,0%
900 1.050 1.800 3.750
Propylene glycol
86,0%
25.800 30.100 51.600 107.500
Ethylene glycol 11,0% 3.300 3.850 6.600 13.750
Total liquid Products.
100,0%
30.000 35.000 60.000 125.000
Total liquid products - excluding methane: 30.000 35.000 60.000 125.000

82
3) Estimated product price and raw material price
Euro/ton
Chemicals: Price Tons/a Phase 1 Phase 2 Phase 3 Total
Total value in Euro
Raw materials Crude Glycerin (80 %), ex-factory 280 NW-Europe 11.538.462 13.461.538 23.076.923 48.076.923
Glycols
Propylene glycol
1.150 NW-Europe 29.670.000 34.615.000 59.340.000 123.625.000
Ethylene glycol 850 NW-Europe 2.805.000 3.272.500 5.610.000 11.687.500
1.210 1083 32.475.000 37.887.500 64.950.000 135.312.500
Alcohols
Ethanol
700 NW-Europe 210.000 245.000 420.000 875.000
Methanol 700 NW-Europe 420.000 490.000 840.000 1.750.000
700
630.000 735.000 1.260.000 2.625.000
Gas
Methane (0,714 kg/Nm3) 400 NW-Europe 197.802 230.769 395.604 824.176
Total - without methane: 33.105.000 38.622.500 66.210.000 137.937.500
Total - average price pr MT
1.104 1.104 1.104 1.104
Total revenue - with methane 33.302.802 38.853.269 66.605.604 138.761.676
4) Freight cost - logistics:
Description Euro/MT
NW-Europe-Iceland, liquid cargo
25
Sea freight is very sensitive Trucking - factory to harbor - liquid cargo 7,42
to size. 15 Euro/MT
Trucking & Storage factory to depot - alcohols 16,5
for 15.000 t lots and
Piping- factory to depot - methane 40 50 Euro/MTfor 1.250 t lots.
5) Currency rates (ISK to) used in this report
USD
116,0
EUR
159,0
GBP
183,0
NKR
21,00

83
6) Investment estimate - phase 1, 2 and 3:
Phase 1 - 30.000 tons capacity: Euro Depreciation
Connector to RARIK
748.428 5% 10,0% Design, engineering, construction management:
1.500.000 9% 10,0%
Land, building and premises:
1.200.000 8% 3,0% Storage tanks:
2.917.926 18% 10,0%
Hydrogen electrolyser:
0 0% 12,5% Evaporators and distillation:
3.800.000 24% 10,0%
Other fixtures and fittings:
3.200.000 20% 10,0% Contingency: 2.500.000 16% 10,0%
Total: -10 % /+35% accuracy
15.866.354 100% 1.502.635 annually
Year 0-2
Phase 2 - 35.000 tons capacity:
Total investment: -10 % /+35% accuracy
13.000.000
9,5%
Year 3-4
Phase 3 - 60.000 tons capacity:
Total investment: -15/+-50 % accuracy
17.900.000
9,5%
Year 5-6
7) Power consumption:
Phase 1 Phase 2 Phase 3 Total
Transmission cost
149.186 285.850 559.180 994.216
Electrical consumption(w.electrolyzer) - full capacity: kW 1.180 2.360 4.720 8.260
Number of hours:
8.300 8.300 8.300
Gigawatthours: 9,794 19,588 39,176 68,6
Electrical cost -Euro/kWh 0,023 0,023 0,023
Total cost at full capacity: Euro
374.448 736.374 1.460.228 2.571.050
Thermal power consumption: kW
8.500 17.000 34.000 59.500
Converted to steam equiv. (t/h, 12 bar): t/h
14 28 56 97
Operating hours per year: 8.300 8.300 8.300
Cost of steam equivalent: Euro pr ton 15 6 6
Total thermal power cost at full capacity: Euro
1.731.682 1.385.345 2.770.691 5.887.718
Hydrogen power consumption: Nm3/h
900 1.800 3.600 6.300
Converted to t/h
0,08 0,16 0,32 0,567
Number of hours
8.300 8.300 8.300
Cost of hydrogen: Euro pr. Ton 700 700 700
Total hydrogen power cost at full capacity: Euro
470.610 941.220 1.882.440 3.294.270
Tank storage rental (Euro Per Year)
0 0 0 0
Thermal power generated with electricity:
Gigawatthours - efficiency 1,1 77,6 155,2 310,4 543,2
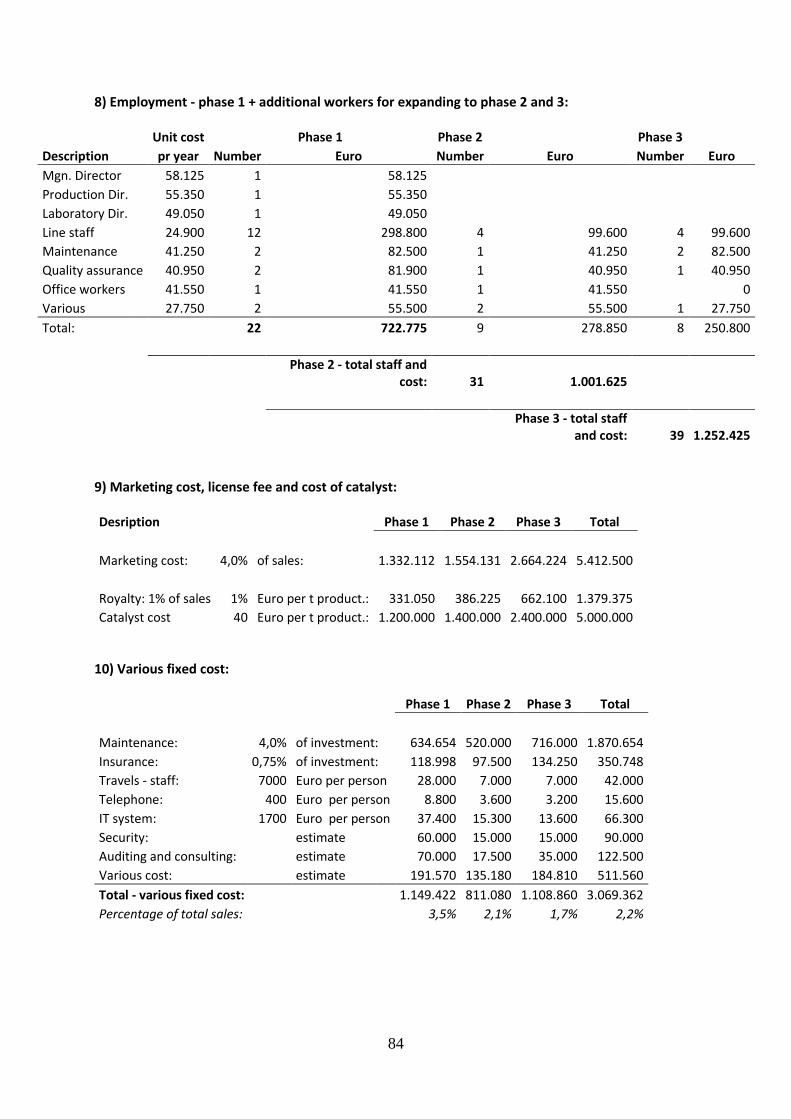
84
8) Employment - phase 1 + additional workers for expanding to phase 2 and 3:
Unit cost Phase 1 Phase 2
Phase 3
Description pr year Number Euro Number Euro Number Euro
Mgn. Director 58.125 1 58.125 Production Dir. 55.350 1 55.350 Laboratory Dir. 49.050 1 49.050 Line staff
24.900 12 298.800 4 99.600 4 99.600
Maintenance 41.250 2 82.500 1 41.250 2 82.500
Quality assurance 40.950 2 81.900 1 40.950 1 40.950
Office workers 41.550 1 41.550 1 41.550
0
Various 27.750 2 55.500 2 55.500 1 27.750
Total:
22 722.775 9 278.850 8 250.800
Phase 2 - total staff and cost: 31 1.001.625
Phase 3 - total staff and cost: 39 1.252.425
9) Marketing cost, license fee and cost of catalyst:
Desription
Phase 1 Phase 2 Phase 3 Total
Marketing cost: 4,0% of sales:
1.332.112 1.554.131 2.664.224 5.412.500
Royalty: 1% of sales 1% Euro per t product.: 331.050 386.225 662.100 1.379.375
Catalyst cost 40 Euro per t product.: 1.200.000 1.400.000 2.400.000 5.000.000
10) Various fixed cost:
Phase 1 Phase 2 Phase 3 Total
Maintenance: 4,0% of investment: 634.654 520.000 716.000 1.870.654
Insurance:
0,75% of investment: 118.998 97.500 134.250 350.748
Travels - staff: 7000 Euro per person 28.000 7.000 7.000 42.000
Telephone: 400 Euro per person 8.800 3.600 3.200 15.600
IT system:
1700 Euro per person 37.400 15.300 13.600 66.300
Security:
estimate
60.000 15.000 15.000 90.000
Auditing and consulting:
estimate
70.000 17.500 35.000 122.500
Various cost: estimate 191.570 135.180 184.810 511.560
Total - various fixed cost:
1.149.422 811.080 1.108.860 3.069.362
Percentage of total sales:
3,5% 2,1% 1,7% 2,2%

85
11) Transmission cost
Phase 1 Phase 2 Phase 3
Delivery Charge 12.521 €/year
12.521 12.521 12.521
Capacity charge 44,30 €/kw
52.276 104.552 209.105
Energy charge 8,62 €/kWh 84.389 168.777 337.554
Total 149.186 285.850 559.180
Profit and loss
Sales, freight cost and marketing cost in Euro:
Description: Year 1 Year 2 Year 3 Year 4 Year 5 Year 6 Year 7 Year 8 Year 9 Year 10
i) Glycols: Phase 1:
32.475.000 32.475.000 32.475.000 32.475.000 32.475.000 32.475.000 32.475.000 32.475.000 32.475.000 32.475.000
Phase 2:
37.887.500 37.887.500 37.887.500 37.887.500 37.887.500 37.887.500 37.887.500 37.887.500
Phase 3:
64.950.000 64.950.000 64.950.000 64.950.000 64.950.000 64.950.000
32.475.000 32.475.000 70.362.500 70.362.500 135.312.500 135.312.500 135.312.500 135.312.500 135.312.500 135.312.500
Product:
Glycols - sea freight:
670.971 670.971 1.163.017 1.163.017 1.956.999 1.956.999 1.956.999 1.956.999 1.956.999 1.956.999
Glycols - trucking:
199.144 199.144 431.479 431.479 829.768 829.768 829.768 829.768 829.768 829.768
ii) Alcohols: Phase 1
630.000 630.000 630.000 630.000 630.000 630.000 630.000 630.000 630.000 630.000
Phase 2
735.000 735.000 735.000 735.000 735.000 735.000 735.000 735.000
Phase 3
1.260.000 1.260.000 1.260.000 1.260.000 1.260.000 1.260.000
630.000 630.000 1.365.000 1.365.000 2.625.000 2.625.000 2.625.000 2.625.000 2.625.000 2.625.000
Alcohols - trucking:
14.850 14.850 32.175 32.175 61.875 61.875 61.875 61.875 61.875 61.875
Total sales
33.105.000 33.105.000 71.727.500 71.727.500 137.937.500 137.937.500 137.937.500 137.937.500 137.937.500 137.937.500
iii) Glycerin: Phase 1
11.538.462 11.538.462 11.538.462 11.538.462 11.538.462 11.538.462 11.538.462 11.538.462 11.538.462 11.538.462
Feedstock Phase 2
13.461.538 13.461.538 13.461.538 13.461.538 13.461.538 13.461.538 13.461.538 13.461.538
Phase 3
23.076.923 23.076.923 23.076.923 23.076.923 23.076.923 23.076.923
11.538.462 11.538.462 25.000.000 25.000.000 48.076.923 48.076.923 48.076.923 48.076.923 48.076.923 48.076.923
35% 35% 35% 35% 35% 35% 35% 35% 35% 35%
Crude Glycerin - sea freight:
1.030.220 1.030.220 1.785.714 1.785.714 3.004.808 2.575.549 2.575.549 2.575.549 2.575.549 2.575.549
iv) Sea freight - total:
1.701.191 1.701.191 2.948.731 2.948.731 4.961.807 4.532.548 4.532.548 4.532.548 4.532.548 4.532.548
Trucking - total:
213.994 213.994 463.654 463.654 891.643 891.643 891.643 891.643 891.643 891.643
Tank storage rental
- - - - - - - - - -
Total freight and storage cost:
1.915.185 1.915.185 3.412.385 3.412.385 5.853.449 5.424.191 5.424.191 5.424.191 5.424.191 5.424.191
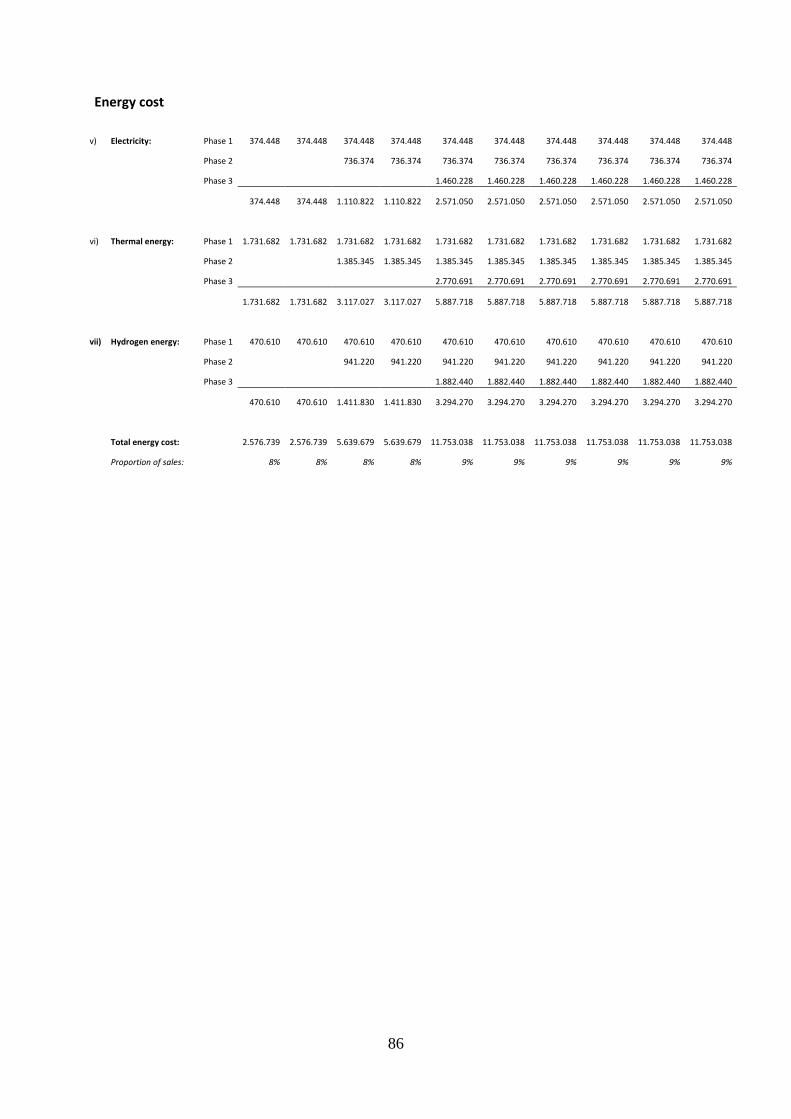
86
Energy cost
v) Electricity:
Phase 1 374.448 374.448 374.448 374.448 374.448 374.448 374.448 374.448 374.448 374.448
Phase 2
736.374 736.374 736.374 736.374 736.374 736.374 736.374 736.374
Phase 3 1.460.228 1.460.228 1.460.228 1.460.228 1.460.228 1.460.228
374.448 374.448 1.110.822 1.110.822 2.571.050 2.571.050 2.571.050 2.571.050 2.571.050 2.571.050
vi) Thermal energy:
Phase 1 1.731.682 1.731.682 1.731.682 1.731.682 1.731.682 1.731.682 1.731.682 1.731.682 1.731.682 1.731.682
Phase 2
1.385.345 1.385.345 1.385.345 1.385.345 1.385.345 1.385.345 1.385.345 1.385.345
Phase 3 2.770.691 2.770.691 2.770.691 2.770.691 2.770.691 2.770.691
1.731.682 1.731.682 3.117.027 3.117.027 5.887.718 5.887.718 5.887.718 5.887.718 5.887.718 5.887.718
vii) Hydrogen energy:
Phase 1 470.610 470.610 470.610 470.610 470.610 470.610 470.610 470.610 470.610 470.610
Phase 2
941.220 941.220 941.220 941.220 941.220 941.220 941.220 941.220
Phase 3 1.882.440 1.882.440 1.882.440 1.882.440 1.882.440 1.882.440
470.610 470.610 1.411.830 1.411.830 3.294.270 3.294.270 3.294.270 3.294.270 3.294.270 3.294.270
Total energy cost:
2.576.739 2.576.739 5.639.679 5.639.679 11.753.038 11.753.038 11.753.038 11.753.038 11.753.038 11.753.038
Proportion of sales:
8% 8% 8% 8% 9% 9% 9% 9% 9% 9%

87
Estimated profit and loss account:
EUR Year 1 Year 2 Year 3 Year 4 Year 5 Year 6 Year 7 Year 8 Year 9 Year 10
Total sales - CIF:
33.105.000 33.105.000 71.727.500 71.727.500 137.937.500 137.937.500 137.937.500 137.937.500 137.937.500 137.937.500
Marketing cost:
1.324.200 1.324.200 2.869.100 2.869.100 5.517.500 5.517.500 5.517.500 5.517.500 5.517.500 5.517.500
Total sales, net 31.780.800 31.780.800 68.858.400 68.858.400 132.420.000 132.420.000 132.420.000 132.420.000 132.420.000 132.420.000
Variable cost:
Cost of raw material:
11.538.462 11.538.462 25.000.000 25.000.000 48.076.923 48.076.923 48.076.923 48.076.923 48.076.923 48.076.923
Sea freight cost:
1.701.191 1.701.191 2.948.731 2.948.731 4.961.807 4.532.548 4.532.548 4.532.548 4.532.548 4.532.548
Product trucking cost: 213.994 213.994 463.654 463.654 891.643 891.643 891.643 891.643 891.643 891.643
Electrical cost:
374.448 374.448 1.110.822 1.110.822 2.571.050 2.571.050 2.571.050 2.571.050 2.571.050 2.571.050
Hydrogen cost
470.610 470.610 1.411.830 1.411.830 3.294.270 3.294.270 3.294.270 3.294.270 3.294.270 3.294.270
Thermal energy cost:
1.731.682 1.731.682 3.117.027 3.117.027 5.887.718 5.887.718 5.887.718 5.887.718 5.887.718 5.887.718
Catalyst cost
1.648.352 1.648.352 3.571.429 3.571.429 6.868.132 6.868.132 6.868.132 6.868.132 6.868.132 6.868.132
Royalty:
317.808 317.808 688.584 688.584 1.324.200 1.324.200 1.324.200 1.324.200 1.324.200 1.324.200
17.996.546 17.996.546 38.312.077 38.312.077 73.875.743 73.446.484 73.446.484 73.446.484 73.446.484 73.446.484
54% 54% 53% 53% 54% 53% 53% 53% 53% 53%
Fixed cost:
Salaries and wages
722.775 722.775 1.001.625 1.001.625 1.252.425 1.252.425 1.252.425 1.252.425 1.252.425 1.252.425
Maintenance
634.654 634.654 1.154.654 1.154.654 1.870.654 1.870.654 1.870.654 1.870.654 1.870.654 1.870.654
Insurance
118.998 118.998 216.498 216.498 350.748 350.748 350.748 350.748 350.748 350.748
Storage Tank Rental
0 0 0 0 0 0 0 0 0 0
Other fixed cost
395.770 395.770 589.350 589.350 847.960 847.960 847.960 847.960 847.960 847.960
1.872.197 1.872.197 2.962.127 2.962.127 4.321.787 4.321.787 4.321.787 4.321.787 4.321.787 4.321.787
Total costs
19.868.743 19.868.743 41.274.204 41.274.204 78.197.530 77.768.271 77.768.271 77.768.271 77.768.271 77.768.271
6% 6% 4% 4% 3% 3% 3% 3% 3% 3%
EBITDA:
11.912.057 11.912.057 27.584.196 27.584.196 54.222.470 54.651.729 54.651.729 54.651.729 54.651.729 54.651.729
36% 36% 38% 38% 39% 40% 40% 40% 40% 40%
Depreciation
1.502.635 1.502.635 2.733.811 2.733.811 4.429.044 4.429.044 4.429.044 4.429.044 4.429.044 4.429.044
5% 5% 4% 4% 3% 3% 3% 3% 3% 3%
Financial items:
-181.017 41.575 -290.277 281.669 121.177 1.257.300 2.472.217 3.704.387 4.953.904 6.193.365
Profit before tax:
10.228.404 10.450.996 24.560.109 25.132.055 49.914.603 51.479.985 52.694.901 53.927.072 55.176.589 56.416.050
Used deployment cost against taxes/ rapid depreciation
31% 32% 34% 35% 36% 37% 38% 39% 40% 41%
Corporate tax (20%): 20%
511.420 836.080 1.964.809 2.513.205 4.991.460 5.147.998 5.796.439 6.471.249 6.621.191 7.898.247
Profit/loss:
9.716.984 9.614.917 22.595.300 22.618.849 44.923.143 46.331.986 46.898.462 47.455.823 48.555.398 48.517.803
29% 29% 32% 32% 33% 34% 34% 34% 35% 35%

88
Cash flow and equity Equity:
Investment Equity Loan capital
Euro % Euro % Euro
Phase 1 15.866.354 100% 11.899.765 25% 3.966.588 Phase 2 13.000.000 100% 2.600.000 80% 10.400.000 Phase 3 17.900.000 100% 3.580.000 80% 14.320.000
Interest rate:
Euro loans: Libor: 0,17% Premium: 6,00% Total: 6,17%
Euro deposits:
Total: 2,06%
Income:
Estimated length of time of receivables: 2 months 16,67% of the annual income
Cost:
Estimated length of time of payables: 1 months 8,33% of the annual cost
8 years
Year Beginning of 0 1 2 3 4 5 6 7 8 9 10
Loan 1+first year interest
4.227.420
Principal
-528.428 -528.428 -528.428 -528.428 -528.428 -528.428 -528.428 -528.428
Interests: -260.832 -228.228 -195.624 -163.020 -130.416 -97.812 -65.208 -32.604
Loan 2 + first year interest
11.083.875
Principal
-1.385.484 -1.385.484 -1.385.484 -1.385.484 -1.385.484 -1.385.484 -1.385.484 -1.385.484
Interests: -683.875 -598.391 -512.906 -427.422 -341.938 -256.453 -170.969 -85.484
Loan 3 + first year interest
15.261.643
Principal
-1.907.705 -1.907.705 -1.907.705 -1.907.705 -1.907.705 -1.907.705
Interest: -941.643 -823.938 -706.233 -588.527 -470.822 -353.116
* Loans are paid out at the beginning of the year and accrue interest that year.

89
NPV and IRR estimates
0-1 Year 0 Year 1 Year 2 Year 3 Year 4 Year 5 Year 6 Year 7 Year 8 Year 9 Year 10
Revenue:
31.780.800 31.780.800 68.858.400 68.858.400 132.420.000 132.420.000 132.420.000 132.420.000 132.420.000 132.420.000
Operational Cost:
19.868.743 19.868.743 41.274.204 41.274.204 78.197.530 77.768.271 77.768.271 77.768.271 77.768.271 77.768.271
Share capital: 1000000 12.899.765 12.899.765 15.499.765 15.499.765 19.079.765 19.079.765 19.079.765 19.079.765 19.079.765 19.079.765 19.079.765
Investment: -1000000 -15.866.354 -13.000.000 -17.900.000
Loan capital: 3.966.588 10.400.000 14.320.000
Operational Capital Need 100000 100.000
New Equity needed -1000000 -11.799.765 0 -2.600.000 0 -3.580.000 0 0 0 0 0 0
Income:
26.484.000 31.780.800 62.678.800 68.858.400 121.826.400 132.420.000 132.420.000 132.420.000 132.420.000 132.420.000
Operational cost: 900000
-18.213.014 -19.868.743 -39.490.416 -41.274.204 -75.120.586 -77.804.043 -77.768.271 -77.768.271 -77.768.271 -77.768.271
Cash Flow from Operations 900000
8.270.986 11.912.057 23.188.384 27.584.196 46.705.814 54.615.957 54.651.729 54.651.729 54.651.729 54.651.729
Equity Inflow :
-1000000 -11.799.765
-2.600.000
-3.580.000
Principal Payment of loans:
0 -528.428 -528.428 -1.913.912 -1.913.912 -3.821.617 -3.821.617 -3.821.617 -3.821.617 -3.293.190 -3.293.190
Financial items:
0 -181.017 41.575 -290.277 281.669 121.177 1.257.300 2.472.217 3.704.387 4.953.904 6.193.365
Corporate tax: -511.420 -836.080 -1.964.809 -2.513.205 -4.991.460 -5.147.998 -5.796.439 -6.471.249 -6.621.191
Free Cash flow to equity -1000000 -11.799.765 7.561.541 8.313.784 20.148.116 20.407.145 40.492.168 47.060.180 48.154.329 48.738.059 49.841.194 50.930.713
280
IRR 93,2%
NPV 95.347.804 15%
Cash at beginning of period
100.000 100.000 7.661.541 18.575.325 38.723.441 62.710.585 103.202.753 150.262.933 198.417.262 247.155.321 296.996.516
Cast at end of period 100.000 7.661.541 18.575.325 38.723.441 62.710.585 103.202.753 150.262.933 198.417.262 247.155.321 296.996.516 347.927.229
Interest income:
79.815 269.802 589.222 1.043.080 1.706.142 2.606.472 3.585.595 4.581.971 5.595.695 6.631.966
Interest paid on long term loans: -260.832 -228.228 -879.499 -761.411 -1.584.966 -1.349.172 -1.113.378 -877.584 -641.790 -438.601
Finical items - total:
-181.017 41.575 -290.277 281.669 121.177 1.257.300 2.472.217 3.704.387 4.953.904 6.193.365

90
Additional Constructions
Tank construction 2500m3 212.068 €
Sump and sewage system, filling station, fences 95.932 €
Piping to outer harbor 39.426 €
Fire extinguishing system with foam for methanol 93.029 €
Pumping system with a control house 36.439 €
Scada system 37.834 €
Miscellaneous and contingency 85.841 €
Design management 33.764 €
Total 634.332 €
Tank construction 1000m3 84.827 €
Sump and sewage system, filling station, fences 38.373 €
Piping to outer harbor 15.770 €
Fire extinguishing system with foam for methanol 37.212 €
Pumping system with a control house 14.575 €
Scada system 15.134 €
Miscellaneous and contingency 34.336 €
Design management 13.506 €
Total 253.733 €
Tank construction 4000m3 339.308 €
Sump and sewage system, filling station, fences 153.491 €
Piping to outer harbor 63.082 €
Fire extinguishing system with foam for methanol 148.846 €
Pumping system with a control house 58.302 €
Scada system 60.535 €
Miscellaneous and contingency 137.345 €
Design management 54.022 €
Total 1.014.931 €
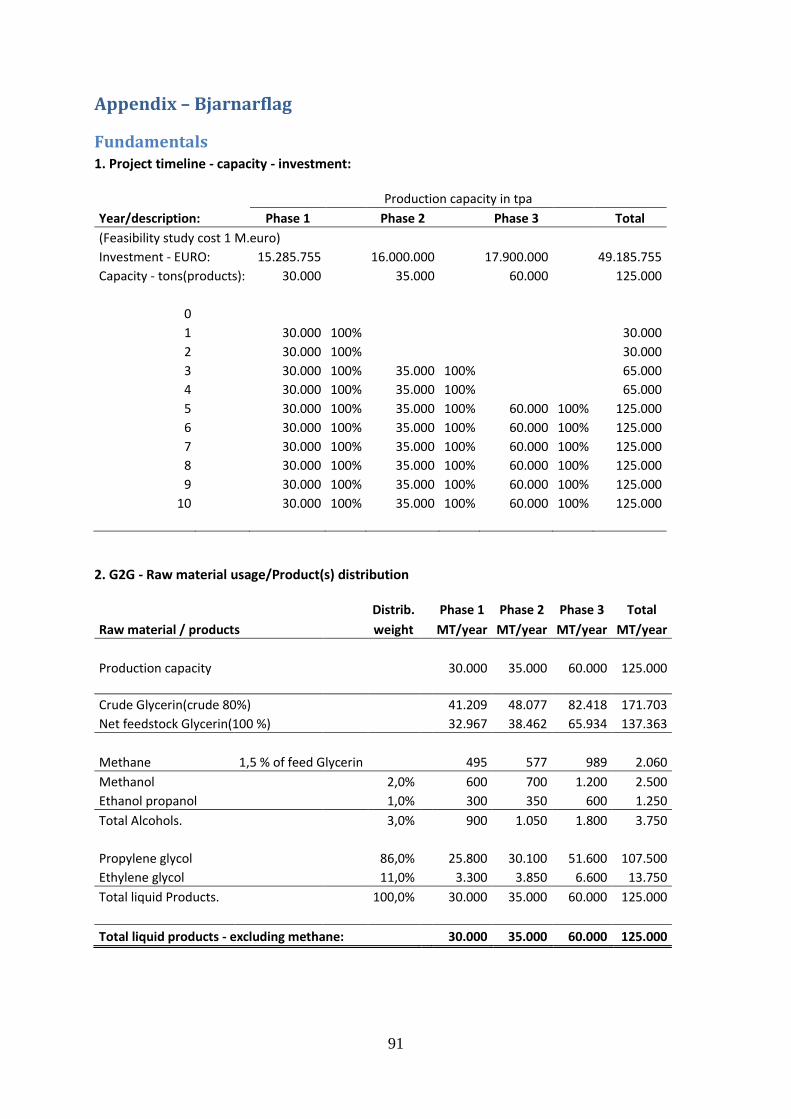
91
Appendix – Bjarnarflag
Fundamentals 1. Project timeline - capacity - investment:
Production capacity in tpa
Year/description: Phase 1 Phase 2 Phase 3 Total
(Feasibility study cost 1 M.euro) Investment - EURO: 15.285.755
16.000.000
17.900.000
49.185.755
Capacity - tons(products): 30.000
35.000
60.000
125.000
0 1
30.000 100%
30.000
2
30.000 100%
30.000
3
30.000 100% 35.000 100%
65.000
4
30.000 100% 35.000 100%
65.000
5
30.000 100% 35.000 100% 60.000 100% 125.000
6
30.000 100% 35.000 100% 60.000 100% 125.000
7
30.000 100% 35.000 100% 60.000 100% 125.000
8
30.000 100% 35.000 100% 60.000 100% 125.000
9
30.000 100% 35.000 100% 60.000 100% 125.000
10
30.000 100% 35.000 100% 60.000 100% 125.000
2. G2G - Raw material usage/Product(s) distribution
Distrib.
Phase 1 Phase 2 Phase 3 Total
Raw material / products weight MT/year MT/year MT/year MT/year
Production capacity
30.000 35.000 60.000 125.000
Crude Glycerin(crude 80%) 41.209 48.077 82.418 171.703
Net feedstock Glycerin(100 %) 32.967 38.462 65.934 137.363
Methane 1,5 % of feed Glycerin 495 577 989 2.060
Methanol
2,0%
600 700 1.200 2.500
Ethanol propanol 1,0% 300 350 600 1.250
Total Alcohols.
3,0%
900 1.050 1.800 3.750
Propylene glycol
86,0%
25.800 30.100 51.600 107.500
Ethylene glycol 11,0% 3.300 3.850 6.600 13.750
Total liquid Products.
100,0%
30.000 35.000 60.000 125.000
Total liquid products - excluding methane: 30.000 35.000 60.000 125.000

92
3. Estimated product price and raw material price - based on prices in September 2011.
Euro/ton
Chemicals: Price Tons/a Phase 1 Phase 2 Phase 3 Total
Total value in Euro
Raw materials Crude Glycerin (80 %), ex factory 280 NW-Europe 11.538.462 13.461.538 23.076.923 48.076.923
Glycols
Propylene glycol
1.150 NW-Europe 29.670.000 34.615.000 59.340.000 123.625.000
Ethylene glycol 850 NW-Europe 2.805.000 3.272.500 5.610.000 11.687.500
1.210 1083 32.475.000 37.887.500 64.950.000 135.312.500
Alcohols
Ethanol
700 NW-Europe 210.000 245.000 420.000 875.000
Methanol 700 NW-Europe 420.000 490.000 840.000 1.750.000
700
630.000 735.000 1.260.000 2.625.000
Gas
Methane (0,714 kg/Nm3) 400 NW-Europe 197.802 230.769 395.604 824.176
Total - without methane: 33.105.000 38.622.500 66.210.000 137.937.500
Total - average price pr MT
1.104 1.104 1.104 1.104
Total revenue - with methane 33.302.802 38.853.269 66.605.604 138.761.676
4. Freight cost - logistics:
Description Euro/MT
NW-Europe-Iceland, liquid cargo
25
Sea freight is very sensi- Trucking - factory to harbor - liquid cargo 7,42
tive to size. 15 Euro/MT
Trucking & Storage factory to depot - alcohols 16,5
for 15.000 t lots and
Piping- factory to depot - methane 40 50 Euro/MT for 1.250 t lots.
5. Currency rates (ISK to) used in this feasibility study:
USD
116,0
EUR
159,0
GBP
183,0
NKR
21,00
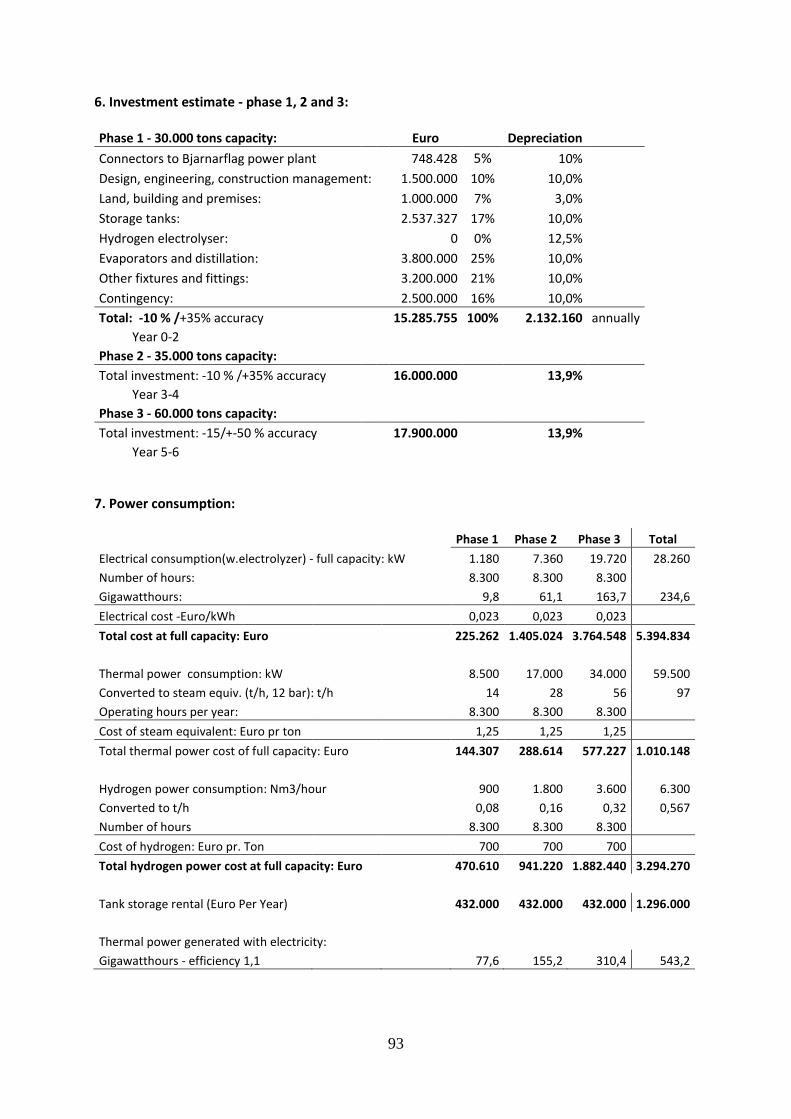
93
6. Investment estimate - phase 1, 2 and 3:
Phase 1 - 30.000 tons capacity: Euro Depreciation
Connectors to Bjarnarflag power plant
748.428 5% 10% Design, engineering, construction management:
1.500.000 10% 10,0%
Land, building and premises:
1.000.000 7% 3,0% Storage tanks:
2.537.327 17% 10,0%
Hydrogen electrolyser:
0 0% 12,5% Evaporators and distillation:
3.800.000 25% 10,0%
Other fixtures and fittings:
3.200.000 21% 10,0% Contingency: 2.500.000 16% 10,0%
Total: -10 % /+35% accuracy
15.285.755 100% 2.132.160 annually
Year 0-2
Phase 2 - 35.000 tons capacity:
Total investment: -10 % /+35% accuracy
16.000.000
13,9%
Year 3-4
Phase 3 - 60.000 tons capacity:
Total investment: -15/+-50 % accuracy
17.900.000
13,9%
Year 5-6
7. Power consumption:
Phase 1 Phase 2 Phase 3 Total
Electrical consumption(w.electrolyzer) - full capacity: kW 1.180 7.360 19.720 28.260
Number of hours:
8.300 8.300 8.300
Gigawatthours: 9,8 61,1 163,7 234,6
Electrical cost -Euro/kWh 0,023 0,023 0,023
Total cost at full capacity: Euro
225.262 1.405.024 3.764.548 5.394.834
Thermal power consumption: kW
8.500 17.000 34.000 59.500
Converted to steam equiv. (t/h, 12 bar): t/h
14 28 56 97
Operating hours per year: 8.300 8.300 8.300
Cost of steam equivalent: Euro pr ton 1,25 1,25 1,25
Total thermal power cost of full capacity: Euro
144.307 288.614 577.227 1.010.148
Hydrogen power consumption: Nm3/hour
900 1.800 3.600 6.300
Converted to t/h
0,08 0,16 0,32 0,567
Number of hours
8.300 8.300 8.300
Cost of hydrogen: Euro pr. Ton 700 700 700
Total hydrogen power cost at full capacity: Euro
470.610 941.220 1.882.440 3.294.270
Tank storage rental (Euro Per Year)
432.000 432.000 432.000 1.296.000
Thermal power generated with electricity: Gigawatthours - efficiency 1,1 77,6 155,2 310,4 543,2

94
8. Employment - phase 1 + additional workers for expanding to phase 2 and 3:
Unit cost Phase 1 Phase 2 Phase 3
Description pr year Number Euro Number Euro Number Euro
Mgn. Director 58.125 1 58.125 Production Dir. 55.350 1 55.350 Laboratory Dir. 49.050 1 49.050 Line staff
24.900 12 298.800 4 99.600 4 99.600
Maintenance 41.250 2 82.500 1 41.250 2 82.500
Quality assurance 40.950 2 81.900 1 40.950 1 40.950
Office workers 41.550 1 41.550 1 41.550
0
Various 27.750 2 55.500 2 55.500 1 27.750
Total:
22 722.775 9 278.850 8 250.800
Phase 2 - total staff and cost: 31 1.001.625
Phase 3 - total staff and cost: 39 1.252.425
9. Marketing cost, license fee and cost of catalyst:
Description
Phase 1 Phase 2 Phase 3 Total
Marketing cost: 4,0% of sales:
1.332.112 1.554.131 2.664.224 5.412.500
Royalty: 1% of sales 1% Euro per t product.: 331.050 386.225 662.100 1.379.375
Catalyst cost 40 Euro per t product.: 1.200.000 1.400.000 2.400.000 5.000.000
10. Various fixed cost:
Phase 1 Phase 2 Phase 3 Total
Maintenance: 4,0% of investment: 611.430 640.000 716.000 1.967.430
Insurance:
0,75% of investment: 114.643 120.000 134.250 368.893
Travels - staff: 7000 Euro per person 28.000 7.000 7.000 42.000
Telephone: 400 Euro per person 8.800 3.600 3.200 15.600
IT system:
1700 Euro per person 37.400 15.300 13.600 66.300
Security:
estimate
60.000 15.000 15.000 90.000
Auditing and consulting:
estimate
70.000 17.500 35.000 122.500
Various cost: estimate 186.055 163.680 184.810 534.545
Total - various fixed cost:
1.116.328 982.080 1.108.860 3.207.268
Percentage of total sales:
3,4% 2,5% 1,7% 2,3%
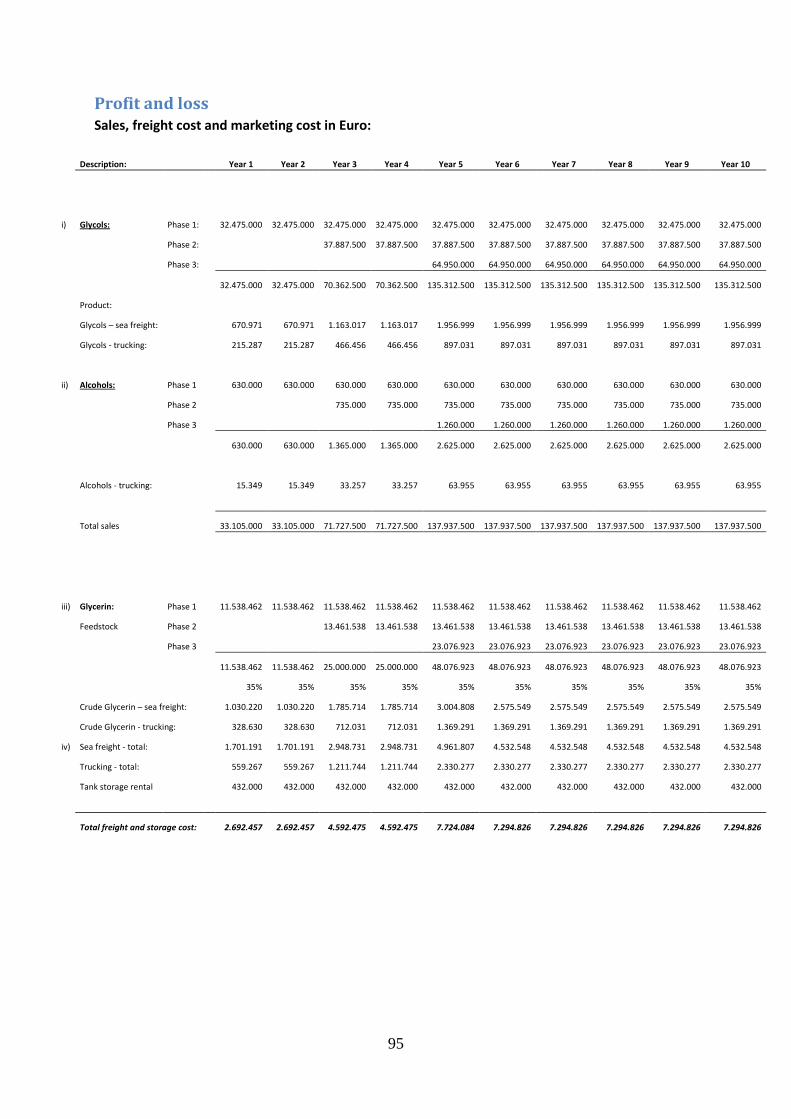
95
Profit and loss Sales, freight cost and marketing cost in Euro:
Description: Year 1 Year 2 Year 3 Year 4 Year 5 Year 6 Year 7 Year 8 Year 9 Year 10
i) Glycols: Phase 1:
32.475.000 32.475.000 32.475.000 32.475.000 32.475.000 32.475.000 32.475.000 32.475.000 32.475.000 32.475.000
Phase 2:
37.887.500 37.887.500 37.887.500 37.887.500 37.887.500 37.887.500 37.887.500 37.887.500
Phase 3:
64.950.000 64.950.000 64.950.000 64.950.000 64.950.000 64.950.000
32.475.000 32.475.000 70.362.500 70.362.500 135.312.500 135.312.500 135.312.500 135.312.500 135.312.500 135.312.500
Product:
Glycols – sea freight:
670.971 670.971 1.163.017 1.163.017 1.956.999 1.956.999 1.956.999 1.956.999 1.956.999 1.956.999
Glycols - trucking:
215.287 215.287 466.456 466.456 897.031 897.031 897.031 897.031 897.031 897.031
ii) Alcohols: Phase 1
630.000 630.000 630.000 630.000 630.000 630.000 630.000 630.000 630.000 630.000
Phase 2
735.000 735.000 735.000 735.000 735.000 735.000 735.000 735.000
Phase 3
1.260.000 1.260.000 1.260.000 1.260.000 1.260.000 1.260.000
630.000 630.000 1.365.000 1.365.000 2.625.000 2.625.000 2.625.000 2.625.000 2.625.000 2.625.000
Alcohols - trucking:
15.349 15.349 33.257 33.257 63.955 63.955 63.955 63.955 63.955 63.955
Total sales
33.105.000 33.105.000 71.727.500 71.727.500 137.937.500 137.937.500 137.937.500 137.937.500 137.937.500 137.937.500
iii) Glycerin: Phase 1
11.538.462 11.538.462 11.538.462 11.538.462 11.538.462 11.538.462 11.538.462 11.538.462 11.538.462 11.538.462
Feedstock Phase 2
13.461.538 13.461.538 13.461.538 13.461.538 13.461.538 13.461.538 13.461.538 13.461.538
Phase 3
23.076.923 23.076.923 23.076.923 23.076.923 23.076.923 23.076.923
11.538.462 11.538.462 25.000.000 25.000.000 48.076.923 48.076.923 48.076.923 48.076.923 48.076.923 48.076.923
35% 35% 35% 35% 35% 35% 35% 35% 35% 35%
Crude Glycerin – sea freight:
1.030.220 1.030.220 1.785.714 1.785.714 3.004.808 2.575.549 2.575.549 2.575.549 2.575.549 2.575.549
Crude Glycerin - trucking:
328.630 328.630 712.031 712.031 1.369.291 1.369.291 1.369.291 1.369.291 1.369.291 1.369.291
iv) Sea freight - total:
1.701.191 1.701.191 2.948.731 2.948.731 4.961.807 4.532.548 4.532.548 4.532.548 4.532.548 4.532.548
Trucking - total:
559.267 559.267 1.211.744 1.211.744 2.330.277 2.330.277 2.330.277 2.330.277 2.330.277 2.330.277
Tank storage rental
432.000 432.000 432.000 432.000 432.000 432.000 432.000 432.000 432.000 432.000
Total freight and storage cost:
2.692.457 2.692.457 4.592.475 4.592.475 7.724.084 7.294.826 7.294.826 7.294.826 7.294.826 7.294.826

96
Energy cost
v) Electricity:
Phase 1 225.262 225.262 225.262 225.262 225.262 225.262 225.262 225.262 225.262 225.262
Phase 2
1.405.024 1.405.024 1.405.024 1.405.024 1.405.024 1.405.024 1.405.024 1.405.024
Phase 3 3.764.548 3.764.548 3.764.548 3.764.548 3.764.548 3.764.548
225.262 225.262 1.630.286 1.630.286 5.394.834 5.394.834 5.394.834 5.394.834 5.394.834 5.394.834
vi) Thermal energy:
Phase 1 144.307 144.307 144.307 144.307 144.307 144.307 144.307 144.307 144.307 144.307
Phase 2
288.614 288.614 288.614 288.614 288.614 288.614 288.614 288.614
Phase 3 577.227 577.227 577.227 577.227 577.227 577.227
144.307 144.307 432.920 432.920 1.010.148 1.010.148 1.010.148 1.010.148 1.010.148 1.010.148
vii) Hydrogen energy:
Phase 1 470.610 470.610 470.610 470.610 470.610 470.610 470.610 470.610 470.610 470.610
Phase 2
941.220 941.220 941.220 941.220 941.220 941.220 941.220 941.220
Phase 3 1.882.440 1.882.440 1.882.440 1.882.440 1.882.440 1.882.440
470.610 470.610 1.411.830 1.411.830 3.294.270 3.294.270 3.294.270 3.294.270 3.294.270 3.294.270
viii) Total energy cost:
840.179 840.179 3.475.036 3.475.036 9.699.252 9.699.252 9.699.252 9.699.252 9.699.252 9.699.252
Proportion of sales:
3% 3% 5% 5% 7% 7% 7% 7% 7% 7%
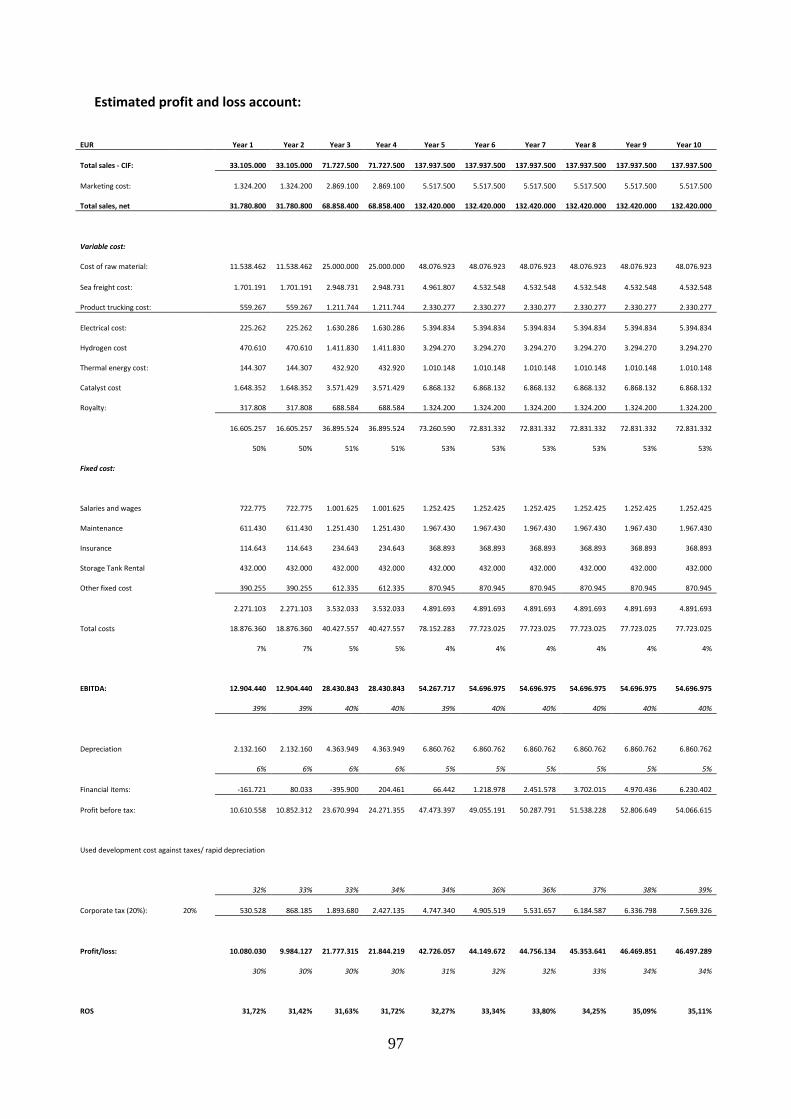
97
Estimated profit and loss account:
EUR Year 1 Year 2 Year 3 Year 4 Year 5 Year 6 Year 7 Year 8 Year 9 Year 10
Total sales - CIF:
33.105.000 33.105.000 71.727.500 71.727.500 137.937.500 137.937.500 137.937.500 137.937.500 137.937.500 137.937.500
Marketing cost:
1.324.200 1.324.200 2.869.100 2.869.100 5.517.500 5.517.500 5.517.500 5.517.500 5.517.500 5.517.500
Total sales, net 31.780.800 31.780.800 68.858.400 68.858.400 132.420.000 132.420.000 132.420.000 132.420.000 132.420.000 132.420.000
Variable cost:
Cost of raw material:
11.538.462 11.538.462 25.000.000 25.000.000 48.076.923 48.076.923 48.076.923 48.076.923 48.076.923 48.076.923
Sea freight cost:
1.701.191 1.701.191 2.948.731 2.948.731 4.961.807 4.532.548 4.532.548 4.532.548 4.532.548 4.532.548
Product trucking cost: 559.267 559.267 1.211.744 1.211.744 2.330.277 2.330.277 2.330.277 2.330.277 2.330.277 2.330.277
Electrical cost:
225.262 225.262 1.630.286 1.630.286 5.394.834 5.394.834 5.394.834 5.394.834 5.394.834 5.394.834
Hydrogen cost
470.610 470.610 1.411.830 1.411.830 3.294.270 3.294.270 3.294.270 3.294.270 3.294.270 3.294.270
Thermal energy cost:
144.307 144.307 432.920 432.920 1.010.148 1.010.148 1.010.148 1.010.148 1.010.148 1.010.148
Catalyst cost
1.648.352 1.648.352 3.571.429 3.571.429 6.868.132 6.868.132 6.868.132 6.868.132 6.868.132 6.868.132
Royalty:
317.808 317.808 688.584 688.584 1.324.200 1.324.200 1.324.200 1.324.200 1.324.200 1.324.200
16.605.257 16.605.257 36.895.524 36.895.524 73.260.590 72.831.332 72.831.332 72.831.332 72.831.332 72.831.332
50% 50% 51% 51% 53% 53% 53% 53% 53% 53%
Fixed cost:
Salaries and wages
722.775 722.775 1.001.625 1.001.625 1.252.425 1.252.425 1.252.425 1.252.425 1.252.425 1.252.425
Maintenance
611.430 611.430 1.251.430 1.251.430 1.967.430 1.967.430 1.967.430 1.967.430 1.967.430 1.967.430
Insurance
114.643 114.643 234.643 234.643 368.893 368.893 368.893 368.893 368.893 368.893
Storage Tank Rental
432.000 432.000 432.000 432.000 432.000 432.000 432.000 432.000 432.000 432.000
Other fixed cost
390.255 390.255 612.335 612.335 870.945 870.945 870.945 870.945 870.945 870.945
2.271.103 2.271.103 3.532.033 3.532.033 4.891.693 4.891.693 4.891.693 4.891.693 4.891.693 4.891.693
Total costs
18.876.360 18.876.360 40.427.557 40.427.557 78.152.283 77.723.025 77.723.025 77.723.025 77.723.025 77.723.025
7% 7% 5% 5% 4% 4% 4% 4% 4% 4%
EBITDA:
12.904.440 12.904.440 28.430.843 28.430.843 54.267.717 54.696.975 54.696.975 54.696.975 54.696.975 54.696.975
39% 39% 40% 40% 39% 40% 40% 40% 40% 40%
Depreciation
2.132.160 2.132.160 4.363.949 4.363.949 6.860.762 6.860.762 6.860.762 6.860.762 6.860.762 6.860.762
6% 6% 6% 6% 5% 5% 5% 5% 5% 5%
Financial items:
-161.721 80.033 -395.900 204.461 66.442 1.218.978 2.451.578 3.702.015 4.970.436 6.230.402
Profit before tax:
10.610.558 10.852.312 23.670.994 24.271.355 47.473.397 49.055.191 50.287.791 51.538.228 52.806.649 54.066.615
Used development cost against taxes/ rapid depreciation
32% 33% 33% 34% 34% 36% 36% 37% 38% 39%
Corporate tax (20%): 20%
530.528 868.185 1.893.680 2.427.135 4.747.340 4.905.519 5.531.657 6.184.587 6.336.798 7.569.326
Profit/loss:
10.080.030 9.984.127 21.777.315 21.844.219 42.726.057 44.149.672 44.756.134 45.353.641 46.469.851 46.497.289
30% 30% 30% 30% 31% 32% 32% 33% 34% 34%
ROS
31,72% 31,42% 31,63% 31,72% 32,27% 33,34% 33,80% 34,25% 35,09% 35,11%

98
Cash flow and equity Equity:
Investment Equity Loan capital
Euro % Euro % Euro
Phase 1 15.285.755 100% 11.464.316 25% 3.821.439 Phase 2 16.000.000 100% 3.200.000 80% 12.800.000 Phase 3 17.900.000 100% 3.580.000 80% 14.320.000
Interest rate:
Euro loans: Libor: 0,17% Premium: 6,00% Total: 6,17%
Euro deposits:
Total: 2,06%
Income:
Estimated length of time of receivables: 2 months 16,67% of the annual income
Cost:
Estimated length of time of payables: 1 months 8,33% of the annual cost
8 years
Year Beginning of 0 1 2 3 4 5 6 7 8 9 10
Loan 1+first year interest
4.072.726
Principal
-509.091 -509.091 -509.091 -509.091 -509.091 -509.091 -509.091 -509.091
Interests: -251.287 -219.876 -188.465 -157.054 -125.644 -94.233 -62.822 -31.411
Loan 2 + first year interest
13.641.692
Principal
-1.705.212 -1.705.212 -1.705.212 -1.705.212 -1.705.212 -1.705.212 -1.705.212 -1.705.212
Interests: -841.692 -736.481 -631.269 -526.058 -420.846 -315.635 -210.423 -105.212
Loan 3 + first year interest
15.261.643
Principal
-1.907.705 -1.907.705 -1.907.705 -1.907.705 -1.907.705 -1.907.705
Interest: -941.643 -823.938 -706.233 -588.527 -470.822 -353.116
* Loans are paid out at the beginning of the year and accrue interest that year.

99
NPV and IRR estimates
0-1 Year 0 Year 1 Year 2 Year 3 Year 4 Year 5 Year 6 Year 7 Year 8 Year 9 Year 10
Revenue:
31.780.800 31.780.800 68.858.400 68.858.400 132.420.000 132.420.000 132.420.000 132.420.000 132.420.000 132.420.000
Operational Cost:
18.876.360 18.876.360 40.427.557 40.427.557 78.152.283 77.723.025 77.723.025 77.723.025 77.723.025 77.723.025
Share capital: 1000000 12.464.316 12.464.316 15.664.316 15.664.316 19.244.316 19.244.316 19.244.316 19.244.316 19.244.316 19.244.316 19.244.316
Investment: -1000000 -15.285.755 -16.000.000 -17.900.000
Loan capital: 3.821.439 12.800.000 14.320.000
Operational Capital Need 100000 100.000
New Equity needed -1000000 -11.364.316 0 -3.200.000 0 -3.580.000 0 0 0 0 0 0
Income:
26.484.000 31.780.800 62.678.800 68.858.400 121.826.400 132.420.000 132.420.000 132.420.000 132.420.000 132.420.000
Operational cost: 900000
-17.303.330 -18.876.360 -38.631.624 -40.427.557 -75.008.556 -77.758.797 -77.723.025 -77.723.025 -77.723.025 -77.723.025
Cash Flow form Operations 900000
9.180.670 12.904.440 24.047.176 28.430.843 46.817.844 54.661.203 54.696.975 54.696.975 54.696.975 54.696.975
Equity Inflow :
-1000000 -11.364.316
-3.200.000
-3.580.000
Principal Payment of loans:
0 -509.091 -509.091 -2.214.302 -2.214.302 -4.122.008 -4.122.008 -4.122.008 -4.122.008 -3.612.917 -3.612.917
Financial items:
0 -161.721 80.033 -395.900 204.461 66.442 1.218.978 2.451.578 3.702.015 4.970.436 6.230.402
Corporate tax: -530.528 -868.185 -1.893.680 -2.427.135 -4.747.340 -4.905.519 -5.531.657 -6.184.587 -6.336.798
Free Cash flow to equity -1000000 -11.364.316 8.509.858 8.744.854 20.568.789 20.947.322 40.335.143 47.010.834 48.121.026 48.745.325 49.869.907 50.977.662
280
IRR 98,4%
NPV 96.921.861 15%
Cash at beginning of period
100.000 100.000 8.609.858 20.554.712 41.123.500 65.650.822 105.985.965 152.996.798 201.117.824 249.863.149 299.733.056
Cast at end of period 100.000 8.609.858 20.554.712 41.123.500 65.650.822 105.985.965 152.996.798 201.117.824 249.863.149 299.733.056 350.710.718
Interest income:
89.566 299.909 634.258 1.097.996 1.764.998 2.663.206 3.641.479 4.637.588 5.651.681 6.688.730
Interest paid on long term loans: -251.287 -219.876 -1.030.158 -893.535 -1.698.556 -1.444.228 -1.189.901 -935.573 -681.245 -458.328
Financial items - total:
-161.721 80.033 -395.900 204.461 66.442 1.218.978 2.451.578 3.702.015 4.970.436 6.230.402

100
Appendix - Djúpivogur
Fundamentals
1) Project timeline - capacity - investment:
Production capacity in tpa
Year/description: Phase 1 Phase 2 Phase 3 Total
(Feasibility study cost 1 M.euro) Investment - EURO:
18.105.771
15.000.000
21.900.000
55.005.771
Capacity - tons(products): 30.000
35.000
60.000
125.000
0 1
30.000 100%
30.000
2
30.000 100%
30.000
3
30.000 100% 35.000 100%
65.000
4
30.000 100% 35.000 100%
65.000
5
30.000 100% 35.000 100% 60.000 100% 125.000
6
30.000 100% 35.000 100% 60.000 100% 125.000
7
30.000 100% 35.000 100% 60.000 100% 125.000
8
30.000 100% 35.000 100% 60.000 100% 125.000
9
30.000 100% 35.000 100% 60.000 100% 125.000
10
30.000 100% 35.000 100% 60.000 100% 125.000
2) G2G - Raw material usage/Product(s) distribution
Distrib.
Phase 1 Phase 2 Phase 3 Total
Raw material / products weight MT/year MT/year MT/year MT/year
Production capacity
30.000 35.000 60.000 125.000
Crude Glycerin (crude 80%) 41.209 48.077 82.418 171.703
Net feedstock Glycerin (100 %) 32.967 38.462 65.934 137.363
Methane 1,5 % of feed Glycerin 495 577 989 2.060
Methanol
2,0%
600 700 1.200 2.500
Ethanol propanol 1,0% 300 350 600 1.250
Total Alcohols.
3,0%
900 1.050 1.800 3.750
Propylene glycol
86,0%
25.800 30.100 51.600 107.500
Ethylene glycol 11,0% 3.300 3.850 6.600 13.750
Total liquid Products.
100,0%
30.000 35.000 60.000 125.000
Total liquid products - excluding methane: 30.000 35.000 60.000 125.000

101
3) Estimated product price and raw material price - based on prices in September 2010.
Euro/ton
Chemicals: NW-Europe Price Phase 1 Phase 2 Phase 3 Total
Total value in Euro
Raw materials Crude Glycerin (80 %), ex-factory 280 11.538.462 13.461.538 23.076.923 48.076.923
Glycols
Propylene glycol
1.150
29.670.000 34.615.000 59.340.000 123.625.000
Ethylene glycol 850 2.805.000 3.272.500 5.610.000 11.687.500
1083
1.210
32.475.000 37.887.500 64.950.000 135.312.500
Alcohols
Ethanol
700
210.000 245.000 420.000 875.000
Methanol 700 420.000 490.000 840.000 1.750.000
700
630.000 735.000 1.260.000 2.625.000
Gas
Methane (0,714 kg/Nm3) 400 197.802 230.769 395.604 824.176
Total - without methane: 33.105.000 38.622.500 66.210.000 137.937.500
Total - average price pr MT
1.104 1.104 1.104 1.104
Total revenue - with methane 33.302.802 38.853.269 66.605.604 138.761.676
4) Freight cost - logistics:
Description Euro/MT
NW-Europe-Iceland, liquid cargo
25
Sea freight is very sensi- Trucking - factory to harbor - liquid cargo
7,19
tive to size. 15 Euro/MT
Trucking & Storage factory to depot - alcohols
16,5
for 15.000 t lots and
Piping- factory to depot - methane 40 50 Euro/MT for 1.250 t lots.
5) Currency rates (ISK to :)
USD
116
EUR
159
GBP
183
NKR
21

102
6) Investment estimate - phase 1, 2 and 3:
Phase 1 - 30.000 tons capacity: Euro Depreciation
Steam boiler
2.188.679 12% 10,0% Connector to Landsnet
748.428 4% 10,0%
Design, engineering, construction management:
1.000.000 6% 10,0% Land, building and premises:
400.000 2% 3,0%
Storage tanks:
1.268.664 7% 10,0% Hydrogen electrolyser:
3.000.000 17% 12,5%
Evaporators and distillation:
3.800.000 21% 10,0% Other fixtures and fittings:
3.200.000 18% 10,0%
Contingency: 2.500.000 14% 10,0%
Total: -10 % /+35% accuracy
18.105.771 100% 1.857.577 annually
Year 0-2
Phase 2 - 35.000 tons capacity:
Total investment: -10 % /+35% accuracy
15.000.000
10,3%
Year 3-4
Phase 3 - 60.000 tons capacity:
Total investment: -15/+-50 % accuracy
21.900.000
10,3%
7) Power consumption:
Phase 1 Phase 2 Phase 3 Total
Transmission cost
330.968 455.781 872.533 1.659.283 Electrical consumption(w.electrolyzer) - full capacity: kW
6.180 12.360 24.720 43.260
Number of hours:
8.300 8.300 8.300
Gigawatthours: 51,3 102,6 205,2 359,1
Electrical cost -Euro/kWh 0,02 0,02 0,02
Total cost at full capacity: Euro
1.510.730
2.815.305
5.591.581 9.917.617
Thermal power consumption: kW
8.500 17.000 34.000 59.500
Converted to steam equiv. (t/h, 12 bar): t/h
14 28 56 97
Operating hours per year: 8.300 8.300 8.300
Cost of steam equivalent: Euro pr ton 15 15 15
Total thermal power cost at full capacity: Euro
1.731.682
3.463.364
6.926.727
12.121.773
Tank storage rental (Euro Per Year)
200.000 400.000 600.000 1.200.000
Thermal power generated with electricity:
Gigawatthours - efficiency 1,1 77,6 155,2 310,4 543,2

103
8) Employment - phase 1 + additional workers for expanding to phase 2 and 3:
Unit cost Phase 1 Phase 2 Phase 3
Description pr year Number Euro Number Euro Number Euro
Mgn. Director
58.125 1 58.125 Production Dir.
55.350 1 55.350
Laboratory Dir.
49.050 1 49.050 Line staff
24.900 12 298.800 4 99.600 4 99.600
Maintenance
41.250 2 82.500 1 41.250 2 82.500 Quality assurance
40.950 2 81.900 1 40.950 1 40.950
Office workers
41.550 1 41.550 1 41.550
0
Various 27.750 2 55.500 2 55.500 1 27.750
Total:
22 722.775 9 278.850 8 250.800
Phase 2 - total staff and cost: 31 1.001.625
Phase 3 - total staff and cost: 39 1.252.425
9) Marketing cost, license fee and cost of catalyst:
Description
Phase 1 Phase 2 Phase 3 Total
Marketing cost:
4,0% of sales:
1.332.112 1.554.131 2.664.224 5.412.500
Royalty: 1% of sales
1% Euro per t product.: 331.050 386.225 662.100 1.379.375
Catalyst cost
40 Euro per t product.: 1.200.000 1.400.000 2.400.000 5.000.000
10) Various fixed cost:
Phase 1 Phase 2 Phase 3 Total
Maintenance:
4,0% of investment: 724.231 600.000 876.000 2.200.231
Insurance:
0,75% of investment: 135.793 112.500 164.250 412.543
Travels - staff:
7000 Euro per person 28.000 7.000 7.000 42.000
Telephone:
400 Euro per person 8.800 3.600 3.200 15.600
IT system:
1700 Euro per person 37.400 15.300 13.600 66.300
Security:
estimate
60.000 15.000 15.000 90.000
Auditing and consulting:
estimate
70.000 17.500 35.000 122.500
Various cost: estimate 212.845 154.180 222.810 589.835
Total - various fixed cost:
1.277.069 925.080 1.336.860 3.539.009
Percentage of total sales:
3,8% 2,4% 2,0% 2,6%
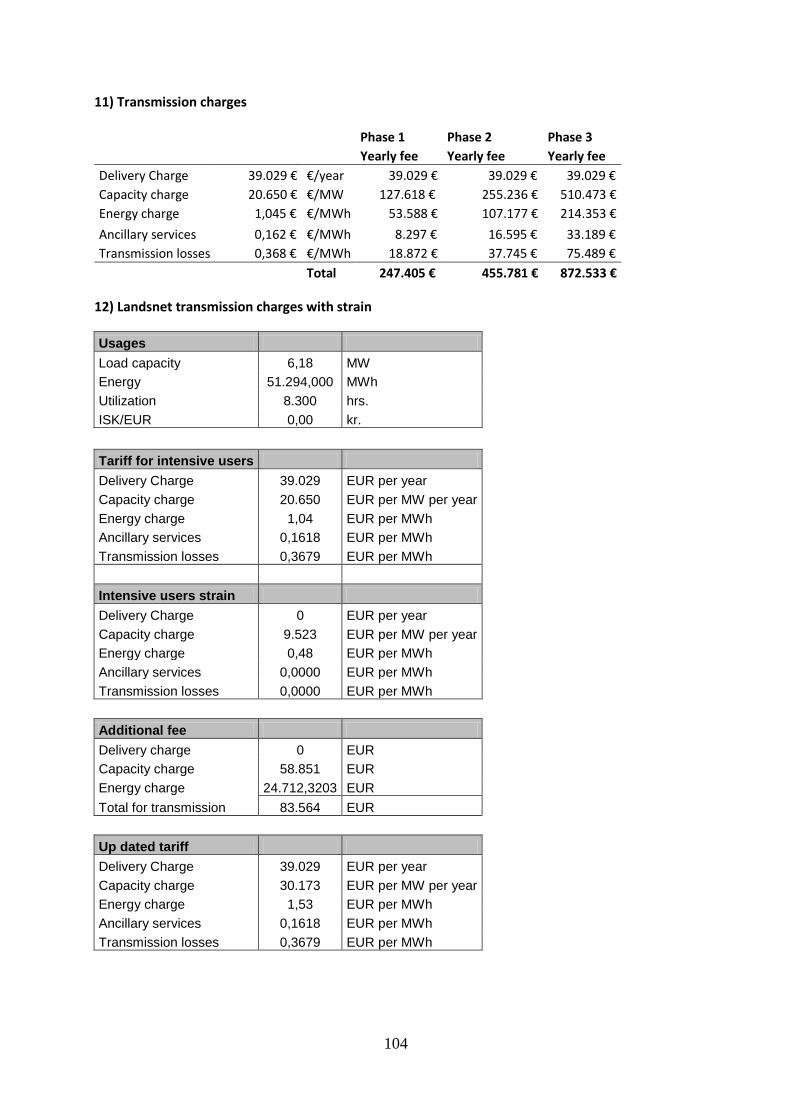
104
11) Transmission charges
Phase 1 Phase 2 Phase 3
Yearly fee Yearly fee Yearly fee
Delivery Charge 39.029 € €/year 39.029 € 39.029 € 39.029 €
Capacity charge 20.650 € €/MW 127.618 € 255.236 € 510.473 €
Energy charge 1,045 € €/MWh 53.588 € 107.177 € 214.353 €
Ancillary services 0,162 € €/MWh 8.297 € 16.595 € 33.189 €
Transmission losses 0,368 € €/MWh 18.872 € 37.745 € 75.489 €
Total 247.405 € 455.781 € 872.533 €
12) Landsnet transmission charges with strain
Usages
Load capacity 6,18 MW
Energy 51.294,000 MWh
Utilization 8.300 hrs.
ISK/EUR 0,00 kr.
Tariff for intensive users
Delivery Charge 39.029 EUR per year
Capacity charge 20.650 EUR per MW per year
Energy charge 1,04 EUR per MWh
Ancillary services 0,1618 EUR per MWh
Transmission losses 0,3679 EUR per MWh
Intensive users strain
Delivery Charge 0 EUR per year
Capacity charge 9.523 EUR per MW per year
Energy charge 0,48 EUR per MWh
Ancillary services 0,0000 EUR per MWh
Transmission losses 0,0000 EUR per MWh
Additional fee
Delivery charge 0 EUR
Capacity charge 58.851 EUR
Energy charge 24.712,3203 EUR
Total for transmission 83.564 EUR
Up dated tariff
Delivery Charge 39.029 EUR per year
Capacity charge 30.173 EUR per MW per year
Energy charge 1,53 EUR per MWh
Ancillary services 0,1618 EUR per MWh
Transmission losses 0,3679 EUR per MWh

105
Total tariff
Delivery charge 39.029 EUR
Capacity charge 186.469 EUR
Energy charge 78.301 EUR
Ancillary services 8.297 EUR
Transmission losses 18.872 EUR
Total for transmission 330.968 EUR
Profit and Loss
Sales, freight cost and marketing cost in EUR:
Description: Year 1 Year 2 Year 3 Year 4 Year 5 Year 6 Year 7 Year 8 Year 9 Year 10
i) Glycols: Phase 1:
32.475.000 32.475.000 32.475.000 32.475.000 32.475.000 32.475.000 32.475.000 32.475.000 32.475.000 32.475.000
Phase 2:
37.887.500 37.887.500 37.887.500 37.887.500 37.887.500 37.887.500 37.887.500 37.887.500
Phase 3:
64.950.000 64.950.000 64.950.000 64.950.000 64.950.000 64.950.000
32.475.000 32.475.000 70.362.500 70.362.500 135.312.500 135.312.500 135.312.500 135.312.500 135.312.500 135.312.500
Product:
Glycols – sea freight:
670.971 670.971 1.163.017 1.163.017 1.956.999 1.956.999 1.956.999 1.956.999 1.956.999 1.956.999
Glycols - trucking:
192.971 192.971 418.104 418.104 804.047 804.047 804.047 804.047 804.047 804.047
ii) Alcohols: Phase 1
630.000 630.000 630.000 630.000 630.000 630.000 630.000 630.000 630.000 630.000
Phase 2
735.000 735.000 735.000 735.000 735.000 735.000 735.000 735.000
Phase 3
1.260.000 1.260.000 1.260.000 1.260.000 1.260.000 1.260.000
630.000 630.000 1.365.000 1.365.000 2.625.000 2.625.000 2.625.000 2.625.000 2.625.000 2.625.000
Alcohols - trucking:
14.850 14.850 32.175 32.175 61.875 61.875 61.875 61.875 61.875 61.875
Total sales
33.105.000 33.105.000 71.727.500 71.727.500 137.937.500 137.937.500 137.937.500 137.937.500 137.937.500 137.937.500
iii) Glycerin: Phase 1
11.538.462 11.538.462 11.538.462 11.538.462 11.538.462 11.538.462 11.538.462 11.538.462 11.538.462 11.538.462
Feedstock Phase 2
13.461.538 13.461.538 13.461.538 13.461.538 13.461.538 13.461.538 13.461.538 13.461.538
Phase 3
23.076.923 23.076.923 23.076.923 23.076.923 23.076.923 23.076.923
11.538.462 11.538.462 25.000.000 25.000.000 48.076.923 48.076.923 48.076.923 48.076.923 48.076.923 48.076.923
35% 35% 35% 35% 35% 35% 35% 35% 35% 35%
Crude Glycerin – sea freight:
1.030.220 1.030.220 1.785.714 1.785.714 3.004.808 2.575.549 2.575.549 2.575.549 2.575.549 2.575.549
iv) Sea freight - total:
1.701.191 1.701.191 2.948.731 2.948.731 4.961.807 4.532.548 4.532.548 4.532.548 4.532.548 4.532.548
Trucking - total:
207.821 207.821 450.279 450.279 865.922 865.922 865.922 865.922 865.922 865.922
Tank storage rental
200.000 200.000 400.000 400.000 600.000 600.000 600.000 600.000 600.000 600.000
Total freight and storage cost:
2.109.012 2.109.012 3.799.010 3.799.010 6.427.729 5.998.470 5.998.470 5.998.470 5.998.470 5.998.470

106
Energy cost
v) Electricity:
Phase 1 1.510.730 1.510.730 1.510.730 1.510.730 1.510.730 1.510.730 1.510.730 1.510.730 1.510.730 1.510.730
Phase 2
2.815.305 2.815.305 2.815.305 2.815.305 2.815.305 2.815.305 2.815.305 2.815.305
Phase 3 5.591.581 5.591.581 5.591.581 5.591.581 5.591.581 5.591.581
1.510.730 1.510.730 4.326.035 4.326.035 9.917.617 9.917.617 9.917.617 9.917.617 9.917.617 9.917.617
vi) Thermal energy:
Phase 1 1.731.682 1.731.682 1.731.682 1.731.682 1.731.682 1.731.682 1.731.682 1.731.682 1.731.682 1.731.682
Phase 2
3.463.364 3.463.364 3.463.364 3.463.364 3.463.364 3.463.364 3.463.364 3.463.364
Phase 3 6.926.727 6.926.727 6.926.727 6.926.727 6.926.727 6.926.727
1.731.682 1.731.682 5.195.045 5.195.045 12.121.773 12.121.773 12.121.773 12.121.773 12.121.773 12.121.773
vii) Total energy cost:
3.242.412 3.242.412 9.521.081 9.521.081 22.039.389 22.039.389 22.039.389 22.039.389 22.039.389 22.039.389
Proportion of sales:
9% 9% 12% 12% 14% 14% 14% 14% 14% 14%
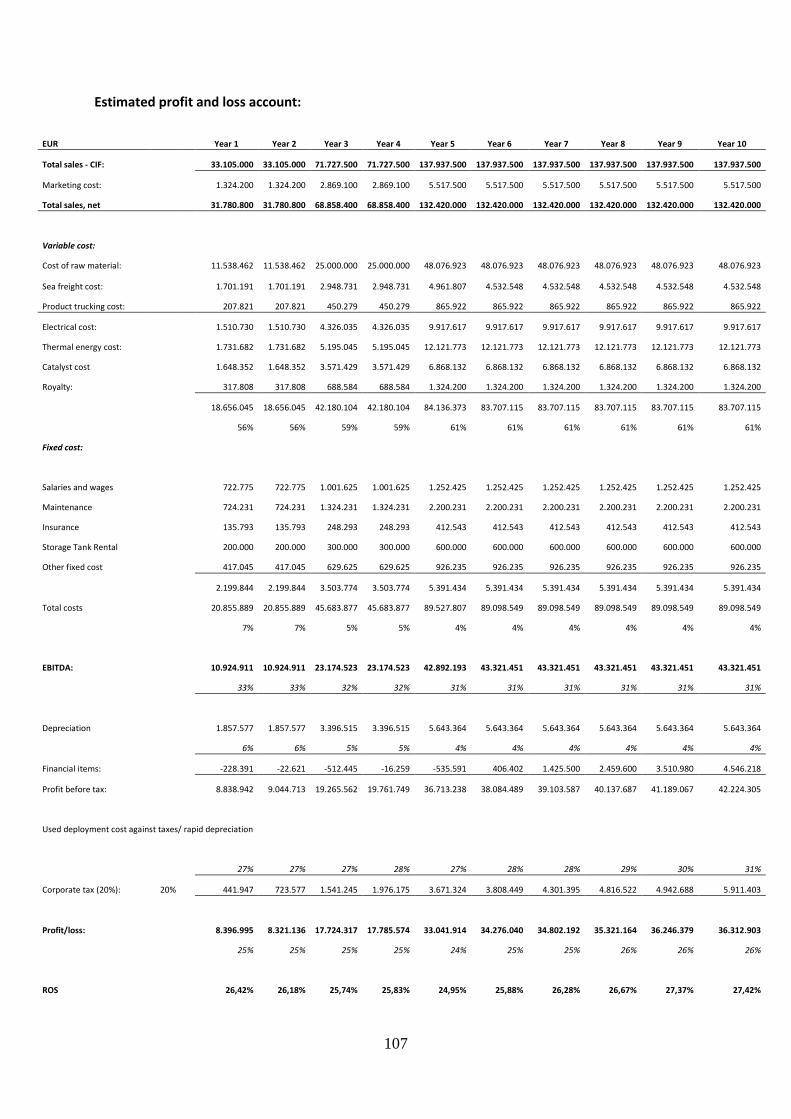
107
Estimated profit and loss account:
EUR Year 1 Year 2 Year 3 Year 4 Year 5 Year 6 Year 7 Year 8 Year 9 Year 10
Total sales - CIF:
33.105.000 33.105.000 71.727.500 71.727.500 137.937.500 137.937.500 137.937.500 137.937.500 137.937.500 137.937.500
Marketing cost:
1.324.200 1.324.200 2.869.100 2.869.100 5.517.500 5.517.500 5.517.500 5.517.500 5.517.500 5.517.500
Total sales, net 31.780.800 31.780.800 68.858.400 68.858.400 132.420.000 132.420.000 132.420.000 132.420.000 132.420.000 132.420.000
Variable cost:
Cost of raw material:
11.538.462 11.538.462 25.000.000 25.000.000 48.076.923 48.076.923 48.076.923 48.076.923 48.076.923 48.076.923
Sea freight cost:
1.701.191 1.701.191 2.948.731 2.948.731 4.961.807 4.532.548 4.532.548 4.532.548 4.532.548 4.532.548
Product trucking cost: 207.821 207.821 450.279 450.279 865.922 865.922 865.922 865.922 865.922 865.922
Electrical cost:
1.510.730 1.510.730 4.326.035 4.326.035 9.917.617 9.917.617 9.917.617 9.917.617 9.917.617 9.917.617
Thermal energy cost:
1.731.682 1.731.682 5.195.045 5.195.045 12.121.773 12.121.773 12.121.773 12.121.773 12.121.773 12.121.773
Catalyst cost
1.648.352 1.648.352 3.571.429 3.571.429 6.868.132 6.868.132 6.868.132 6.868.132 6.868.132 6.868.132
Royalty:
317.808 317.808 688.584 688.584 1.324.200 1.324.200 1.324.200 1.324.200 1.324.200 1.324.200
18.656.045 18.656.045 42.180.104 42.180.104 84.136.373 83.707.115 83.707.115 83.707.115 83.707.115 83.707.115
56% 56% 59% 59% 61% 61% 61% 61% 61% 61%
Fixed cost:
Salaries and wages
722.775 722.775 1.001.625 1.001.625 1.252.425 1.252.425 1.252.425 1.252.425 1.252.425 1.252.425
Maintenance
724.231 724.231 1.324.231 1.324.231 2.200.231 2.200.231 2.200.231 2.200.231 2.200.231 2.200.231
Insurance
135.793 135.793 248.293 248.293 412.543 412.543 412.543 412.543 412.543 412.543
Storage Tank Rental
200.000 200.000 300.000 300.000 600.000 600.000 600.000 600.000 600.000 600.000
Other fixed cost
417.045 417.045 629.625 629.625 926.235 926.235 926.235 926.235 926.235 926.235
2.199.844 2.199.844 3.503.774 3.503.774 5.391.434 5.391.434 5.391.434 5.391.434 5.391.434 5.391.434
Total costs
20.855.889 20.855.889 45.683.877 45.683.877 89.527.807 89.098.549 89.098.549 89.098.549 89.098.549 89.098.549
7% 7% 5% 5% 4% 4% 4% 4% 4% 4%
EBITDA:
10.924.911 10.924.911 23.174.523 23.174.523 42.892.193 43.321.451 43.321.451 43.321.451 43.321.451 43.321.451
33% 33% 32% 32% 31% 31% 31% 31% 31% 31%
Depreciation
1.857.577 1.857.577 3.396.515 3.396.515 5.643.364 5.643.364 5.643.364 5.643.364 5.643.364 5.643.364
6% 6% 5% 5% 4% 4% 4% 4% 4% 4%
Financial items:
-228.391 -22.621 -512.445 -16.259 -535.591 406.402 1.425.500 2.459.600 3.510.980 4.546.218
Profit before tax:
8.838.942 9.044.713 19.265.562 19.761.749 36.713.238 38.084.489 39.103.587 40.137.687 41.189.067 42.224.305
Used deployment cost against taxes/ rapid depreciation
27% 27% 27% 28% 27% 28% 28% 29% 30% 31%
Corporate tax (20%): 20%
441.947 723.577 1.541.245 1.976.175 3.671.324 3.808.449 4.301.395 4.816.522 4.942.688 5.911.403
Profit/loss:
8.396.995 8.321.136 17.724.317 17.785.574 33.041.914 34.276.040 34.802.192 35.321.164 36.246.379 36.312.903
25% 25% 25% 25% 24% 25% 25% 26% 26% 26%
ROS
26,42% 26,18% 25,74% 25,83% 24,95% 25,88% 26,28% 26,67% 27,37% 27,42%

108
Cash flow and equity
The following cash flow is based on the following assumptions:
a) Equity:
Investment Equity Loan capital
Euro % Euro % Euro
Phase 1 18.105.771 100% 13.579.328 25% 4.526.443
Phase 2 15.000.000 100% 3.000.000 80% 12.000.000
Phase 3 21.900.000 100% 4.380.000 80% 17.520.000
b) Interest rate:
Euro loans: Libor: 0,17% Premium: 6,00% Total: 6,17%
Euro deposits:
Total: 2,06%
c) Income:
Estimated length of time of receivables: 2 months 16,67% of the annual income
d) Cost:
Estimated length of time of payables: 1 months 8,33% of the annual cost
8 years
Year Beginning of 0 1 2 3 4 5 6 7 8 9 10
Loan 1+first year interest
4.824.089
Principal
-603.011 -603.011 -603.011 -603.011 -603.011 -603.011 -603.011 -603.011
Interests: -297.646 -260.441 -223.235 -186.029 -148.823 -111.617 -74.412 -37.206
Loan 2 + first year interest
12.789.087
Principal
-1.598.636 -1.598.636 -1.598.636 -1.598.636 -1.598.636 -1.598.636 -1.598.636 -
1.598.636
Interests: -789.087 -690.451 -591.815 -493.179 -394.543 -295.907 -197.272 -98.636
Loan 3 + first year interest
18.672.067
Principal
-2.334.008 -2.334.008 -2.334.008 -2.334.008 -2.334.008 -
2.334.008
Interest: -1.152.067 -1.008.058 -864.050 -720.042 -576.033 -432.025
* Loans are paid out at the beginning of the year and accrue interest that year.

109
Atlantic Green Chemicals - Glycerin to glycols - G2G
0-1 Year 0 Year 1 Year 2 Year 3 Year 4 Year 5 Year 6 Year 7 Year 8 Year 9 Year 10
Revenue:
31.780.800 31.780.800 68.858.400 68.858.400 132.420.000 132.420.000 132.420.000 132.420.000 132.420.000 132.420.000
Operational Cost:
20.855.889 20.855.889 45.683.877 45.683.877 89.527.807 89.098.549 89.098.549 89.098.549 89.098.549 89.098.549
Share capital: 1000000 14.579.328 14.579.328 17.579.328 17.579.328 17.579.328 17.579.328 17.579.328 17.579.328 17.579.328 17.579.328 17.579.328
Investment: -1000000 -18.105.771 -15.000.000 -21.900.000
Loan capital: 4.526.443 12.000.000 17.520.000
Operational Capital Need 100000 100.000
New Equity needed -1000000 -13.479.328 0 -3.000.000 0 -4.380.000 0 0 0 0 0 0
Income:
26.484.000 31.780.800 62.678.800 68.858.400 121.826.400 132.420.000 132.420.000 132.420.000 132.420.000 132.420.000
Operational cost: 900000
-19.117.899 -20.855.889 -43.614.878 -45.683.877 -85.874.146 -89.134.320 -89.098.549 -89.098.549 -89.098.549 -89.098.549
Cash Flow from Operations 900000
7.366.101 10.924.911 19.063.922 23.174.523 35.952.254 43.285.680 43.321.451 43.321.451 43.321.451 43.321.451
Equity Inflow :
-1000000 -13.479.328
-3.000.000
-4.380.000
Principal Payment of loans:
0 -603.011 -603.011 -2.201.647 -2.201.647 -4.535.655 -4.535.655 -4.535.655 -4.535.655 -3.932.644 -3.932.644
Financial items:
0 -228.391 -22.621 -512.445 -16.259 -535.591 406.402 1.425.500 2.459.600 3.510.980 4.546.218
Corporate tax: -441.947 -723.577 -1.541.245 -1.976.175 -3.671.324 -3.808.449 -4.301.395 -4.816.522 -4.942.688
Free Cash flow to equity -1000000 -13.479.328 6.534.699 6.857.332 15.626.252 15.035.372 28.904.833 35.485.103 36.402.847 36.944.001 38.083.265 38.992.337
280
IRR 74,3%
NPV 68.844.894 15%
Cash at beginning of period
100.000 100.000 6.634.699 16.492.031 32.118.283 51.533.655 80.438.488 115.923.590 152.326.437 189.270.438 227.353.703
Cast at end of period 100.000 6.634.699 16.492.031 32.118.283 51.533.655 80.438.488 115.923.590 152.326.437 189.270.438 227.353.703 266.346.041
Interest income:
69.255 237.820 499.876 860.221 1.357.114 2.019.257 2.758.504 3.512.755 4.284.285 5.076.879
Interest paid on long term loans: -297.646 -260.441 -1.012.321 -876.480 -1.892.705 -1.612.855 -1.333.005 -1.053.155 -773.305 -530.661
Finical items - total:
-228.391 -22.621 -512.445 -16.259 -535.591 406.402 1.425.500 2.459.600 3.510.980 4.546.218

110
Appendix A
A.1 Data for business cases
Andri Ottesen [[email protected]]
Aðgerðir
Viðtakandi:
GunnlaugurF Gmail [[email protected]] ; [email protected] ;Indriði
Waage
Viðhengi:
logistic Krafla Husavik.pptx MB 2( ) [Opna sem vefsíðu ]
18. ágúst 2011 17:16
Sælir allir
Hérna eru smá upplýsinar fyrir verkefnin.
Verðin fyrir technical grade 5000 T bulk af propylyne glycols eru 1300 E samkvæmt síma
samtali við HELM í síðustu viku. Ohætt er að miða við 250 E á tonnið af gyseríni. Það verð
miðast við að þeir taki 5% í markaðsgjald (ekki innifalið) en munu fyrirframgreiða fyrir
samleiðsluna í staðinn um leið og hún er komin í skip.
Í viðhenginu eru myndir af husavik og samgangur við Kroflu og kostnaður við flutninga og
geymslu.
Við fengum verðhugmyndir frá aðilum sem erum með tankana í leigu í Helguvik. Tveir 16 T
tankar (fyrir P-glycol og glyserin) og einn 4T tankur fyrir E-glycol kostar um 36.000 E á
mánuði.
Kveðja
Andri
A.2
2011/9/12 Andri Ottesen <[email protected]>
Sælir félagar
Hérna er ástæða vegna þess að við bæði CRI og AGC er að líta á
Grundartanga til að reisa verksmiðju við hliðina á Kemira. Það er
vegna þess að gert er ráð fyrir að kaupa vetnið þar á 700 Euro per
tonn á meðan með öllu innitöldu þá gætu þessi fyrirtæki framleitt það
sjálft fyrirr 2000 Euro. Kemira mun sennilega byggja á Grundartanga
ef HS orka vinnur mál gegn Century Aluminum um hvort þeir þurfi að

111
afhenda orkuna til þeirra. Ef HS vinnur málið þá eiga þeir nóga orku
til að selja til nokkra fyrirtækja á suður vestur hluta landsins. Ef
þeir vinna ekki málið þá er ekki til orka fyrir Kemira og þeir verða
að flytja sig til Bakka á Húsavík sem þeir munu sennilega neita vegna
þessa hvað svæðið er lítð þróað Green field verkefni. Vetnið sem
þeir setja fra ser nægir í um 150.000 t framleiðslu.
Colocated with Sodium Chlorine and Chlorine Alcali factories: Case of
Kemira coming to Iceland
About KEMIRA
Kemira is a 2 billion euro chemical company, headquartered in Finland
with global operations focusing on the pulp and paper industry and
water treatment industry.
Kemira plans in Iceland:
Kemira is planning to build a 100.000 MT/annum Sodium Chlorate plant.
The Sodium chlorate (NaClO3) is used for the onsite production of
chlorine dioxide (ClO2) a primary chemical for paper bleaching.
Current annual global production of sodium chlorate is around 1
million tones and Kemira has over 40% market share. Feedstock required
are 55.000 MT NaCl and 50.000 MT water per annum along with steam and
some HCl and NaOH. Electricity required for the plant is 500 GWh per
annum or the equivalent of a 60 MW plant. 70% of their production
cost is electricity and their aim was to obtain electricity prices of
around 30USD/MWh. The footprint of the proposed plant will be roughly
100x100 meters and involves an estimated 50 million euro investment.
The primary market for their product is in Brazil and the major
challenges are associated with logistics of the product delivery to
the market. It will likely need to be shipped out in containers (10
per day) so there is a need for proximity to a container harbor.
Logistics will be the deciding factor for their decision to go ahead.
Building time of the factory is two years.
Opportunity for CRI
If Kemira plans will realize its plans it will produce 5600 MT/annum
of atmospheric pressured Hydrogen that meets CRI requirement . However
for Kemira the hydrogen is a byproduct which they have little or no
market for. For CRI this amount of hydrogen is enough for about 24
million liter production of renewable methanol. This could potentially
save CRI significant amounts of capital for its first CSP and
operational expenses if CRI is able to purchase hydrogen cheaper then
CRI can make it themselves, which is likely scenario.
Favorite spot of location is currently Grundartangi next to Fero
Silicon and aluminum factory and relatively close to cement factory
that could be a source of CO2 industrial emission CRI needs. Kemira
can only sell a small portion of the hydrogen to the aluminum or ferro

112
silicon industries as propane replacement, or about 5% of the total
hydrogen production. The price they are likely to pay for the
hydrogen in such case is about 500.000 USD. It would take 32,5 MW for
CRI to make 5600 MT/annum of hydrogen at a price of about 7 million
dollars in electric cost, assuming 2,5 cent per kwh. If CRI offer to
pay 1 million for the hydrogen which is double what they would other
vice get CRI could save 6 million on Opex yearly and about 10 million
USD savings in Capex which is a cost of 13 electrolizers needed to
produce this amount and about 600.000 USD in annualized opex for
refurbishment.
Kemira might be persuaded to be collocated with CRI at Krafla as the
change in the electrical law can lowered Kemira power prices from 3
Cents per Kwh to 2,5 Cents as they can be except from the
transportation fee if they are collocated with CRI. This will lower
the overall operational expenditure of Kemira of about 12%, which can
be used to pay for extra transportation cost to move 10 containers per
day to Husavik harbor.
kveðja
Andri
A3 AGS a þrem stöðum á Island
Andri Ottesen [[email protected]]
Aðgerðir
Viðtakandi:
Arnfinnur Ottesen [[email protected]] ; Indriði Waage
13. september 2011 08:42
Sælir
Smá update á casinu eftir að hafa hitt Godivary Refinaries og þeirra
agent í Hollandi um helgina.
Við ættum að taka verðið á glyserini upp í 280 og einnig að lækka verð
á propyline glycol um 50 evrur. Ættum að hækka viðhaldskostnaðinn úr
2,5% i 4%. Markaðskostnaðinn úr 3,5 í 4%. Sem mundi þa covera
uppskipun, geymslu í Hollandi.
Við yrðum að hækka geymslukostnaðinn í Helguvík, þ.e. ef við fáum allt
leigt um 200000 e á ári. upp i svona 400,000

113
Ef við byggjum við hliðina á Kemira þá er líklegt verð á vetni um 700
Evrur (miðað við 2000 E ef við gerum það sjálfi- uppreiknaður opex og
capex). Kemira er orðin mjög heit fyrir Grundartanga en fær ekki
raforku nema HS orka vinni málið geng Century Aluminum um að neyðast
að veita þeim orku í Helguvik. Útkoma úr því máli skýrist á næstu
mánuðum. Kemira er líka búinn að fá úrskurð um að þeir þurfi ekki að
fara í fullt umhverfismat sem flýtir þeirra byggingu um 6 mánuði.
Gallinn við Grundartanga er að það er eingin gufa þar sem er mjög
mikilæg fyrir okkar starfssemi. Það yrði því að breynna hluta af
vetninu til að búa til gufu og forna þannig allt að þriðjung vetnisins
- sem kæmi svo sem ekki að sök því þarna verður til vetni fyrir
150.000t verksmiðju en við þurfum bara tvo þriðju þes vetnis. Mjog
sennilega þarf AGC að keppa við CRI eða sameinast um kaupin á vetni
að einhverju leyti.
Það er svo sem nógur hita utblastur frá Elcem a Grundartanga, en til
þess að hægt verði að nýta hana í formi gufu þá þarf að setja upp gufu
katla sem væri fjárfesting upp á 3 milljónir dollara og til að fá hana
til baka þá verður kannski allir að kaupa gufu af þeim á um 5 evrur á
tonnið.
Ef HS orka tapar málinu verður ekki til næg orka á Grundartanga og
eini kostur fyrir Kemira verður að fara á Bakka sem þeir eru ekkert
ægilega spenntir fyrir því það er alveg Greenfield verkefni. Það er
ekkert þar nuna. Verður að byggja allt upp frá grunni af gjaldþrota
bæjarfélagi - áhættan og töfin er mikil og það einnig að sigla með
vöruna í 1,5 dag lengur. Þetta eru þættir sem raforkuverðið verður að
koma upp á móti með eða verkefnið dettur einfaldlega niður. Einnig er
nálægt við hæft starfsfólk þá minni og lífskilyrði á alþjóððlegum
mælikvarða sennilega minni og erfiðara að laða að erlent starfsfólk
til Norðurlands. Eg held að það yrði þá lagt gufuleiðsla til bakka og
verðið að gufu þar yrði um 3 evrur á tonnið. Alls er óvíst að Kemira
hafi einfaldlega áhuga á að reisa verksmiðju fyrir norðan.
AGC reiknar með að fá alla gufu sem þeir þarfnast frá Islenska
kísilfelaginu. Þeir geta skaffað gufu fyrir 150.000 T framleiðslu.
Hins vegar þá væri það 3 millljona framkvæmd fyrir þá að setja upp 2
gufukatla. Kostar um 2 milljónir að setja upp fyrsta og 1 milljón
extra að setja upp hinn. til að fá þá fjárfestingu til baka þá verða
þeir að selja gufuna til AGC um 3,5 e a tonnið og AGC verður þá að
vera til staðar að geta tekið við henni.
Þess vegna er líklegt að gufan verði fengin annars staðar í fyrsta
áfanga í Helguvík. Það væri þörf fyrir um 15000 T af gufu. 5000 ton
af gufu mundu koma frá Kalka, sorpbrennslustöðinni. Þar er gufuketill
til staðar. Reiknað er með að verð á þeirri gufu yrði um 3 e fyrir
tonnið. Restin af gufunni kæmi frá Sildarvinnslunni úr
rafskautakötlum sem eru ekki reknir nema mánuð á ári. Verðið frá þeim
yrði svona um 11 e á tonnið. Það væri þá einn mánuður á ári sem ekki
væri hægt að reka annan rafgreinin og verksmiðjan AGC yrði aðeins í
hálfum afkostum. Hin vegar þegar farið eru í næstu fasa þá væri

114
þessi tenging tekinn út við síldarbræðsluna og sett við Islenkska
Kisil felagið. Sem sagt að meðalverðið á gufu í fyrsta fasa verður
eitthvað um 7-8 evrur en fer svo í 3,5 í næsta fasa.
Eg vona að þetta skýri eitthvað.
Indriði - Þu munt þurfa að skýra mismunadi opex og capex á hverjum
stað fyrir utan aðgengi að hæfu starfsfólki, landi etc. Flutningum ut
af sjó og geymslu á aflurðum og aðföngum.
Við Gulli erum að reyna að hitta forstjóra Indverska fyrirtækisins í
Berlín í 5 oktober og taka eftir það einhverja ákvörðun um framhaldið.
Munið að allt sem er hér sett fram er trúnaðarmál milli okkar og ætti
ekki að fara lengra á þessu stigi.
kveðja
Andri
A.4
Andri Ottesen [[email protected]]
Aðgerðir
Viðtakandi:
Arnfinnur Ottesen [[email protected]] ; Indriði Waage ;GunnlaugurF Gmail
22. september 2011 22:40
Notandi svaraði 23.9.2011 08:40.
Sæll Addi
Eg get staðfest þessi verð. Heimild er Rajiv Rangarajan, Director
Somaiya Biorefinaries BV - Head trader for chemicals in Holland
Office. Heimsókn Íslandi 4 september. - Þetta verð er fyrir technical
grade, bulk propylin glycol.
Sömuleiðis sagði hann okkur að hækka markaðskostnaðinn í 4% af veltu
og innifalið í því er geymslugjald, dreifing og fjármögnun(flýtigjaldi
til að fá greitt á mánaðarfresti) í Hollandi.
Einnig sagði hann okkur að hækka verðið á glyserini upp í 280.
Loks ættu geymslugjöldin á Íslandi að vera um 400.000 E á ári miðað
við að legjum 16.000 T fyrir glysserin, 4000 T fyrir P glycols
(þyrftum að leggja nýjar leiðslur) og látum byggja 4 150.000 l tanka
115
(3 fyrir e glycols og 1 fyrir alcohols). Þar sem framleiðslan verður
eitthvað minni í byrjun þá er örygglega hægt að semja um grace period
sem er kannski eitthvað 300.000 E á ári fyrir fysta fasa.
Við getum reiknað með 50 E á tonnið á flutning á glysseríni til
Íslands miðað við 6000T skip með 3 tankrýmum og notað svo sama skipið
út fyllt 3700 T af P glycols sem ættu að fylla tvö tankrými af 3 og
notað svo síðasta tankrýmið til að flytja 500 t af e glycol sem hægt
er að nota í gluggahreinsivökva og rúðupiss
kostnaður af þeim flutning er innifallin í flutningi á glyserininu og
uppskipunin og geymslukostnaðurinn innifalinn í markaðsgjaldinu.
Vona að þetta hjálpi.
kveðja
Andri
A.5
Andri Ottesen [[email protected]]
Aðgerðir
Viðtakandi:
Indriði Waage
23. september 2011 16:20
Sjálfsagt væri hægt að fá gufu frá þessari verksmiðju fyrir 150.000
tonna framleiðslu. Kemira notar gufu sjálft þannig að þeir mundu taka
hluta af þessu og AGC gæti tekið restina.
Þetta væri sjálfsagt fjármögnun upp á 2,5 milljón evra en ef þetta er
sellt á milli 4-5 e á tonnið þá yrði það 3-4 ár að borga sig til baka.
Húsavík er að vísu með hitaveitu sem er með einhverja gufu, en þetta
er mjög lítil hitaveita að ég held bara 5 mw. en það væri jafnvel
hugsanlegt að það nægði í fyrsta áfangann.
Eins væri hægt að fá gufu frá Elkem á grundartanga en það er miklu
erfiðara að byggja inn gufukatla eftir á og mundi kosta það að það
yrði að stöðva framleiðslu í ienhverntíma.
Það yrði mun stærri fjárfesting mundi ég halda og þyrfti að standa
undri hærri verðum.
kveðja
Andri

116
A.6 4 staðarvalskostir á Íslandi - Kostnaðargreining.
Andri Ottesen [[email protected]]
Aðgerðir
Viðtakandi:
Indriði Waage ;Arnfinnur Ottesen [[email protected]] ; GunnlaugurF Gmail
23. september 2011 21:21
Sæll Indriði
Við erum að ræða þessa þrjá-fjóra staðarvalskosti (austurland sem er
svona null case).
1. Helguvík sem Addi er raunar búinn að gera - Rafgreining - Gufa frá
Islenska Kíselfélaginu.Leiga á einum 4000m3 tanki. Í fyrsta áfanga er
gufan fengin frá Kölku 4 tonn á tímann á 4€ og 10 tonn til viðbótar
frá Sildarvinnslunni á 15€ meðalverð sé 10€ ca. I seinni áföngum er
öll gufa keypt á 4€ per tonn.
2. Grundartangi. byggir á því að fá vetni frá Kemira á 700 € per tonn
og gufu með brennslu á vetni sem jafngildir
Kemira er að losa 4000 m3 af vetni á klst. Við mundum nota 3000m3 af
því til að framleiða gufu og 1000 m3 í efnhvörf sem vetni. Með þessu
móti þá mundi kostar tonnið af gufunni 15€.
Í seinni fara er reiknað með að semja við Elkem um að þeir setji upp
gufuketil í afgasrör. 6€ tonn.
3. Husavík/Bjarnarflag. Gerir ráð fyrir að upp og útskipun yrði á
Húsavík. Byggja þarf 10.000m3 tanka rými í fyrsta áfanga 30.000 ikr.
per m3. Reiknað er með að taka útblástur úr virkjun sem er fullur af
vetnisríku gasi og fullhreina það sem er 1100 m3 á klst sem nægir í
fyrsta fasa gefið það 90 MW virkjun. Þessi vetnikostnaður mælist ekki
beint heldur er einungis tækjum og tólum til þess að hreinsa gasið.
Stofnkostnaður í Bjarnarflagi er sá sami og í Helguvík gróft á litið.
Gufuverð yrði um 3 € per tonn. Í næstu fasa er gert ráð fyrir
rafgreiningu á sama hátt og í Helguvík. Þarna þarf að reiknast exstra
flugningskostnaður til og frá hafnar þar sem geymslutankarnir eru.
4. Austurland - Djúpavogur þar er höfn og tankar og hús. 5000 m3
ónýttir tankar en hins vegar engin gufa, né vetni.
Gufu og vetni þyrfti að framleiða með rafmagni. Gufa mundi kosta um
15€ á tonnið og rafgreinikostnaður eins og í Helguvík. Hins vegar þá
væri hægt að fá byggingar og tanka næstum gefins. Útvega þyrfti viðbótartankarými upp á 5000m3 á sömu kjörum og áður.

117
A.7
Andri Ottesen [[email protected]]
Aðgerðir
Viðtakandi:
Indriði Waage
Afrit:
Arnfinnur Ottesen [[email protected]] ;GunnlaugurF Gmail
Viðhengi:
trucking and storage at H~1.pptx MB 2( ) [Opna sem vefsíðu ]
24. september 2011 10:13
Notandi svaraði 26.9.2011 13:01.
Sæll Indriði
Eg gleymdi einu í gær. Raforkuverðið í Bjarnarflagi/Húsavík yrði 2,6
€ en ekki 3€ eins og á öðrum stöðum þar sem verksmiðjan yrði beintengd
virkjun og ekki því greitt fyrir tengigjald samkvæmt raforkulögum sem
voru samþykkt um áramótin. Nátturúlegt vetni sem kemur þarna upp
lækkar með tímanum allt að 3-5% á ári á sama hátt og óþéttanleg gös
eins og CO2. Við ættum að eiga símafund um þessi case. Starfsfólk
gæti verið svipað og vann í gömlu Kíselverksmiðjunni. Við mundum
semja við ODR um alla flutninga og geymslu fyrir um 16,5 € á tonnið á
bæði glysseríni og glycols og alcaholum. Þetta er reiknað út frá
upplýsingum frá ODR frá því í Mars. Þetta er í fyrsta fasa. Reiknað er
með að einingakostnaður fari niður um 30% fyrir hverja tvöföldun á
verði því kominn niður í helming af þessari tölu fyrir seinasta fasann
120.000 T. Flutningskostnaður til og frá landi er sá sami til
Evrópu.
kveðja
Andri

118
Appendix B
B.1 Frá: Indriði Waage
Sent: 28. október 2011 12:37
Viðtakandi: [email protected]
Efni: varðandi verð á flutningi
Indriði Waage
Sent Items
28. október 2011 12:37 Blessaður frændi
Hér er orkuþörf fyrirtækisins og stækkunarfastar. Við gerum ráð fyrir að fyrirtækið verði stækkað um helming 2-3 árum eftir að fyrsti fasi er fullkláraður og þriðji fasi síðan 2-3 árum efitr að sá annar hefur
verið fullkláraður.
Phase 1 Phase 2 Phase 3 Total
Electrical consumption(w.electrolyzer) - full capacity:
kW 6.180 12.360 24.720 43.260
Numer of hours: 8.300 8.300 8.300
Gigawatthours: 51,3 102,6 205,2 359,1 Ég þekki ekki hvaða spennu þessi rafgreinir þarf en veit að hann er ekki viðkvæmur fyrir flögti og við
getum alveg notað ótrygga orku (þó svo við höfum ekki varaafl eins og tíðkast víst sbr. bræðslurnar).
Mig vantar upplýsingar um tengigjöld, og önnur gjöld sem til falla vegna flutnings. Eins vorum við að
tala um rafspenna sem við þyrftum að hafa og eins þessa breittingu sem þið veitið í gegnum dreifiveiturnar.
Aðal spurningin eru svo auðvitað hvað erum við að spara okkur með því að tengjast ykkur umfram
dreifiveiturnar (Rarik og Hs Orku sem dæmi).
Við erum að skoða þrjár staðsetningar
Bakki -
Grundartangi (Faxaflóahafnir)-
Helguvík -
Aðgerðir
Viðtakandi:
Indriði Waage
Viðhengi:
(2) Sækja öll viðhengi
111102 Indriði Waage - Gj~1.xlsx KB 22( ) [Opna sem vefsíðu ;]Gróft mat á
framkvæmdakos~1.docx KB 14( ) [Opna sem vefsíðu ]
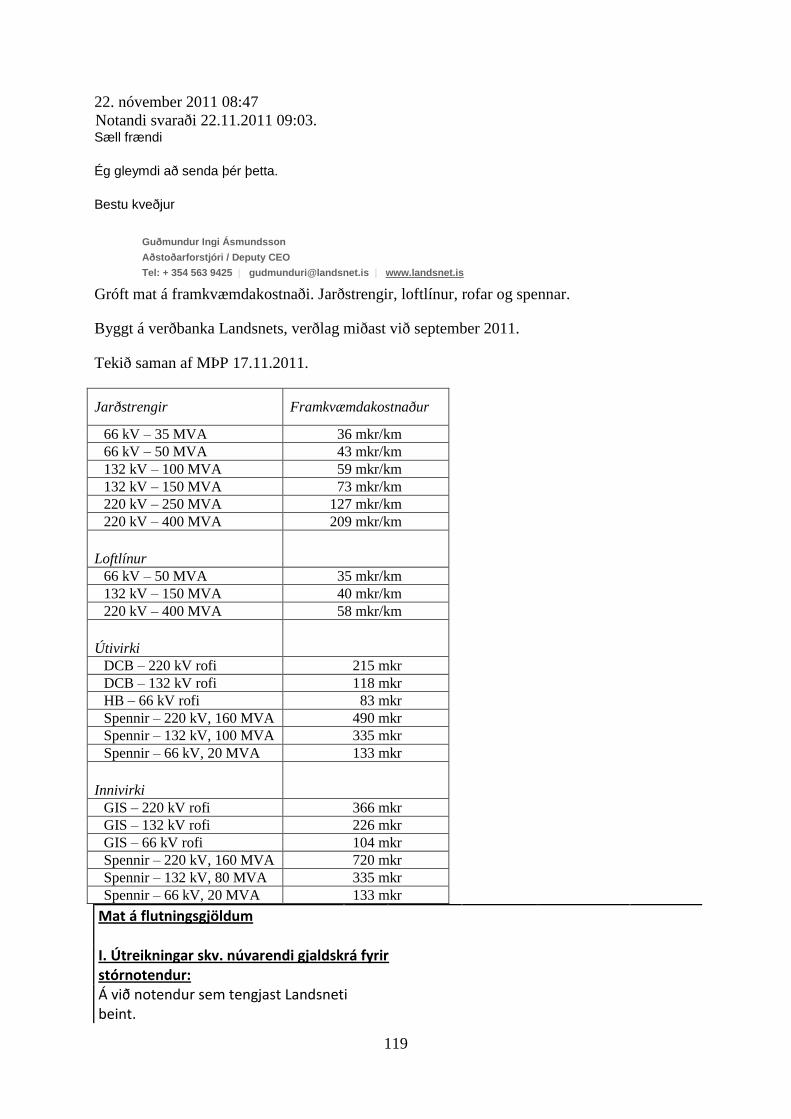
119
22. nóvember 2011 08:47
Notandi svaraði 22.11.2011 09:03. Sæll frændi Ég gleymdi að senda þér þetta. Bestu kveðjur
Guðmundur Ingi Ásmundsson Aðstoðarforstjóri / Deputy CEO Tel: + 354 563 9425 | [email protected] | www.landsnet.is
Gróft mat á framkvæmdakostnaði. Jarðstrengir, loftlínur, rofar og spennar.
Byggt á verðbanka Landsnets, verðlag miðast við september 2011.
Tekið saman af MÞP 17.11.2011.
Jarðstrengir Framkvæmdakostnaður
66 kV – 35 MVA 36 mkr/km
66 kV – 50 MVA 43 mkr/km
132 kV – 100 MVA 59 mkr/km
132 kV – 150 MVA 73 mkr/km
220 kV – 250 MVA 127 mkr/km
220 kV – 400 MVA 209 mkr/km
Loftlínur
66 kV – 50 MVA 35 mkr/km
132 kV – 150 MVA 40 mkr/km
220 kV – 400 MVA 58 mkr/km
Útivirki
DCB – 220 kV rofi 215 mkr
DCB – 132 kV rofi 118 mkr
HB – 66 kV rofi 83 mkr
Spennir – 220 kV, 160 MVA 490 mkr
Spennir – 132 kV, 100 MVA 335 mkr
Spennir – 66 kV, 20 MVA 133 mkr
Innivirki
GIS – 220 kV rofi 366 mkr
GIS – 132 kV rofi 226 mkr
GIS – 66 kV rofi 104 mkr
Spennir – 220 kV, 160 MVA 720 mkr
Spennir – 132 kV, 80 MVA 335 mkr
Spennir – 66 kV, 20 MVA 133 mkr
Mat á flutningsgjöldum
I. Útreikningar skv. núvarendi gjaldskrá fyrir stórnotendur:
Á við notendur sem tengjast Landsneti beint.
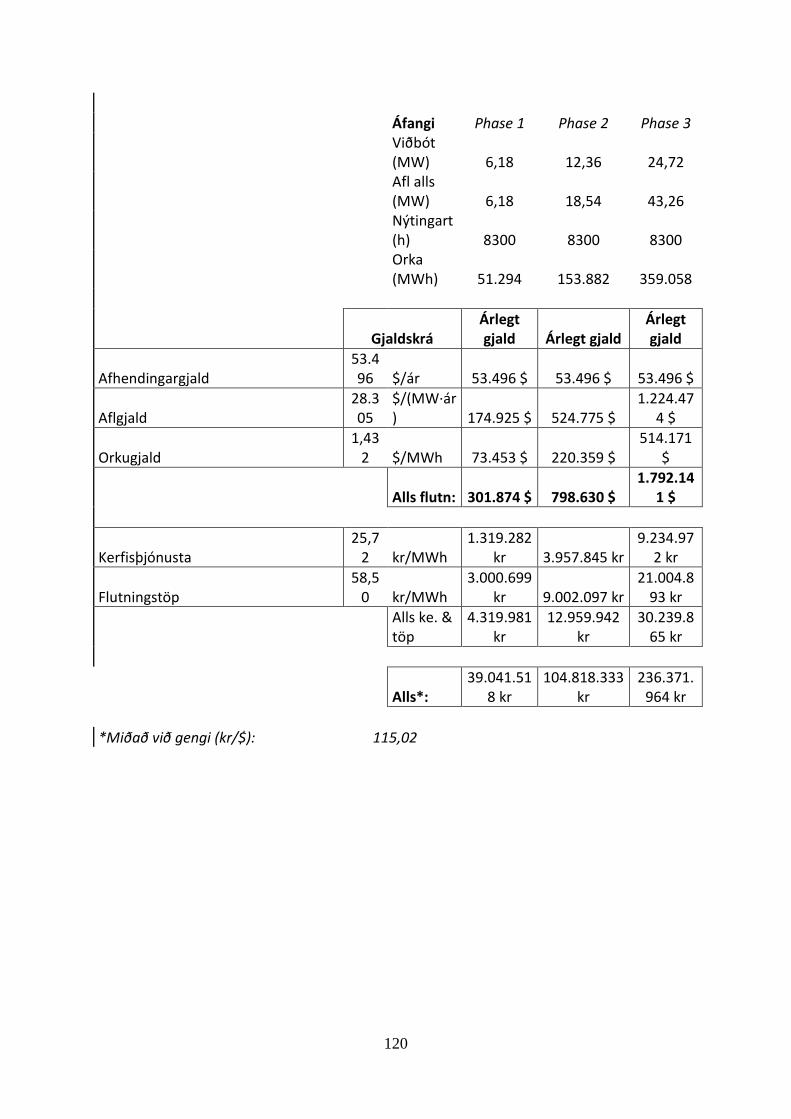
120
Áfangi Phase 1 Phase 2 Phase 3
Viðbót (MW) 6,18 12,36 24,72
Afl alls (MW) 6,18 18,54 43,26
Nýtingart (h) 8300 8300 8300
Orka (MWh) 51.294 153.882 359.058
Gjaldskrá Árlegt gjald Árlegt gjald
Árlegt gjald
Afhendingargjald 53.496 $/ár 53.496 $ 53.496 $ 53.496 $
Aflgjald 28.305
$/(MW·ár) 174.925 $ 524.775 $
1.224.474 $
Orkugjald 1,43
2 $/MWh 73.453 $ 220.359 $ 514.171
$
Alls flutn: 301.874 $ 798.630 $ 1.792.14
1 $
Kerfisþjónusta 25,7
2 kr/MWh 1.319.282
kr 3.957.845 kr 9.234.97
2 kr
Flutningstöp 58,5
0 kr/MWh 3.000.699
kr 9.002.097 kr 21.004.8
93 kr
Alls ke. & töp
4.319.981 kr
12.959.942 kr
30.239.865 kr
Alls*:
39.041.518 kr
104.818.333 kr
236.371.964 kr
*Miðað við gengi (kr/$): 115,02

121
II. Útreikningar skv. skilmálum B9: Ef við segjum að þetta sé "minni stórnotandi" sem tengist inn á svæði dreifiveitu, þá bætist
við viðbótargjald sbr. útreikninga hér að neðan.
Gerum ráð fyrir að kostnaður vegna niðurspenningar sé 1.746.032 $.
(Breytilegt eftir verkefni og þyrfti að athuga betur ef af yrði)
Álag reiknast á eftirfarandi hátt (sjá gr. 4 í skilmálum B9):
Höfum: Stofnkostnaður 1746032
Árlegt hlutfall 0,082 Hlutdeild niðurspenningar 0,8 Orkumagn 359.058 Orkugjald 1,432 Afl 43,26 Aflgjald 28.305 þ.a. reiknum álag: 6,59%

122
Model fyrir útreikning á álagi
Notkun
Load capacity
43 MW
Þetta eru forsendur varðandi notkun sem gengið er út frá
Energy
359.058 MWh
Utilisation 8.300 hrs.
ISK/USD
115,02 kr.
Gjaldskrá stórnotenda
Delivery Charge
53.496 USD per year
Þetta er stórnotendagjaldskráin eins og hún er á vef Landsnets
Capacity charge
28.305
USD per MW per year
Energy charge 1,43
USD per MWh
Ancillary services
0,2236
USD per MWh
Transmission losses
0,5086
USD per MWh
Álag á stórnotendagjaldskrá
Delivery Charge 0 USD per year
Capacity charge 1.865
USD per MW per year
Þarna tökum við álag (reiknað í B43) og margföldum orku og aflgjald með því.
Energy charge 0,09
USD per MWh
Þetta er í raun það álag sem kemur á gjaldskrá vegna niðurspenningar.
Ancillary services
0,0000
USD per MWh
Transmission losses
0,0000
USD per MWh
Aukagjald
Delivery charge 0 USD
Capacity charge
80.667 USD
Hér tökum við álagið úr töflunni á undan og reiknum hvað það þýðir í USD
Energy charge
33.873 USD
m.v. það magn sem við erum með
Total for transmission
114.540 USD

123
Uppfærð gjaldskrá
Delivery Charge
53.496
USD per year
Capacity charge
30.170
USD per MW per year
Þetta er stórnotendagjaldskrá, leiðrétt m.v. ofangreint álag
Energy charge 1,53
USD per MWh
Ancillary services
0,2236
USD per MWh
Transmission losses
0,5086
USD per MWh
Heildargjald
Delivery charge
53.496 USD
Capacity charge
1.305.14
1 USD
Þetta er útreikningur á heildarkostnaðnum, þ.e.a.s. Skv. stórnotendagjaldskrá
Energy charge
548.044 USD
að viðbættu álagi
Ancillary services
80.290 USD
Transmission losses
182.619 USD
Total for transmission
2.169.59
1 USD
Mat á tengigjaldi
Sjá nánar skjal "gróft mat á framkvæmdakostnaði.docx"
Hugmynd af útfærslu:
Jarðstrengur 66 kV - 35 MVA
36 mkr/km
Útivirki HB - 66 kV rofi 83 mkr

124
Appendix C
C.1 Varðandi símtalið áðan
30. september 2011 14:41 Sælir! Ég gaf þér víst upp of lágt verð fyrir raforkuna áðan. Miðað er við $32 á MWst. Við seljum enga gufu svo ég get ekki gefið þér upp verð á henni. Raforkuverðið er óháð staðsetningu.
Með kveðju / Best regards,
Hörður Hauksson
Rekstrardeild aflstöðva - viðskiptaborð · Generation Planning - Supply and Trading
Sími / tel: +354 893 25 69 · GSM / mob: +354 893 25 69
Háaleitisbraut 68 · 103 Reykjavík · Iceland
Sími / tel: +354 515 9000 · landsvirkjun.is
From: Indriði Waage <[email protected]> To: "[email protected]" <[email protected]> Date: 30.09.2011 12:40 Subject: Varðandi símtalið áðan
Indriði Waage
Aðgerðir
Viðtakandi:
Sent Items
30. september 2011 12:40 Sæll og blessaður Hörður
Indriði Waage heiti ég og er meistaranemi í alþjóðlegum viðskiptum við háskólann á Bifröst. Ég er að
vinna að meistararitgerð minni og er að leita eftir upplýsingngum frá ykkur varðandi hana. Þessi
ritgerð er unnin sem algert trúnaðarmál og ekkert sem í hana fer mun bera fyrir sjónir almennings. Með örðum orðum þá lít ég svo á að það sem okkur fer á milli sé trúnaðarmál.
Til að kynna aðeins verkefnið mitt þá í grófum dráttum þá er ég að gera áræðanleikakönnun (e. due dilligence) fyrir fyrirhugaða verksmiðju sem mögulega á að byggja á Íslandi. Staðarkostir sem ég er
að kanna eru í þremur sveitarfélögum og eru: Bakki við Húsavík, Grundartangi í Hvalfjarðarsveit og
að síðustu Helguvík á Reykjanesi. Þeir voru valdir þar sem gert er ráð fyrir orkuríkum iðnaði á þessum stöðum og þar sem flest öll umgjörð sem hentar slíkum iðnaði er til staðar eða í nágrenni. Mitt

125
verkefni gerir ráð fyrir að reisingu á iðnaðarverksmiðju sem þarf 6 MW í fyrsta áfanga , en geri svo ráð fyrir að verksmiðjan stækki svo í tveimur áföngum til viðbótar á næstu 2 til 4 árum eftir reisingu fyrsta
áfanga, þ.e næsti áfangi verið 12 MW og með síðasta áfanga krefjist verksmiðjan svo rúmlega 24 MW
í heildarorkunotkun.
fasar
1 2 3
6 MW 12 MW 24 MW
Raforka Verð
Tengigjald
Verksmiðju þarfnast jafnframt iðnaðargufu í millipressu (medium pressure 12 Barg) fyrir framleiðslu
sína og eykst gufuþörfin eftir stækkunarfösunum eins og sést að neðan. Helsta málið hér er að fá gufu sem er yfir 150 gráður, þar sem verkmsiðjan þarf gufu til eimmingar á afurð sinni. Þannig að verð á
gufu per tonn og það magn sem við gætum fengið væri mjög vel þegið
fasar
1 2 3
Gufa verð
Magn
Tengigjald
Þessi verksmiðja sem um ræðir er að framleiða umhverfisvæna afurðir, sem mun veita 20-30
starfsmönnum atvinnu á ársgrundvelli. Það sem mig vantar helst er verð á rafmagni á hverri staðsetningu sem fyrirtækið gæti boðið og
upplýsingar um gjöld sem falla til vegna tengingar.
Varðandi gufu þá vantar mig verð á gufu og hvort fyrirtækið geti afhent gufu á þessum áður tilgreindu stöðum.
Eins og sést á tölunum hér að ofan er um nokkuð stóra framkvæmd að ræða og því er mikilvægt að fá sem bestar upplýsingar um verð og magn. Bestu möguleg svör væru auðvitað í evrum, enda er
verkefni sem þetta fýsilegur kostur fyrir erlenda fjárfesta. Ég vona að þessar upplýsingar hjá mér séu nægjanlegar og vonandi getið þið orðið mér innan handar
með þennan hluta verkefnisins. Ef ykkur finnst þessar upplýsingar ekki nógar eða einhverjar
spurningar vakna um hvað betur mæti fara væru góð ráð vel þeginn. Kveðja Indriði Waage
Meistaranemi við Háskólann á Bifröst Sími 499 1019
C.2 Frá: [email protected] [[email protected]] Sent: 11. október 2011 12:38
Viðtakandi: Indriði Waage Efni: Re: Varðandi símtalið í gær
11. október 2011 12:39 Sæll Indriði, Varðandi magnið, þá er á þessu þremur svæðum talið vera a.m.k. 200 MW og jafnvel með frekari rannsóknum allt að 400 MW. Það er ekki búið að eyranmerkja neitt af þessu rafmagni neinum einum

126
aðila eða iðnaði. Nýtingin á gufunni væri heppilegust innan 20 - 30 km frá borholunum. Nánast í öllum tilfellum er landið í kringum holurnar í einkaeign og þyrfti því að reikna með að kaupa eða leigja land af slíkum aðilum ef ætti að vera með iðnað þar. Hins vegar er iðnaðarlóð á Bakka í eigu Norðurþings og það ætti að vera hægt að nýta gufuna a.m.k. frá Þeistareykjum þar. Vonað þetta gagnist.
Með kveðju / Best regards,
Edvard G Guðnason
Viðskiptastjóri · Business Director
Sími / tel: +354 515 90 39 · GSM / mob: +354 894 45 75
Háaleitisbraut 68 · 103 Reykjavík · Iceland
Sími / tel: +354 515 9000 · landsvirkjun.is
From: Indriði Waage <[email protected]> To: "[email protected]" <[email protected]> Date: 11.10.2011 12:20 Subject: Varðandi símtalið í gær
Indriði Waage
Aðgerðir
Viðtakandi:
Sent Items
11. október 2011 12:20 Sæll og blessaður Edvard
Mig langar til þess að þakka þér fyrir þær upplýsingar sem þú gafst mér upp í gær. Mig langar samt til
að spyrja þig aðeins nánar um nokkra hluti. Sú fyrri snýr að hversu mikið er af ónýttri orku á þessum
þremur svæðum þ.e Bjarnarflagi, Þeystárreykjum og Kröflu,(og er þá búið að eirnamerkja hana einhverjum ákveðnum iðnaði?), Hin síðari snýr að gufunni en þú gast mér upp að verð á henni væri
ca. 200 ísl.krónur en þá yrði nýtingin að vera nálægt svæðinu og því spyr ég hver á landsvæðið í kringum borholurnar.
Kveðja
Indriði Waage
Meistaranemi við Háskólann á Bifröst Lundi Svíþjóð
C.3 Frá: [email protected] [[email protected]]
Sent: 7. desember 2011 18:41
Viðtakandi: Indriði Waage

127
Afrit: [email protected]
Efni: Re: Bjarnarflag
7. desember 2011 18:41
Sæll Indriði.
Áætlaður þrýstingur á mettaðri gufu er 10 bara, eða hiti um 180°C,
kv.
Árni Gunnarsson Yfirverkefnastjóri · Senior Project Manager Tölvupóstur / e-mail: [email protected] Sími/tel: +354 515 8971 . Gsm/mobile: +354 824 7979 Landsvirkjun Power ehf. Háaleitisbraut 68 · 103 Reykjavík · Iceland Sími / tel: +354 515 8900 · Fax: +354 515 8904 www.landsvirkjun.is · www.lvpower.com
From: Indriði Waage <[email protected]>
To: "[email protected]" <[email protected]>
Date: 07.12.2011 15:27
Subject: Bjarnarflag
Indriði Waage
Aðgerðir
Viðtakandi:
Sent Items
7. desember 2011 15:27
Sæll og blessaður Árni
Indriði Waage heiti ég og er meistaranemi við Háskólann á Bifröst. Ég er að gera áræðanleikakönnun
fyrir fyrirtæki sem hefur áhuga á að reisa verksmiðju á Íslandi. Leiðbeinandi minn er dr. Andri

128
Ottesen.
Ég er að kanna Bjarnarflag sem mögulegan statðsetningu fyrir þessa verksmiðju og hef áhuga á að fá
rafmagn og gufu frá Bjarnaflagsvirkjun. Þær upplýsingar sem vantar eru um gufuna sem virkjuninn
gefur frá sér.
mig vantar:
Hitan á gufunni (C°):
þrýstinginn á gufunnni (bar):
Ég var búinn að tala við hann Edvard G. hjá LV um verðin, en hann benti mér á að tala við þig um
þessar tæknilegu upplýsingar.
Kveðja Indriði Waage

129
Appendix D
D.1 Glysirin.
Operations [[email protected]]
20. október 2011 13:27 Já , það er sama verð.
Indriði Waage
Aðgerðir
Viðtakandi:
Operations [[email protected]]
Sent Items
20. október 2011 12:32 Sæll og blessaður Már
Ég er að skoða fleiri staði á Íslandi varðandi flutning á glycerine til og frá landi. Væri verð á flutningi til
Bakka á Húsavík eitthvað frábrugðið því verði sem þú gafst mér upp miðað við Akranes? það er 191
NOK per tonn.
kveðja Indriði
Frá: Operations [[email protected]]
Sent: 30. september 2011 14:23 Viðtakandi: Indriði Waage
Efni: FW: Glysirin.
Operations [[email protected]]
30. september 2011 14:23 Sent: 30. september 2011 10:36 To: Már Gunnarsson
Subject: SV: Glysirin. Mar/Sigbjørn Hallo 3500mts Glycerin Rotterdam Akranes NOK 268 pmt,- 2500mts Glycerin Akranes-Rotterdam NOK 341 pmt,- 3500mts Rotterdam-Akranes in combination 2500mts Akranes-Rotterdam NOK 191 pmt,-

130
Appendix E
E.1
Sæll
Tryggvi hjá Norðurþingi var í sambandi við mig og bað mig að svara fyrirspurn þinni.
a) Lóð yrði væntanlega leigð og lóðarleigan er ákveðin % af fasteignamati lóðar. Nú hafa lóðir á Bakka ekki verið metnar í fasteignamati enda er það venjulega ekki gert fyrr en þær verða veðhæfar, þ.e. búið er að framkvæma á þeim. Álagningarprósenta lóðarleigu er ákveðin árlega af sveitarstjórn á grundvelli laga um tekjustofna sveitarfélaga
http://www.althingi.is/lagas/139a/1995004.html en skv. álagningarreglum í Norðurþingi 2011 er lóðarleiga vegna atvinnuhúsnæðis 2,5% af fasteignamati http://www.nordurthing.is/static/files/gjaldskrar/2010/2011_01_ALAGNING_GJALDA_2011.pdf
Með því að taka dæmigerða iðnaðarlóð í þegar byggði hverfi má áætla fasteignamat iðnaðarlóðar hér kr. 6.000 á m2 lóðarleiga fyrir 40.000m2 yrði því 40.000*6000*2,5% =
6.000.000 Lóðin yrði afhent í því ástandi sem hún er en tenging hennar við vegakerfi, veitur og fráveitur er á vegum sveitarfélagins nem hvað varðar rafmagn sem annað hvort er á vegum Landsnets, ef um stórnotanda (20MW eða meira)er að ræða en annars á vegum RARIK. Geri svo ráð fyrir að semja mætti við sveitarfélagið um ívilnun á þessum gjöldum og fleirum á grundvelli laga um ívilnanir http://www.althingi.is/lagas/139a/2010099.html
b) Núverandi hafnarmannvirki eru með 10 metra dýpi og lengsti kantur er 130 metrar. Hann getur því tekið við skipum með allt að 8,5 metra djúpristu og allt að 160-170 metra að lengd. Tiltölulega auðvelt er að dýpka niður í 12 metra (10,5 metra djúprista) og lengja kantinn upp í 180 metra. Gjaldskrá hafnarinnar er hér http://www.nordurthing.is/static/files/gjaldskrar/2010/2011_hofn.pdf en gera má ráð fyrir að unnt sé að semja um magnafslætti, a.m.k. í tiltekinn tíma.
c) Þjóðvegurinn á milli Húsavíkur og Mývatnssveitar (Bjarnarflag) er nr. 87 Kísilvegur: Af Hringvegi hjá Reykjahlíð í Mývatnssveit, um Hólssand, Hvammsheiði og
Reykjahverfi, á Norðausturveg hjá Laxamýri. Sjá vegaskrá
http://www.vegagerdin.is/vefur2.nsf/Files/VegskraLysing/$file/Vegaskra_leidarlysing_31-01-2011.pdf bls. 11 Vegurinn er tvíbreiður lagður bundnu slitlagi að 11 km undanskyldum en heildarvegalengin á milli Húsavíkur og Bjarnarflags er tæpir 60 km. Vetrarþjónusta er á veginum skv. reglum Vegagerðarinnar tvo daga í viku, sjá kort http://www.vegagerdin.is/upplysingar-og-utgafa/leidbeiningar-og-stadlar/vetrarthjonusta/mokstursdagar/ Önnur leið liggur um Reykjadal sem öll er með bundnu slitlagi og vetrarþjónustu alla daga vikunnar en sú leið er um 80 km.

131
Verið er að byggja upp virkjanaveg frá Húsavík að Þeistareykjum sem, enn sem komið er, er malarvegur en verður lagður bundnu slitlagi síðar. Ekki er búið að skilgreina þjónustustig á veginum en eins og um aðra vegi hefur notkun áhrif á það þjónustustig sem skilgreint yrði. Vegalengdin er um 28 km.
Vona að þetta komi þér að gagni.
Bkv,
Reinhard Reynisson
Framkvæmdastjóri / Managing director
Atvinnuþróunarfélag Þingeyinga hf. / North East Iceland Development Agency
Garðarsbraut 5 - 640 Húsavík - Iceland Sími/Tel: (+354) 464 0415 Gsm/Mobile: (+354) 863 6622 Vefur / Web: www.atthing.is e-mail: [email protected]