atlas of the biology and distribution of the sea scallop placopecten magellanicus and iceland...
TRANSCRIPT
· Atlas of the biology and distribution of the Sea scallop Placopecten magellanicus and Iceland scallop Chlamys islandica ' in the Northwest Atlantic
G.A.P. Black, R.K. Mohn, G. Robert, and M.J. Tremblay
Benthic Fisheries and Aquaculture Division Biological Sciences Branch Department of Fisheries and Oceans P.O. Box 550 Halifax, Nova Scotia B3J 2S7
1993
Canadian Technical Report of Fisheries and Aquatic Sciences No. 1915
.+ Fisheries and Environment Canada
Fisheries and Marine Service
Pkhes et Enviromement Canada
Service des pkhes et de Ia mer
Fisheries and Marine Service
Technical Reports
These reports contain scientific and technical information that represents an important contribution to existing knowledge but which for some reason may not be appropriate for primary scientific (i.e. Journal) publication. Technical Reports are directed primarily towards a world wide audience and have an international distribution. No restriction is placed on subject matter and the series reflects the broad interests and policies of the Fisheries and Marine Service, namely, fisheries management, technology and development, ocean sciences, and aquatic environments relevant to Canada.
Technical Reports may be cited as full publications. The correct citation appears above the abstract of each report. Each report will be abstracted in Aquatic Sciences and Fisheries Abstracts and will be indexed annually in the Service's index to scientific and technical publications.
Numbers 1-456 in this series were issued as Technical Reports of the Fisheries Research Board of Canada. Numbers 457-714 were issued as Department of the Environment, Fisheries and Marine Service, Research and Development Directorate Technical Reports. The series name was changed with report number 715.
Details on the availability of Technical Reports in hard copy may be obtained from the issuing establishment indicated on the front cover.
Service des peches et de la mer
Rapports techniques
Ces rapports contiennent des renseignements scientifiques et techniques qui constituent une contribution importante aux connaissances actuelles mais qui, pour une raison ou pour une autre, ne semblent pas appropries pour la publication dans un journal scientifique. II n'y a aucune restriction quant au sujet, de fait, la serie reflete la vaste gamme des interets et des politiques du Service des peches et de la mer, notamment gestion des peches, techniques et developpement, sciences oceaniques et environnements aquatiques, au Canada.
Les Rapports techniques peuvent etre consideres comme des publications completes. Le titre exact paraltra au haut du resume de chaque rapport, qui sera publie dans la revue Aquatic Sciences and Fisheries Abstracts et qui figurera dans I'index annuel des publications scientifiques et techniques du Service.
Les numeros 1-456 de cette serie ont ete publies a titre de Rapports techniques de I'Office des recherches sur les pecheries du Canada. Les numeros 457-700, a titre de Rapports techniques de la Direction generale de la recherche et du developpement, Service des peches et de la mer, ministere de l'Environnement. Le nom de la serie a ete modifie a partir du numero 70l.
La page couverture porte Ie nom de l'etablissement auteur ou I'on peut se procurer les rapports sous couverture cartonnee .
• Cover design by Christine Rusk
Canadian Technical Report of Fisheries and Aquatic Sciences 1915
1993
Atlas of the biology and distribution of the Sea scallop Placopecten mageUanicus and
Iceland scallop Chlamys islandica in the Northwest Atlantic.
by
G. A.P. Black, R.K. Mohn, G. Robert, and M.J. Tremblay
Department of Fisheries and Oceans Scotia Fundy Region
Biological Sciences Branch P.O. Box 550
Halifax, Nova Scotia B3J 2S7
©Minister of Supply and Services Canada 1993 Cat. No. Fs 97-6/1915E ISSN 0706-6457
Correct citation for this publication:
Black, G. A. P., R. K. Mohn, G. Robert, and M. J. Tremblay. 1993. Atlas of the biology and distribution of the Sea scallop Placopecten magellanicus and Iceland scallop Chlamys islandica in the Northwest Atlantic. Can. Tech. Rep. Fish. Aquat. Sci. 1915: 40 p.

Contents
List of Tables ........................................................................................................................................................ iv
List of Figures ....................................................................................................................................................... iv
AbstractfResume .................................................................................................................................................... v
Preface ................................................................................................................................................................... vi
Introduction ............................................................................................................................................................ 1
Data Presentation ................................................................................................................................................... 1
Classification ............................................................................................................................................... , .......... 2
Biology ................ , ..... , ......................................................... , .................................................. , ............................... 3
Anatomy ................................................................................................................ , .......................................... 3
Life History Synopsis ....... , ................................................................................................................................. 3
Distribution ....................................................................................................................................................... 3
Interactions with Other Species ........................................................................................................................... 4
Growth .......................... , .................................................................................................................................. 4
Reproduction ....................... , ............................................................................................................................. 5
Early Life Stages ............................................................................................................................................... 5
Post Larval Stages ............................................................................................................................................. 6
Physiology ........................................................................................................................................................ 6
Meat Quality ..................................................................................................................................................... 6
Fishery .................................................................................................................................................................... 7
History .............................................................................................................................................................. 7
Trends .............................................................................................................................................................. 7
Catches ............................................................................................................................................................. 7
Fisheries Management ........................................................................................................................................ 8
Utilization ......................................................................................................................................................... 8
Future Prospects .......................................................................................... ··.·· ... ·.·· ...... · ........................................ 8
Acknowledgments .................................................................................................................................................. 8
References ............................................................................................................................................................ 32
iii
i
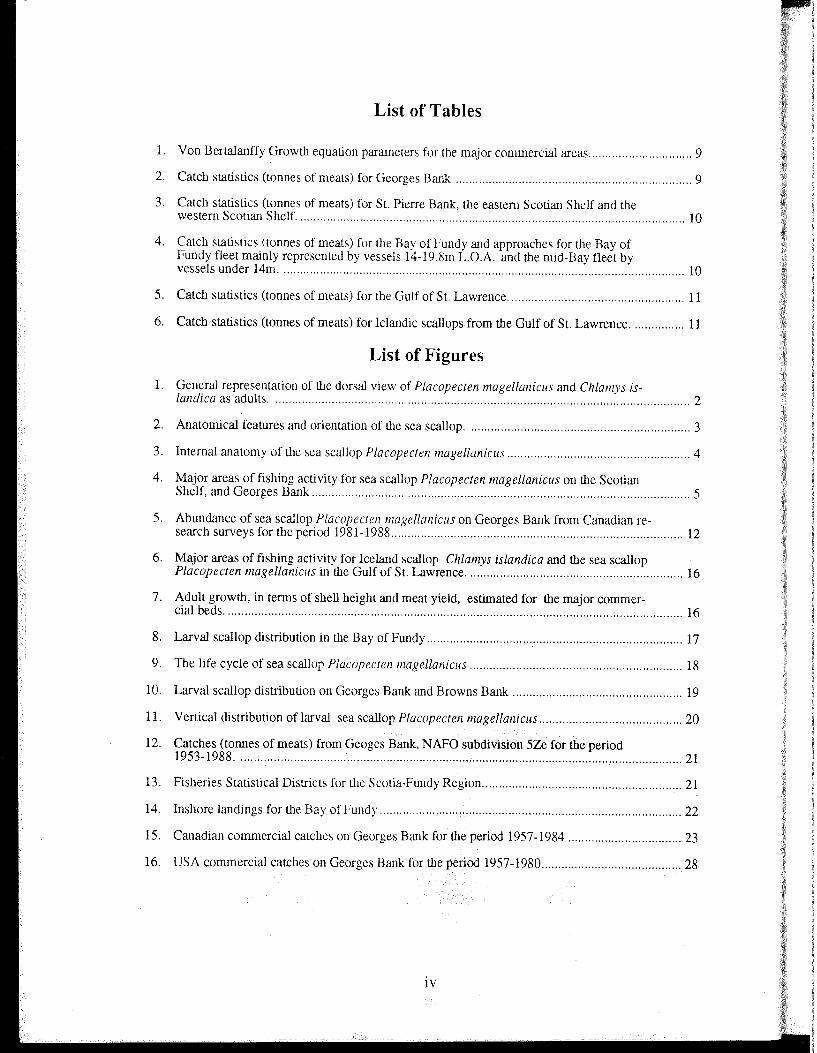
List of Tables
1. Von Bertalanffy Growth equation parameters for the major commercial areas ............................... 9
2. Catch statistics (tonnes of meats) for Georges Bank ....................................................................... 9
3. Catch statistics (tonnes of meats) for St. Pierre Bank, the eastern Scotian Shelf and the western Scotian Shelf. .................................................................................................................... 10
4. Catch statistics (tonnes of meats) for the Bay of Fundy and approaches for the Bay of Fundy fleet mainly represented by vessels 14-19.8m L.O.A. and the mid-Bay fleet by vessels under 14m .......................................................................................................................... 10
5. Catch statistics (tonnes of meats) for the Gulf of St. Lawrence ..................................................... 11
6. Catch statistics (tonnes of meats) for Iclandic scallops from the Gulf of St. Lawrence ................ 11
List of Figures
1. General representation of the dorsal view of Placopecten magelianicus and Chlamys is-landica as adults .............................................................................................................................. 2
2. Anatomical features and orientation of the sea scallop ................................................................... 3
3. Internal anatomy of the sea scallop Placopecten magellaniclls ....................................................... 4
4. Major areas of fishing activity for sea scallop Placopecten magellanicus on the Scotian Shelf, and Georges Bank .................................................................................................................. 5
5. Abundance of sea scallop Placopectell lIlagellaniclls on Georges Bank from Canadian re-search surveys for the period 1981-1988 ........................................................................................ 12
6. Major areas of fishing activity for Iceland scallop Chlamys islandica and the sea scallop Placopecten magellanicus in the Gulf of St. Lawrence ................................................................. 16
7. Adult growth, in terms of shell height and meat yield, estimated for the major commer-cial beds .......................................................................................................................................... 16
8. Larval scallop distribution in the Bay of Fundy ............................................................................. 17
9. The life cycle of sea scallop Placopecten magellaniclls ................................................................ 18
10. Larval scallop distribution on Georges Bank and Browns Bank ................................................... 19
11. Vertical distribution of larval sea scallop Placopecten magellanicus ........................................... 20
12. Catches (tonnes of meats) from Geoges Bank, NAFO subdivision 5Ze for the period 1953-1988 ...................................................................................................................................... 21
13. Fisheries Statistical Districts for the Scotia-Fundy Region ............................................................ 21
14. Inshore landings for the Bay of Fundy ........................................................................................... 22
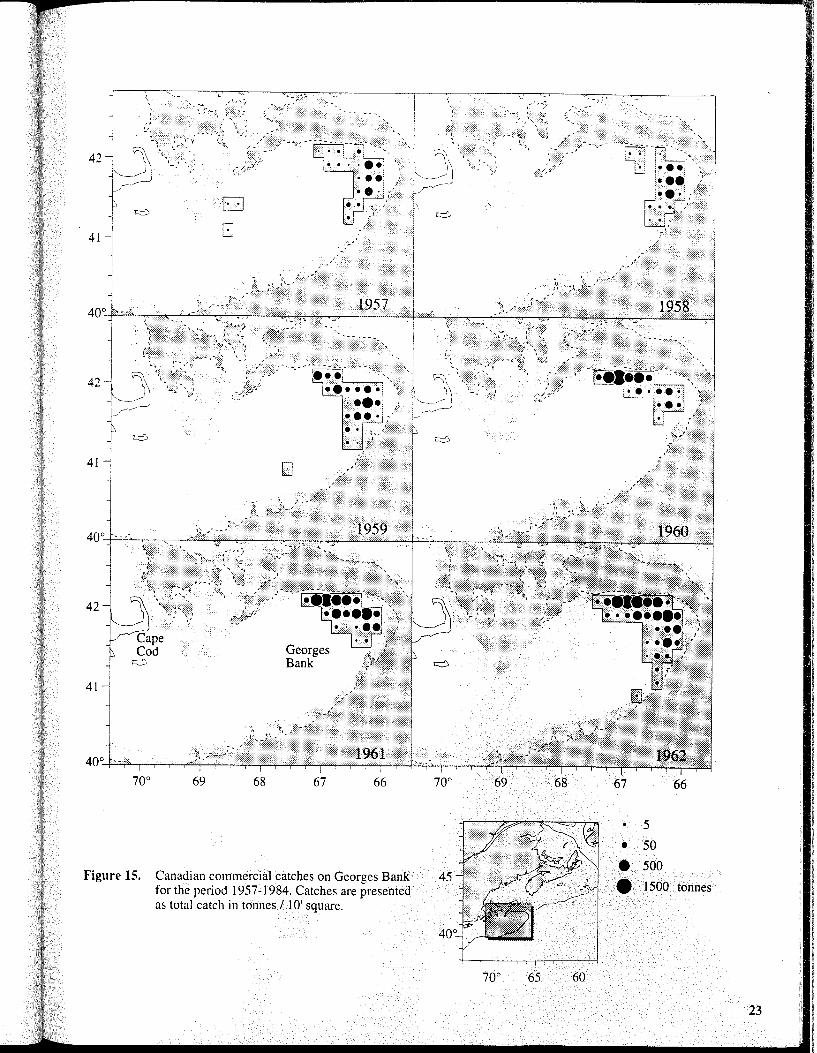
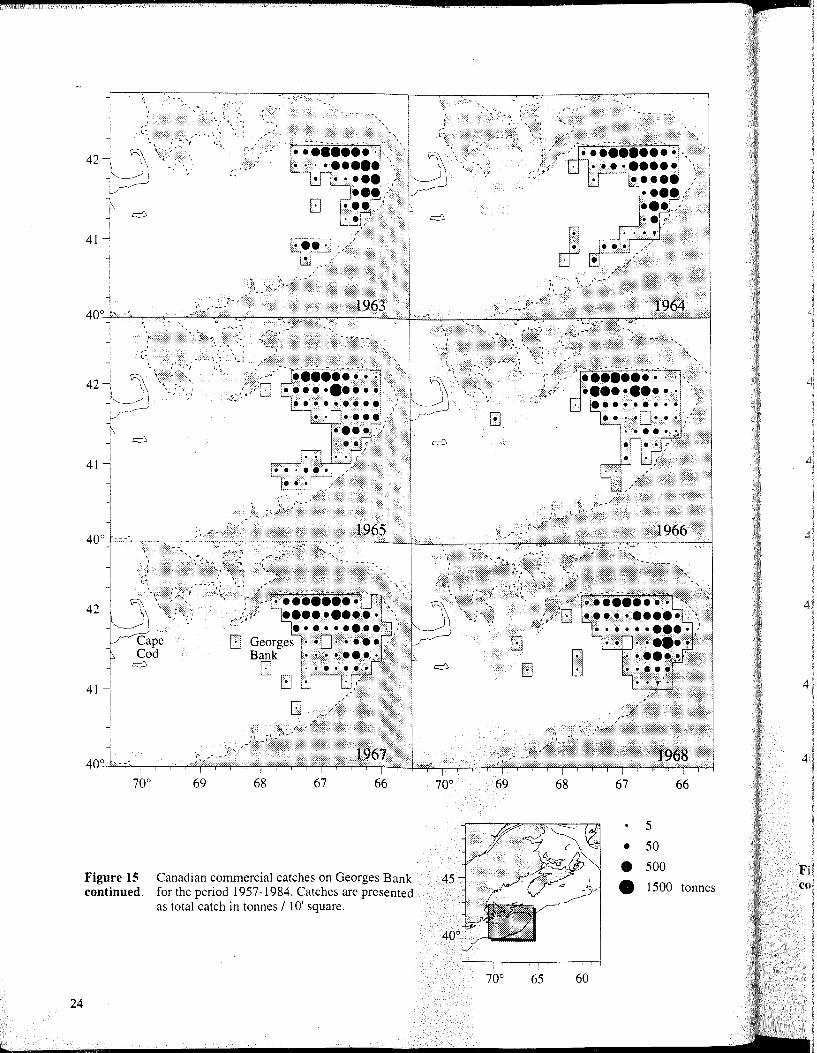
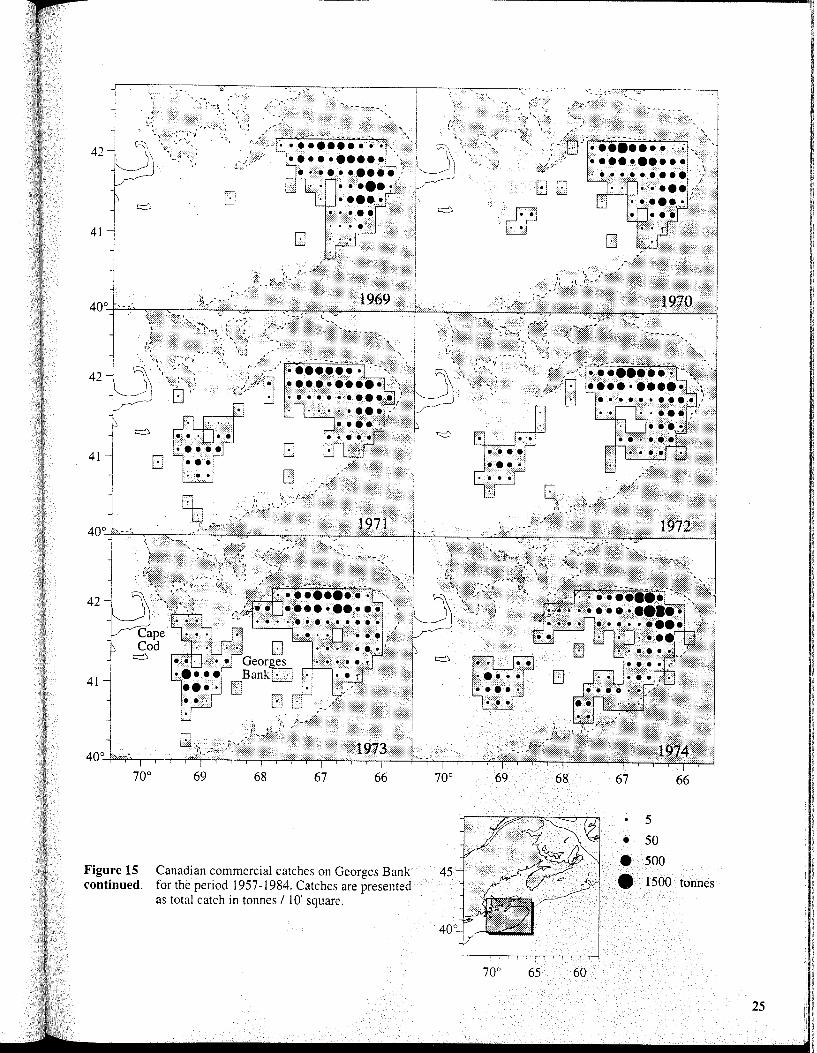
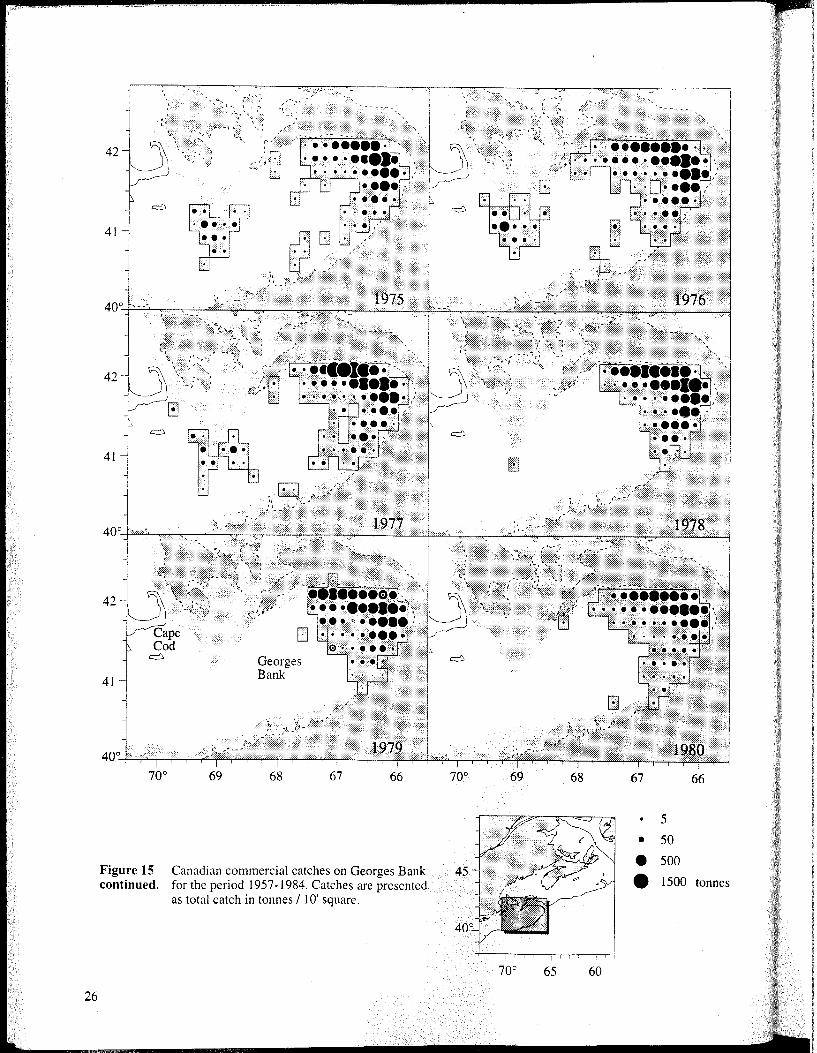
15. Canadian commercial catches on Georges Bank for the period 1957-1984 .................................. 23
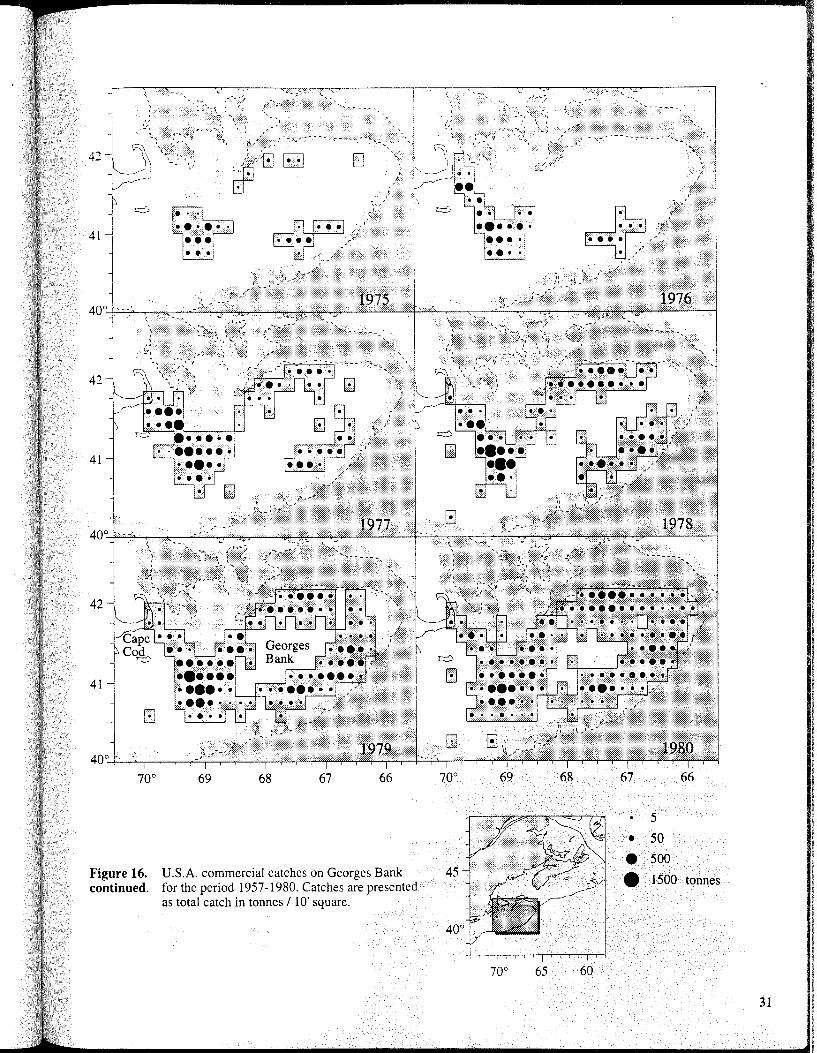
16. USA commercial catches on Georges Bank for the period 1957-1980 .......................................... 28
iv
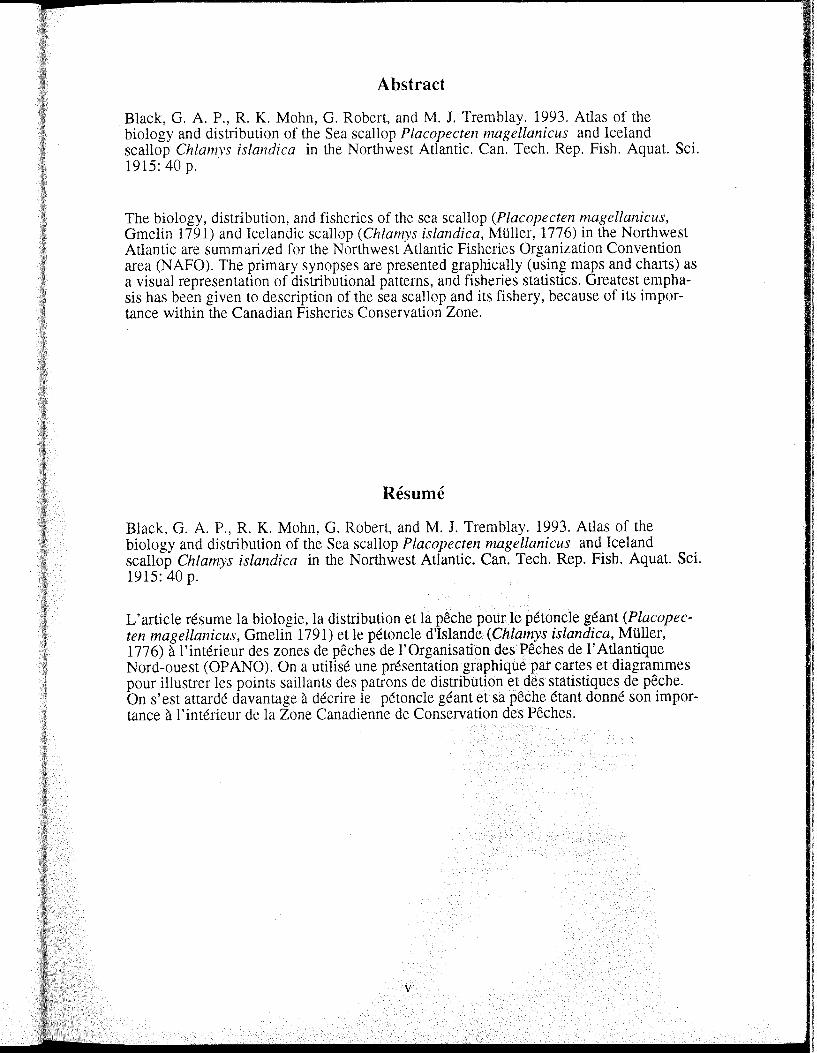
Abstract
Black, G. A. P., R. K. Mohn, G. Robert, and M. 1. Tremblay. 1993. Atlas of the biology and distribution of the Sea scallop Placopecten magellanicus and Iceland scallop Chlamys islandica in the Northwest Atlantic. Can. Tech. Rep. Fish. Aquat. Sci. 1915: 40 p.
The biology, distribution, and fisheries of the sea scallop (Placopecten magellanicus, Gmelin 1791) and Icelandic scallop (Chlamys islandica, MUller, 1776) in the Northwest Atlantic are summarized for the Northwest Atlantic Fisheries Organization Convention area (NAFO). The primary synopses are presented graphically (using maps and charts) as a visual representation of distributional patterns, and fisheries statistics. Greatest emphasis has been given to description of the sea scallop and its fishery, because of its importance within the Canadian Fisheries Conservation Zone.
Resume
Black, G. A. P., R. K. Mohn, G. Robert, and M. 1. Tremblay. 1993. Atlas of the biology and distribution of the Sea scallop Placopecten magellanicus and Iceland scallop Chlamys islandica in the Northwest Atlantic. Can. Tech. Rep. Fish. Aquat. Sci. 1915: 40 p.
L'article resume la biologie, la distribution et la peche pour Ie petoncle geant (Placopecten magellanicus, Gmelin 1791) et Ie petoncle d'Isiande (Chlamys islandica, MUller, 1776) a l'interieur des zones de peches de 1'0rganisation des Peches de l' Atlantique Nord-ouest (OPANO). On a utilise une presentation graphique par cartes et diagrammes pour illustrer Ies points saillants des patrons de distribution et des statistiques de peche. On s'est attarde davantage a decrire Ie petoncle geant et sa peche etant donne son importance a l'interieur de Ia Zone Canadienne de Conservation des Peches.
v
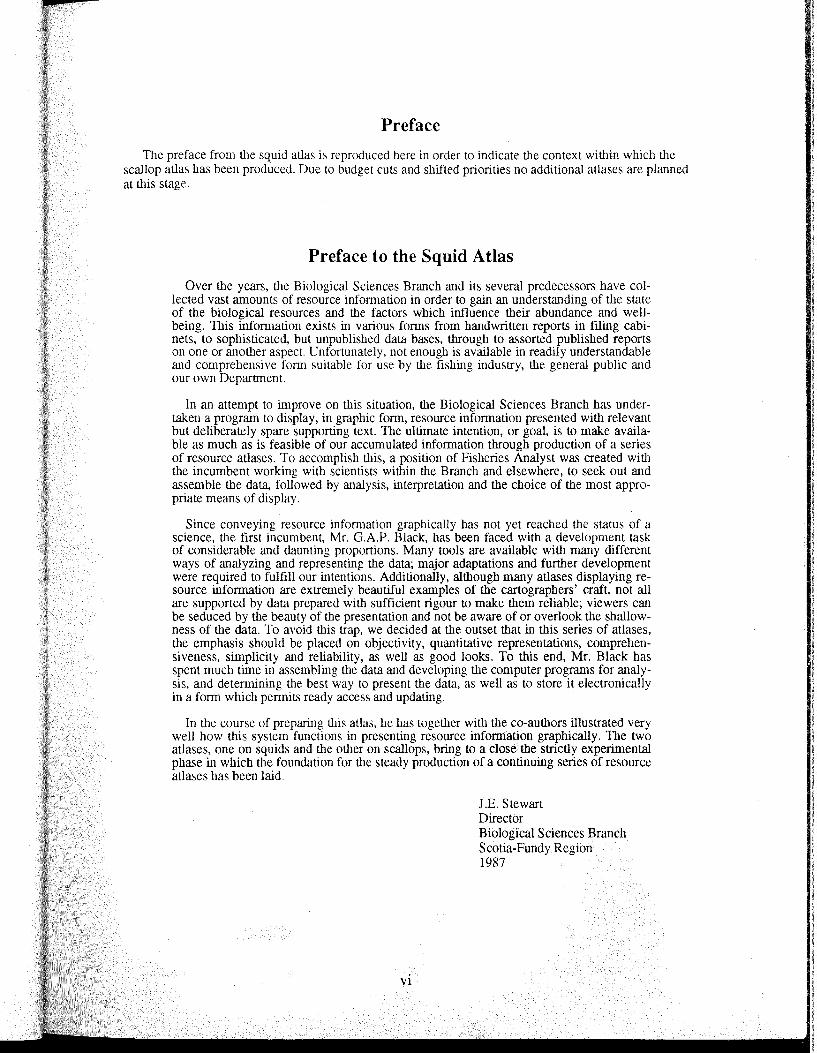
Preface
TIle preface from the squid atlas is reproduced here in order to indicate the context within which the scallop atlas has been produced. Due to budget cuts and shifted priorities no additional atlases are planned at this stage.
Preface to the Squid Atlas
Over the years, the Biological Sciences Branch and its several predecessors have collected vast amounts of resource information in order to gain an understanding of the state of the biological resources and the factors which influence their abundance and wellbeing. This information exists in various forms from handwritten reports in filing cabinets, to sophisticated, but unpublished data bases, through to assorted published reports on one or another aspect. Unfortunately, not enough is available in readily understandable and comprehensive form suitable for use by the fishing industry, the general public and our own Department.
In an attempt to improve on this situation, the Biological Sciences Branch has undertaken a program to display, in graphic form, resource information presented with relevant but deliberately spare supporting text. The ultimate intention, or goal, is to make available as much as is feasible of our accumulated information through production of a series of resource atlases. To accomplish this, a position of Fisheries Analyst was created with the incumbent working with scientists within the Branch and elsewhere, to seek out and assemble the data, followed by analysis, interpretation and the choice of the most appropriate means of display.
Since conveying resource information graphically has not yet reached the status of a science, tlle first incumbent, Mr. G.A.P. Black, has been faced with a development task of considerable and daunting proportions. Many tools are available with many different ways of analyzing and representing the data; major adaptations and further development were required to fulfill our intentions. Additionally, although many atlases displaying resource information are extremely beautiful examples of the cartographers' craft, not all are supported by data prepared with sufficient rigour to make them reliable; viewers can be seduced by the beauty of the presentation and not be aware of or overlook the shallowness of the data. To avoid this trap, we decided at the outset that in this series of atlases, the emphasis should be placed on objectivity, quantitative representations, comprehensiveness, simplicity and reliability, as well as good looks. To this end, Mr. Black has spent much time in assembling the data and developing the computer programs for analysis, and detennining the best way to present the data, as well as to store it electronically in a form which pennits ready access and updating.
In the course of preparing this atlas, he has together with the co-authors illustrated very well how this system functions in presenting resource information graphically. The two atlases, one on squids and the other on scallops, bring to a close the strictly experimental phase in which tlle foundation for the steady production of a continuing series of resource atlases has been laid.
vi
J.E. Stewart Director Biological Sciences Branch Scotia-Fundy Region 1987

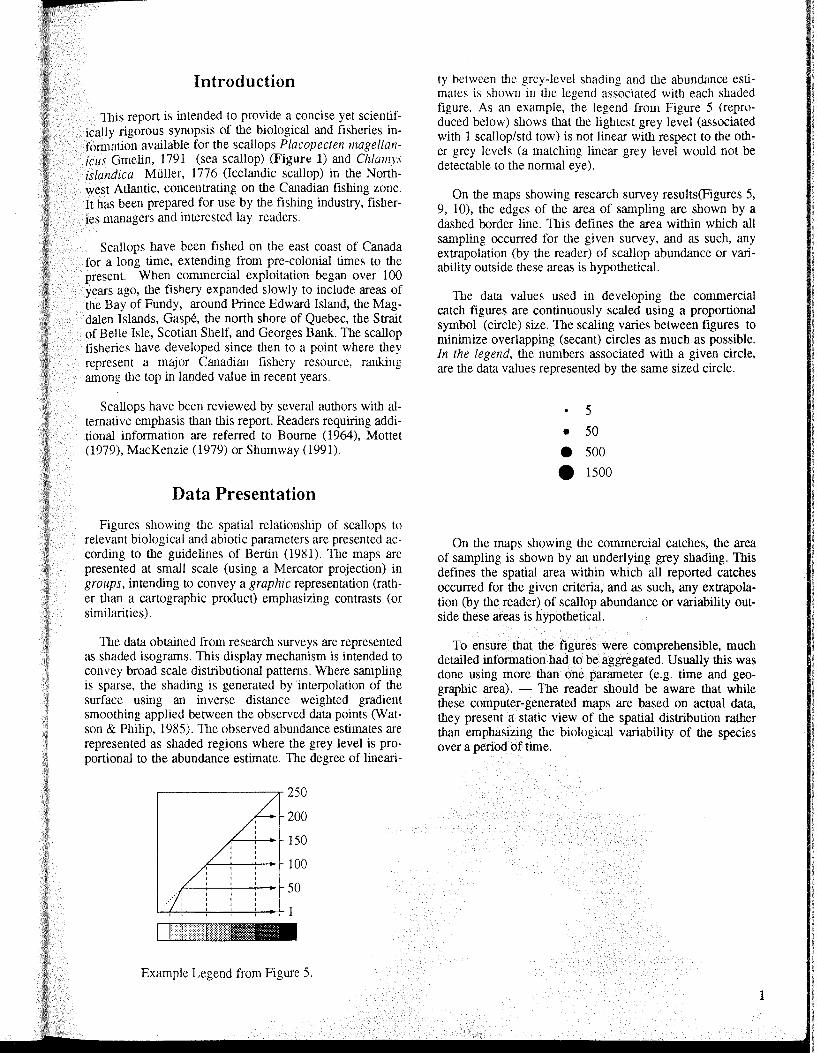
Introduction
This report is intended to provide a concise yet scientifically rigorous synopsis of the biological and fisheries information available for the scallops Placopecten magellanicus Gmelin, 1791 (sea scallop) (Figure 1) and ChlalllYs islandica Muller, 1776 (Icelandic scallop) in the Northwest Atlantic, concentrating on the Canadian fishing zone. It has been prepared for use by the fishing industry, fisheries managers and interested lay readers.
Scallops have been fished on the east coast of Canada for a long time, extending from pre-colonial times to the present. Wben commercial exploitation began over 100 years ago, the fishery expanded slowly to include areas of the Bay of Fundy, around Prince Edward Island, the Magdalen Islands, Gaspe, the north shore of Quebec, the Strait of Belle Isle, Scotian Shelf, and Georges Bailie The scallop fisheries have developed since then to a point where they represent a major Canadian fishery resource, ranking among the top in landed value in recent years.
Scallops have been reviewed by several authors with alternative emphasis than this report. Readers requiring additional information are referred to Bourne (1964), Mottet (1979), MacKenzie (1979) or Shumway (1991).
Data Presentation
Figures showing tlle spatial relationship of scallops to relevant biological and abiotic parameters are presented according to the guidelines of Bertin (1981). The maps are presented at small scale (using a Mercator projection) in groups, intending to convey a graphic representation (rather than a cartographic product) emphasizing contrasts (or similarities) .
The data obtained from research surveys are represented as shaded isograms. This display mechanism is intended to convey broad scale distributional patterns. Wbere sampling is sparse, the shading is generated by interpolation of the surface using an inverse distance weighted gradient smootl1ing applied between tl1e observed data points (Watson & Philip, 1985). The observed abundance estimates are represented as shaded regions where the grey level is proportional to the abundance estimate. The degree of lineari-
,--------;;r 250
200
150
100
50
Example Legend from Figure 5.
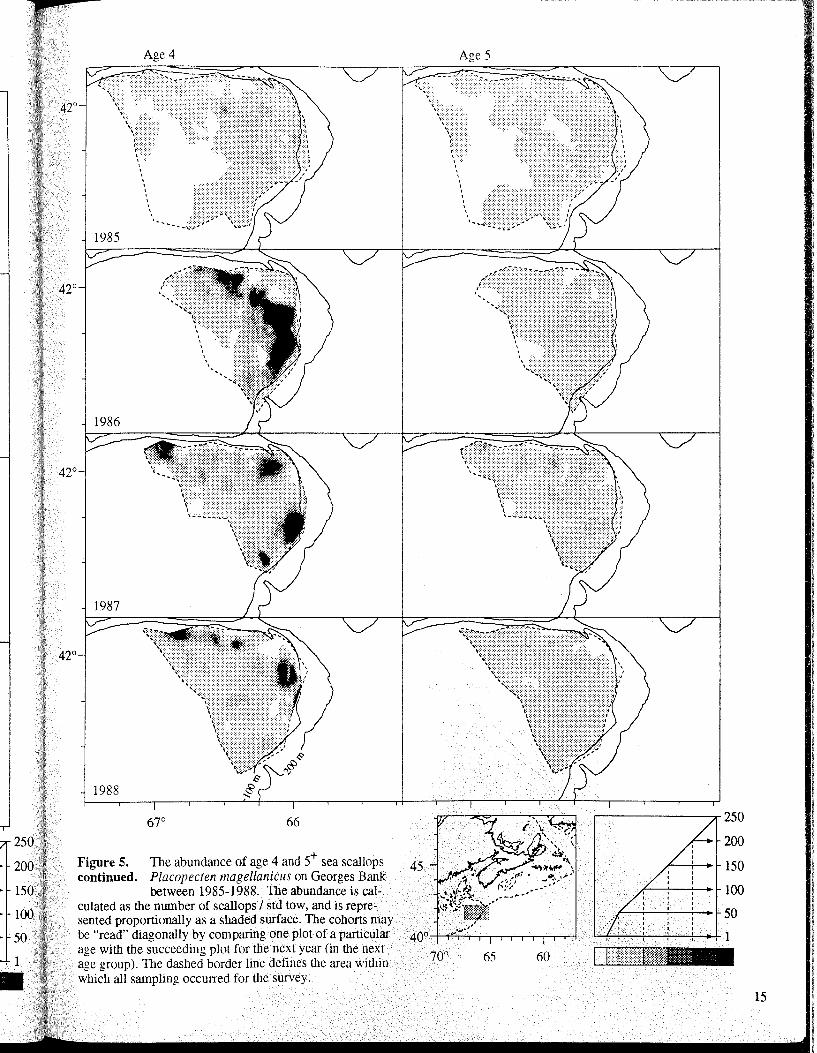
ty between the grey-level shading and tl1e abundance estimates is shown in tl1e legend associated witl1 each shaded figure. As an example, tl1e legend from Figure 5 (r~produced below) shows iliat tl1e lightest grey level (asSOClllted with 1 scallop/std tow) is not linear witl1 respect to tl1e otl1-er grey levels (a matching linear grey level would not be detectable to tl1e normal eye).
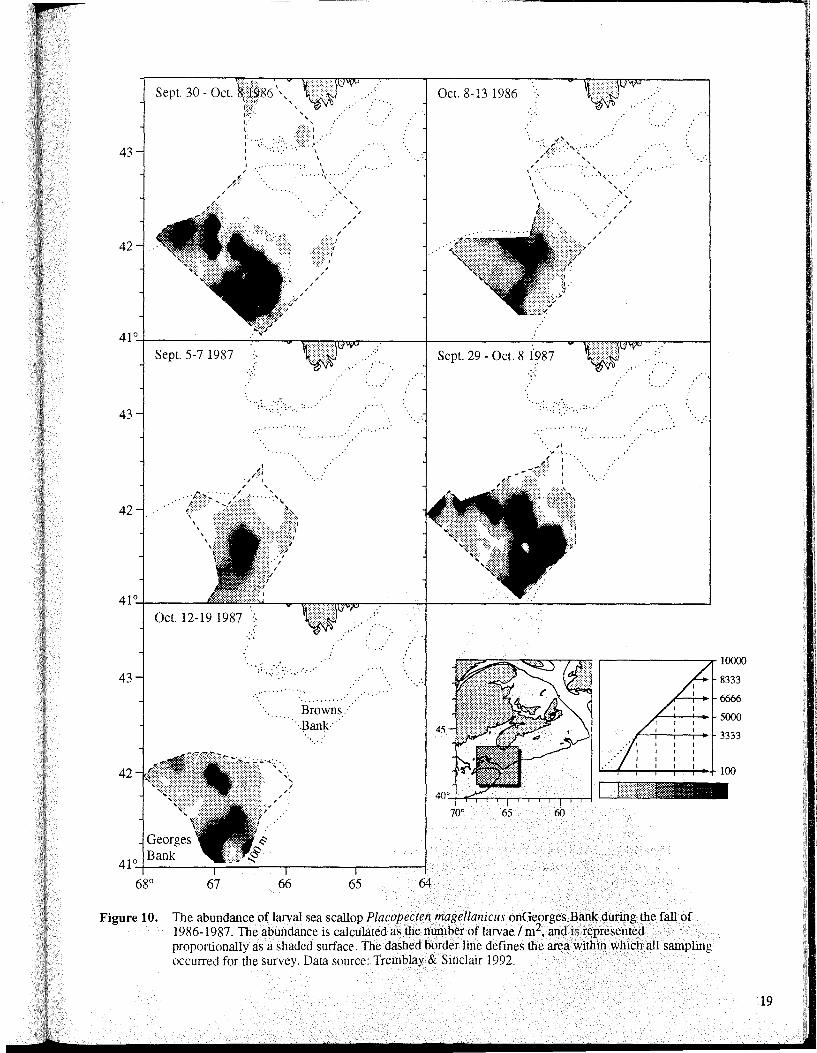
On tl1e maps showing research survey results(Figures 5, 9, 10), tl1e edges of tl1e area of sampling are shown by a dashed border line. This defines tl1e area within which all sampling occurred for tl1e given survey, and as such, any extrapolation (by tl1e reader) of scallop abundance or variability outside these areas is hypothetical.
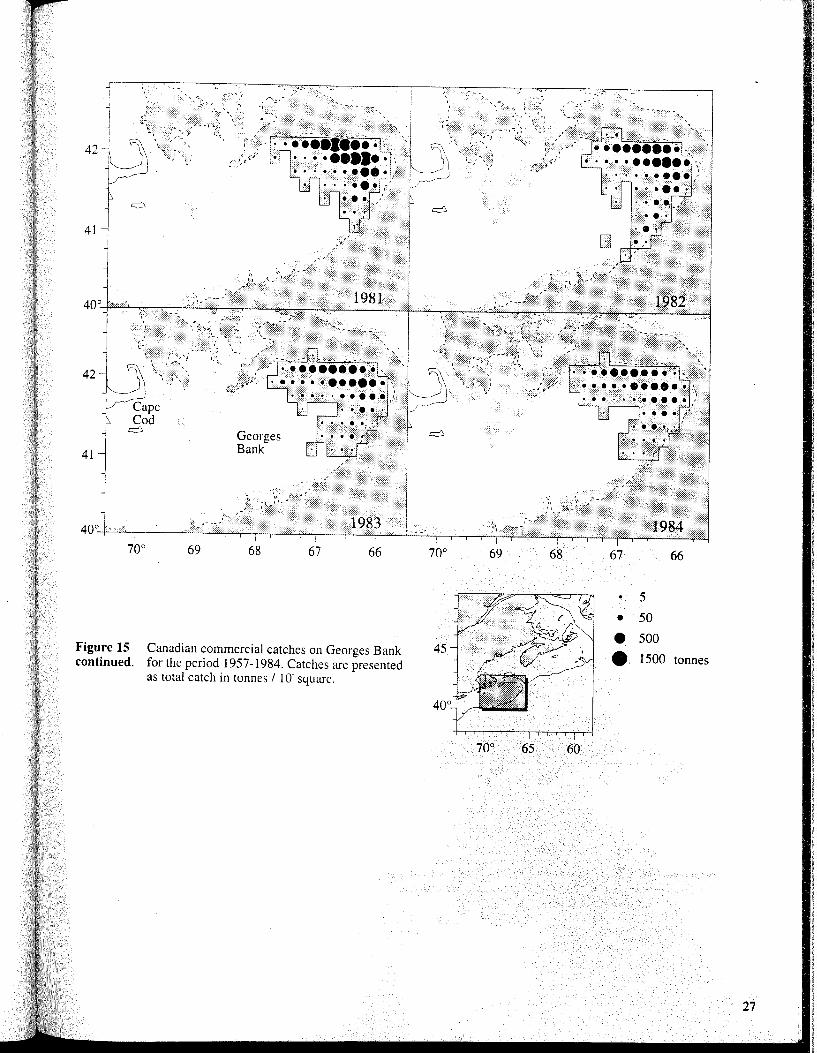
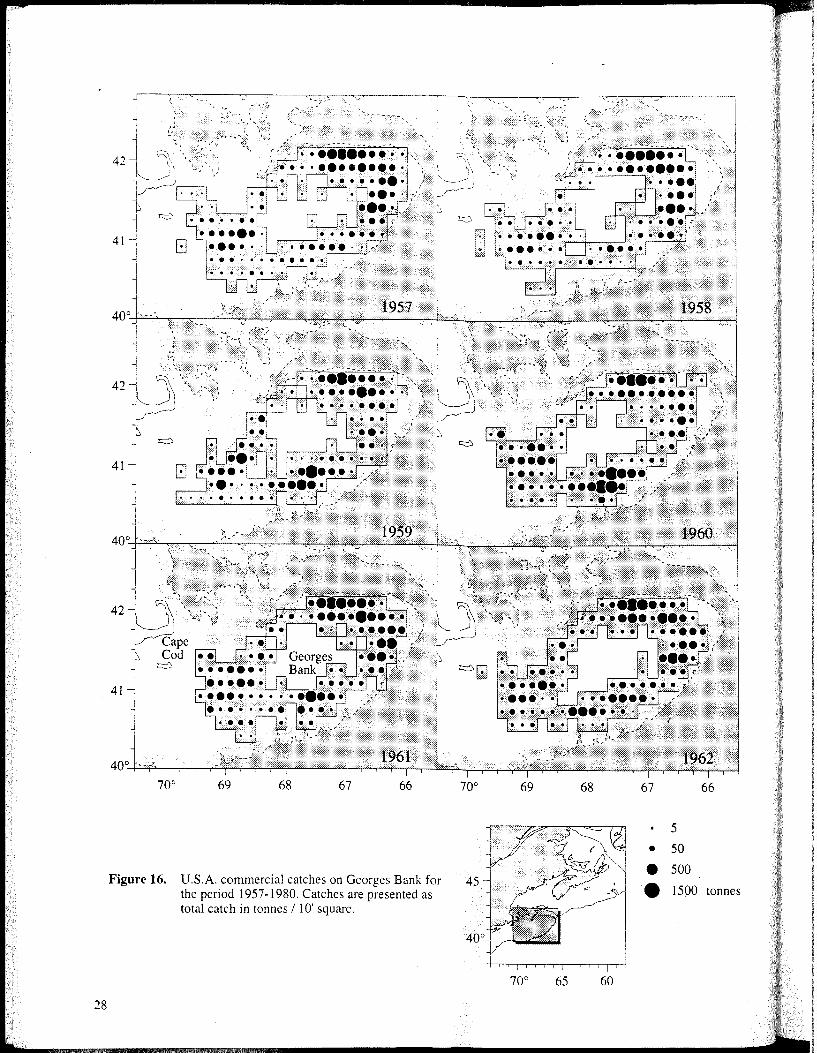
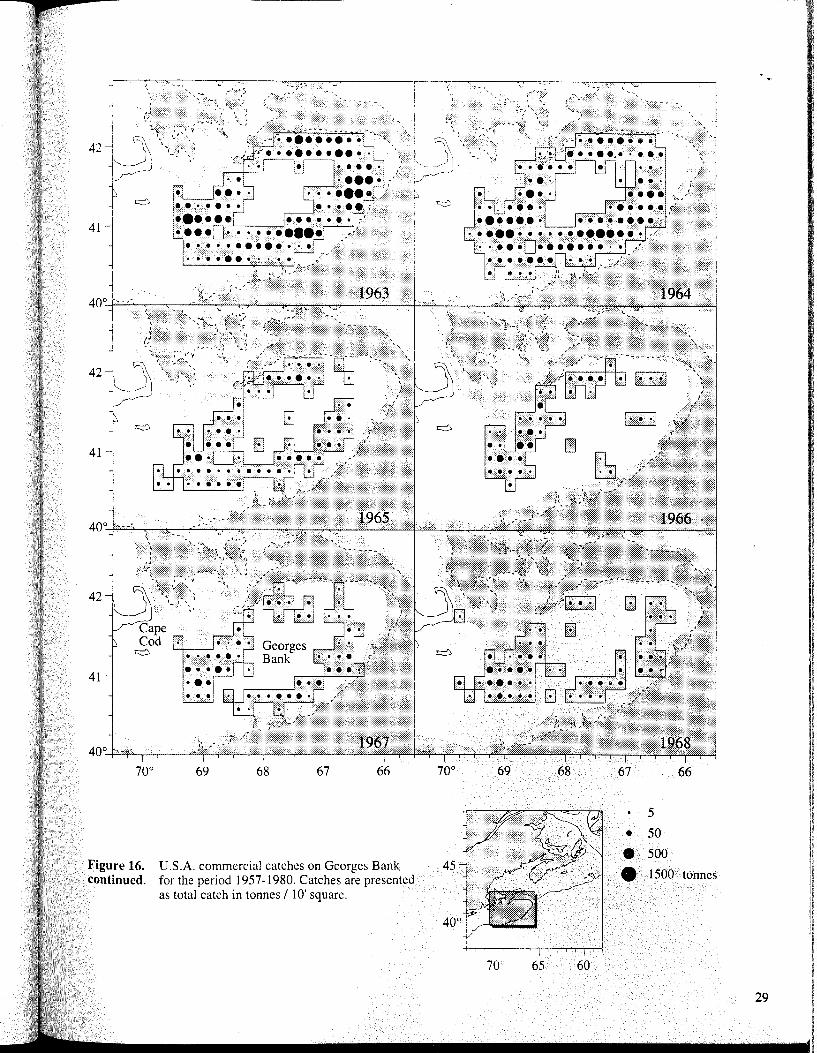
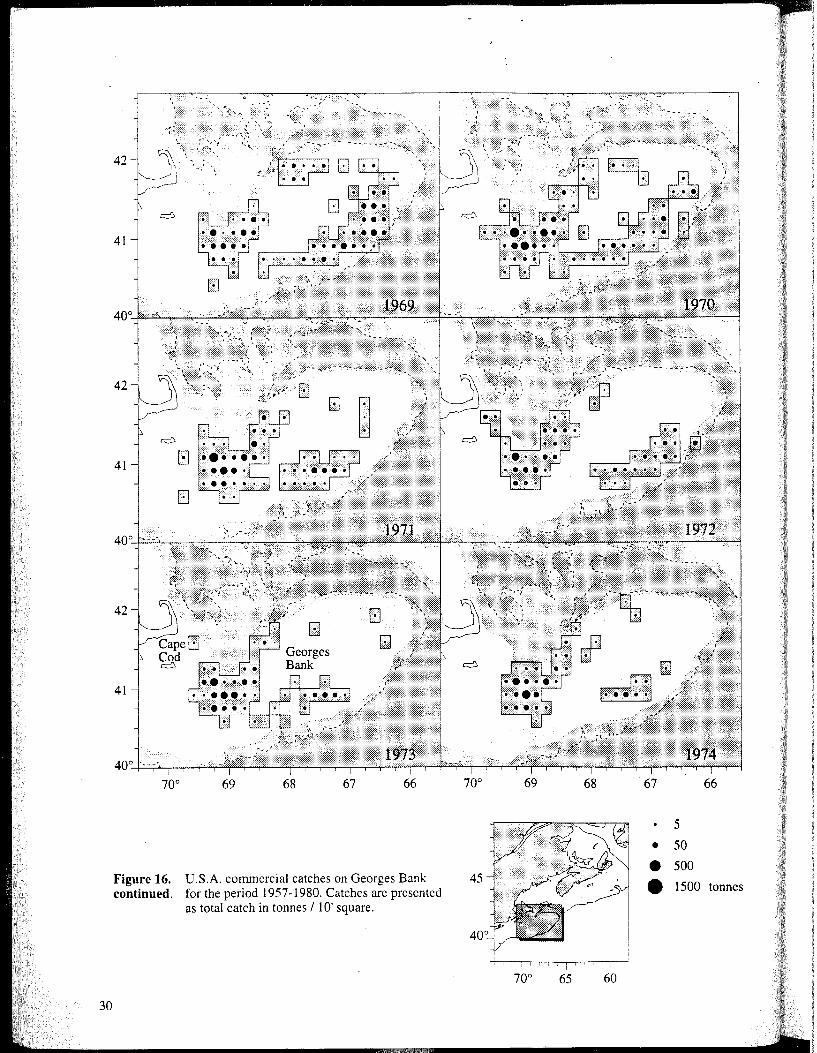
The data values used in developing tl1e commercial catch figures are continuously scaled using a proportional symbol (circle) size. The scaling varies between figures to minimize overlapping (secant) circles as much as possible. In the legend, tl1e numbers associated witl1 a given circle, are tl1e data values represented by tl1e same sized circle.
5
• 50
• 500
• 1500
On tl1e maps showing tl1e commercial catches, tl1e area of sampling is shown by an underlying grey shading. This defines tl1e spatial area within which all reported catcbes occurred for tl1e given criteria, and as such, any extrapolation (by tl1e reader) of scallop abundance or variability outside these areas is bypotl1etical.
To ensure tl1at tl1e figures were comprehensible, mucb detailed information bad to be aggregated. Usually this was done using more than one parameter (e.g. time and geographic area). - The reader sbould be aware tl1at while tl1ese computer-generated maps are based on actual data, tl1ey present a static view of tl1e spatial distribution ratl1er ilian emphasizing tl1e biological variability of tl1e species over a period of time.
1
2
Classification
lOcm
Sea scallop - Placopecten magellaniellS Icelandic scallop - Chlamys islandiea
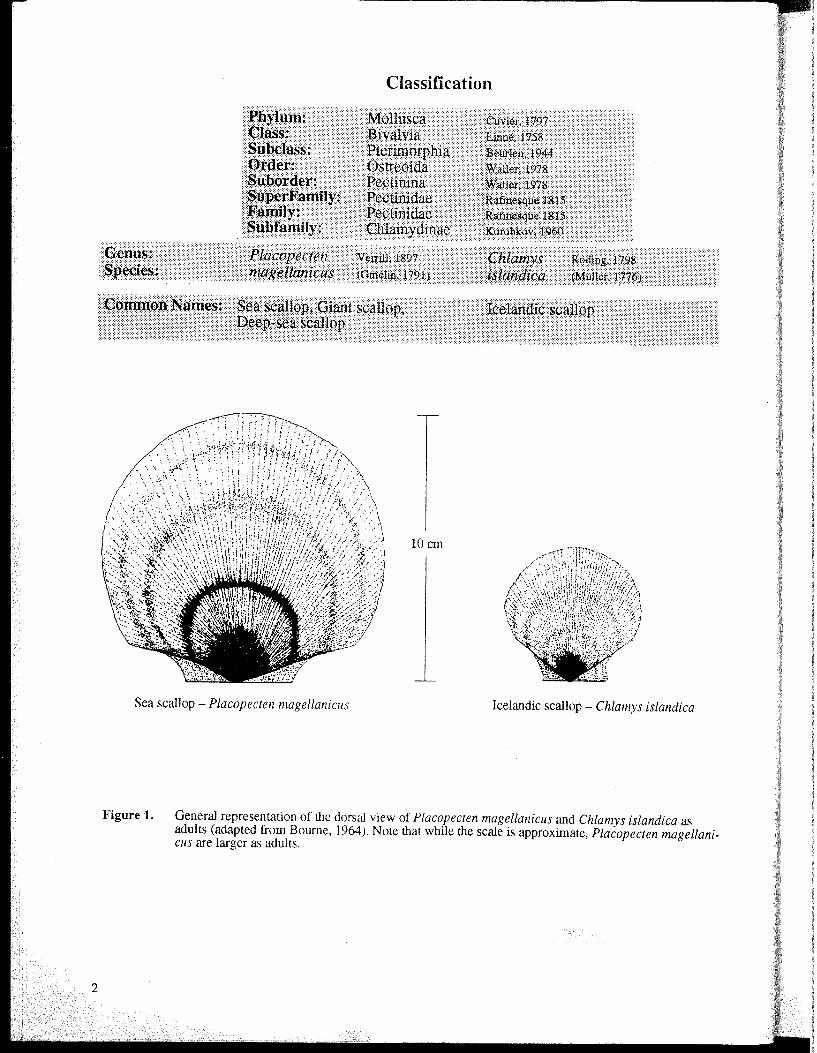
Figure 1. General representation of the dorsal view of Plaeopeeren magelianiells and Clzlamys islandica as adults (adapted from Bourne, 1964). Note that while the scale is approximate, Placopecten mageUanieus are larger as adults.
Biology
This biological overview describes both sea and Icelandic scallops. In generaL sea scallops are presented first. followed by a description of Icelandic scallops. If scallops are mentioned and the species is not identified. it may be assumed that the term applies to both species.
Anatomy
As illustrated in Figure 1, Sea scallops are much larger than Icelandic scallops. The former will attain a shell height of 21 cm (Mottet 1979, see ref. to Norton 1931) while Icelandic scallops rarely exceed 10 cm (Vahl, 1981). The Icelandic scallops usually have smaller adductor muscles (meats) compared to sea scallops. The smaller meat production. combined with their slow growth rate, makes them a less desirable species for exploitation.
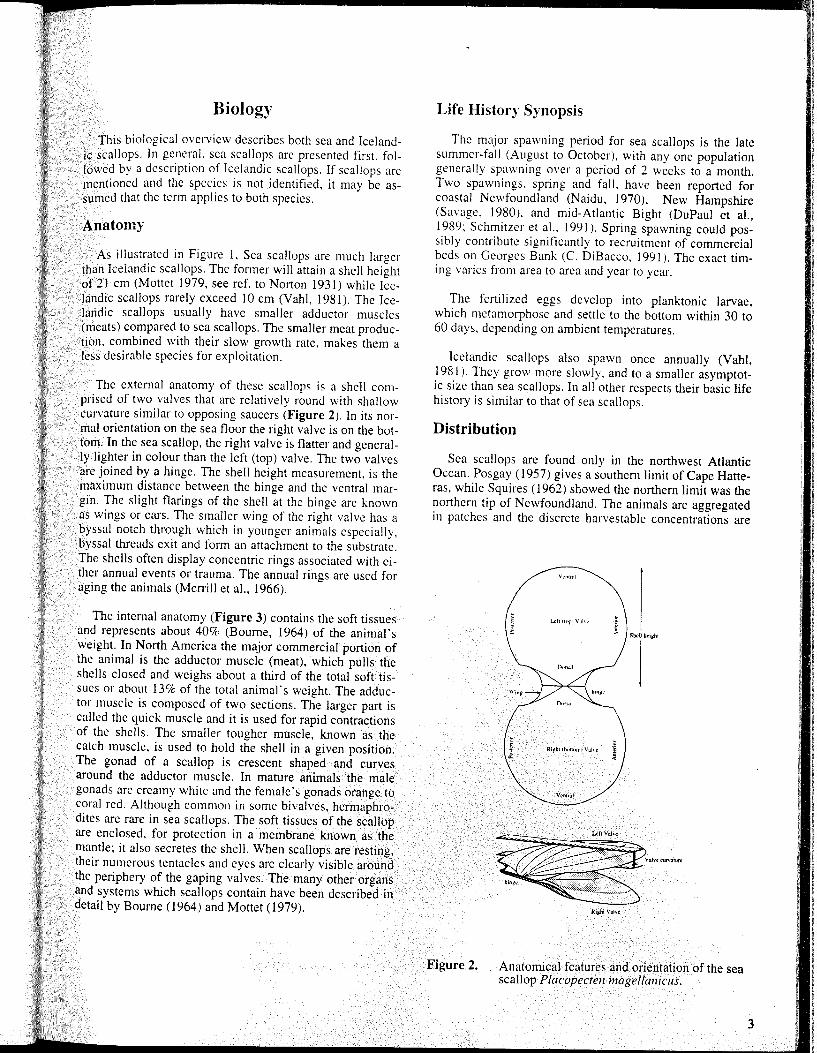
The external anatomy of these scallops is a shell comprised of two valves that are relatively round with shallow curvature similar to opposing saucers (Figure 2). In its normal orientation on the sea floor the right valve is on the bottom. In the sea scallop, the right valve is flatter and generally lighter in colour than the left (top) valve. The two valves are joined by a hinge. The shell height measurement, is the maximum distance between the hinge and the ventral margin. The slight flarings of the shell at the hinge are known as wings or ears. The smaller wing of the right valve has a byssal notch through which in younger animals especially. byssal threads exit and form an attachment to the substrate. The shells often display concentric rings associated with either annual events or trauma. The annual rings are used for aging the animals (Merrill et aI., 1966).
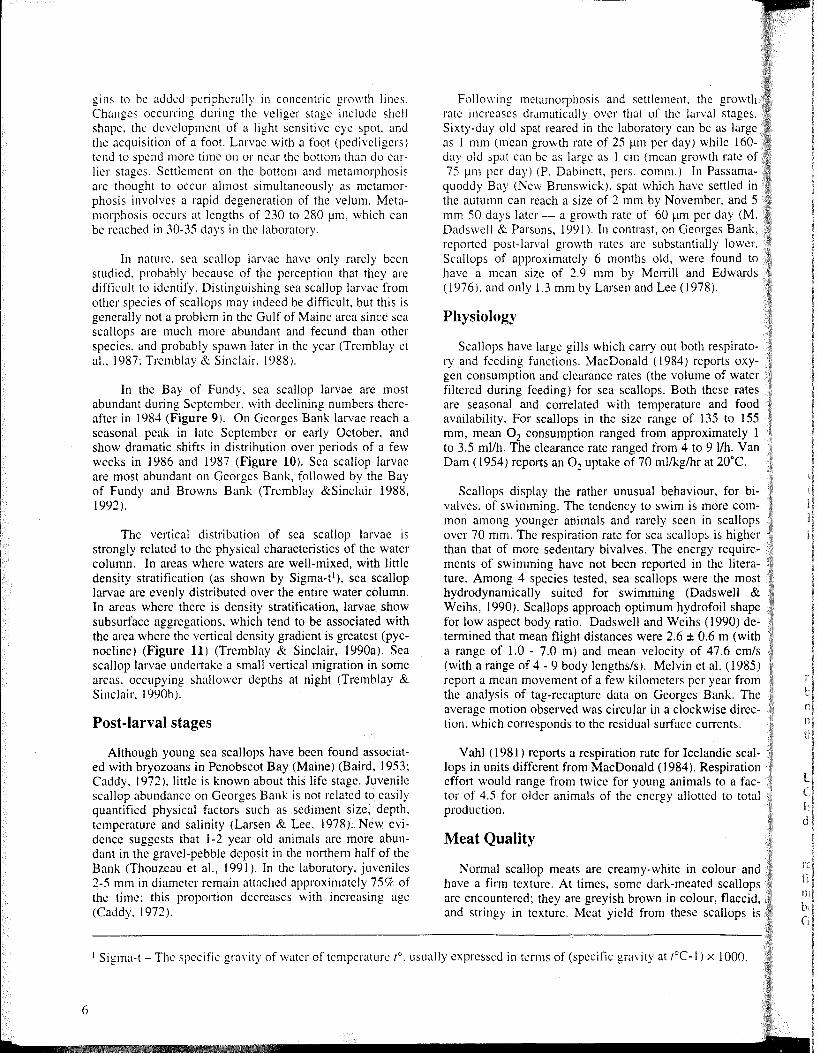
The internal anatomy (Figure 3) contains the soft tissues and represents about 40% (Bourne, 1964) of the animal's weight. In North America the major commercial portion of the animal is the adductor muscle (meat), which pulls the shells closed and weighs about a third of the total soft tissues or about 13% of the total animal's weight. The adductor muscle is composed of two sections. The larger part is called the quick muscle and it is used for rapid contractions of the shells. The smaller tougher muscle, known as the catch muscle, is used to hold the shell in a given position. The gonad of a scallop is crescent shaped and curves around the adductor muscle. In mature animals the male gonads are creamy white and the female's gonads orange to coral red. Although common in some bivalves, hermaphrodites are rare in sea scallops. The soft tissues of the scallop are enclosed, for protection in a membrane known as the mantle; it also secretes the shell. When scallops are resting, their numerous tentacles and eyes are clearly visible around the periphery of the gaping valves. The many other organs and systems which scallops contain have been described in detail by Bourne (1964) and Mottet (1979).
Life History Synopsis
The major spawning period for sea scallops is the late summer-fall (August to October). with anyone popUlation generally spmvning over a period of 2 weeks to a month. Two spawnings, spring and fall, have been reported for coastal Newfoundland (Naidu, 1970), New Hampshire (Savage, 1980), and mid-Atlantic Bight (DuPaul et aI., 1989; Schmitzer et aI., 1991). Spring spawning could possibly contribute significantly to recruitment of commercial beds on Georges Bank (c. DiBacco, 1991). The exact timing varies from area to area and year to year.
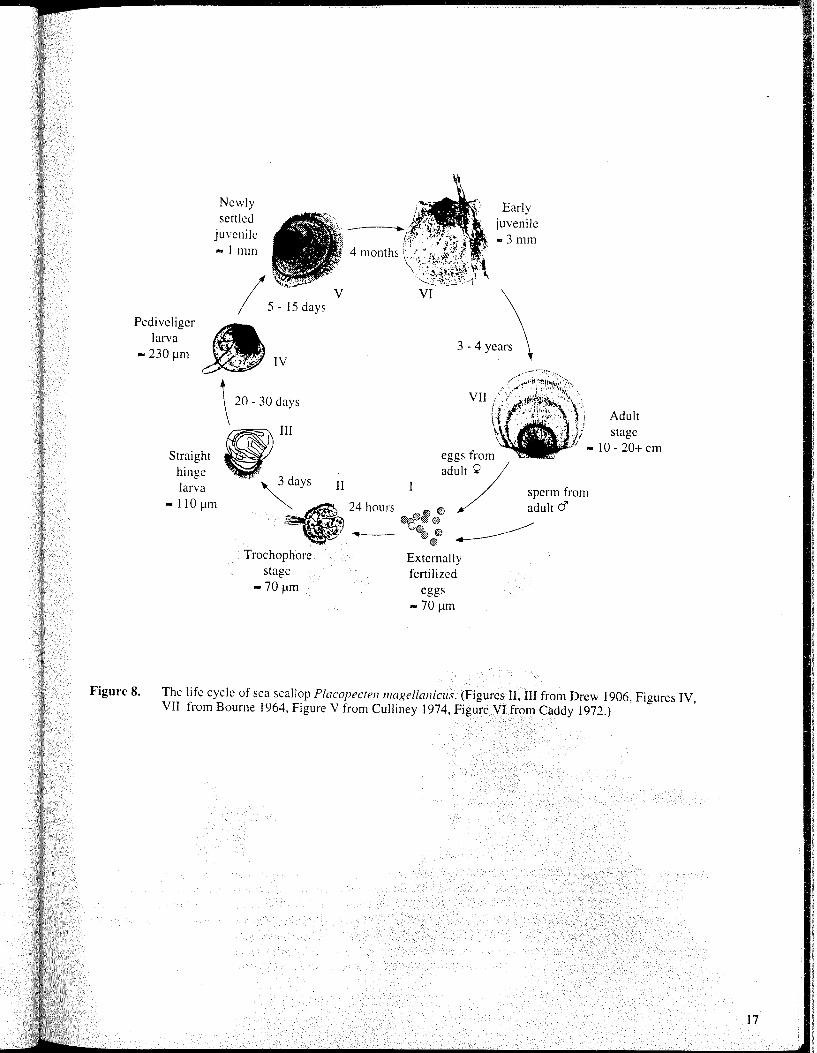
The fertilized eggs develop into planktonic larvae, which metamorphose and settle to the bottom within 30 to 60 days, depending on ambient temperatures.
Icelandic scallops also spawn once annually (Vahl, 1981). They grow more slowly. and to a smaller asymptotic size than sea scallops. In all other respects their basic life history is similar to that of sea scallops.
Distribution
Sea scallops are found only in the northwest Atlantic Ocean. Posgay (1957) gives a southern limit of Cape Hatteras, while Squires (1962) showed the northern limit was the northern tip of Newfoundland. The animals are aggregated in patches and the discrete harvestable concentrations are
StK-U heij,hl
Ri~1 !bunuml Vahc
VcntrJl
Valvecurvatun:
Righi V!lhc
Figure 2. Anatomical features and orientation of the sea scallop Placopecten magellallicus.
3

4
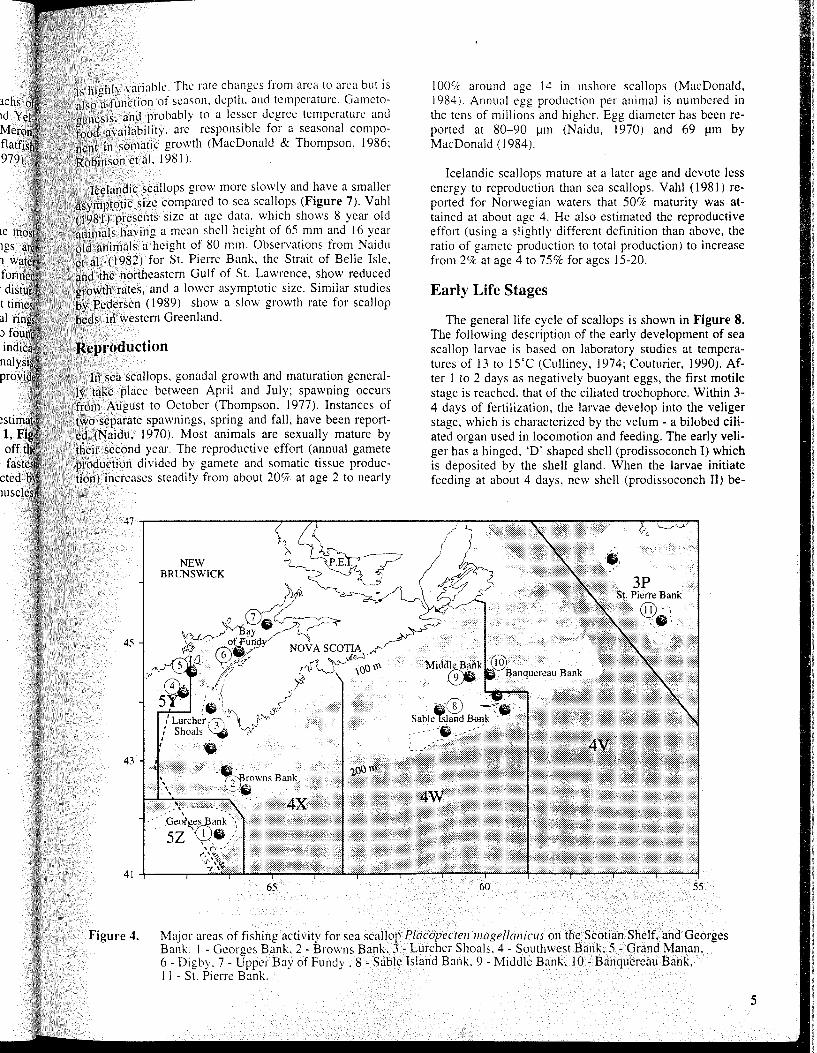
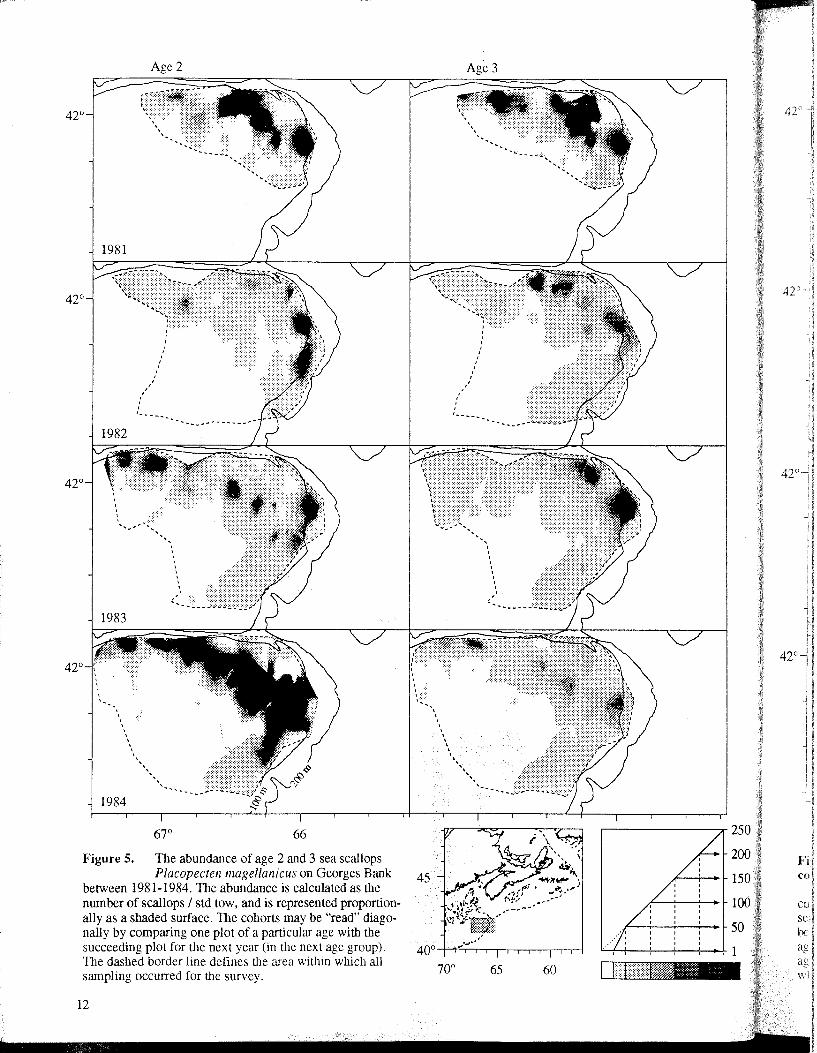
known as beds. Figures .t and 6 show the major areas of fishing activity. The size of scallop beds arc determined in general by the success of spawning and settlement (recruitment) and by the fishing eff0l1 directed toward the individual scallop beds. The variability in population size and discreteness is disce1l1ible for each fishable cohort (year class) observed in the research surveys conducted on Georges Bank (Figure 5).
Icelandic scallops are a circumpolar species (Mottet. 1979) and are usually found in waters as far north as Spitsbergen and have been observed as far south as Cape Cod (Serehuk & Wigley. 1984). Fishing for Icelandic scallops in Canadian waters is concentrated on St. Pien'e Bank. the n0l1he1l1 shore of the Gulf of St. Lawrence. the Strait of Belle Isle. and the Labrador coast (Figure 6).
Interactions with Other Species
Species which the scallops prey upon since they are filter feeders consist of diatoms. protozoans. detritus. and associated bacteria (Mottet, 1979; Shumway et al.. 1987). As well as predator-prey interactions, post-larval and juvenile red hake (Urophysis chuss) usc them as refuges by inhabiting the mantle cavity of sea scallops (Wigley and Theroux. 1971). The relationship is commensal and the well being of the scallop is not compromised by the fish.
Icelandic scallops have been found in the stomachs of American plaice <Hippoglossoides platessoides) and Yel· lowtail flounder (Lil11allda jerrugillea) (Naidu & Meron, 1986). Similarly, sea scallops are predated upon by flatfis and large decapod crustaceans (Elner & Jamieson. 1979).
Growth
The position of exte1l1al rings on the shell is the mosl frequently used age indicator. The annual rings ar formed by a relative slowing of growth rate when wate temperatures drop in the late winter. Rings are also formed by trauma, such as the impact of a fishing dredge or distur. bance from stoms. MacDonald (1984) found that at times, "shock" rings could easily be confused with annual ring and the age overestimated. FUl1her, MacDonald also fou that the annual marks on the ligament were better indica· tors than the external rings. Length frequency analysis, tagging studies, and oxygen-isotope ratio analysis provid other means for estimating growth.
Adult growth. in terms of shell height. has been estimat ed for most of the major commercial beds (Table 1, Fig ure 7). Georges Bank and beds in Port au Port Bay off th west coast of Newfoundland are seen to have the faste growth rate for sea scallops. Adult growth. reflected b changes in meat weight (weight of the adductor museles
Anterior wing ___ --i~r-~:::.::::::::::::A~::;~;==t-------- Resilium
Mouth -----",.-=--rLabial Palp Foot--~~~-~~
Gill--+-
Intestine
~~~:-;f,~---- Liver
Adductor muscle (catch)
Adductor muscle (quick)
Anus
~:--- Eye
~--- Mantle curtain
~,..---- Right (bottom) shell
,;\'~~:..-..::...:----- Tentacles
Figure 3. Internal anatomy of the sea scallop Placopectell 1I1agellalliclis (after Mottet.l979 and Bourne. 1964).
is highly variable. The rate changes from area to area but is also a function of season. depth. and temperaturc. Gameto
and probably to a lesser degree temperature and availability. arc responsible for a seasonal compo-
nent in somatic growth (MacDonald & Thompson. 1986; ;Robinson et al. 1981).
>E Icelandic scallops grow more slowly and have a smaller ~~:asymptotic size c~mpared to sea scallops (Figure 7). Yahl
;:;(1981) prescnts size at age data. which shows 8 year old ~' animals having a mean shell height of 65 mm and 16 year
''old animals a height of 80 mm. Observations from Naidu et al. (1982) for St. Piene Bank. the Strait of Belle Isle,
the northeastern Gulf of St. Lawrence, show reduced growth rates, and a lower asymptotic size. Similar studies by Pedersen (1989) show a slow growth rate for scallop beds in western Greenland.
In sea scallops. gonadal growth and maturation generally take place between April and July; spawning occurs from August to October (Thompson. 1977). Instances of two separate spawnings, spring and fall, have been reported (Naidu. 1970). Most animals are sexually mature by their second year. The reproductive effort (annual gamete production divided by gamete and somatic tissue production) increases steadily from about 20ift at age 2 to nearly
45
43
NEW BRUNSWICK
65
100!7e around age 14 in inshore scallops (Mac Donald, 1984 J. Annual egg production per animal is numbered in the tens of millions and higher. Egg diameter has been reported at 80-90 ,.UTI (Naidu, 1970) and 69 J..lm by MacDonald (1984).
Icelandic scallops mature at a later age and devote less energy to reproduction than sea scallops. Yahl (1981) reported for Norwegian waters that 50% maturity was attained at about age 4. He also estimated the reproductive effort (using a slightly different definition than above, the ratio of gamete production to total production) to increase from 2ift at age 4 to 75% for ages 15-20.
Early Life Stages
The general life cycle of scallops is shown in Figure 8. The following description of the early development of sea scallop larvae is based on laboratory studies at temperatures of 13 to 15T (Culliney, 1974; Couturier, 1990). After I to 2 days as negatively buoyant eggs. the first motile stage is reached. that of the ciliated trochophore. Within 3-4 days of fertilization, the larvae develop into the veliger stage, which is characterized by the velum - a bilobed ciliated organ used in locomotion and feeding. The early veligel' has a hinged, 'D' shaped shell (prodissoconch I) which is deposited by the shell gland. When the larvae initiate fceding at about 4 days, new shell (prodissoconch II) be-
60 55
Figure 4. Major areas of fishing activity for sea scallop Placopectell 1I1agellalliclls on the Scotian Shelf. and Georges Bank: 1 - Georges Bank. 2 - Browns Bank, 3 - Lurcher Shoals. 4 - Southwest Bank. 5 - Grand Manan, 6 - Digby. 7 - Upper Bay of Fundy. 8 - Sable Island Bank. 9 - Middle Bank, 10 - Banquereau Bank, 1 I - St. Piene Bank.
5
6
gins to be added peripherally in concentric growth lines. Changes occurring during the veliger stage include shell shape. the devclopment of a light sensitive eye spot. and the acquisition of a foot. Larvae with a foot (pedivcligers) tend to spend more time on or near the bottom than do earlier stages. Settlement on the bottom and metamorphosis are thought to occur almost simultaneously as metamorphosis involves a rapid degeneration of the velum. Metamorphosis occurs at lengths of 230 to 280 11m. which can be reached in 30-35 days in the laboratory.
In nature. sea scallop larvae have only rarcly been studied. probably because of the perception that they are difficult to identify. Distinguishing sea scallop larvae from other species of scallops may indeed be difficult. but this is generally not a problem in the Gulf of Maine area since sea scallops are much more abundant and fecund than other species. and probably spawn later in the year (Tremblay et al.. 1987; Tremblay & Sinclair. 1988).
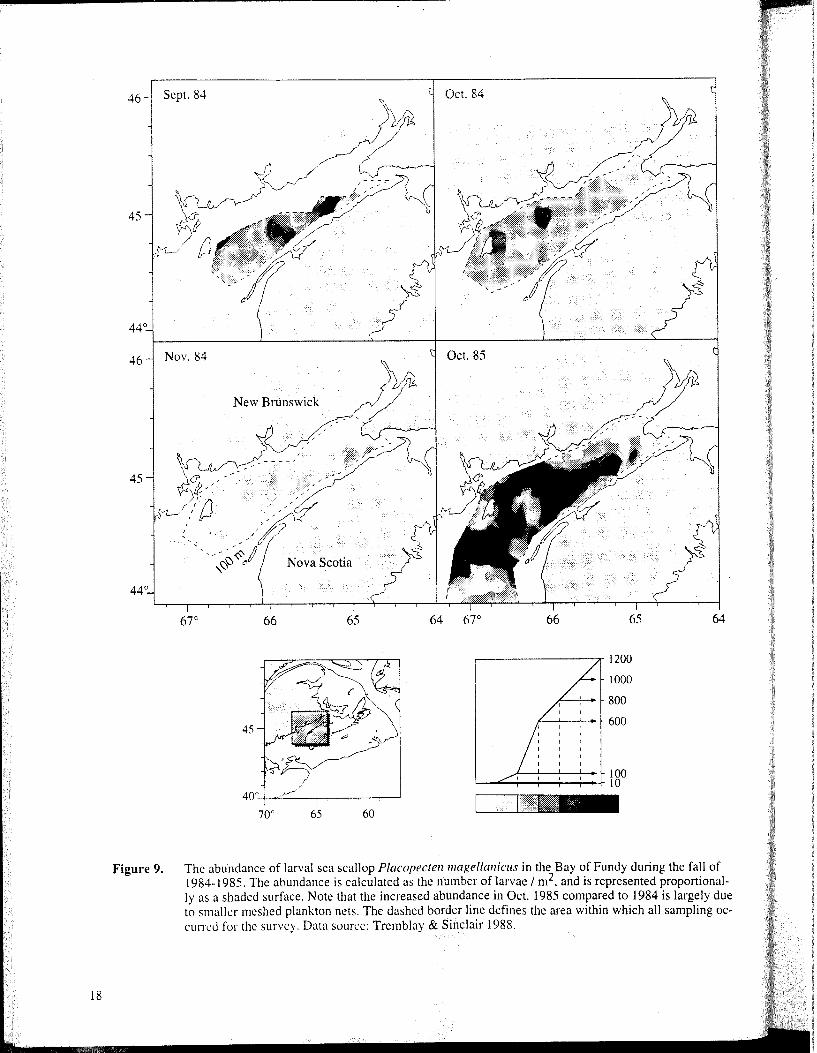
In the Bay of Fundy. sea scallop larvae are most abundant during September. with declining numbers thereafter in 1984 (Figure 9). On Georges Bank larvae reach a seasonal peak in late September or early October, and show dramatic shifts in distribution over periods of a few weeks in 1986 and 1987 (Figure 10). Sea scallop larvae are most abundant on Georges Bank, followed by the Bay of Fundy and Browns Bank (Tremblay &Sinclair 1988, 1992).
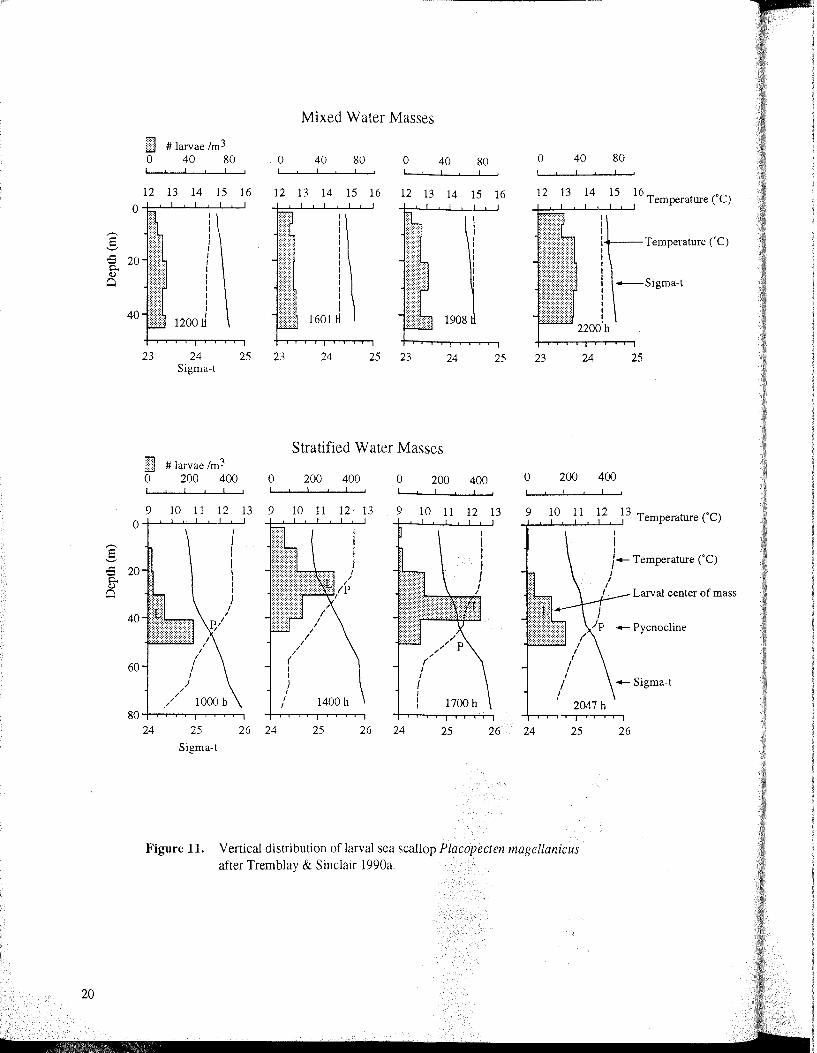
The vertical distribution of sea scallop larvae is strongly related to the physical characteristics of the water column. In areas where waters are well-mixed, with little density stratification (as shown by Sigma-t I ), sea scallop larvae are evenly distributed over the entire water column. In areas where there is density stratification, larvae show subsurface aggregations, which tend to be associated with the area where the vertical density gradient is greatest (pycnocline) (Figure 11) (Tremblay & Sinclair, 1990a). Sea scallop larvae undertake a small vertical migration in some areas. occupying shallower depths at night (Tremblay & Sinclair. 1990b).
Post-larval stages
Although young sea scallops have been found associated with bryozoans in Penobscot Bay (Maine) (Baird, 1953; Caddy. 1972). little is known about this life stage. Juvenile scallop abundance on Georges Bank is not related to easily quantified physical factors such as sediment size, depth. temperature and salinity (Larsen & Lee, 1978). New evidence suggests that 1-2 year old animals are more abundant in the gravel-pebble deposit in the northern half of the Bank (Thouzeau et aI., 1991). In the laboratory, juveniles 2-5 mm in diameter remain attached approximately 75CJc of the time; this proportion decreases with increasing age (Caddy. 1972).
Following metamorphosis and settlement. the rate increases dramatically over that of the larval Sixty-day old spat reared in the laboratory can be as as I mm (mean growth rate of 25 11m per day) while I day old spat can be as large as I cm (mean growth 75 11m per day) (P. Dabinett. pers. comm.) In
quoddy Bay (New Brunswick). spat which have the autumn can reach a size of 2 mm by November. and 5 mm 50 days later - a growth rate of 60 11m per day (M. Dadswell & Parsons. 1991). In contrast, on Georges Bank, reported post-larval growth rates arc substantially lower. Scallops of approximately 6 months old, were found to have a mean size of 2.9 mm by Merrill and Edwards (1976). and only 1.3 mm by Larsen and Lee (1978).
Physiology
Scallops have large gills which carry out both respiratory and feeding functions. MacDonald (1984) reports oxygen consumption and clearance rates (the volume of water filtered during feeding) for sea scallops. Both these rates are seasonal and correlated with temperature and food availability. For scallops in the size range of 135 to 155 mm, mean 02 consumption ranged from approximately 1 to 3.5 mllh. The clearance rate ranged from 4 to 9 Ilh. Van Dam (1954) reports an 02 uptake of 70 ml/kg/hr at 20T.
Scallops display the rather unusual behaviour, for bivalves, of swimming. The tendency to swim is more common among younger animals and rarely seen in scallops over 70 mm. The respiration rate for sea scallops is higher than that of more sedentary bivalves. The energy requirements of swimming have not been reported in the literature. Among 4 species tested. sea scallops were the most hydrodynamically suited for swimming (Dads well & Weihs. 1990). Scallops approach optimum hydrofoil shape for low aspect body ratio. Dadswell and Weihs (1990) detennined that mean flight distances were 2.6 ± 0.6 m (with a range of 1.0 - 7.0 m) and mean velocity of 47.6 cmJs (with a range of 4 - 9 body lengths/s). Melvin et al. (1985) report a mean movement of a few kilometers per year from the analysis of tag-recapture data on Georges Bank. The average motion observed was circular in a clockwise direction. which corresponds to the residual surface currents.
Vahl (1981) reports a respiration rate for Icelandic scallops in units different from MacDonald (1984 J. Respiration effort would range from twice for young animals to a factor of 4.5· for older animals of the energy allotted to total production.
Meat Quality
Normal scallop meats are creamy-white in colour and have a firm texture. At times. some dark-meated scallops are encountered; they are greyish brown in colour. flaccid, and stringy in texture. Meat yield from these scallops is
I Sigma-t - The specific gravity of water of tcmperature (0. usually expressed in terms of (specific gravity at (oC-l) x 1000.
G
owth Jges. large 160-
.le of amacd in md 5 I(M. ~ank,
)wer. ld to vards
iratooxywater rates food
) 155 ely 1 . Van 'Co
)r bicomlllops .igher luireiteramost II & shape ) de(with cmls
1985) from
. The jirec:s.
scal:ation a factotal
r and Illops lccid, IpS is
00.
also usually smaller. Dark-meated scallops arc infected to \'arying degrees by a boring sponge that slowly destroys the shells of many species of molluscs (Medcof. 1949). In scallops. the disease is revealed by a fine pitting of the surface. which gradually spreads to the whole shell. Meanwhile. the scallop deposits more shell layers from the inside but is not always successful at keeping pace with the invader. The meat condition deteriorates when the animal spends too much energy repairing its shell, especially in older animals.
Fishery
History
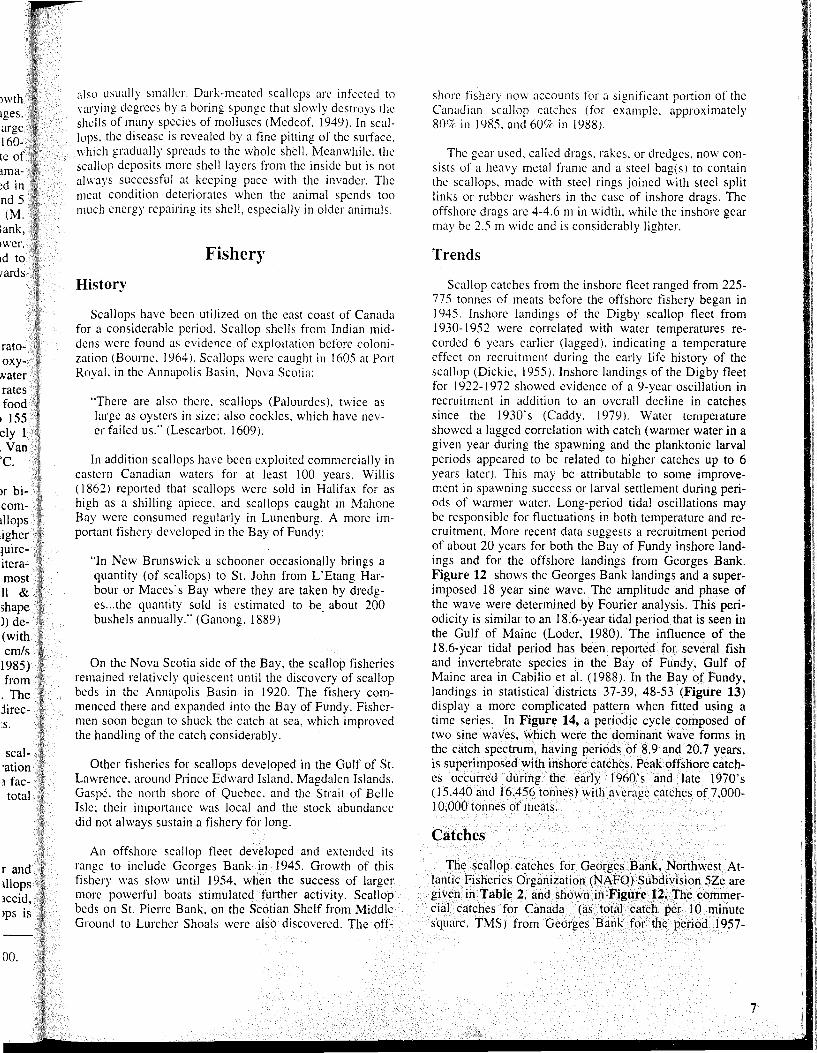
Scallops have been utilized on the east coast of Canada for a considerable period. Scallop shells from Indian middens were found as evidence of exploitation before colonization (Bourne. 1964). Scallops were caught in 1605 at Port Royal. in the Annapolis Basin. Nova Scotia:
'There are also there. scallops (Palourdes). twice as large as oysters in size; also cockles, which have never failed us'" (Lescarbot. 1609).
In addition scallops have been exploited commercially in eastern Canadian waters for at least 100 years. Willis (1862) rep0l1ed that scallops were sold in Halifax for as high as a shilling apiece, and scallops caught in Mahone Bay were consumed regularly in Lunenburg. A more important fishery developed in the Bay of Fundy:
"In New Brunswick a schooner occasionally brings a quantity (of scallops) to St. John from L'Etang Harbour or Maces's Bay where they are taken by dredges ... the quantity sold is estimated to be. about 200 bushels annually." (Ganong. 1889)
On the Nova Scotia side of the Bay. the scallop fisheries remained relatively quiescent until the discovery of scallop beds in the Annapolis Basin in 1920. The fishery commenced there and expanded into the Bay of Fundy. Fishermen soon began to shuck the catch at sea. which improved the handling of the catch considerably.
Other fisheries for scallops developed in the Gulf of St. Lawrence. around Prince Edward Island, Magdalen Islands. Gaspe. the nOl1h shore of Quebec, and the Strait of Belle Isle; their importance was local and the stock abundance did not always sustain a fishery for long.
An offshore scallop fleet developed and extended its range to include Georges Bank in 1945. Growth of this fishery was slow until 1954, when the success of larger more powelful boats stimulated further activity. Scallop beds on St. Pierre Bank, on the Scotian Shelf from Middle Ground to Lurcher Shoals were also discovered. The off-
shore fishery now accounts for a significant portion of the Canadian scallop catches (for example. approximately 800( in 1985, and 609'c in 1988).
The gear used, called drags. rakes. or dredges, now consists of a heavy metal frame and a steel bag(s) to contain the scallops. made with stecl rings joined with steel split links or rubber washers in the case of inshore drags. The offshore drags are 4-4.6 m in width. while the inshore gear may be 2.5 111 wide and is considerably lighter.
Trends
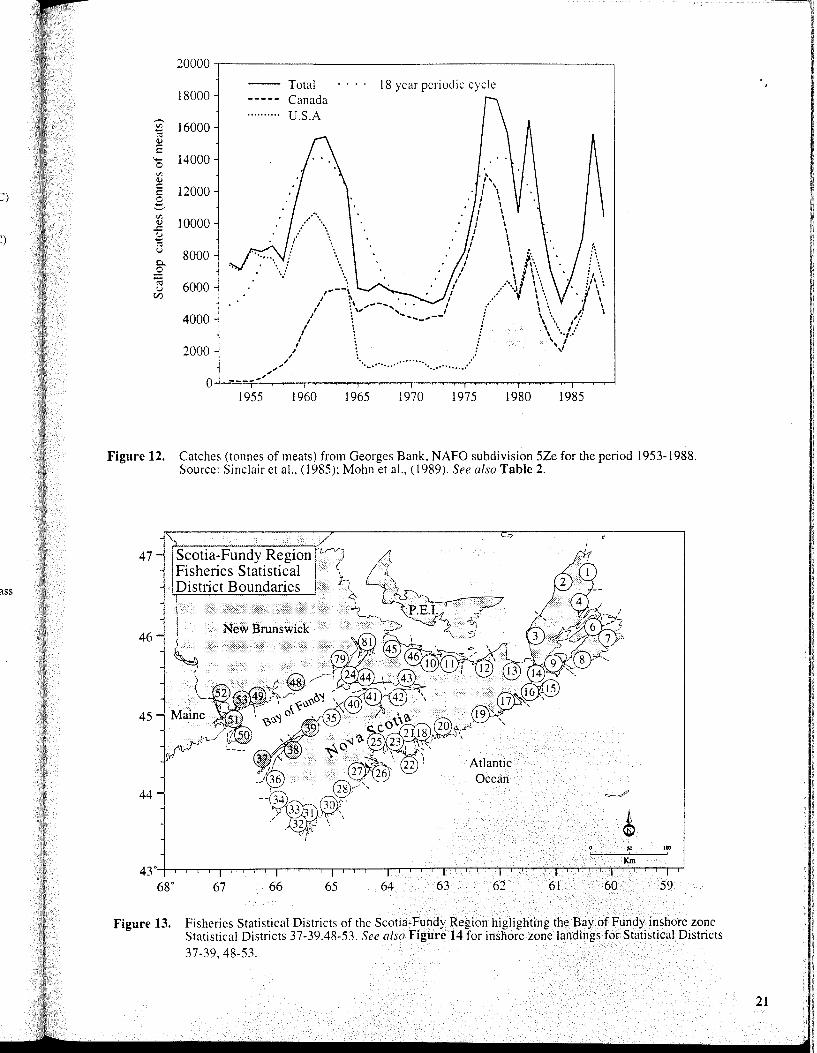
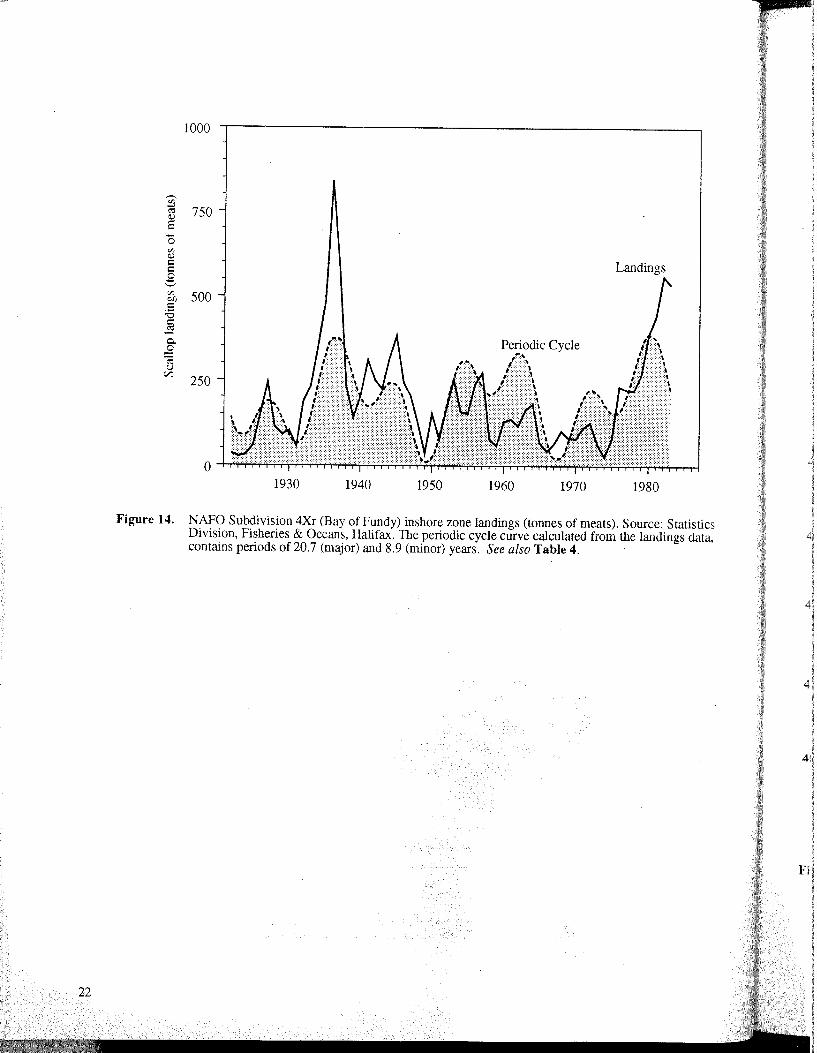
Scallop catches from the inshore fleet ranged from 225-775 tonnes of meats before the offshore fishery began in 1945. Inshore landings of the Digby scallop fleet from 1930-1952 were correlated with water temperatures recorded 6 years earlier (lagged), indicating a temperature effect on recruitment during the early life history of the scallop (Dickie. 1955). Inshore landings of the Digby fleet for 1922-1972 showed evidence of a 9-year oscillation in recruitment in addition to an overall decline in catches since the 1930's (Caddy, 1979). Water temperature showed a lagged correlation with catch (warmer water in a given year during the spawning and the planktonic larval periods appeared to be related to higher catches up to 6 years later). This may be attributable to some improvement in spawning success or larval settlement during periods of warmer water. Long-period tidal oscillations may be responsible for fluctuations in both temperature and recruitment. More recent data suggests a recruitment period of about 20 years for both the Bay of Fundy inshore landings and for the offshore landings from Georges Bank. Figure 12 shows the Georges Bank landings and a superimposed 18 year sine wave. The amplitude and phase of the wave were determined by Fourier analysis. This periodicity is similar to an 18.6-year tidal period that is seen in the Gulf of Maine (Loder, 1980). The influence of the 18.6-year tidal period has been reported for several fish and invertebrate species in the Bay of Fundy, Gulf of Maine area in Cabilio et al. (1988). In the Bay of Fundy, landings in statistical districts 37-39, 48-53 (Figure 13) display a more complicated pattern when fitted using a time series. In Figure 14, a periodic cycle composed of two sine waves, which were the dominant wave forms in the catch spectrum, having periods of 8.9 and 20.7 years, is superimposed with inshore catches. Peak offshore catches occurred during the early 1960's and late 1970's (15.440 and 16,456 tonnes) with average catches of 7,000-10,000 tonnes of meats.
Catches
The scallop catches for Georges Bank, Northwest Atlantic Fisheries Organization (NAFO) Subdivision 5Ze are given in Table 2, and shown in Figure 12. The commercial catches for Canada (as total catch per 10 minute square. TMS) from Georges Bank for the period 1957-
7
8
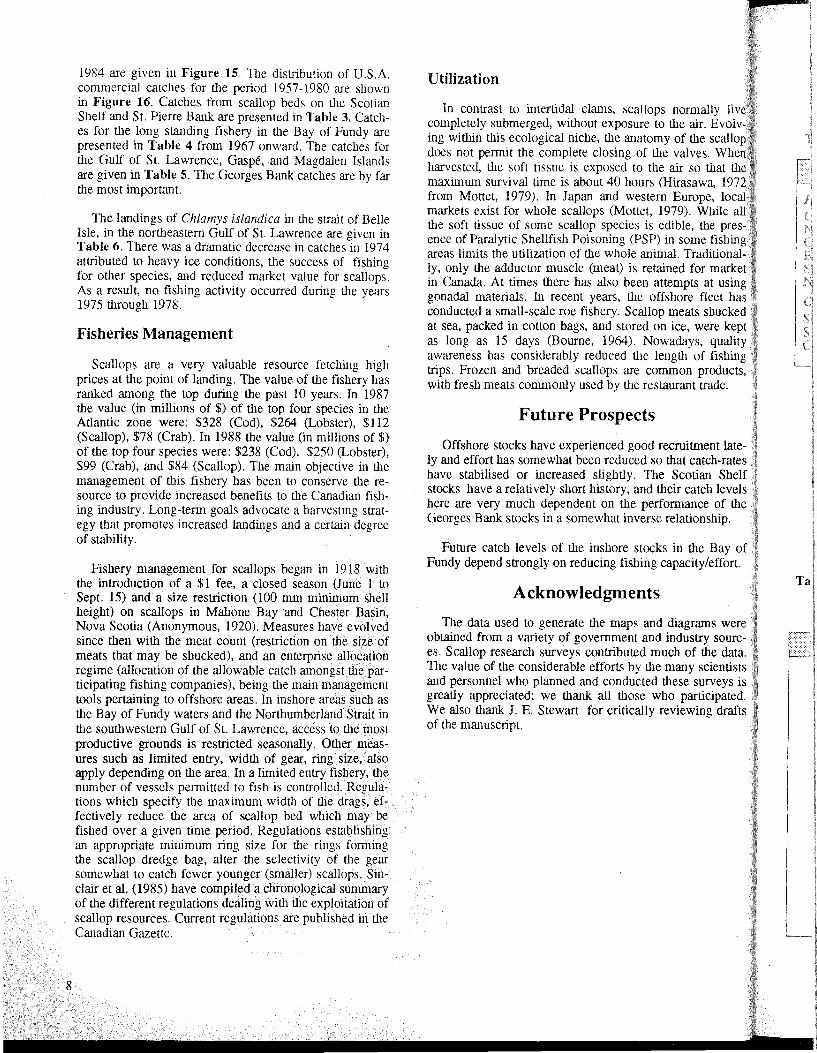
1984 are given in Figure 15. The distribution of U.S.A. commercial catches for tile period 1957-1980 are shown in Figure 16. Catches from scallop beds on the Scotian Shelf and St. Pierre Bank are presented in Table 3. Catches for ilie long standing fishery in ilie Bay of Fundy are presented in Table 4 from 1967 onward. The catches for the Gulf of St. Lawrence, Gaspe, and Magdalen Islands are given in Table S. The Georges Bank catches are by far the most important.
The landings of Chlamys islandica in the strait of Belle Isle, in ilie norilieastern Gulf of St. Lawrence are given in Table 6. There was a dramatic decrease in catches in 1974 attributed to heavy ice conditions, the success of fishing for other species, and reduced market value for scallops. As a result. no fishing activity occurred during the years 1975 through 1978.
Fisheries Management
Scallops are a very valuable resource fetching high prices at ilie point of landing. The value of ilie fishery has ranked among ilie top during ilie past 10 years. In 1987 ilie value (in millions of $) of ilie top four species in tile Atiantic zone were: $328 (Cod), $264 (Lobster), $112 (Scallop), $78 (Crab). In 1988 ilie value (in millions of $) of ilie top four species were: $238 (Cod), $250 (Lobster), $99 (Crab), and $84 (Scallop). The main objective in tile management of iliis fishery has been to conserve tile resource to provide increased benefits to tile Canadian fishing industry. Long-term goals advocate a harvesting strategy iliat promotes increased landings and a certain degree of stability.
Fishery management for scallops began in 1918 with the introduction of a $1 fee, a closed season (June 1 to Sept. 15) and a size restriction (100 mm minimum sh~ll height) on scallops in Mahone Bay and Chester Bas1l1, Nova Scotia (Anonymous, 1920). Measures have evolved since ilien wiili the meat count (restriction on the size of meats iliat may be shucked), and an enterprise allocation regime (allocation of tile allowable catch amongst the participating fishing companies), being tile main management tools pertaining to offshore areas. In inshore areas such as the Bay of Fundy waters and ilie Northumberland Strait in the souiliwestern Gulf of St. Lawrence, access to ilie most productive grounds is restrict~ seasonally .. Oth~r measures such as limited entry, WIdth of gear, nng SIZe, also apply depending on ilie area. In a l~ited entry fishery, the number of vessels permitted to fish IS controlled. Regulations which specify tile maximum width of the drags, effectively reduce the area of scallop be~ which m.aY.be fished over a given time period. RegulatIOns establtslung an appropriate minimum ring size for the rings fornling the scallop dredge bag, alter tile selectivity of tile gear somewhat to catch fewer younger (smaller) scallops. Sinclair et al. (1985) have compiled a chronological summary of tile different regulations dealing witll tile exploitation of scallop resources. Current regulations are published in tile Canadian Gazette.
Utilization
In contrast to intertidal clams, scallops normally live completely submerged, without exposure to the air. Evolving within this ecological niche, ilie anatomy of the scallop does not pennit the complete closing of ilie valves. When harvested, ilie soft tissue is exposed to the air so that ilie maximum survival time is about 40 hours (Hirasawa, 1972 from Mottet, 1979). In Japan and western Europe, local markets exist for whole scallops (Mottet, 1979). While all the soft tissue of some scallop species is edible, ilie presence of Paralytic Shellfish Poisoning (PSP) in some fishing areas limits the utilization of the whole animal. Traditionally, only ilie adductor muscle (meat) is retained for mar~et in Canada. At times there has also been attempts at usmg gonadal materials. In recent years, the offshore fleet has conducted a small-scale roe fishery. Scallop meats shucked at sea, packed in cotton bags, and stored on ice, were kept as long as 15 days (Bourne, 1964). Nowadays, qu~ity awareness has considerably reduced the lengtil of fishmg trips. Frozen and breaded scallops are common products, wiili fresh meats commonly used by ilie restaurant trade.
Future Prospects
Offshore stocks have experienced good recruitment lately and effort has somewhat been reduced so iliat catch-rates have stabilised or increased slightiy. The Scotian Shelf stocks have a relatively short history, and their catch levels here are very much dependent on ilie performance of ilie Georoes Bank stocks in a somewhat inverse relationship. e
Future catch levels of tile inshore stocks in ilie Bay of Fundy depend strongly on reducing fishing capacity/effort.
Acknowledgments
The data used to generate ilie maps and diagrams were obtained from a variety of government and industry sources. Scallop research surveys contributed much of the data. The value of the considerable efforts by tlle many scientists and personnel who planned and conducted these s~r:'eys is greatiy appreciated; we thank all those who partICIpated. We also thank 1. E. Stewart for critically reviewing drafts of tile manuscript.
Ta
ly live Evolvscallop Wben
bat the I, 1972 , local ilile all ~ presfisbing ,tionalmarket t using ~et bas lUcked :e kept :}uality fisbing xiucts, Ide.
lt lateb-rates
Sbelf levels of the bip.
3ay of :ffort.
, were sourc-~ data. entists leys is ,pated. drafts
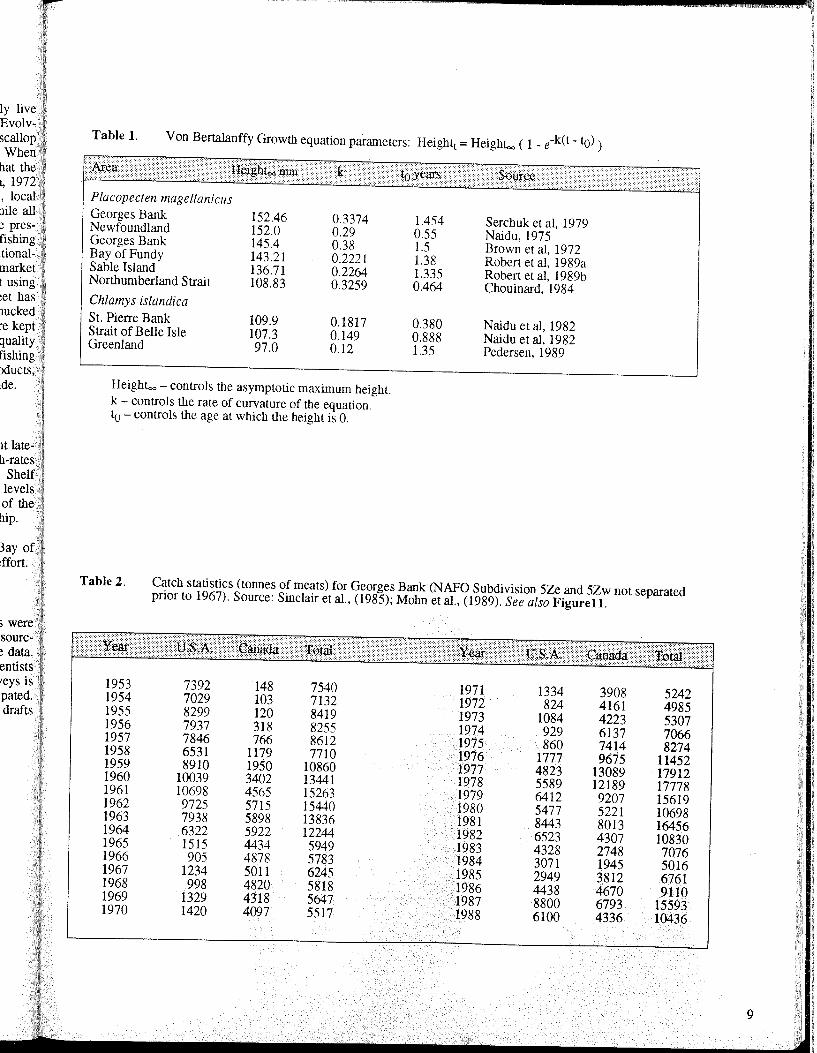
Table 1. Von Bertalanffy Growth equation parameters: Heigbt( = Heigbt.,., ( I _ e-k(t - to»
Placopecten magellanicus Georges Bank 152.46 0.3374 Newfoundland 152.0 0.29 Georges Bank 145.4 0.38 Bay of Fundy 143.21 0.2221 Sable Island 136.71 0.2264 Northumberland Strait 108.83 0.3259 Chlamys islandica St. Pierre Bank 109.9 0.1817 Strait of Belle Isle 107.3 0.149 Greenland 97.0 0.12
Height.,., - controls the asymptotic maximum height. k - controls the rate of curvature of the equation. to - controls the age at which the height is O.
1.454 Sercbuk et aI, 1979 0.55 Naidu, 1975 1.5 Brown et aI, 1972 1.38 Robert et aI, 1989a 1.335 Robert et al, 1989b 0.464 Cbouinard, 1984
0.380 Naidu et al, 1982 0.888 Naidu et aI, 1982 1.35 Pedersen, 1989
Table 2. Catch statistics (tonnes of meats) for Georges Bank (NAFO Subdivision 5Ze and 5Zw not separated prior to 1967). Source: Sinclair et aI., (1985); Mohn et aI., (1989). See also Figurel1.
1953 7392 148 7540 1971 1334 3908 5242 1954 7029 103 7132 1972 824 4161 4985 1955 8299 120 8419 1973 1084 4223 5307 1956 7937 318 8255 1974 929 6137 7066 1957 7846 766 8612 1975 860 7414 8274 1958 6531 1179 7710 1976 1777 9675 11452 1959 8910 1950 10860 1977 4823 13089 17912 1960 10039 3402 13441 1978 5589 12189 17778 1961 10698 4565 15263 1979 6412 9207 15619 1962 9725 5715 15440 1980 5477 5221 10698 1963 7938 5898 13836 1981 8443 8013 16456 1964 6322 5922 12244 1982 6523 4307 10830 1965 1515 4434 5949 1983 4328 2748 7076 1966 905 4878 5783 1984 3071 1945 5016 1967 1234 5011 6245 1985 2949 3812 6761 1968 998 4820 5818 1986 4438 4670 9110 1969 1329 4318 5647 1987 8800 6793 15593 1970 1420 4097 5517 1988 6100 4336 10436
9
..
10
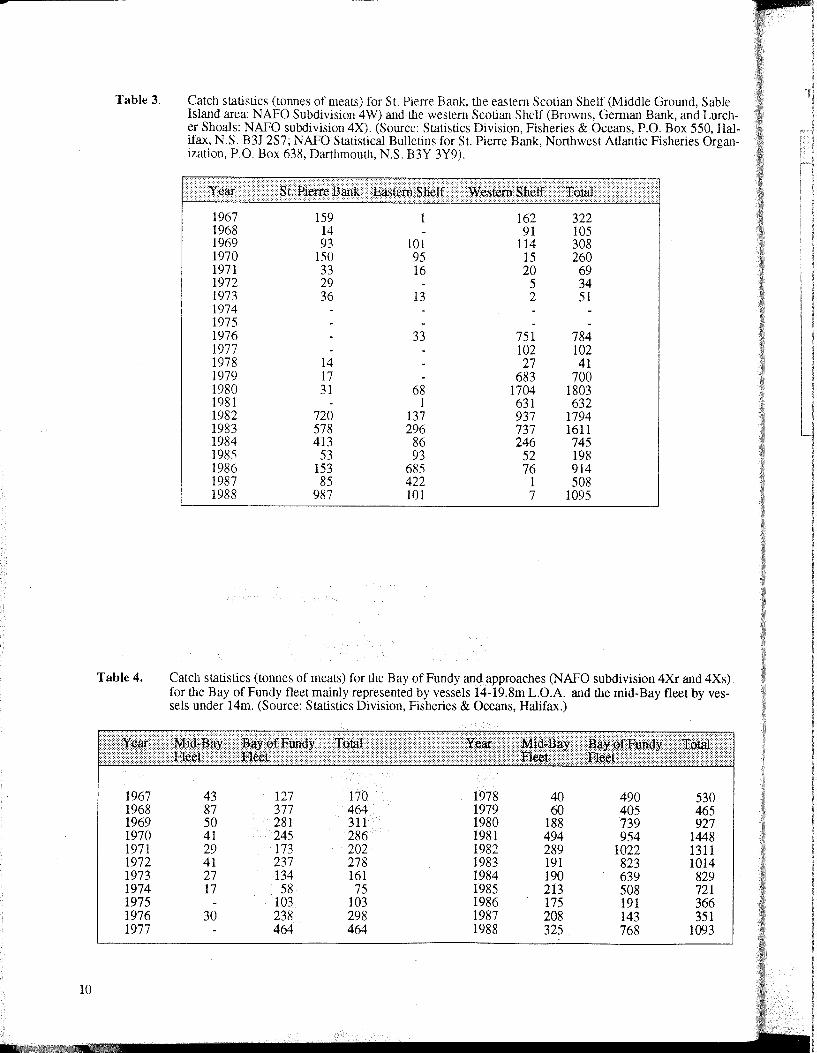
Table 3. Catch statistics (tonnes of meats) for St. Pierre Bank, tlle eastern Scotian Shelf (Middle Ground, Sable Island area: NAFO Subdivision 4W) and the western Scotian Shelf (Browns, Gennan Bank, and Lurcher Shoals: NAFO subdivision 4X). (Source: Statistics Division, Fisheries & Oceans, P.O. Box 550, Halifax, N.S. B3J 2S7; NAFO Statistical Bulletins for St. Pierre Bank, Nortllwest Atlantic Fisheries Organization, P.O. Box 638, Dartllmouth, N.S. B3Y 3Y9).
1967 159 162 322 1968 14 91 105 1969 93 101 114 308 1970 150 95 15 260 1971 33 16 20 69 1972 29 5 34 1973 36 13 2 51 1974 1975 1976 33 751 784 1977 102 102 1978 14 27 41 1979 17 683 700 1980 31 68 1704 1803 1981 1 631 632 1982 720 137 937 1794 1983 578 296 737 1611 1984 413 86 246 745 1985 53 93 52 198 1986 153 685 76 914 1987 85 422 1 508 1988 987 101 7 1095
Table 4. Catch statistics (tonnes of meats) for the Bay of Fundy and approaches (NAFO subdivision 4Xr and 4Xs) for the Bay of Fundy fleet mainly represented by vessels 14-19.8m L.O.A. and the mid-Bay fleet by vessels under 14m. (Source: Statistics Division, Fisheries & Oceans, Halifax.)
1967 43 127 170 1978 40 490 530 1968 87 377 464 1979 60 405 465 1969 50 281 311 1980 188 739 927 1970 41 245 286 1981 494 954 1448 1971 29 173 202 1982 289 1022 1311 1972 41 237 278 1983 191 823 1014 1973 27 134 161 1984 190 639 829 1974 17 58 75 1985 213 508 721 1975 103 103 1986 175 191 366 1976 30 238 298 1987 208 143 351 1977 464 464 1988 325 768 1093
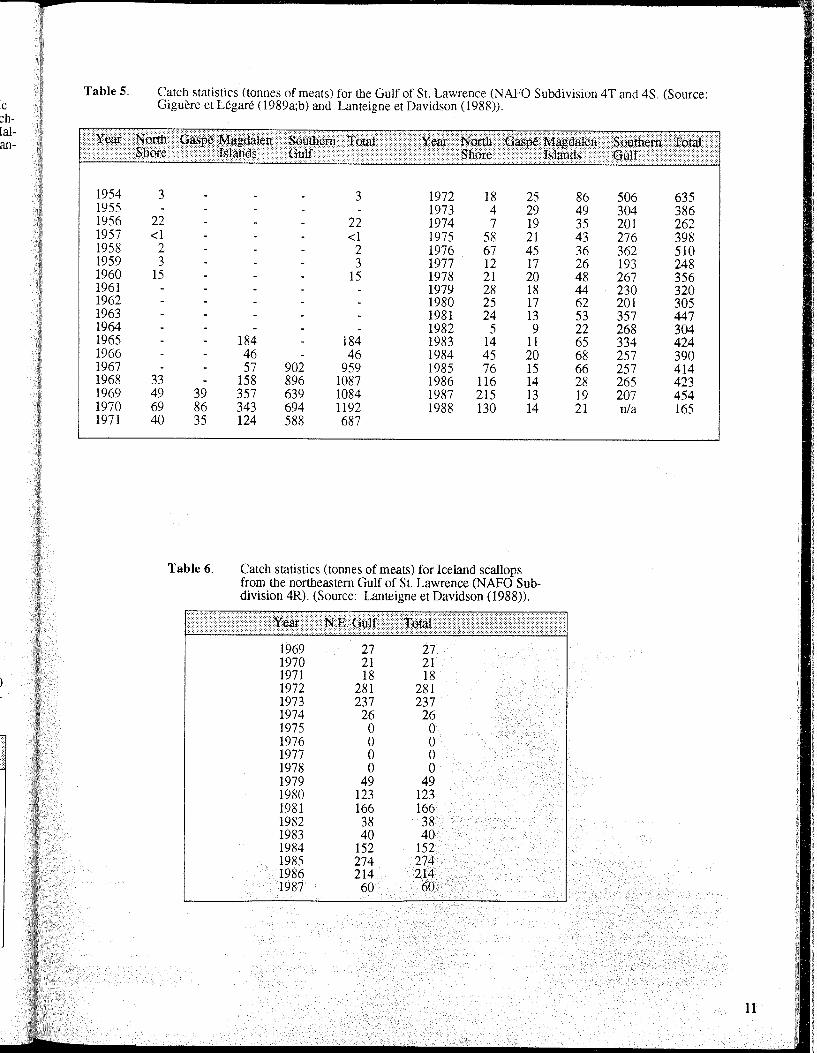
Table 5. Ie ~h-[al-an-
1954 1955 1956 1957 1958 1959 1960 1961 1962 1963 1964 1965 1966 1967 1968 1969 1970 1971
Catch statistics (tonnes of meats) for the Gulf of St. Lawrence (NAFO Subdivision4T and 4S. (Source: Giguere et Legare (l989a;b) and Lanteigne et Davidson (1988».
3
22 <1
2 3
15
33 49 39 69 86 40 35
Table 6.
3 1972 18 25 1973 4 29
22 1974 7 19 <1 1975 58 21
2 1976 67 45 3 1977 12 17
15 1978 21 20 1979 28 18 1980 25 17 1981 24 13 1982 5 9
184 184 1983 14 11 46 46 1984 45 20 57 902 959 1985 76 15
158 896 1087 1986 116 14 357 639 1084 1987 215 13 343 694 1192 1988 130 14 124 588 687
Catch statistics (tonnes of meats) for Iceland scallops from the northeastern Gulf of St. Lawrence (NAFO Subdivision 4R). (Source: Lanteigne et Davidson (1988».
1969 1970 1971 1972 1973 1974 1975 1976 1977 1978 1979 1980 1981 1982 1983 1984 1985 1986 1987
27 21 18
281 237
26 o o o o
49 123 166 38 40
152 274 214 60
27 21 18
281 237 26 o o o o
49 123 166 38 40
152 274 214 60
86 506 635 49 304 386 35 201 262 43 276 398 36 362 510 26 193 248 48 267 356 44 230 320 62 201 305 53 357 447 22 268 304 65 334 424 68 257 390 66 257 414 28 265 423 19 207 454 21 nJa 165
11
, , , , ,
, , , , , ,
1984
, , , , ,
Age 2
67°
Figure S. TIle abundance of age 2 and 3 sea scallops Placopecten magellanicus on Georges Bank
between 1981-1984. The abundance is calculated as the number of scallops / std tow, and is represented proportionally as a shaded surface. The cohorts may be "read" diagonally by comparing one plot of a particular age with the succeeding plot for the next year (in the next age group). TIle dashed border line defines the area within which all sampling occurred for the survey.
12
Age 3
45
70° 65 60
r-------...".. 250
200
150
100
50
"-+-f--f---f----l----_f_ 1
11~::m:m:i:lt_
250
200
150
100
50
, 1
•
42
42
Age 4
1984
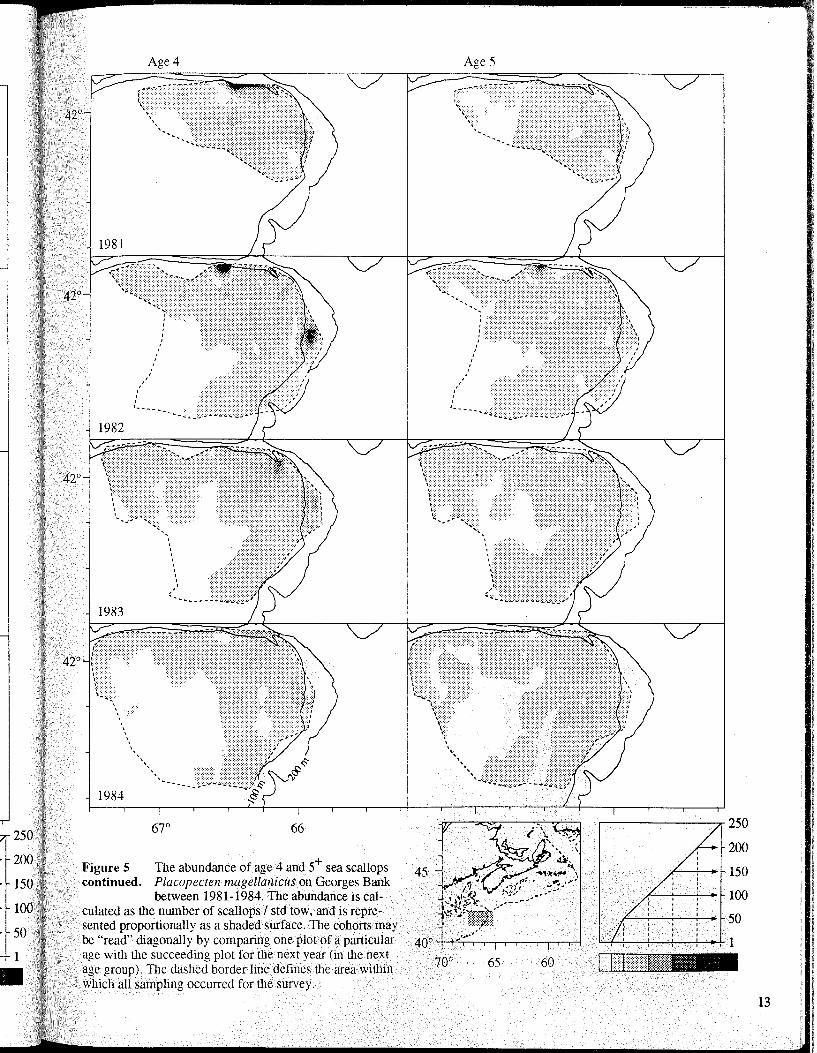
Figure 5 TIle abundance of age 4 and 5+ sea scallops continued. Placopecten magellanicus on Georges Bank
between 1981-1984. The abundance is calculated as the number of scallops / std tow, and is represented proportionally as a shaded surface. The cohorts may be "read" diagonally by comparing one plot of a particular age with the succeeding plot for the next year (in the next age group). TIle dashed border line defines the area within which all sampling occurred for the survey.
Age 5
45
60
r--------,,- 250
200
150
l3
Age 2
1985
1988
67°
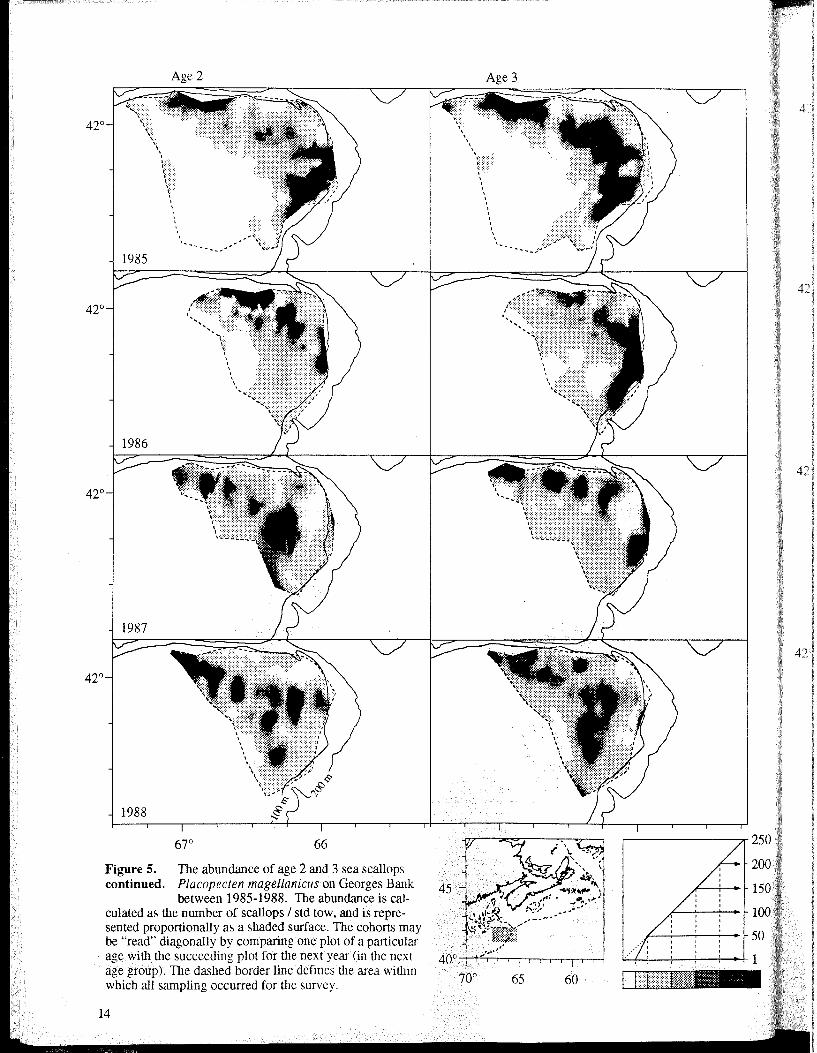
Figure 5. The abundance of age 2 and 3 sea scallops continued. Placopecten magellallicus on Georges Bank
between 1985-1988. The abundance is calculated as the number of scallops / std tow, and is represented proportionally as a shaded surface. The cohorts may be "read" diagonally by comparing one plot of a particular age with the succeeding plot for the next year (in the next age group). TIle dashed border line defines the area within which all sampling occurred for the survey.
14
45 .-1 •
.... ·lt~· ---~. ---~i'~~~l~~~(
40°-r~~'~-·'rT.-,,~~-r~
70° 65 60
,-------'7r' 250
200
150
100
50
~-+--+-+--+--++ 1
I It::::m::::mw._
42
250
· 200
· 150
100
50
, 1
•
Age 4
1985
1988
+ Figure 5. The abundance of age 4 and 5 sea scallops continued. Placopectell magellallicus on Georges Bank
between 1985-1988. The abundance is calculated as the number of scallops / std tow, and is represented proportionally as a shaded surface. The cohorts may be "read" diagonally by comparing one plot of a particular age with the succeeding plot for the next year (in the next age group). TIle dashed border line defines the area within which all sampling occurred for the survey.
Age 5
45
70° 65 60
,..-------..,...250
200
150
100
50
L::.-f-+--+--+-+-+ 1
I 1[:::::rr~~!ifJ:_
15
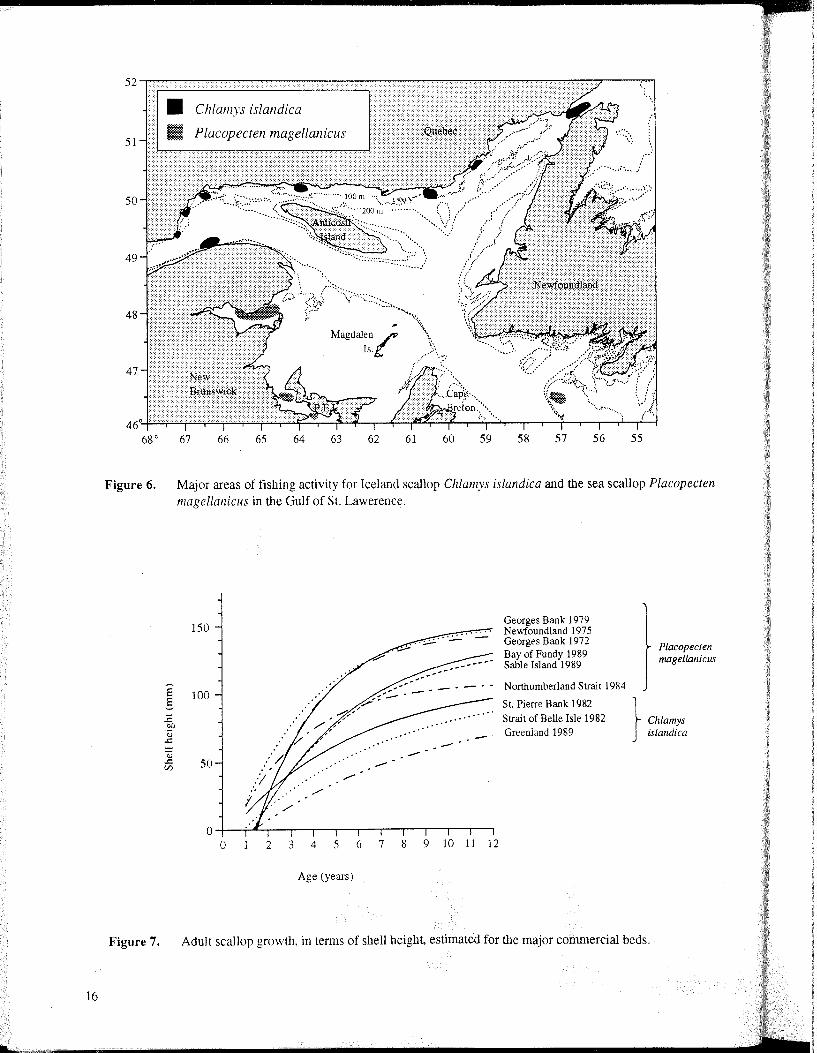
Figure 6.
E E-:c Of) .~
..:::
~ ..::: til
Figure 7.
16
Major areas of fishing activity for Iceland scallop Chla1l1),s islandica and the sea scallop Placopecten magellanicLJs in the Gulf of St. Lawerence.
150 Georges Bank 1979 Newfoundland 1975 Georges Bank 1972 Placopecten
17 Bay of Fundy 1989 magelmllieus Sable Island 1989
,- -- --_ .. - Northumberland Strait 1984 100
St. Pierre Bank 1982 } Strait of Belle Isle 1982 Chlamys Greenland 1989 islandiea
50
o 2 3 4 5 6 7 8 9 10 11 12
Age (years)
Adult scallop growth, in terms of shell height, estimated for the major commercial beds.
Pedivcliger larva
.. 230 11m
Newly settled
juvenile ... Imm
/5- 15 days V VI
\ 20 - 30 d,y, VII
Early juvenile .. 3mm
. ! !
Adult stage
ow 10 - 20+ em Straight "'l III eggs from
h1'11 0" . adu/t Q e~ '3 da s
larva '- oJ \J Y II sperm from
ow 110 11m ~~_'. . 2. 4 hours .ol@@adultcf'
- - ~@'- ----------- 1$ @ _______
Trochophore stage
.. 70 11m
@
Externally fertilized
eggs ow 70 11m
Figure 8. The life cycle of sea scallop Placopectell lIIagellalliclis. (Figurcs II, III from Drew 1906, Figures IV, VII from Bourne 1964, Figure V from Culliney 1974, Figurc VI from Caddy 1972.)
17
46
45
46
45
Figure 9.
18
Sept. 84
New Brunswick
Nova Scotia
66 65
45
40'~' '~~-_,___-~_r-,--r-'
70" 65 60
Oct. 84
66 65
r--------.,.- 1200
1000
800
600
64
The abundance of larval sea scallop Placopectell magellal1icLls in the Bay of Fundy during the fall of 1984-1985. The abundance is calculated as the number of larvae / m2, and is represented proportionally as a shaded sUiface. Note that the increased abundance in Oct. 1985 compared to 1984 is largely due to smaller meshed plankton nets. The dashed border line defines the area within which all sampling occurred for the survey. Data source: Tremblay & Sinclair 1988.
Sept. 30 - Oct.
43
42
Sept. 5-7 1987
43
f'~-
, . . ' ,
/
, , , , , ,
Oct. 8-13 1986 ' ....
. ' . . . . . .
Sept. 29 - Oct. 8 1987
.. " " ": ~, .. : . ,'",,::"
.......
42 (=i ,
43
42
\ \
\
. ",:
(.
; ....
'" .;
.. ' .....
Browns .... ···Banle 45
==~=-~~~~~ r--------------rl~
65 60
8333
6666
5000
3333
~+-~~~~_+lOO
I:::::::::m/:::ff:_
41°-r--------.---~--_.--------~------~
68°
Figure 10.
67 66 65 64
The abundance of larval sea scal.lop Placopecten magellanicliS onGeorges Bank during the fall of 1986-1987. The abundance is calculated as the number of larvae / m2, and is represented proportionally as a shaded surface. The dashed border line defines the area within which all sampling occurred for the survey. Data source: Tremblay & Sinclair 1992.
19
0
""' § £ 0-
20 ~
Q
40
20
Mixed Water Masses
ill # larvae 1m3
0 40 80 0 40 80 0 40 80 0 40
12 13 14 15 16 12 13 14 15 16 12 13 14 15 16 12 13 14
I I I I I I I I I I I I ,
I I I I I I I I I I I I I I I I I I I I
120011 160111 1908 2200'h
23 24 25 23 24 25 23 24 25 23 Sigma-t
Figure 11. Vertical distribution of larval sea scallop Placopecten magellanicus after Tremblay & Sinclair 1990a.
24
80
15 16 Temperature ('C)
Temperature CC)
-Sigma-t
25
::)
:)
ass
---.------.J
20000
18000
,-.,
16000 v;
::a v E '- 14000 0 v: v c: 12000 c: g '" 10000 v
..s:: u ::a u 0..
8000 .2 ";;j
6000 u V)
4000
2000
0 -----" 1955
Total .... 18 year periodic cycle Canada U.S.A
',\ , , ., , . , , , , , , ,
/ ..... \ : I \ ,/ \, / \ • I 1 t.
, / \'" / \ ~" :',
... j \, ,/ \ !\\ /,:\ I /"'/ ,\ :I,: ,---i I...J ,\ :1 ,
• I .,' ~ ,', '! I" • / .. ' J '\ • \
/ ;\ ......... - .... " • • I : , '. " \ ........ -- • \. 1'.- \
I ~ .... _... i \ \ ,..-
II: 1 \ .... /. ...
I \ :" I J ~ f ',I
,/ ~. ............ .. . ......... ........... . ............. :
1960 1965 1970 1975 1980 1985
Figure 12. Catches (tonnes of meats) from Georges Bank. NAFO subdivision 5Ze for the period 1953-1988. Source: Sinclair et a!.. (1985); Mohn et a!., (1989). See also Table 2.
'..
47 Scotia-Fundy Region Fisheries Statistical District Boundaries
I i
New Brunswick 46 i
(
~ '> { \ ...
45
t:-
tY \I"
Atlantic Ocean
44 ~
& ':' ""
43"'~~~~~~~,-~~~~~~~~",-~~~~.-~,,-.~,-~~
68"
Figure 13.
67 66 65 64 63 62 61 60 59
Fisheries Statistical Districts of the Scotia-Fundy Region higlighting the Bay of Fundy inshore zone Statistical Districts 37-39,48-53. See also Figure 14 for inshore zone landings for Statistical Districts 37-39.48-53.
21
22
..... o
1000
o 1930 1940
Landings
1950 1960 1970 1980
Figure 14. NAFO Subdivision 4Xr (Bay of Fundy) inshore zone landings (tonnes of meats). Source: Statistics Division, Fisheries & Oceans, Halifax. The periodic cycle curve calculated from the landings data, contains periods of 20.7 (major) and 8.9 (minor) years. See also Table 4.
4
Fi
40° 70° 69 68 67 66 70° 69 68 67 66
5
• 50
• 500 Figure 15. Canadian commercial catches on Georges Bank 45 • 1500 for the period 1957-1984. Catches are presented tonnes
as total catch in tonnes / 10' square.
40° ' i
70° 65 60
23
24
Figure 15 Canadian commercial catches on Georges Bank continued. forthe period 1957-1984. Catches are presented
as total catch in tonnes / 10' square.
5
• 50
• 500
• 1500 tonnes
4
4
-c I
-I ,
~ .. ~"">
I I
42 ~
~
41 I
42
41
42
41
Figure 15 continued.
- J' ~,
:. ;~ ,- ~ : , "
\ ..... ". ~.,.~ ~ ,
" ~~,
[J
69 68 67 66
Canadian commercial catches on Georges Bank for the period 1957-1984. Catches are presented as total catch in tonnes /10' square,
, ;
,;"j~ .. ,/
~
2f . 'I
70° 69 68 67 66
5
• 50
• 500
• 1500 tonnes
25
26
42
41
42
41
42
41
Figure 15 continued.
69
Georges Bank
68 67 66
Canadian commercial catches on Georges Bank forthe period 1957-1984. Catches are presented as total catch in tonnes / 10' square.
69 68 67 66
5
• 50
• 500
• 1500 tonnes
42~ 41
42
41
, ,
"
Georges Bank
Figure 15 Canadian commercial catches on Georges Bank continued. for the period 1957-1984. Catches are presented
as total catch in tonnes / 10' square.
5
• 50
• 500
• 1500 tonnes
27
28
. ". :. t--:,_, ~ .... .. '" " .. ~,~ ~ \~ ;
41
42
41
42
41
69 68 67 66
Figure 16. U.S.A. commercial catches on Georges Bank for the period 1957-1980. Catches are presented as total catch in tonnes / 10' square.
69 68 67 66
5
• 50
• 500
• 1500 tonnes
65 60
41
42
41
42
41
40°
70° 69 68 67 66 70° 69 68 67 66
5
• 50
• 500 Figure 16. U.S.A. commercial catches on Georges Bank 45 • 1500 continued. for the period 1957-1980. Catches are presented tonnes
as total catch in tonnes / 10' square.
40°
70° 65 60
29
70° 69 68 67 66 70° 69 68 67 66
5
• 50
• 500 Figure 16. U.S.A. commercial catches on Georges Bank • 1500 continued. for the period 1957-1980. Catches are presented tonnes
as total catch in tonnes / 10' square.
30
42
41
42
41
42
41
Figure 16. continued.
69 68 67 66
U.S.A. commercial catches on Georges Bank for the period 1957-1980. Catches are presented as total catch in tonnes /10' square.
".
69 68 67 66
5
• 50
• 500
• 1500 tonnes
31
References
Abbott, R. T. 1974. American Seashells. The marine Mollusca of the atlantic and pacific coasts of North America. 2nd Ed. Van Nostrand Reinhold Co., Toronto.
Anonymous. 1920. 53rd annual Report of the Fisheries Research Branch, Dept. of the Naval Service, for the year 1919, Appendix I.
Baird, F. T. Jr. 1953. Observations on the early life history of the sea scallop (Pecten magellancicus). Maine Dept. Sea Shore Fish., Res. Bull. No. 14, 7 p.
Bertin, J. 1981. Graphics and graphic informationprocessing. Transl. by W. J. Berg & P. Scott - Walter de Gruyter, New York. 274 p.
Bourne, N. 1964. Scallops and the offshore fisheries of the Maritimes. Bull. Fish. Res. Bd Can. 145, 60 p.
Brown, RE, M. Parrack, and D.D. Flescher. 1972. Review of the current status of the scallop fishery in ICNAF division 5Z. ICNAF Res. Doc. 72/1l3: l3 p.
CabiJio, P., D.L. DeWolfe, and G.R. Daborn. 1987. Fish catches and long-term tidal cycles in Northwest Atlantic fisheries: a nonlinear regression approach. Can. J. Fish. Aquat. Sci. 44: 1890-1897.
Caddy, J.F. 1972. Progressive loss of byssus attachment with size in the sea scallop, Placopecten magellaniclls (Gmelin). J. expo mar.Bioi. Bcoi. 9: 179-190.
Caddy, J.F. 1979. Long-term trends and evidence for production cycles in the Bay of Fundy scallop fishery. Rapp. P.-v. Reun. Cons. int. Explor. Mer, 175: 97-108.
Chouinard, G.A. 1984. Growth of the sea scallop (Placopecten magellanicus) on the Tormentine bed, Northumberland strait, Canada. ICES, C.M. 19841k:40, 7p.
Couturier, C. Y. 1990. Scallop aquaculture in Canada: fact or fancy? World Aquaculture 21: 54-62.
Culliney, J.L. 1974. Larval development of the giant scallop Placopecten magellanicus (Gmelin). BioI. Bull. 147: 321-332.
Dibacco, C. 1991. ConSidering a semiannual reproductive cycle for the sea scallop (Placopecten magellanicus ), on Georges Banle (Abstract) J. Shellfish Res. 10:271.
DadswelI, MJ. and J. Parsons. 1991. Accelerated growth, increased meat yield, and enhanced survival of giant scallop, Placopecten mageUanicus grown in suspended culture. Abstract. 8th Internation Pectinid Workshop, Cherbourg, France.
DadswelI, MJ. and D. Weihs. 1990. Size-related hydrodynamic characteristics of the giant scallop, Placopecten magellanicus (Bivalvia: Pectinidae). Can. J. Zoo!. (68): 778-785.
32
Dickie, L.M. 1955. Fluctuations in abundance of the giant scallop, Placopecten magellanicus (Gmelin), in the Digby area of the Bay of Fundy. J. Fish. Res. Bd Can. 12(6): 797-857.
Drew, G.A. 1906. The Habits, anatomyh, and embryology of the giant scallop, Placopecten tenuicostatus. Univ. of Maine Studies. No.6. 71 p.
DuPaul, W.D., J.E. Kirkley, and A.C. Schmitzer. 1989. Evidence of a semiannual reproductive cycle for the sea scallop, Placopecten magellanicus (GmeIin, 1791), in the mid-Atlantic region. J. Shellfish Res. 8: 173-178.
Elner, R.W., and G.S. Jamieson. 1979. Predation of sea scallops, Placopecten mageilanicus, by the rock crab, Cancer irroratus, and the American lobster, Homarus americanus. J. Fish. Res. Bd Can. 36: 537-543.
Ganong, W.F. 1889. The economic Mollusca of Acadia. Bull. Nat. Hist. Soc. New Brunswick 8: 3-116.
Giguere, M. et B. Legare. 1989a. Exploitation du petoncle Cote-Nord du Golfe Saint-Laurent et Gaspesie - 1988. Can. Atl. Fish. Sci. Adv. Comm. Res. Doc. 89/15: 27 p.
Giguere, M. et B. Ugare. 1989b. Exploitation du petoncle aux Iles-de-la-Madeleine en 1988. Can. AtI. Fish. Sci. Adv. Comm. Res. Doc. 89/14: 32 p.
Lanteigne, M. and L.-A. Davidson. 1988. Status of the northern Gulf of St. Lawrence Iceland scallop (Chlamys islandica) stock - 1987. Can. Atl. Fish. Sci. Adv. Comm. Res. Doc. 88/54: 19 p.
Lanteigne, M. et L.-A. Davidson. 1989. Evaluation de la pecherie du petoncle. geant (Placopecten mageUanicus) dans Ie sud du golfe Saint-Laurent - 1988. Can. Atl. Fish. Sci. Adv. Comm. Res. Doc. 89/20: 22 p.
Larsen, P.F. and R.M. Lee. 1978. Observations on the abundance, distribution, and growth of postlarval sea scallops, Placopecten magellanicus, on Georges Bank. The Naut. 92: 112-116.
Lescarbot, M. 1609. Histoire de la Nouvelle-France. Paris.
Loder, J.W. 1980. Secondary tidal effects in tidallyenergetic shallow seas, with applications to the Gulf of Maine. Ph. D. Thesis, Dalhousie University, Halifax, N.S. 279 p.
MacDonald, B.A. 1984. The partitioning of energy between growth and reproduction in the Giant Scallop, Placopecten mageUanicus (Gmelin). Ph. D. Thesis, Memorial University, St. John's, Newfld. 202 p.
MacDonald, B.A. and RJ. Thompson. 1986. The influence of temperature and food availability on the ecological energetics of the giant scallop Placopecten magellanicus III. Physiological ecology, the gametogenic cycle and scope for growth. Mar. BioI. 93: 37-48.
nt 'y 7-
~y
of
~a
'1-
'i-
a.
Ie n.
le v.
Ie j-
1.
a .) 1.
e
e
f
MacKenzie, c.L. 1979. Biological and fisheries data on sea scallop, Placopecten lllagellanicus (Gmelin). Tech. Ser. Report No. 19, Northeast Fish. Center, Sandy Hook, N.J. 36p.
Medcof, J.C. 1949. Dark meat and the shell disease of scallops. Fish Res. Bd Can. Prog, Rep. Atl. BioI. Station no. 45: 3-5.
Medcof, J.C. and N. Bourne. 1964. Causes of mortality of the sea scallop, Placopecten magellanicus. Proc. Natl. Shellfish. Assoc., 53: 33-50.
Melvin, G.D., M.J. Dadswell, and R.A. Chandler. 1985. Movement of scallops Placopecten magellanicus (Gmelin, 1971) (Mollusca: Pectinidae) on Georges Bank. Can. Atl. Fish. Sci. Adv. Comm. Res. Doc. 85/30: 29p.
Merrill, A.S. and R. L. Edwards. 1976. Observations on mollusks from a navigation buoy with special emphasis on the sea scallop Placopecten magellanicus. The Naut. 90: 54-61.
Merrill, A.S., J.A. Posgay, and F.E. Nichy. 1966. Annual marks on shell and ligament of sea scallop Placopecten magellanicus. Fish. Bull. NOAA, 65(2): 299-311.
Mohn, R.K., G. Robert, and G.A.P. Black. 1989. Georges Bank scallop stock assessment - 1988. Can. Atl. Fish. Sci. Adv. Comm. Res. Doc. 89/21: 26p.
Mottet, M.G. 1979. A review of the fishery biology and culture of scallops. State of Washington Dept. of Fisheries, Tech. Rep. No. 39, 100 p.
Naidu, K.S. 1970. Reproduction and breeding cycle of the giant scallop Placopecten magellanicus (Gmelin) in Port au Port Bay, Newfoundland. Can. 1. Zool. 48: 1003-1012.
Naidu, K.S. 1975. Growth and population structure of a northern shallow-water population of the Giant Scallop Placopecten magellanicus (Gmelin). ICES CM. 1975/ K:37.
Naidu, K.S., F.M. Cahill, and D.B. Lewis. 1982. Status and assessment of the Iceland scallop, Chlamys islandica in the northeastern Gulf of St. Lawrence. Can. Atl. Fish. Sci. Adv. Comm. Res. Doc. 82/2: 66 p.
Naidu, K.S. and S. Meron. 1986. Predation of scallops by American Plaice and Yellowtail Flounder. Can. Atl. Fish. Sci. Adv. Comm. Res. Doc. 86/62: 25 p.
Pedersen, S.A. 1989. Inshore scallop resources, Chlamys islandica, in the Nuuk area West Greenland. NAFO SCR Doc. 89/20.
Posgay, J.A. 1957. The range of the sea scallop. The Nautl. 71(2): 55-57.
Robert, G., M.J. Lundy, and M.A.E. Butler-Connoly. 1989a. Bay of Fundy scallop stock assessment for 1988, a year of record landing. Can. Atl. Fish. Sci. Adv. Comm. 89/ 18: 38 p.
Robert, G., MJ. Lundy, and M.A.E. Butler-Connoly. 1989b. Scallop fishing grounds on the Scotian Shelf -1988. Can. Atl. Fish. Sci. Adv. Comm. 89/19: 33 p.
Robinson, W.E., W.E. Wehling, M.P. Morse, and G. McLeod. 1981. Seasonal changes in soft-body component indices and energy reserves in the Atlantic deep-sea scallop, Placopecten magellanicus. Fish. Bull. 79: 449-458.
Savage, N. B. 1980. Monitoring of bivalve larvae continues off the New Hampshire coast. Coastal Oceanogr. Climatol. News (Univ. Rhode Island) 2: 44-45.
Schmitzer, A.C., W.D. Dupaul, and J.E. Kirkley. 1991. Gametogenic cycle of sea scallops (Placopecten magellanicus (Gmelin, 1791» in the mid-Atlantic Bight. J. Shellfish Res. 10: 221-228.
Serchuk, F.M. and R.L. Wigley. 1984. USA sea scallop research vessel survey: Status of sea scallop resources in the Georges Bank, Mid-Atlantic, and Gulf of Maine regions and abundance and distribution of Iceland scallops off the Southeastern coast of Cape Cod. Woods Hole Lab. Ref. Doc. 84-34. 74 p.
Serchuk, F.M., P.W. Wood, J.A. Posgay, and B.E. Brown. 1979. Assessment and status of sea scallop (Placopecten magellanicus) populations off the northeast coast of the United States. Proc. Nat'! Shellfish. Assoc. 69: 161-191.
Shumway, S. E., R. Selvin, and D. F. Schick. 1987. Food resources related to habitat in tlle scallop Placopecten magellanicus (Gmelin, 1791): a qualitative study. 1. Shellfish Res. 6: 89-95.
Shumway, S. E. 1991. Scallops: biology, ecology and aquaculture. Developments in Aquaculture & Fisheries Sciences. 21. Elsevier Science Publishing B.V. Amsterdam. 1095 p.
Sinclair, M., R.K. Mohn, G. Robert, and D.L. Roddick. 1985. Considerations for the effective management of Atlantic scallops. Can. Tech. Rep. Fish. Aquat. Sci. 1382: 113p.
Squires, H.T. 1962. Giant scallops in Newfoundland coastal waters. Bull. Fish. Res. Bd Can., 135: 29 p.
Thomson, R.J. 1977. Blood chemistry, biochemical composition, and the annual reproductive cycle in tlle Giant Scallop, Placopecten magellanicus, from Southeast Newfoundland.1. Fish. Res. Bd Can. 34: 2104-2116.
Thouzeau, G., G. Robert, and S.J. Smith. 1991. Spatial variability in distribution and growtll of juvenile and adult sea scallops Placopecten magellanicus (Gmelin) on eastern Georges Bank (Northwest Atlantic). Mar. Ecol. Prog. Ser. 74: 205-218.
Tremblay, M. J., L. D. Meade, and G. V. Hurley. 1987. Identification of planktonic sea scallop larvae (Placopecten magellanicus) (Gmelin). Can. J. Fish. Aquat. Sci. 44: 1361-1366.
33
34
Tremblay, M. J. and M. Sinclair. 1988. The vertical and horizontal distribution of sea scallop (Placopectell mage!lallicus) larvae in the Bay of Fundy in 1984 and 1985. J. N0rt11W. All. Fish. Sci. 8: 43-53.
Tremblay, M. J. and M. Sinclair. 1990a. Sea scallop larvae Placopectell magellallicus on Georges Bank: vertical distribution in relation to water column stratification and food. Mar. Ecol. Progr. Ser. 61: 1-15.
Tremblay, M. J. and M. Sinclair. 1990b. Diel vertical migration of Sea scallop larvae Placopectell magellallicus in a shallow embayment. Mar. Ecol. Progr. Ser. 67: 19-25.
Tremblay, M. J. and M.M. Sinclair. 1992. Planktonic sea scallop larvae (Placopectell magellanicus) in the Georges Bank region: broad scale distribution in relation to physical oceanography. Can. J. Fish. Aquat. Sci. 49: 1597-1615.
Vahl, O. 1981. Energy transformations by the Iceland scallop, Chlamys islalldica (O.F. Miiller), from 70oN. I. The age-specific energy budget and net growth efficiency. J. expo mar. BioI. Ecol. 53: 281-296.
Van Dam, L. 1954. On the respiration in scallops (Lamellibranchiata). BioI. Bull. Mar. BioI. Lab. Woods Hole, 107: 192-202.
Watson, D.F. and G.M. Philip. 1985. A refinement of inverse distance weighted interpolation. Geo-Processing 2: 315-327.
Wigley, R.L. and R.B. Theroux. 1971. Association between post juvenile red hake and sea scallops. Proc. Natl. Shellfish. Assoc., 61: 86-87.
Willis, J.R. 1862. Our edible mollusca. Colonial Review, Halifax, Nov. 29, 1862 (quoted by Ganong, W.F. in Bibliographical & Critical Notice of Willis' Published Papers, p. 414 of Proc. Trans. Nova Scotian lnst. Nat. Sci., 7(4): 1889-1890).