atllas ii - elib.dlr.de of fea... · cmc ceramic matrix composite . ... high temperature peaks at...
TRANSCRIPT
ACP0-GA-2010-263913
ATLLAS II
Aero-Thermodynamic Loads on Lightweight Advanced Structures II
Collaborative Project: Small or Medium-Scale Focused Research Project
Theme 7: TRANSPORT
Deliverable Reference Number: D3.1.9
Deliverable Title:
Validation of FEA results by results of aero-thermal testing
Due date of deliverable: 31st of August 2015 (T0+52)
Actual submission date: 15th of December 2015
Start date of project: 1st of May 2011
Duration: 54 months
Organisation: DLR WF
Revision #: 1
Project co-funded by the European Commission within the Seventh Framework Programme (2007-2013)
Dissemination Level
PU Public X
PP Restricted to other programme participants (including the Commission Services)
RE Restricted to a group specified by the consortium (including the Commission Services)
CO Confidential, only for members of the consortium (including the Commission Services)

ATLLAS II Del. No. D3.1.9 Validation of FEA results by results of aero-thermal testing Page 2 of 23
APPROVAL
Title Validation of FEA results by results of aero-thermal testing
issue 1
revision
1
Author(s) Dr. Galina Kasperovich
date 16.12.2015
Approved by Markus Kuhn (DLR)
Dr. Johan Steelant (ESA)
Date 17.12.2014
21.12.2015

ATLLAS II Del. No. D3.1.9 Validation of FEA results by results of aero-thermal testing Page 3 of 23
Table of contents 1 Executive summary ............................................................................................................... 6
1.1 Scope of the deliverable ................................................................................................... 6
1.2 Results ............................................................................................................................. 6
1.3 Specific highlights ............................................................................................................. 7
1.4 Forms of integration within the work-package and with other WPs.................................... 7
1.5 Problem areas .................................................................................................................. 7
2 Introduction ............................................................................................................................ 8
3 CANARD Numerical Model .................................................................................................... 9
3.1 Modelling Conditions......................................................................................................... 9
3.2 Main Results of CANARD Modelling ............................................................................... 11
4 Validation of FEM results by results of aero-thermal testing ........................................... 19
5 Conclusions ......................................................................................................................... 22
References .................................................................................................................................. 23

ATLLAS II Del. No. D3.1.9 Validation of FEA results by results of aero-thermal testing Page 4 of 23
List of Figures Fig. 1: Completed cooling cores: numerical model (a) and actual part (b) manufactured by TISICS.
................................................................................................................................................ 9
Fig. 2: Schematic view and assembly image illustrating thermocouple positions in the cooling core. .............................................................................................................................................. 11
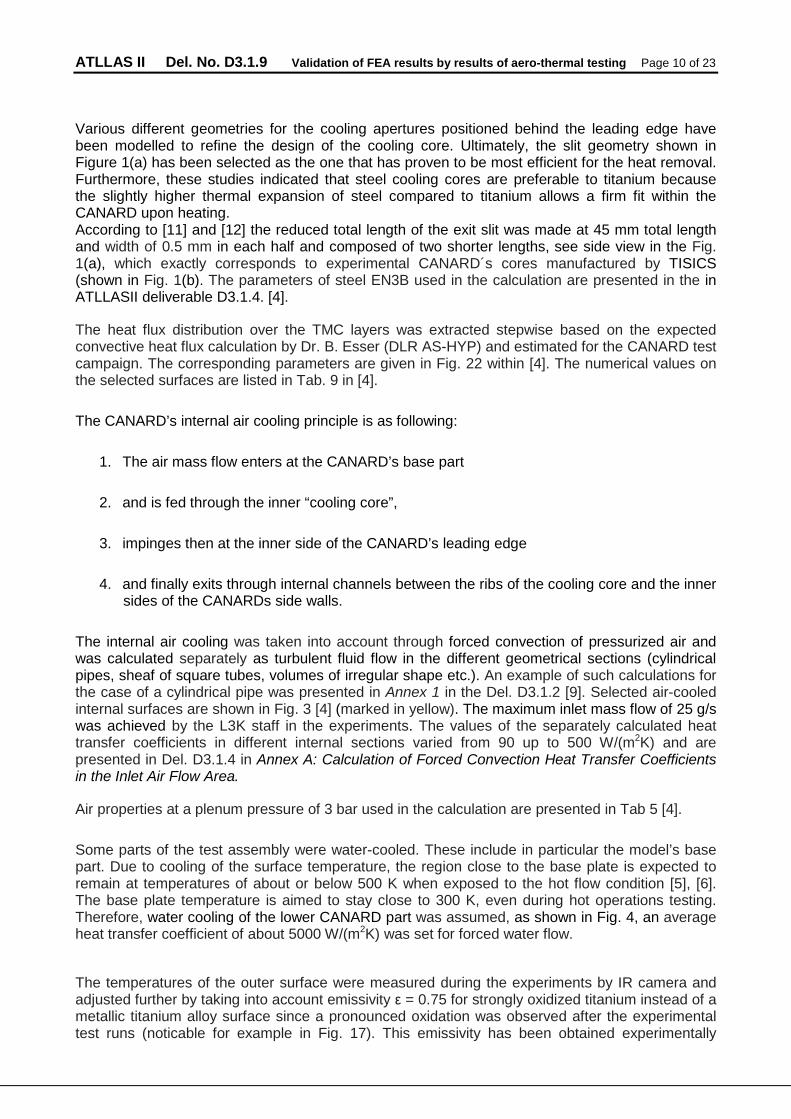
Fig. 3: Temperature distribution in the CANARD (R0.8, Qmax=1.02 x 10⁶ W/m2). The maximum temperature on the leading edge in the CANARD is approximately 1073°C. .......................... 12
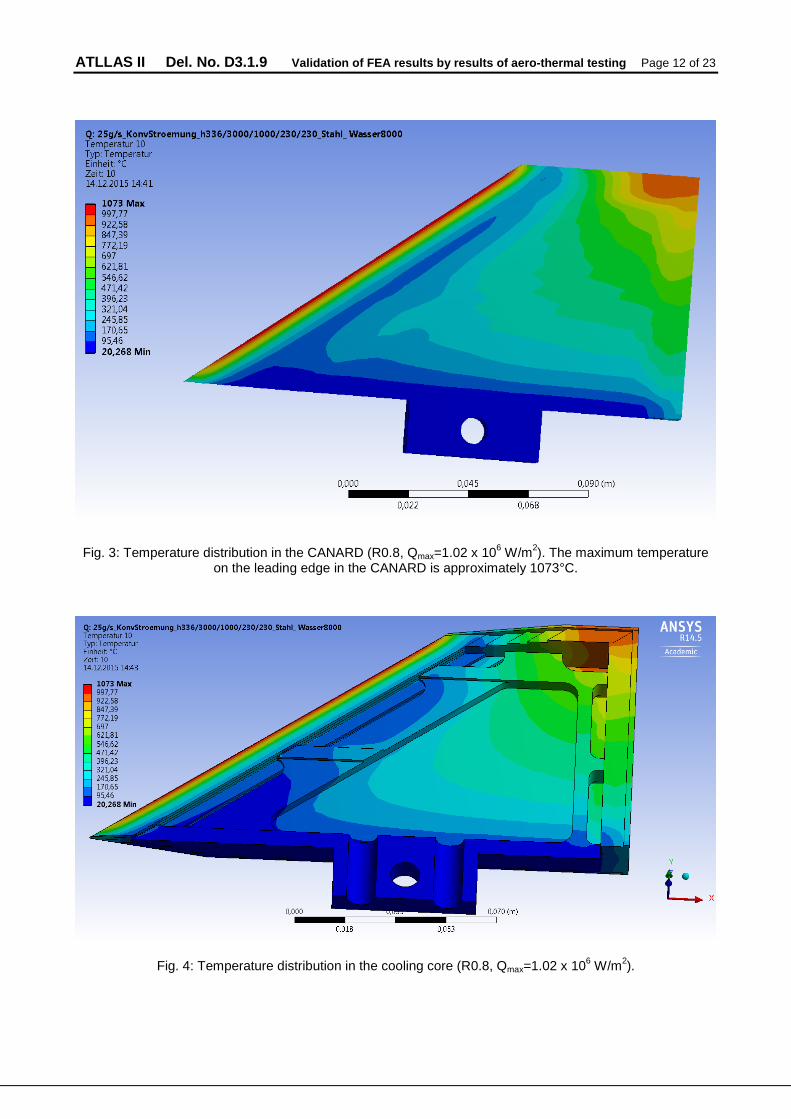
Fig. 4: Temperature distribution in the cooling core (R0.8, Qmax=1.02 x 10⁶ W/m2). ....................... 12
Fig. 5: Temperature distribution in the leading edge (R0.8, Qmax=1.02 x 10⁶ W/m2). The maximum temperature on the leading edge in the CANARD is approximately 1073°C. .......................... 13
Fig. 6: Temperature distribution between the cooling core locating points of the attached thermocouples TC1, TC2 and TC3 and the back of the CANARD leading edge. ................... 13
Fig. 7: Maximum principal stress: CANARD. Maximum values are shown in red: 1824 MPa......... 14
Fig. 8: Maximum principal stress: TMC part. Maximum values are shown in red: 1824 MPa. ........ 14
Fig. 9: Total deformation. Maximum values are shown in red: 0.283 mm. ..................................... 15
Fig. 10: Directional deformation (X axis). Maximum values are shown in red: 0.185 mm. ............. 15
Fig. 11: Directional deformation (Y axis). Maximum values are shown in red: 0.276 mm. ............. 16
Fig. 12: Directional deformation (Z axis). Maximum values are shown in red and in blue: “+0.080” mm and “-0.082”mm respectively. .......................................................................................... 16
Fig. 13: Equivalent stress (von-Mises): CANARD. Maximum values are shown in red: 2384 MPa. 17
Fig. 14: Equivalent stress (von-Mises): TMC part. Maximum values are shown in red: 1684 MPa. 17
Fig. 15: Equivalent stress (von-Mises): leading edge TMC layer. Maximum values are shown in red: 533 MPa. ....................................................................................................................... 18
Fig. 16: Comparison of the temperatures of the leading edge calculated for the numerical FEM model and the experimental data obtained in the CANARD test campaign in the DLR’s arc heated facility L3K.................................................................................................................. 19
Fig. 17: the experimental temperatures of the CANARD model's core measured at three positions by thermocouplesTC1, TC2 and TC3 according to Fig. 2 (continuous lines) and numerical calculated maximum temperatures of contact surface of the thermocouples locations (dotted lines). ..................................................................................................................................... 20
Fig. 18: CANARD surfaces after the testing in the DLR´s arc heated facility L3K. ......................... 21
Fig. 19. Temperature fields of the CANARD computed numerically for the experimental test conditions. ............................................................................................................................. 21

ATLLAS II Del. No. D3.1.9 Validation of FEA results by results of aero-thermal testing Page 5 of 23
Nomenclature
Acronyms DLR German Aerospace Centre
WF Institute of Materials Research
AS-HYP Institute of Aerodynamics and Flow Technology (IAS), Supersonic and Hypersonic Technology Department (HY)
TGMF Thermo-Gradient Mechanical Fatigue
TMC Titanium Matrix Composite
CMC Ceramic Matrix Composite
IR Infrared camera
TISICS Titanium Composite Manufacturers, Farnborough, UK
Roman and Greek Symbols B slit jet nozzle width
δ slit jet nozzle length
L total nozzle length
Q heat flux, W/m²
R radius, m
Superscripts and subscripts

ATLLAS II Del. No. D3.1.9 Validation of FEA results by results of aero-thermal testing Page 6 of 23
1 Executive summary
1.1 Scope of the deliverable
This document describes the validation of the FEA results by the aero-thermal testing. The numerical modelling of a TMC-based CANARD model designed and manufactured by TISICS [1] [2] was performed using ANSYS software [3] within the frame of the ATLLAS II project and has been presented previously in detail in the deliverable D3.1.4 [4].
The CANARD model has been aero-thermally tested at DLR’s L3K facility [5] in a similar approach to the former ATLLAS project with a CMC-based CANARD model as described in [6], [7] and [8].
The calculations of the temperature fields, strains and stresses in the complete model and in the TMC part in particular were conducted for the curvature radius of CANARD’s leading edge of 0.8 mm according to the heat flux density provided by DLR AS-HYP. EN3B steel was examined as a cooling core material. The maximum cooling air mass flow has been set according to the experimental conditions and was not higher than of 25 g/s. The larger heat loss from the tip of the CANARD’s nose is provided to avoid the artificial numerical effect described in D3.1.4 [4], where high temperature peaks at the bottom part of the leading edges is calculated of 2200°C.
1.2 Results
The numerical results of the temperature fields, mechanical stresses and deformations in the CANARD model are presented in Chapter 3.2 of this report for the steel EN3B as a cooling core material and compared with the results of aero-thermal testing in Chapter 4.
A steel core enables a higher cooling efficiency and, thus, results in higher thermal stresses. These stresses are caused by the thermal shrinking of the TMC part onto the cooling core. However, stresses in the real demonstrator parts may be lower due to unavoidable gaps between TMC and the cooling core.
As one main result of the numerical modeling it was observed that the temperatures at the given maximum heat flow of 1.02 x 10⁶ W/m2 are relatively high at temperatures of ~1000°C. Generally, operational limits for titanium alloys in aerospace industry are much lower. Ti 6242 which (a high temperature creep resistant variant) is designed to operate up to 550oC, although it was observed that they can survive under load at higher temperature ~1000oC. According to the FEM calculations the maximum temperature of the leading edge reaches 1073°C with the maximum air mass flow of 25 g/s. This value coincides well with the experimental data: the measured maximum temperature of the leading edge approached approximately 1100°C. The experimental temperature fields were obtained by IR camera and corrected taking into account the change of the emissivity for strongly oxidized titanium (a value of 0.75 was used). This emissivity has been experimentally determined when calibrating a pyrometer at experimental TGMF test with TMC materials at the DLR WF mechanical testing laboratory (s. results from composite and monolithic tests [9]).
ATLLAS II Del. No. D3.1.9 Validation of FEA results by results of aero-thermal testing Page 7 of 23
1.3 Specific highlights
Not applicable
1.4 Forms of integration within the work-package and with other WPs
The test campaign on TMC and monolithic Ti6242 samples at DLR’s Thermo-Gradient-Mechanical Fatigue TGMF facility was previously investigated and integrated into the material development and characterization activities in WP 3, in particular the activities on TMC materials in WP 3.1 (Del. No. D3.1.2). The experiments and observations of the thermo-mechanically loaded materials and the corresponding numerical modelling were presented in the previous report [9].
The FEA modelling results presented in this report describe the thermo-mechanical loading for aero-thermal leading edge tests, which will be conducted in the framework of the ATLLAS II project (Del. No. D3.1.7) at DLR’s L3K facility. The FEA model, the employed initial and boundary conditions, heat transfer coefficients during processes (including the jet impingement coefficient), and the variational geometrical calculations of the core nozzle in order to obtain maximum cooling were presented in the framework of the ATLLAS II project (Del. No. D3.1.4) in the previous report [4].
Within current deliverable D3.1.9, these FEA results are compared to the results of the aero-thermal L3K testing, which will be presented in deliverable D3.1.7 (DLR AS-HY): Aerothermal tests in the arc-heated facility L3K.
1.5 Problem areas
None

ATLLAS II Del. No. D3.1.9 Validation of FEA results by results of aero-thermal testing Page 8 of 23
2 Introduction
The numerical FEA model of the “CANARD” designed from TMC material [10] by TISICS [1] for the aero-thermal tests using the L3K facility [5] was considered within the frame of the ATLLAS II project. As a final specification for the CANARD model, the cooling cores with exit slit geometries providing the most efficient impingement cooling effect inside of the TMC CANARD were considered for manufacture and testing [4].
The calculations of the temperature fields, strains and stresses in the TMC part were conducted for a 0.8 mm CANARD leading edge radius according to the heat flux density provided by DLR AS-HYP. EN3B steel was examined as a cooling core material. The results are presented, discussed and compared with the experimental data received by thermal tests using the L3K facility.

ATLLAS II Del. No. D3.1.9 Validation of FEA results by results of aero-thermal testing Page 9 of 23
3 CANARD Numerical Model
3.1 Modelling Conditions
The finite element method as implemented in the ANSYS software [3] was used for the modeling of the CANARD test. The CANARD test campaign was performed in the DLR’s arc heated facility L3K [5]. A setup of similar tests of the former ATLLAS project is presented and described in [6], [7] and [8]. A model with a sharp-edged or blunt leading edge nose is placed on a base plate, fixed and heated under arc-heat flow, which is accelerated to hypersonic velocities by conical nozzles. The main parameters under the operation conditions are governed by the heat fluxes towards the model, while the sharp leading edge of the model receives maximum temperatures.
The model for the testing is designed and provided by TISICS [1] and consists of two parts: A “TMC part” and a “cooling core”. The outer surface of the TMC part is coated by two layers of nominally 140 µm thick Ti6242 foil, which is further polished to reduce their thickness to around 200 µm in total. The outer shell from titanium Ti6242 is not considered in the numerical modelling because its low thickness is considered negligible.
The CANARD shell consists of 4 fibre ply reinforcement layers of TMC (60% Ti6242 + 40% SiC fibers). The physical and orthotropic elastic properties of TMC used in the calculation had been presented in the tables 1 and 2 in the previous report Del. No. D3.1.4 [4].
a) b)
Fig. 1: Completed cooling cores: numerical model (a) and actual part (b) manufactured by TISICS.
Two versions of the CANARD leading edges were provided for experimental testing: a version with a sharp-edged and one with a blunt leading edge with a 0.8 mm radius. The calculation presented here has been carried out for the latter case with blunt leading edges. The heat transfer properties of the basic design provided above in the planned L3K test conditions has been modelled by DLR and the outcome reported in ATLLASII deliverable D3.1.4. [3]. This study indicated that in the basic design the cooling efficiency is poor and the leading edge material reaches temperatures far in excess of the material capability, specifically with regard to the matrix alloy.
ATLLAS II Del. No. D3.1.9 Validation of FEA results by results of aero-thermal testing Page 10 of 23
Various different geometries for the cooling apertures positioned behind the leading edge have been modelled to refine the design of the cooling core. Ultimately, the slit geometry shown in Figure 1(a) has been selected as the one that has proven to be most efficient for the heat removal. Furthermore, these studies indicated that steel cooling cores are preferable to titanium because the slightly higher thermal expansion of steel compared to titanium allows a firm fit within the CANARD upon heating. According to [11] and [12] the reduced total length of the exit slit was made at 45 mm total length and width of 0.5 mm in each half and composed of two shorter lengths, see side view in the Fig. 1(a), which exactly corresponds to experimental CANARD´s cores manufactured by TISICS (shown in Fig. 1(b). The parameters of steel EN3B used in the calculation are presented in the in ATLLASII deliverable D3.1.4. [4].
The heat flux distribution over the TMC layers was extracted stepwise based on the expected convective heat flux calculation by Dr. B. Esser (DLR AS-HYP) and estimated for the CANARD test campaign. The corresponding parameters are given in Fig. 22 within [4]. The numerical values on the selected surfaces are listed in Tab. 9 in [4].
The CANARD’s internal air cooling principle is as following:
1. The air mass flow enters at the CANARD’s base part
2. and is fed through the inner “cooling core”,
3. impinges then at the inner side of the CANARD’s leading edge
4. and finally exits through internal channels between the ribs of the cooling core and the inner sides of the CANARDs side walls.
The internal air cooling was taken into account through forced convection of pressurized air and was calculated separately as turbulent fluid flow in the different geometrical sections (cylindrical pipes, sheaf of square tubes, volumes of irregular shape etc.). An example of such calculations for the case of a cylindrical pipe was presented in Annex 1 in the Del. D3.1.2 [9]. Selected air-cooled internal surfaces are shown in Fig. 3 [4] (marked in yellow). The maximum inlet mass flow of 25 g/s was achieved by the L3K staff in the experiments. The values of the separately calculated heat transfer coefficients in different internal sections varied from 90 up to 500 W/(m2K) and are presented in Del. D3.1.4 in Annex A: Calculation of Forced Convection Heat Transfer Coefficients in the Inlet Air Flow Area.
Air properties at a plenum pressure of 3 bar used in the calculation are presented in Tab 5 [4].
Some parts of the test assembly were water-cooled. These include in particular the model’s base part. Due to cooling of the surface temperature, the region close to the base plate is expected to remain at temperatures of about or below 500 K when exposed to the hot flow condition [5], [6]. The base plate temperature is aimed to stay close to 300 K, even during hot operations testing. Therefore, water cooling of the lower CANARD part was assumed, as shown in Fig. 4, an average heat transfer coefficient of about 5000 W/(m2K) was set for forced water flow.
The temperatures of the outer surface were measured during the experiments by IR camera and adjusted further by taking into account emissivity ε = 0.75 for strongly oxidized titanium instead of a metallic titanium alloy surface since a pronounced oxidation was observed after the experimental test runs (noticable for example in Fig. 17). This emissivity has been obtained experimentally

ATLLAS II Del. No. D3.1.9 Validation of FEA results by results of aero-thermal testing Page 11 of 23
through the calibration of a pyrometer by conducting TGMF experiments with TMC materials (see Results from composite and monolithic tests [9]).
DLR and TISICS agreed on positioning the thermocouples in the experimental tests at three positions of the CANARD model's core as is depicted in Fig. 2. Three thermocouples exit the cooling core through the plenum jet channel and are clamped between the cooling core and the back of the CANARD leading edge [2].
Fig. 2: Schematic view and assembly image illustrating thermocouple positions in the cooling core.
3.2 Main Results of CANARD Modelling
The main results of the calculations are shown below for the CANARD model with a steel EN3B cooling core and an air mass flow of 25 g/s. Fig. 3 and Fig. 4 present the temperature distributions in the entire CANARD model and in particular in the cooling core, respectively. The fields are calculated for a quasistationary state of the model in experiment.
The obtained maximum temperature on the leading edge in the CANARD model is approximately 1073°C.
Special attention was paid to the most thermally loaded part of the model - the leading edge. Fig. 5 shows its outer surface temperature and the temperature distribution along the perpendicular cross-section in the region of the maximum temperatures.
Fig. 6 shows the temperature distribution between the cooling core locating points of the thermocouples TC1, TC2 and TC3 and the back of the CANARD leading edge. It should be noted, that temperature in the lower nose part of the model reaches 276°C for the steel core assuming a maximum heat flux of Qmax= 1.02 x 10⁶ W/m2 . This temperature value only slightly exceeds the test requirements of maximum 500 K (≈ 227°C) – see for example Fig. 5.
ATLLAS II Del. No. D3.1.9 Validation of FEA results by results of aero-thermal testing Page 12 of 23
Fig. 3: Temperature distribution in the CANARD (R0.8, Qmax=1.02 x 10⁶ W/m2). The maximum temperature on the leading edge in the CANARD is approximately 1073°C.
Fig. 4: Temperature distribution in the cooling core (R0.8, Qmax=1.02 x 10⁶ W/m2).

ATLLAS II Del. No. D3.1.9 Validation of FEA results by results of aero-thermal testing Page 13 of 23
Fig. 5: Temperature distribution in the leading edge (R0.8, Qmax=1.02 x 10⁶ W/m2). The maximum temperature on the leading edge in the CANARD is approximately 1073°C.
Fig. 6: Temperature distribution between the cooling core locating points of the attached thermocouples TC1, TC2 and TC3 and the back of the CANARD leading edge.

ATLLAS II Del. No. D3.1.9 Validation of FEA results by results of aero-thermal testing Page 14 of 23
The maximum principal stresses for the entire CANARD and for the TMC part in particular is shown in Fig. 7 and Fig. 8, respectively.
Fig. 7: Maximum principal stress: CANARD. Maximum values are shown in red: 1824 MPa.
Fig. 8: Maximum principal stress: TMC part. Maximum values are shown in red: 1824 MPa.
ATLLAS II Del. No. D3.1.9 Validation of FEA results by results of aero-thermal testing Page 15 of 23
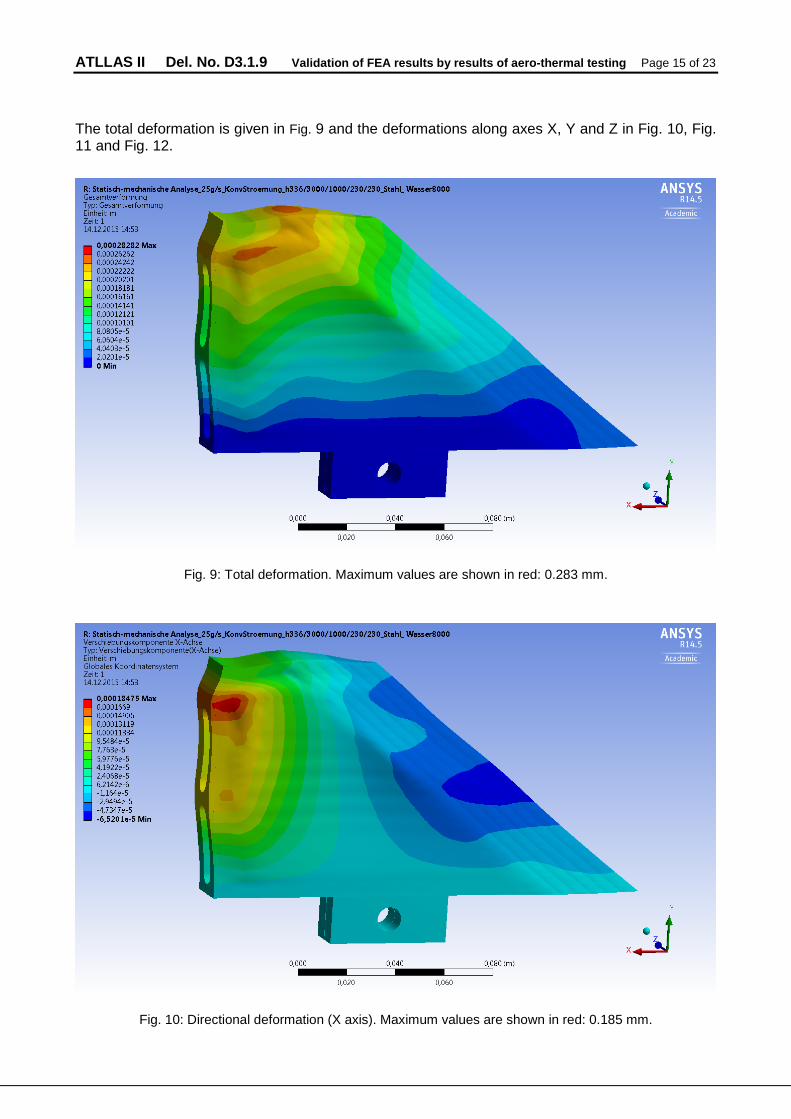
The total deformation is given in Fig. 9 and the deformations along axes X, Y and Z in Fig. 10, Fig. 11 and Fig. 12.
Fig. 9: Total deformation. Maximum values are shown in red: 0.283 mm.
Fig. 10: Directional deformation (X axis). Maximum values are shown in red: 0.185 mm.
ATLLAS II Del. No. D3.1.9 Validation of FEA results by results of aero-thermal testing Page 16 of 23
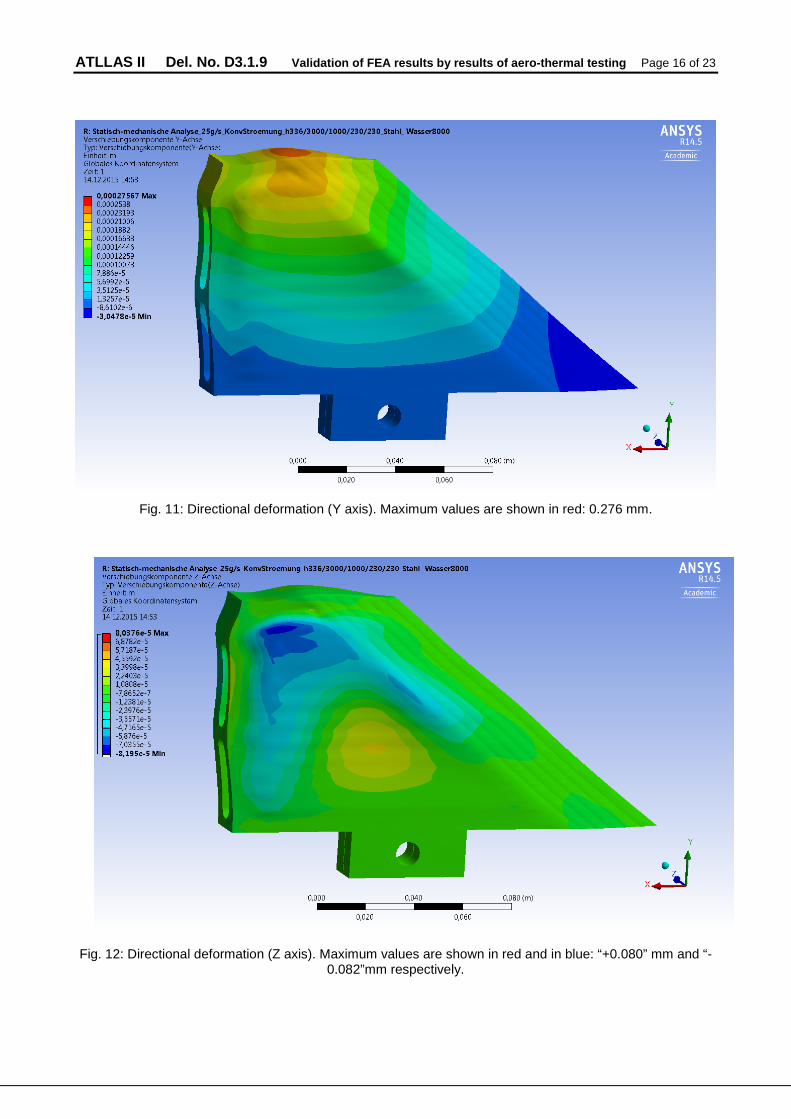
Fig. 11: Directional deformation (Y axis). Maximum values are shown in red: 0.276 mm.
Fig. 12: Directional deformation (Z axis). Maximum values are shown in red and in blue: “+0.080” mm and “-0.082”mm respectively.
ATLLAS II Del. No. D3.1.9 Validation of FEA results by results of aero-thermal testing Page 17 of 23
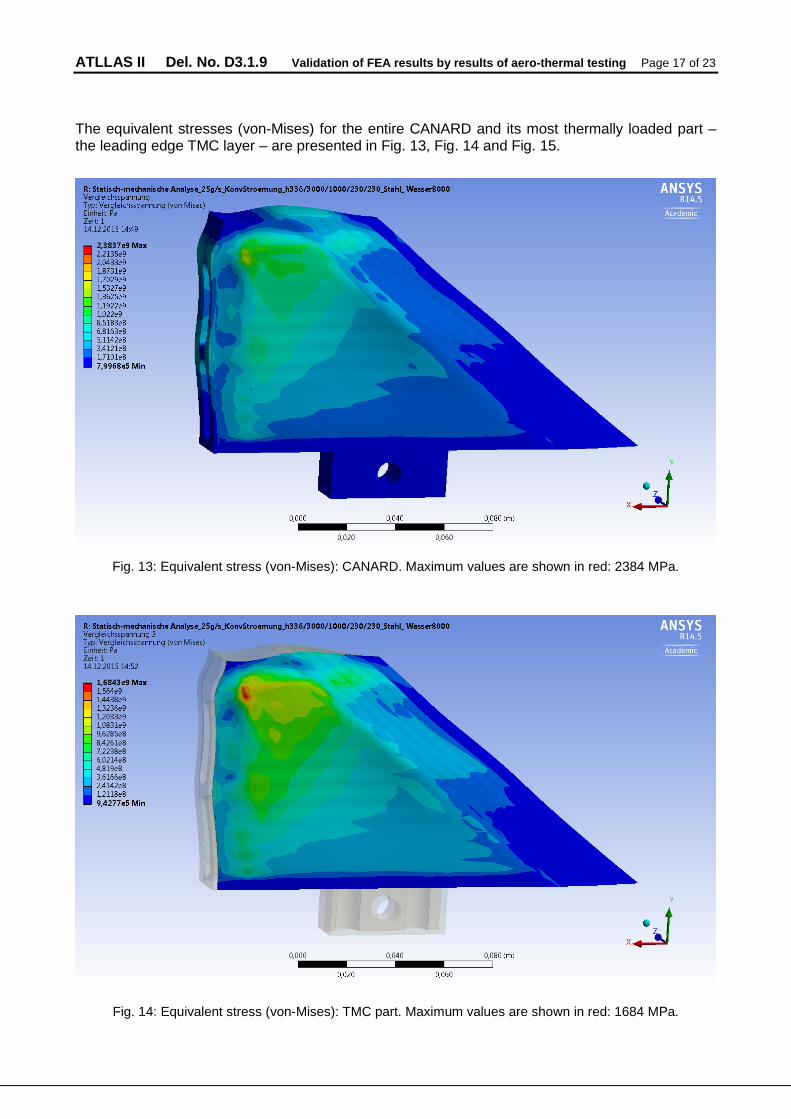
The equivalent stresses (von-Mises) for the entire CANARD and its most thermally loaded part – the leading edge TMC layer – are presented in Fig. 13, Fig. 14 and Fig. 15.
Fig. 13: Equivalent stress (von-Mises): CANARD. Maximum values are shown in red: 2384 MPa.
Fig. 14: Equivalent stress (von-Mises): TMC part. Maximum values are shown in red: 1684 MPa.

ATLLAS II Del. No. D3.1.9 Validation of FEA results by results of aero-thermal testing Page 18 of 23
Fig. 15: Equivalent stress (von-Mises): leading edge TMC layer. Maximum values are shown in red: 533 MPa.

ATLLAS II Del. No. D3.1.9 Validation of FEA results by results of aero-thermal testing Page 19 of 23
4 Validation of FEM results by results of aero-thermal testing
In this section, the main results of the temperature field calculations of the CANARD model with the chosen steel EN3B cooling core at the maximum air mass flow of 25 g/s are compared with the experimental results of aero-thermal L3K testing. The experimental temperature fields were obtained by IR camera and recalculated taking an emissivity for strongly oxidized titanium with ε = 0.75 into account
Fig. 16: Comparison of the temperatures of the leading edge calculated for the numerical FEM model and
the experimental data obtained in the CANARD test campaign in the DLR’s arc heated facility L3K.
Fig. 16 shows the temperatures of the leading edge for the numerical and experimental models. The performed numerical analyses are in fairly good agreement with the measured values.

ATLLAS II Del. No. D3.1.9 Validation of FEA results by results of aero-thermal testing Page 20 of 23
Fig. 17: the experimental temperatures of the CANARD model's core measured at three positions by thermocouplesTC1, TC2 and TC3 according to Fig. 2 (continuous lines) and numerical calculated maximum
temperatures of contact surface of the thermocouples locations (dotted lines).
Nevertheless, for the conducted experimental tests it was not able to reach steady-state conditions. This is for instance reflected by the internal thermocouple temperature traces (Fig. 17) during the tests. Hence, only transient data was recorded which does not show the same trends as the numerically detected steady-state solutions. This happens in particular for the upper thermocouple TC3 inside the CANARD wing.
Still, the applied impingement cooling mass flow indicates a too low cooling performance which might have resulted in locally increased surface temperatures at the leading edge section. This is reflected by the visual appearance of the CANARD wing which shows local regions of oxidised material (Fig. 18). It has to be mentioned that already the numerical simulation (Fig. 19) predicted surface temperatures being at the operational limits for titanium-based materials; for this reason it was aimed to heavily increase the internal impingement cooling efficiency to lower leading edge surface temperatures on the other side.

ATLLAS II Del. No. D3.1.9 Validation of FEA results by results of aero-thermal testing Page 21 of 23
Fig. 18: CANARD surfaces after the testing in the DLR´s arc heated facility L3K.
Fig. 19. Temperature fields of the CANARD computed numerically for the experimental test conditions.

ATLLAS II Del. No. D3.1.9 Validation of FEA results by results of aero-thermal testing Page 22 of 23
5 Conclusions
• The numerical simulation of the CANARD model described in Chapter 3 resulted in higher temperature levels which exceeded the operational limits of the given titanium alloy and TMC material: 1073 °C in the numerical modelling and 1109 °C measured by IR camera during the experimental testing.
• The optimal nozzle geometry proposed in the previous numerical calculations (Del. D3.1.4 [4]), adopted according to [11] and [12] and manufactured by TISICS is able to provide the necessary heat dissipation, but the total amount of cooling air flow should ideally be even greater.
• A steel core enables higher cooling efficiencies but also results in higher thermal stresses. These stresses are caused by the thermal shrinkage of the TMC part onto the cooling core. However, stresses in the real part may be lower due to gaps between TMC and the cooling core.
• Whereas numerical simulations are based on steady-state conditions, the conducted tests only allowed short-term tests with transient temperature traces. This makes a direct comparison difficult as no saturation phase was reached.
• The maximum temperatures computed numerically and received in the experimental test are in good agreement.
• The elevated temperatures of the lower portion of edge in the numerical simulation (Fig. 16) can be explained by the greater time of the heat distribution. - The model assumes a quasi-steady state.
• The cooling front along the leading edge in the experiment is less even as compared to the same edge in the simulation, which can be explained by increased cooling gas mass flow in the lower region of CANARD.

ATLLAS II Del. No. D3.1.9 Validation of FEA results by results of aero-thermal testing Page 23 of 23
References
[1] S. Flitcroft, R. Durman, J. Hausmann. Titanium MMC: fabrication and test status WP3.1, ATLLAS II Progress Meeting 2, Stuttgart, Germany, 22.05.2012.
[2] S. Flitcroft, R. Durman, D. Murgatroyd, “ATLLAS generic leading edge model wing”, ATLLAS II deliverable D3.1.6, September 2015.
[3] ANSYS® WorkbenchTM 2.0 Framework, Version: 14.5.0.
[4] J. Hausmann, G. Kasperovich, “FEA of TMC ATLLAS generic leading edge model wing”, ATLLAS II deliverable D3.1.4, August 2014
[5] A. Gülhan, B. Esser, “Arc-heated facilities as a tool to study aerothermodynamic problems of reentry vehicles. In: Lu F.K., Marren D.E. (eds.) Advanced Hypersonic test facilities, vol. 198, pp. 375–403. AIAA Progress in Astronautics and Aeronautics Series (2002). DOI 10.2514/4.9781600864483
[6] M. Kuhn, B. Esser, “Structural Test Samples for the Test Facility”, ATLLAS deliverable D.3.3.3, April 2009.
[7] B. Esser, A. Gülhan, “Structural Test Report (Leading Edge Samples)”, ATLLAS deliverable D3.3.5, December 2009.
[8] M. Kuhn, B. Esser, A. Gülhan, M. Dalenbring, L. Cavagna, "Investigations on the thermal behaviour of CMC-based leading edges in hypersonic arc jet flows“, CEAS Space Journal 3, 2012. DOI 10.1007/s12567-012-0025-2.
[9] J. Hausmann, G. Kasperovich, “Results from composite and monolithic tests for selected alloys”, ATLLAS II deliverable D3.1.2, August 2014.
[10] C. Leyens, J. Hausmann, J. Kumpfert: "Continuously fiber reinforced titanium matrix composites: fabrication, properties and applications", in Titanium and Titanium Alloys - Fundamentals and Applications, C. Leyens und M. Peters (Hrsg.), Wiley-VCH, Weinheim, 2003, 305-331.
[11] ATLLAS II WP3.1 – Technical discussion on TMC CANARD model impingement cooling and associated manufacturing, Teleconference 14/10/2014 11:20 CET, “14-10-14 MoMs ATII WP31 TMC-CANARD-impingement v0.pdf”
[12] ATLLAS II WP3.1 – Technical discussion on TMC CANARD model impingement cooling, Teleconference 26/09/2014 11:30 CET, “14-09-26 MoMs ATII WP31 TMC-CANARD-impingement v0.pdf”