atmos. meas. tech., 6, 3527-3537, doi:10.5194/amt-6-3527 ... · pdf filewith approximately...
TRANSCRIPT

Atmos. Meas. Tech., 6, 3527–3537, 2013www.atmos-meas-tech.net/6/3527/2013/doi:10.5194/amt-6-3527-2013© Author(s) 2013. CC Attribution 3.0 License.
Atmospheric Measurement
TechniquesO
pen Access
Calibration of sealed HCl cells used for TCCON instrumental lineshape monitoring
F. Hase1, B. J. Drouin2, C. M. Roehl3, G. C. Toon2, P. O. Wennberg3, D. Wunch3, T. Blumenstock1, F. Desmet4,D. G. Feist5, P. Heikkinen6, M. De Mazière4, M. Rettinger8, J. Robinson9, M. Schneider1, V. Sherlock9, R. Sussmann8,Y. Té10, T. Warneke7, and C. Weinzierl7
1Karlsruhe Institute of Technology (KIT), Institute for Meteorology and Climate Research (IMK-ASF), Karlsruhe, Germany2Jet Propulsion Laboratory, Pasadena, CA 91109, USA3California Institute of Technology, Pasadena, CA 91125, USA4Belgian Institute for Space Aeronomy (BIRA-IASB), Brussels, Belgium5Max Planck Institute for Biogeochemistry, Jena, Germany6Finnish Meteorological Institute, Sodankylä, Finland7Institute of Environmental Physics, University of Bremen, Germany8Karlsruhe Institute of Technology (KIT), Institute for Meteorology and Climate Research (IMK-IFU),Garmisch-Partenkirchen, Germany9NIWA, Lauder, New Zealand10UPMC Univ. Paris06, Laboratoire de Physique Moléculaire pour l’Atmosphère et l’Astrophysique (LPMAA),UMR7092, CNRS, Paris, France
Correspondence to:F. Hase ([email protected])
Received: 17 July 2013 – Published in Atmos. Meas. Tech. Discuss.: 5 August 2013Revised: 8 November 2013 – Accepted: 12 November 2013 – Published: 16 December 2013
Abstract. The TCCON (Total Carbon Column Observ-ing Network) FTIR (Fourier transform infrared) networkprovides highly accurate observations of greenhouse gascolumn-averaged dry-air mole fractions. As an importantcomponent of TCCON quality assurance, sealed cells filledwith approximately 5 mbar of HCl are used for instrumen-tal line shape (ILS) monitoring at all TCCON sites. Here,we introduce a calibration procedure for the HCl cells whichemploys a refillable, pressure-monitored reference cell filledwith C2H2. Using this method, we identify variations of HClpurity between the TCCON cells as a non-negligible distur-bance. The new calibration procedure introduced here as-signs effective pressure values to each individual cell to ac-count for additional broadening of the HCl lines. This ap-proach will improve the consistency of the network by sig-nificantly reducing possible station-to-station biases due toinconsistent ILS results from different HCl cells. We demon-strate that the proposed method is accurate enough to turn theILS uncertainty into an error source of secondary importancefrom the viewpoint of network consistency.
1 Introduction
The Total Carbon Column Observing Network (TCCON)is an international network of ground-based Fourier trans-form spectrometers that record direct solar spectra in thenear-infrared (Wunch et al., 2011). The column-averagedabundances of the radiatively important greenhouse gasesCO2 and CH4, as well as of a suite of other atmospher-ically significant trace gases (CO, N2O, H2O, HDO, andHF), are derived from these spectra. Investigating the globaldistribution of greenhouse gases such as CO2 and CH4has, until recently, primarily relied on in situ measurementsfrom surface station networks. Remote sensing of green-house gas columns (or vertically integrated mixing ratios)is thought to improve flux estimates since variations in thegas columns are more directly relatable to mass fluxes thansurface concentration measurements (Keppel-Aleks et al.,2011). However, the gradients in column CO2, for exam-ple, are small, requiring a precision and accuracy of < 1 ppm(< 0.25 %, Olsen and Randerson, 2004; Miller et al. 2007).
Published by Copernicus Publications on behalf of the European Geosciences Union.

3528 F. Hase et al.: Calibration of sealed HCl cells
The instrumental requirements for the remote sensing ofgreenhouse gas columns from near-infrared solar spectra aretherefore very exacting.
TCCON has developed strict data acquisition and anal-ysis protocols to attempt to minimize differences betweensites. Interferograms are obtained with similar instrumentsoperated with common detectors and acquisition electronics.These interferograms are processed to spectra and then toretrieved products using a common pipeline processing sys-tem. Nevertheless, biases at individual sites and between sitescan arise due to the behaviour of individual spectrometers,if not properly characterized. These differences may resultfrom non-ideal instrument electronics (Messerschmidt et al.,2010) or a misalignment of the interferometer. The latter canchange abruptly as a consequence of operator interventionor drift slowly due to mechanical degradation over the manymonths between visits to automated sites.
The next version of the TCCON data processing systemwill account for differences in the instrumental line shape(ILS) of the instruments. Mis-sampling of the interferogramswill be removed as described by Dohe et al. (2013). ILSdifferences due to misalignment of the interferometers willbe accounted for using the spectrum of HCl recorded witha lamp source and recorded simultaneously with the solarspectra using an internal gas cell included in all TCCON in-struments.
The ILS describes the smearing of spectral line shapes inmeasured spectra due to the limited spectral resolution ofthe spectrometer. In the context of high-resolution Fouriertransform infrared (FTIR) spectrometers, recorded spectracan be approximated by the convolution of the spectral ir-radiance with an ILS, as the ILS itself depends only weaklyon wave number. The quantitative analysis of atmosphericspectra relies on a comparison of the measured spectra withsimulated spectra. In an iterative procedure, relevant fit pa-rameters are adjusted until a simulated spectrum convergesto an observed spectrum. The simulation of spectra involvesa radiative transfer model and spectral line lists, and includesinstrumental effects such as the ILS. In order to generatedata products of high precision and accuracy – as requiredfor TCCON, since the variability of the target species is solow – significant deviations from the expected nominal ILSshould be avoided and the residual deviations of the ILS fromthe expected shape should be carefully quantified. Typically,TCCON FTIR spectrometers are the high-resolution 125HRmodel manufactured by Bruker Optics, Germany. The nom-inal ILS of these spectrometers is determined by the maxi-mum scan path, the solid angle covered by the interferome-ter’s circular field stop, the wave number, and the numericalapodization function that is used (Davis et al., 2001). A suc-cessful alignment scheme for high-resolution spectrometersof the kind used in TCCON and the NDACC (Network forthe Detection of Atmospheric Composition Change; Kurylo,1991) was proposed about a decade ago and has become thestandard alignment procedure for both networks (Hase and
Blumenstock, 2001). For the quantification of the residualdeviations from the nominal ILS due to misalignment, opti-cal aberrations and deviations from the nominal circular fieldstop, low-pressure gas cells are employed for ILS verifica-tion. The low-pressure gas inside the cell is chosen such thatits absorption lines are preferably narrower than any spectraldetails observed in the atmospheric spectra. The FTIR net-work within the NDACC, which records spectra in the mid-infrared spectral region, uses HBr cells of 2 cm length filledwith 2 mbar of HBr. These cells were provided by the Na-tional Center for Atmospheric Research (NCAR). More de-tails on the HBr cell procedure and possible future enhance-ments are provided by Hase (2012) and references therein.TCCON uses 10 cm-long cells filled with 5 mbar of HCl,provided by Caltech (Washenfelder, 2006). Several cells of20 cm length filled with 3 mbar of HCl are also in use. Forthe retrieval of the ILS from the gas cell spectra, the softwareLINEFIT is used in both networks (Hase et al., 1999).
Using sealed cells with compact cell bodies is advanta-geous because it provides a simple, very manageable methodof ILS characterization. Choosing suitable gases allows con-stant monitoring of the cell in the solar beam for control pur-poses, although dedicated regular lamp measurements are re-garded as indispensable for the most accurate ILS determi-nation. The drawback of the compact cells is that it is notpossible to attain sufficiently low pressures to achieve pureDoppler line shapes, as the observed absorption lines wouldthen be too weak. Therefore, the spectral lines provided bythe cells suffer from non-negligible pressure broadening. Al-though the lines are not significantly wider than Doppler-limited Gaussian lines in the chosen pressure range, the lineshape is nonetheless sensitive to the amount of pressure inthe cell. During the process of filling and sealing individualcells, deviations from the desired target gas column mightarise. As long as these deviations are moderate (so that thespectral scene provided by each cell is similar), this is not anissue, as the retrieval of the ILS also retrieves the target gascolumn. The evaluator simply has to consider that the set ofretrieved variables is self-consistent insofar as the retrievedcolumn is compatible with the assumed partial pressure ofthe target gas, the cell length and cell temperature. However,even if we could rely on the assumption that the sealed cellscontain pure gas, a calibration of the method is still required,as the assumed pressure broadening parameters or the bandintensity may be incorrect, or the line shapes in the pressurerange of a few mbar might be affected by narrowing effects(Dicke, 1953). This would introduce a systematic bias of theILS parameters derived from a certain kind of cell.
Much more critical is the contamination of the cell con-tent with other gases which remain undetected in the cellspectrum, e.g. due to intrusion of ambient air during the fill-ing and sealing process. In this case, the actual total pres-sure in the cell exceeds the partial pressure of the targetgas and results in an additional pressure broadening of thetarget gas lines. This additional broadening would – if it
Atmos. Meas. Tech., 6, 3527–3537, 2013 www.atmos-meas-tech.net/6/3527/2013/

F. Hase et al.: Calibration of sealed HCl cells 3529
remains unnoticed – be erroneously attributed to the ILSwidth. Moreover, this unnoticed contamination might varyfrom cell to cell. In that case, this problem would cause astation-to-station bias within the FTIR network, which wouldbe much more detrimental than a common bias. Hase (2012)suggested a calibration method for the HBr cells used withinNDACC by using refillable pressure-monitored N2O cells inthe 0.1 mbar pressure range. The proposed method is very ro-bust because the nearby spectral signatures provided by theHBr and N2O cells are observed in the same beam, so thatany ILS imperfections of the spectrometer itself cancel outin the calibration process.
Here, we present a similar calibration scheme for the HClcells used by TCCON. First, we investigate the impact ofan ILS error on column-averaged dry air mole fractions ofCO2 (XCO2) and derive target accuracies for the ILS knowl-edge and the HCl cell parameters. Next, we introduce theproposed method and describe the C2H2 reference cell usedfor the calibration. As a result of the calibration procedure, aneffective pressure and target gas column is assigned to eachcell. When a sealed HCl cell is used for operational ILS de-termination, this effective pressure is used for the line shapecalculation instead of the pressure derived from the observedcolumn, temperature and cell length. As the pressure inside asealed cell is proportional to absolute temperature (unless thecell’s gas column changes), the effective pressure for a mix-ture of ideal gases should behave in the same manner. Usinga heated cell, we verify that this scaling law for the effectivepressure allows us to retrieve consistent ILS parameters froma cell operated at different temperatures. Next, we estimatethe precision and accuracy of the calibration method. Finally,we present results for a considerable set of HCl cells usedin TCCON. We show that the cells have variable degrees ofcontamination (namely, that the ratio of the observed pres-sure broadening to the HCl column differs from cell to cell).The paper closes with a summary and an outlook on plannedactivities.
2 Propagation of ILS error into TCCON XCO 2
In this section, we investigate the sensitivity of TCCONXCO2 data with respect to an error in the ILS width. Thisresults in a requirement for the knowledge of the associatedILS parameters. Next, we quantify the impact of cell contam-ination on the ILS width as derived from HCl cell spectra.These considerations finally allow us to determine the ac-ceptable amount of unnoticed contamination of the cell con-tent, which increases the width of the target HCl lines usedfor the ILS retrieval.
FTIR spectrometers actually measure interferograms(which are converted into final spectra via the Fourier trans-formation), therefore it is an appealing approach to quantifyand report the imperfections of the ILS in the interferogramdomain (as the actual measurement process happens in the
optical path difference (OPD) domain). The LINEFIT soft-ware used for the ILS analysis within TCCON, retrieves acomplex modulation efficiency (ME) as a function of OPD,which is represented by a ME amplitude and a ME phaseerror. The ME amplitude is related to the width of the ILSwhile the ME phase error quantifies the degree of ILS asym-metry. If the spectrometer meets the nominal ILS character-istics, the ME amplitude would be unity, and the ME phaseerror would be zero along the whole interferogram. Furtherdetails are provided by Hase (2012).
In the following, we quantify how the column-averageddry-air mole fractions of CO2 (XCO2) reported by TCCONare affected by a deviation of the ME amplitude from unity.We do not treat the phase error/ILS asymmetry in the follow-ing, as the quantification of spectral line asymmetry is notcritically affected by the assumed width of the HCl signaturesprovided by the cell. It is important to recollect that an XCO2result provided by TCCON is calculated from the ratio ofCO2 and O2 columns derived from the same spectrum. Thisappealing strategy minimizes the error propagation of vari-ous instrumental and model errors into the reported dry-airmole fractions. For estimating the propagation of the ILS er-ror, we apply a disturbance on the ME amplitude. The shapeof this disturbance as a function of optical path difference isinspired by a common misalignment scenario due to a lateralshear offset of the interferometer’s fixed cube corner (fur-ther details on this instrument-specific issue are provided byHase, 2012). Correct error propagation needs to take into ac-count that the misalignment affects both the CO2 and O2, soit cancels out in XCO2 to a large extent. However, because awavefront error provoked by a given geometric displacementscales inversely with wavelength, the impact of a misalign-ment on ME amplitude increases with wave number, and istherefore smaller for CO2 than O2 (the wave number ratiobetween the O2 and CO2 bands used is 0.75). Note that therise of ME amplitude beyond 1.0 does not indicate that theinterferometer is more efficient than the ideal interferometer,rather this behaviour results from the fact that the ME am-plitude is always normalized to 1.0 at zero path difference toensure that the ILS is area-normalized in the spectral domain.In fact, when the ME amplitude rises above 1.0, the modula-tion is less than ideal at small OPD due to the assumed shearmisalignment.
Figure 1 shows the assumed disturbances of the ME am-plitudes for CO2 and O2, taking the appropriate scaling lawinto account. The ME amplitude is shown up to 45 cm op-tical path difference, which is the recommended maximumoptical path difference (OPDmax) applied within TCCON.We find that the induced column change depends slightlyon the air mass. This result is not unexpected, as the sig-natures are not optically thin. Therefore, we quantified theeffect for solar elevation angles of 30◦ and 60◦. The changeof the O2 column amounts to 0.38 % (60◦: 0.47 %), whereasthe change in the CO2 column is 0.46 % (60◦: 0.54 %). Theresidual error in XCO2 that is not compensated by ratioing
www.atmos-meas-tech.net/6/3527/2013/ Atmos. Meas. Tech., 6, 3527–3537, 2013

3530 F. Hase et al.: Calibration of sealed HCl cells
23
1
Figure 1. Disturbance of ME amplitude assumed for characterisation of TCCON XCO2 2
product sensitivity with respect to ILS uncertainty. The wave number ratio of 0.8 between the 3
CO2 and O2 bands used in the TCCON retrieval produces a shortening of the effective OPD 4
by this same factor. 5
Fig. 1. Disturbance of ME amplitude assumed for characterizationof TCCON XCO2 product sensitivity with respect to ILS uncer-tainty. The wave number ratio of 0.8 between the CO2 and O2 bandsused in the TCCON retrieval produces a shortening of the effectiveOPD by this same factor.
amounts to 0.07 % (∼ 0.3 ppm) for the assumed ILS distur-bance and does not significantly depend on the solar eleva-tion. In the example, the ME amplitude disturbance at 45 cmOPD amounts to about 8 %. Therefore, we can estimate thatthe resulting error in XCO2 is on the order of 0.035 % for aME amplitude change of 4 % at OPDmax. The target station-to-station bias for the TCCON XCO2 product is 0.1 %, hence– for ensuring that the ILS error is of secondary importance– we set a minimum performance metric for the error of theME amplitude due to variations between HCl cells to be lessthan 4 %. This result is in excellent agreement with an earlierstudy performed by Griffith (2010).
In the current configuration, the retrieved ME amplitudescan change by 4 % at 45 cm OPD if the HCl pressure is in er-ror by 0.5 mbar in the ILS retrieval setup. This requires thatthe description of the spectral line broadening should be cor-rect within a range corresponding to a±0.25 mbar pressureinterval of HCl for matching the requirements of the TCCONnetwork performance. Since the self-broadening coefficientsare larger than the air-broadening parameters by a factor ofabout four, the allowed pressure interval for the partial pres-sure of contaminating air would be accordingly larger. Never-theless, for the sake of clarity, we determine and report in thecourse of the calibration procedure described in Sect. 4 onlyeffective pressure parameters for a notional cell containingpure HCl (i.e. without ambient air or water vapour contami-nation). A separate treatment of self- and foreign broadeningeffects would require adjustments of two pressure values percell. Such an extended approach would be complicated byuncertainties in the line parameters, by the fact that we workin a pressure region where the Voigt line shape model be-comes questionable, and by the fact that we cannot safely as-sume that any of the investigated cells contains pure HCl. Theonly advantage of the extended approach would be that the
24
1
Figure 2. Setup for HCl cell calibration at the TCCON site Karlsruhe. The source is on the 2
right side in front, left from the source an HCl cell under test is located (protected by a heat 3
shield to limit heating of the cell by the thermal radiation emitted by the source). The first 4
mirror is on the left outside the figure. The long steel cylinder is the pressure-monitored C2H2 5
cell, the two mirrors in the rear right corner of the image steer the radiation into the 6
spectrometer. The red arrow follows the radiation path from the globar to the spectrometer 7
input port. 8
.9
Fig. 2.Setup for HCl cell calibration at the TCCON site Karlsruhe.The source is on the right side in front, left from the source an HClcell under test is located (protected by a heat shield to limit heatingof the cell by the thermal radiation emitted by the source). The firstmirror is on the left outside the figure. The long steel cylinder isthe pressure-monitored C2H2 cell, the two mirrors in the rear rightcorner of the image steer the radiation into the spectrometer. The redarrow follows the radiation path from the globar to the spectrometerinput port.
resulting description of pressure broadening as a function ofrotational quantum number might be slightly more realistic.However, using the simplified approach, we achieved nearlynoise-limited fit residuals for all HCl cell spectra (signal-to-noise ratio around 2500), so we do not feel that the smallbenefits justify introducing this complication.
3 The pressure-monitored C2H2 reference cell
Our reference cell has 400 mm effective length, a free diam-eter of 70 mm and uses wedged CaF2 windows. A precisecapacitive pressure gauge with a 10 mbar working range isattached to the cell. The TCCON spectrometer in Karlsruheis located in an air-conditioned container and is equippedwith an optical board flanged to the spectrometer, which of-fers enough room for an external source, the reference celland the cell under test. Three mirrors, one plane mirror, a30◦ off-axis paraboloid, and a spherical mirror (used undera moderate off-axis angle) couple the beam into the spec-trometer. Figure 2 shows the setup in front of the BrukerIFS125HR spectrometer. It should be noted that due to theuse of wedged cell windows (in order to avoid channelling),the HCl cells noticeably impact the beam steering, so uponany cell exchange, the spherical mirror is slightly realignedin order to readjust the position of the source image on thefield stop of the spectrometer.
The gas C2H2 offers a convenient band at 6550 cm−1
in the vicinity of the CO2 bands used for TCCON re-trievals. Contrary to the mid-infrared, where a cell length of
Atmos. Meas. Tech., 6, 3527–3537, 2013 www.atmos-meas-tech.net/6/3527/2013/

F. Hase et al.: Calibration of sealed HCl cells 3531
25
1
Figure 3. Transmission spectrum recorded with the C2H2 and a TCCON HCl cell in the beam. 2
The band to the right is due to absorption by C2H2, the band to the left is due to HCl 3
absorption. Some H2O signatures emerging in the lab air path can be detected at wave 4
numbers below 5550 cm-1
. 5
Fig. 3. Transmission spectrum recorded with the C2H2 and a TC-CON HCl cell in the beam. The band to the right is due to absorp-tion by C2H2, the band to the left is due to HCl absorption. SomeH2O signatures emerging in the lab air path can be detected at wavenumbers below 5550 cm−1.
even 200 mm is sufficient for generating strong N2O lineswith near-Gaussian line shape in the 0.1 mbar range, wehave to use 3 mbar pressure to generate absorption lines offavourable strength. Figure 3 shows a measured spectrum,the C2H2 band can be seen in the right part of the figure, theHCl band on the left.
In order to minimize biases between the individual cellresults, the same reference spectral scene (generated by the400 mm cell filled with 3.00 mbar of C2H2, measurementsperformed at temperatures in the range 291–294 K) is usedfor the calibration of all HCl cells. Nevertheless, as we donot work in the Doppler limit with the reference cell, it isappropriate to quantify the systematic bias of the calibrationprocess due to C2H2 line shape issues, which is transferredinto the HCl effective pressure parameters, as the derived val-ues of these parameters rely on the ILS parameters derivedfrom C2H2. Therefore, we performed a pair of dedicated testmeasurements: the first measurement was performed witha reference cell filled with 3.00 mbar C2H2 and a TCCONHCl cell. The second measurement was performed with thesame TCCON HCl cell in the beam and in addition two400 mm reference cells in series, both reference cells werefilled with 1.50 mbar of C2H2. The discrepancy in the ILSparameters derived from C2H2 between both experiments re-veals the systematic error of the method due to incorrect pres-sure broadening (and/or line strength) parameters of C2H2and the applied Voigt line shape model. A sealed HCl cell(cell #1, see Sect. 6 and Table 1 for assignment of cell IDs)in the beam was added for detecting real alignment changesbetween the two experiments.
Figure 4 shows the reconstructed ME amplitudes for bothsetups. Indeed, the ME amplitudes derived from the HCl cellare in excellent agreement: the retrieved ME amplitudes dif-fer by 0.3 % at 45 cm OPD. Therefore, we can assume thatthe alignment of the spectrometer did not change between
26
1
Figure 4. ME amplitudes retrieved from a 40 cm cell filled with 3.00 mbar of C2H2 and two 2
40 cm cells in series, each filled with 1.50 mbar of C2H2. For comparison, the ME amplitudes 3
derived from an HCl cell (same cell was used for both measurements, effective cell 4
parameters applied for ILS retrieval) are shown. The HCl results prove that the alignment 5
status of the spectrometer did not change between the two measurements. 6
Fig. 4. ME amplitudes retrieved from a 40 cm cell filled with3.00 mbar of C2H2 and two 40 cm cells in series, each filled with1.50 mbar of C2H2. For comparison, the ME amplitudes derivedfrom an HCl cell (same cell was used for both measurements, effec-tive cell parameters applied for ILS retrieval) are shown. The HClresults prove that the alignment status of the spectrometer did notchange between the two measurements.
the measurements. The bump indicated in the 3.00 mbarC2H2 ME amplitude result is significantly dampened in the1.50 mbar solution. In Sect. 5, we will use this discrepancyfor an estimation of the systematic uncertainty inherent tothe proposed HCl cell calibration method. All results indi-cate a moderate ME amplitude rise along the inner part ofthe interferogram, rising to values in the range of 2–2.5 % at45 cm OPD (which is the OPDmax value recommended forTCCON). Beyond this OPD value, the HCl retrievals indi-cate a further pronounced increase, whereas the C2H2 analy-ses indicate a decrease of ME amplitude. It should be notedthat the shape of the ME amplitude beyond 45 cm is recon-structed from minor details of the observed line shapes, soeven very slight deficiencies of the line shape model affectthe ME amplitude in this region of the interferogram. Mea-surements with a low-pressure N2O cell taken with the samespectrometer (but using a different liquid-nitrogen cooled de-tector) in the mid-infrared region do not indicate such a pro-nounced rise of ME amplitude beyond 45 cm OPD. This in-dicates that the effect is most likely an artefact from the HClcell itself (actual HCl line shape differs from assumed Voigtline shape), as probably is the ME bump at 45 cm observedin the ME amplitude derived from C2H2. A very minor colli-sional narrowing effect acting on the spectral lines that is notincluded in the Voigt model will trigger an artificial increasein the reconstructed ME amplitude.
4 Calibration procedure for TCCON HCl cells
The calibration process of an HCl cell relies on a single lamptransmission spectrum. This spectrum is recorded with boththe HCl cell to be tested and the 400 mm reference cell in the
www.atmos-meas-tech.net/6/3527/2013/ Atmos. Meas. Tech., 6, 3527–3537, 2013

3532 F. Hase et al.: Calibration of sealed HCl cells
Table 1. Calibration results for all investigated HCl cells. Abbreviations: CT: cell provided by California Institute of Technology, batchindicated in YYMM format; CT/NP: cell body provided by California Institute of Technology, but filled and sealed by company Neoplas,Greifswald, Germany; NP: cell body, filling and sealing by Neoplas.
Cell identifier, celllength in mm
Origin, batch, andlocation
Effective pressureH35Cl at 296 K[hPa]
Effective pressureH37Cl at 296 K[hPa]
HCl total column[1e22 molec/m2]derived from H35Cl
HCl total column[1e22 molec/m2]derived from H37Cl
1 (100) CT1303 IMK-ASF 4.732 4.747 1.3133 1.30672 (100) CT1303 IMK-ASF 4.702 4.683 1.3263 1.31953 (100) CT1303 BIRA 5.111 5.119 1.3845 1.37814 (100) CT1303
BIRA5.070 5.056 1.3893 1.3828
5 (100) CT1303 BIRA 4.949 4.979 1.3433 1.33846 (100) CT1303
FMI4.853 4.844 1.3415 1.3348
7 (100) CT1303FMI
4.863 4.890 1.3294 1.3253
8 (100) CT1303FMI
4.850 4.843 1.3262 1.3200
10 (100) CT1303FMI
5.127 5.147 1.4154 1.4094
11 (100) CT1303IUP Bremen
4.971 5.007 1.3247 1.3190
12 (100) CT1303IUP Bremen
4.997 5.022 1.3294 1.3232
13 (100) CT1303IUP Bremen
5.802 5.835 1.2967 1.2873
14 (100) CT1303IUP Bremen
4.830 4.880 1.3150 1.3103
15 (100) CT1303LPMAA/LERMA2*
4.964 4.991 1.3503 1.3458
16 (100) CT1303MPI-BGC
4.948 4.924 1.3450 1.3385
17 (100) CT/NP0707IMK-IFU
4.386 4.356 1.1932 1.1899
18 (100) CT0805(cell #G)Izana Observatory
5.070 5.133 1.2644 1.2567
19 (100) CT0805(cell #6)IUP Bremen
5.077 5.074 1.2729 1.2652
20 (100) CT0805(cell #3)IUP Bremen
5.578 5.603 1.2235 1.2170
35 (200) CT 1304IMK-ASF
3.147 3.123 1.6971 1.6870
36 (200) CT1304IMK-ASF
3.017 3.054 1.6375 1.6289
37 (200) CT1304NIWA
3.402 3.412 1.6541 1.6477
38 (300) NP1012NIWA
3.672 3.643 2.6070 2.6305
* The LPMAA laboratory will be included into the new LERMA2 laboratory infrastructure from January 2014 onwards.
Atmos. Meas. Tech., 6, 3527–3537, 2013 www.atmos-meas-tech.net/6/3527/2013/

F. Hase et al.: Calibration of sealed HCl cells 3533
27
1 Figure 5. Typical fit quality achieved for an ILS retrieval using C2H2 as described in section 2
4. The green residual (vertically shifted for clarity) refers to the use of the original HITRAN 3
2008 line list. 4
Fig. 5. Typical fit quality achieved for an ILS retrieval using C2H2as described in Sect. 4. The green residual (vertically shifted forclarity) refers to the use of the original HITRAN 2008 line list.
beam, the latter filled with 3.00 mbar C2H2, with the addi-tion of an independent measure of the cell pressure. In orderto achieve a spectral SNR on the order of 3000, eighty scansare recorded at a metering laser fringe scanning velocity of20 kHz using a room-temperature InGaAs detector at a reso-lution of 0.014 cm−1 (OPDmax= 64.3 cm). The first step ofthe analysis process is to perform an ILS retrieval from theC2H2 band (spectral window: 6560.5–6609.5 cm−1) jointlywith temperature. Figure 5 shows a typical C2H2 fit of ILSparameters. We essentially use the HITRAN 2008 (Rothmanet al., 2009) line list for C2H2, but corrected a few aber-rant line positions. However, these modifications are essen-tially cosmetic interventions, and they negligibly affect theresulting ILS parameters. In the second step, a temperatureretrieval is performed for the HCl band in the same spec-trum. The consistency between the temperature retrievalsfrom C2H2 and HCl is satisfactory: we do not find a signifi-cant bias and a standard deviation of about 0.3 K is achievedbetween the temperature values derived from HCl and C2H2,respectively. Finally, we insert the ME result from C2H2 (andthe temperature retrieved for the HCl cell) into a subsequentretrieval of HCl effective pressure (spectral window: 5172.0–5782.0 cm−1), again, from the same spectrum. As we ob-serve signatures of both isotopologues H35Cl and H37Cl, weretrieve two effective pressure values. These effective pres-sure values and the HCl columns for both isotopologues com-prise the final result of the cell calibration. If a repetition ofthe HCl temperature fit using these effective pressure valuesreveals a different temperature than retrieved in the previousstep, the HCl analysis process is repeated until a final self-consistent solution is found. Note that for the determinationof the effective pressure values, we exclusively use tempera-tures retrieved from the HCl band, as this procedure can berepeated at any TCCON site without the need for a temper-ature sensor on the cell body. Figure 6 shows a typical HCl
28
1 Figure 6.: Typical fit quality achieved after adjustment of the HCl effective pressure 2
parameters (described in section 4). 3
Fig. 6. Typical fit quality achieved after adjustment of the HCl ef-fective pressure parameters (described in Sect. 4).
spectral fit. The original HITRAN 2008 spectroscopic linelist for HCl is used without any modifications.
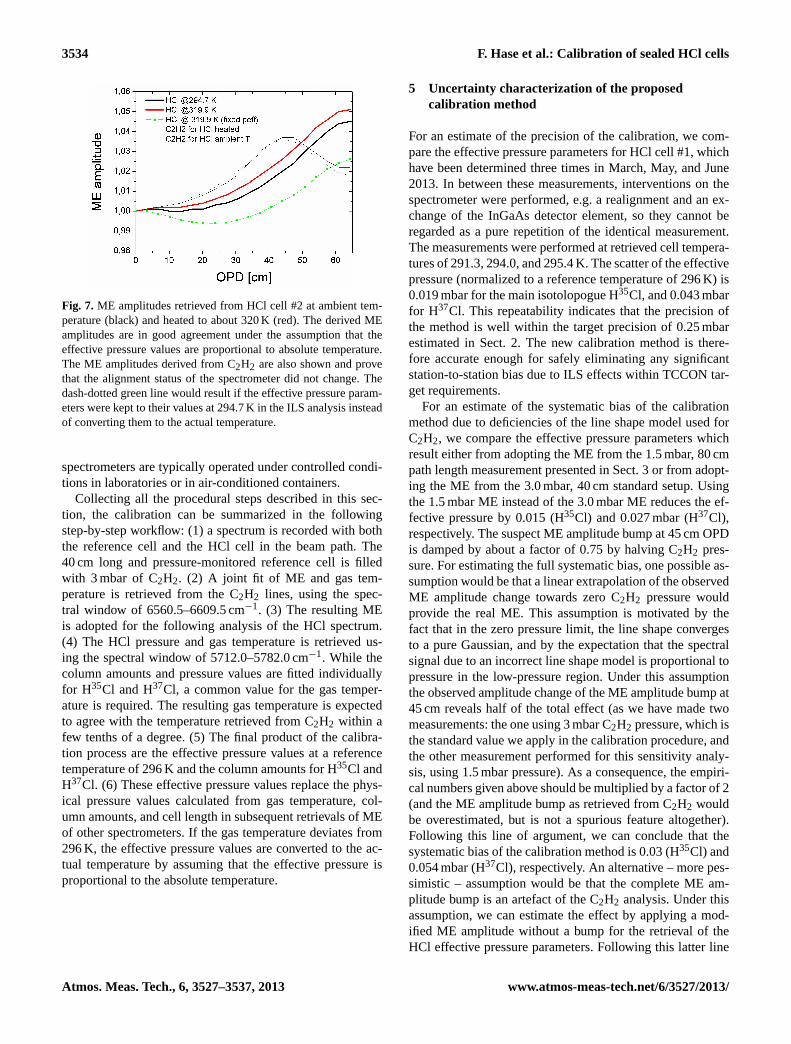
It is to be expected that the effective pressure parametersdepend on temperature. Since the effective pressure affectsthe correction of the pressure broadening in the HCl cell, itis plausible to assume that it is proportional to the absolutetemperature. Nevertheless, we want to check this assump-tion, as one might argue that the effective pressure is not ac-tually a physical pressure value. Note that the procedure out-lined in the following implicitly includes a test of whetherthe temperature dependence of the line-broadening parame-ters specified in HITRAN are compatible with our calibrationapproach. The test uses a pair of spectra from the same sealedHCl cell (cell #2), one spectrum is recorded at lab tempera-ture (294.0 K), the other spectrum is recorded with the cellheated to 320.0 K. The C2H2 cell has been co-observed inboth runs to ensure that the ILS was unchanged. The cellbody of the HCl cell was wrapped with an electrical heatingfoil and an insulating foam film, such that only the windowfaces were in contact with the surrounding lab air. The celltemperature was monitored by a PT100 temperature sensorin contact with the cell body. The temperature value retrievedfrom the HCl band and the temperature value directly mea-sured with the sensor are in good agreement for the mea-surement taken at lab temperature (retrieval: 294.66 K, sen-sor: 294.95 K), for the heated cell the retrieved temperature(319.87 K) is about 3 K lower than the sensor temperature(322.90 K). Due to the fact that the window faces were incontact with the ambient air, it is plausible that the tempera-ture of the gas content is slightly lower than the temperaturemeasured between the heating foil and the outer side of thecell body. The retrieved ME amplitudes are shown in Fig. 7and are in reasonable agreement (1 % ME amplitude discrep-ancy at 45 cm OPD). Note that the temperature used in thistest is further away from the calibration point (we performedthe calibration measurements in the 291.0–294.0 K range)than we would expect to meet in practice, as the TCCON
www.atmos-meas-tech.net/6/3527/2013/ Atmos. Meas. Tech., 6, 3527–3537, 2013
3534 F. Hase et al.: Calibration of sealed HCl cells
29
1
Figure 7. ME amplitudes retrieved from HCl cell #2 at ambient temperature (black) and 2
heated to about 320 K (red). The derived ME amplitudes are in good agreement under the 3
assumption that the effective pressure values are proportional to absolute temperature. The 4
ME amplitudes derived from C2H2 are also shown and prove that the alignment status of the 5
spectrometer did not change. The dash-dotted green line would result if the effective pressure 6
parameters were kept to their values at 294.7 K in the ILS analysis instead of converting them 7
to the actual temperature. 8
Fig. 7. ME amplitudes retrieved from HCl cell #2 at ambient tem-perature (black) and heated to about 320 K (red). The derived MEamplitudes are in good agreement under the assumption that theeffective pressure values are proportional to absolute temperature.The ME amplitudes derived from C2H2 are also shown and provethat the alignment status of the spectrometer did not change. Thedash-dotted green line would result if the effective pressure param-eters were kept to their values at 294.7 K in the ILS analysis insteadof converting them to the actual temperature.
spectrometers are typically operated under controlled condi-tions in laboratories or in air-conditioned containers.
Collecting all the procedural steps described in this sec-tion, the calibration can be summarized in the followingstep-by-step workflow: (1) a spectrum is recorded with boththe reference cell and the HCl cell in the beam path. The40 cm long and pressure-monitored reference cell is filledwith 3 mbar of C2H2. (2) A joint fit of ME and gas tem-perature is retrieved from the C2H2 lines, using the spec-tral window of 6560.5–6609.5 cm−1. (3) The resulting MEis adopted for the following analysis of the HCl spectrum.(4) The HCl pressure and gas temperature is retrieved us-ing the spectral window of 5712.0–5782.0 cm−1. While thecolumn amounts and pressure values are fitted individuallyfor H35Cl and H37Cl, a common value for the gas temper-ature is required. The resulting gas temperature is expectedto agree with the temperature retrieved from C2H2 within afew tenths of a degree. (5) The final product of the calibra-tion process are the effective pressure values at a referencetemperature of 296 K and the column amounts for H35Cl andH37Cl. (6) These effective pressure values replace the phys-ical pressure values calculated from gas temperature, col-umn amounts, and cell length in subsequent retrievals of MEof other spectrometers. If the gas temperature deviates from296 K, the effective pressure values are converted to the ac-tual temperature by assuming that the effective pressure isproportional to the absolute temperature.
5 Uncertainty characterization of the proposedcalibration method
For an estimate of the precision of the calibration, we com-pare the effective pressure parameters for HCl cell #1, whichhave been determined three times in March, May, and June2013. In between these measurements, interventions on thespectrometer were performed, e.g. a realignment and an ex-change of the InGaAs detector element, so they cannot beregarded as a pure repetition of the identical measurement.The measurements were performed at retrieved cell tempera-tures of 291.3, 294.0, and 295.4 K. The scatter of the effectivepressure (normalized to a reference temperature of 296 K) is0.019 mbar for the main isotolopogue H35Cl, and 0.043 mbarfor H37Cl. This repeatability indicates that the precision ofthe method is well within the target precision of 0.25 mbarestimated in Sect. 2. The new calibration method is there-fore accurate enough for safely eliminating any significantstation-to-station bias due to ILS effects within TCCON tar-get requirements.
For an estimate of the systematic bias of the calibrationmethod due to deficiencies of the line shape model used forC2H2, we compare the effective pressure parameters whichresult either from adopting the ME from the 1.5 mbar, 80 cmpath length measurement presented in Sect. 3 or from adopt-ing the ME from the 3.0 mbar, 40 cm standard setup. Usingthe 1.5 mbar ME instead of the 3.0 mbar ME reduces the ef-fective pressure by 0.015 (H35Cl) and 0.027 mbar (H37Cl),respectively. The suspect ME amplitude bump at 45 cm OPDis damped by about a factor of 0.75 by halving C2H2 pres-sure. For estimating the full systematic bias, one possible as-sumption would be that a linear extrapolation of the observedME amplitude change towards zero C2H2 pressure wouldprovide the real ME. This assumption is motivated by thefact that in the zero pressure limit, the line shape convergesto a pure Gaussian, and by the expectation that the spectralsignal due to an incorrect line shape model is proportional topressure in the low-pressure region. Under this assumptionthe observed amplitude change of the ME amplitude bump at45 cm reveals half of the total effect (as we have made twomeasurements: the one using 3 mbar C2H2 pressure, which isthe standard value we apply in the calibration procedure, andthe other measurement performed for this sensitivity analy-sis, using 1.5 mbar pressure). As a consequence, the empiri-cal numbers given above should be multiplied by a factor of 2(and the ME amplitude bump as retrieved from C2H2 wouldbe overestimated, but is not a spurious feature altogether).Following this line of argument, we can conclude that thesystematic bias of the calibration method is 0.03 (H35Cl) and0.054 mbar (H37Cl), respectively. An alternative – more pes-simistic – assumption would be that the complete ME am-plitude bump is an artefact of the C2H2 analysis. Under thisassumption, we can estimate the effect by applying a mod-ified ME amplitude without a bump for the retrieval of theHCl effective pressure parameters. Following this latter line
Atmos. Meas. Tech., 6, 3527–3537, 2013 www.atmos-meas-tech.net/6/3527/2013/

F. Hase et al.: Calibration of sealed HCl cells 3535
of argument, we can conclude that the systematic bias of thecalibration method is 0.14 (H35Cl) and 0.15 mbar (H37Cl),respectively, which is still well within the target precision.Moreover, as stated before, this systematic bias propagatesinto the results of all calibrated HCl cells, so it can with-out difficulty be absorbed into the overall calibration factorsapplied in the TCCON network for matching the WMO ref-erence (Wunch et al., 2010).
6 Results for TCCON HCl cells
Table 1 collects the results for all investigated HCl cells,namely the retrieved columns and effective pressure valuesfor both isotopologues (referenced to a common tempera-ture of 296.0 K). The cells with identifier #1–#16 belong tothe same batch (effective cell body length of 100 mm); thesecells were provided by the California Institute of Technologyin spring 2013. This batch will be referred to as CT1303 (thebatch identifier is explained in the caption of Table 1). Cells#18, #19, and #20 are from batches that were distributed byCaltech in earlier years. Cell #17 is a unique specimen, asthe cell body has been provided by Caltech, but filling andsealing has been performed by a German company (Neoplas,Greifswald). In addition, we investigated three HCl cells witheffective body lengths of 200 mm, recently distributed byCaltech (batch CT1304) and one cell of 300 mm length pro-duced by Neoplas. Figure 8 shows the ratio of the effectivepressure values resulting from the calibration to pressure val-ues calculated from the observed HCl column. This ratio is– at least for cells with the same length and comparable HClcolumn – an accurate measure of HCl purity in the cell. Theresults for the weaker H37Cl show slightly more scatter, butthe consistency between the H35Cl and H37Cl is satisfac-tory and consistent with the precision estimation providedin Sect. 5. On average, the H37Cl values are slightly smallerby 0.2 %, and the scatter of the difference between the twoisotopologues is on the order of 0.026 mbar.
It is apparent that even the cells belonging to a commonbatch are not equivalent. For example, cell #13 seems to besignificantly contaminated by foreign gases: for this cell thepressure broadening is 20 % larger than for the remainder ofthe CT1303 batch (we would like to emphasize here that thecell identifiers were assigned before the calibration spectrawere analysed). The unique cell #17 shows similar perfor-mance to the majority of the cells in batch CT1303 (cell #13excluded). The two cells, #18 and #19, distributed by Cal-tech in earlier years suffer from foreign gas contamination,showing about half of the excess broadening observed in cell#13. Cell #20 shows the highest amount of excess broaden-ing among all tested cells. There are several more cells fromthis early batch in use that have yet to be characterized. Twoof the new 200 mm cells, #35 and #36, are quite compara-ble with the majority of cells from the CT1303 100 mm cellbatch. However, the third 200 mm cell, #37, of the CT1304
30
1
Figure 8. The effective pressure values ratioed by pressure derived from observed column for 2
the calibrated cells listed in table 1. The dashed vertical lines separate different batches or 3
different cell dimensions. 4
5
Fig. 8. The effective pressure values ratioed by pressure derivedfrom observed column for the calibrated cells listed in Table 1. Thedashed vertical lines separate different batches or different cell di-mensions.
batch resembles the earlier cells #18 and #19. This is also thecase for the Neoplas 300 mm cell #38.
The non-negligible scatter of effective pressure valuesfound between the investigated cells underlines the value ofthe proposed calibration procedure. ILS retrievals from cell#13 or cell #20 without due consideration of the additionalbroadening would give rise to errors in the ME amplitudethat exceed the criteria in Sect. 2 to meet TCCON require-ments. Even the discrepancy between the earlier cells #18and #19 and the reminder of the CT1303 batch would failto meet these requirements. Since variability was found evenwithin batches filled and sealed together, we suspect that sub-tle differences in cell handling procedures are significant atthe level of precision desired for these calibrations. Poten-tial sources of these subtle differences include the removalof water from the cell walls prior to the filling procedure andthe leakage of air into the cell prior to cell sealing. In the out-gassing scenario, the reservoir of residual water in the celldepends on the amount of time the cell was evacuated priorto filling; in the air leakage scenario, the amount of air leak-age depends on the integrity of the Teflon stopcock valve andthe amount of time between filling and sealing. In both casessimilar times were utilized for cells in the same batch, andpairs of cells were pumped and filled simultaneously. Never-theless, variability is observed even among the paired cells.We note that water-broadening would be expected to be sim-ilar to self-broadening rather than air-broadening, such thatthe effect would be noticeable with relatively small amountsof residual water vapour.
Figure 9 shows a H2O absorption line of useful intensity toreveal water vapour absorption inside the cell. This spectralwindow has been used to quantify the water vapour contam-ination in the HCl cells. The narrow dip observed at the linecentre is due to absorption at low pressure, while the strongunderlying absorption is generated in the lab air path. Unfor-tunately, the C2H2 reference cell might also suffer from some
www.atmos-meas-tech.net/6/3527/2013/ Atmos. Meas. Tech., 6, 3527–3537, 2013

3536 F. Hase et al.: Calibration of sealed HCl cells
31
1
Figure 9. A H2O line as observed in a calibration measurement. The narrow dip observed at 2
the line center is due to absorption at low pressure, while the strong underlying absorption is 3
generated in the lab air path. The superimposed dashed lines (which coincide with the solid 4
lines at the resolution of the figure) are synthetic spectra generated with LINEFIT. 5
Fig. 9. A H2O line as observed in a calibration measurement. Thenarrow dip observed at the line centre is due to absorption at lowpressure, while the strong underlying absorption is generated in thelab air path. The superimposed dashed lines (which coincide withthe solid lines at the resolution of the figure) are synthetic spectragenerated with LINEFIT.
minor degree of H2O contamination, so we can only quantifythe total amount of water vapour in both cells from the avail-able spectra (which were recorded with both the HCl cellundergoing testing and the reference C2H2 cell in the beam).However, the same C2H2 content was applied for the cali-bration of cells #1–#17. We might speculate that the lowestH2O column observed within this sample actually resides inthe C2H2 reference cell. Following this assumption, the H2Ocolumn in the C2H2 cell was 9.9× 10²⁰ molec m−2. This col-umn amount would correspond to a water vapour partial pres-sure of about 0.1 mbar in the 400 mm C2H2 cell body. Notethat this is still not a relevant effect for the ILS determinationfrom the reference cell, as it would result in 0.4 % ME ampli-tude change at 45 cm OPD, if we assume that line broaden-ing by H2O is twice as efficient as the C2H2 self-broadening.However, the analysis of a dedicated cell measurement usinga mixture of 3 mbar of C2H2 and 7 mbar of H2O indicatesthat the broadening of C2H2 lines by collisions with H2Omolecules is only 10 % more effective than self-broadening.Still, the calibration procedure would benefit from a properquantification of H2O contamination in the C2H2 cell, whichwill be included in future calibration runs. Figure 10 showsthe effective pressure parameters as a function of the wa-ter vapour columns observed at low pressure. The the wa-ter vapour column residing in the C2H2 cell causes a com-mon offset of all data points towards higher abscissa valuesin this diagram. The data point in the upper right corner ofthe diagram refers to cell #13. The fact that the cell with thestrongest additional broadening of the HCl lines in this sub-sample also suffers from the highest amount of water vapoursupports the outgassing scenario. However, the retrieval ofthe water vapour amount inside the cells based on the weak
32
1
Figure 10. The excess line broadening derived for H35
Cl as function of water vapour 2
contamination for the cell batch CT1303. The data point in the upper right corner of the 3
diagram refers to cell #13. 4
Fig. 10.The excess line broadening derived for H35Cl as functionof water vapour contamination for the cell batch CT1303. The datapoint in the upper right corner of the diagram refers to cell #13.
superimposed absorption dip shown in Fig. 9 is not accurateenough to exclude air leakage as an additional impact factor.
Although a discussion of spectroscopic data is outsidethe focus of this paper, we would like to point to the factthat the observed line widths for the purest cells are nar-rower than predicted by HITRAN 2008: the pressure broad-ening is about 12 % lower than expected. This might indicatethat HITRAN 2008 reports incorrect band intensity or self-broadening coefficients for HCl, but as our measurements areperformed in a pressure range that might be affected by nar-rowing effects, one should avoid drawing hasty conclusions.A new study of the HCl self-broadening and shift parametersis underway at JPL (Jet Propulsion Laboratory, California).
7 Summary and outlook
We have presented a novel, accurate method for calibratingthe sealed HCl cells used by TCCON for ILS monitoring.We have applied the method to investigate a larger sample ofcells and found non-negligible scatter of cell performance.We have derived effective cell parameters to ensure that allcells can be used for determining consistent ILS parameters.In the future, we plan to include all HCl cells that are used inTCCON and we will repeat the HCl cell characterization atregular intervals. The results will be collected and kept up-to-date by generating a table in the TCCON wiki. In addition,we will exploit the HCl column amounts determined for eachcell in the course of the calibration for additional crosschecksof spectrometer performance within TCCON.
Acknowledgements.We would like to thank the head of the work-shop at KIT IMK-ASF, A. Streili, for his exceeding commitmentwith the construction of the 40 cm cell bodies. We acknowledgesupport by the European integrating activity project InGOS(www.ingos-infrastructure.eu) for performing this study. BIRAthanks the Belgian Federal Science Policy for support through
Atmos. Meas. Tech., 6, 3527–3537, 2013 www.atmos-meas-tech.net/6/3527/2013/

F. Hase et al.: Calibration of sealed HCl cells 3537
the AGACC-II project. The LPMAA is grateful to the FrenchINSU LEFE programme for supporting the TCCON-Paris project.Part of this work was performed at the Jet Propulsion Laboratory,California Institute of Technology, under contract with NASA.We acknowledge support by Deutsche Forschungsgemeinschaftand Open Access Publishing Fund of the Karlsruhe Institute ofTechnology.
The service charges for this open access publicationhave been covered by a Research Centre of theHelmholtz Association.
Edited by: D. Griffith
References
Davis, S. P., Abrams, M. C., and Brault, J. W.: Fourier transformspectrometry, Academic Press, ISBN: 0-12-042510-6, 2001.
Dicke, R. H.: The effect of Collisions upon the Doppler width ofspectral lines, Phys. Rev. 89, 472–473, 1953.
Dohe, S., Sherlock, V., Hase, F., Gisi, M., Robinson, J., Sepúlveda,E., Schneider, M., and Blumenstock, T.: A method to correctsampling ghosts in historic near-infrared Fourier transform spec-trometer (FTS) measurements, Atmos. Meas. Tech., 6, 1981–1992, doi:10.5194/amt-6-1981-2013, 2013.
Griffith, D.: ILS sensitivity study by modulation-efficiency weight-ing of interferograms, Material presented on TCCON teleconfer-ence in January, 2010.
Hase, F.: Improved instrumental line shape monitoring for theground-based, high-resolution FTIR spectrometers of the Net-work for the Detection of Atmospheric Composition Change,Atmos. Meas. Tech., 5, 603–610, doi:10.5194/amt-5-603-2012,2012.
Hase, F. and Blumenstock, T.: Alignment procedure for BrukerIFS 120 spectrometers, NDSC Infrared Working Group Meeting,Bordeaux, 2001.
Hase, F., Blumenstock, T., and Paton-Walsh, C.: Analysis of theinstrumental line shape of high-resolution Fourier transform IRspectrometers with gas cell measurements and new retrieval soft-ware, Appl. Optics, 38, 3417–3422, 1999.
Keppel-Aleks, G., Wennberg, P. O., and Schneider, T.: Sources ofvariations in total column carbon dioxide, Atmos. Chem. Phys.,11, 3581–3593, doi:10.5194/acp-11-3581-2011, 2011.
Kurylo, M. J.: Network for the detection of stratospheric change(NDSC), SPIE Proceedings 1991, P. Soc. Photo-Opt. Ins., 1491,168–174, 1991.
Messerschmidt, J., Macatangay, R., Notholt, J., Petri, C., Warneke,T., and Weinzierl, C.: Side by side measurements of CO2 byground-based Fourier transform spectrometry (FTS), Tellus B,62, 749–758, doi:10.1111/j.1600-0889.2010.00491.x, 2010.
Miller, C. E., Crisp, D. , DeCola, P. L., Olsen, S. C., Rander-son, J. T., Michalak, A. M., Alkhaled, A., Rayner, P., Jacob,D. J. Suntharalingam, P., Jones, D. B. A., Denning, A. S.,Nicholls, M. E., Doney, S. C., Pawson, S., Boesch, H., Con-nor, B. J., Fung, I. Y., O’Brien, D., Salawitch, R. J., Sander,S. P., Sen, B., Tans, P., Toon, G. C., Wennberg, P. O., Wofsy,S. C., Yung, Y. L., and Law, R. M.: Precision requirementsfor space-based X-CO2 data, J. Geophys. Res.-Atmos., 112,D10314, doi:10.1029/2006JD007659, 2007.
Olsen, S. C. and Randerson, J. T.: Differences between sur-face and column atmospheric CO2 and implications for car-bon cycle research, J. Geophys. Res.-Atmos., 109, D02301,doi:10.1029/2003JD003968, 2004.
Rothman, L. S., Gordon, I. E., Barbe, A., Benner, D. C., Bernath, P.F., Birk, M., Boudon, V., Brown, L. R., Campargue, A., Cham-pion, J.-P., Chance, K., Coudert, L. H., Dana, V., Devi, V. M.,Fally, S., Flaud, J.-M., Gamache, R. R., Goldman, A., Jacque-mart, D., Kleiner, I., Lacome, N., Lafferty, W., Mandin, J.-Y., Massie, S. T., Mikhailenko, S. N., Miller, C. E., Moazzen-Ahmadi, N., Naumenko, O. V., Nikitin, A. V., Orphal, J.,Perevalov, V. I., Perrin, A., Predoi-Cross, A., Rinsland, C. P., Rot-ger, M., Simeckova, M., Smith, M. A. H., Sung, K., Tashkun, S.A., Tennyson, J., Toth, R. A., Vandaele, A. C., and Vander Auw-era, J.: The HITRAN 2008 molecular spectroscopic database, J.Quant. Spectrosc. Ra., 110, 533–572, 2009.
Washenfelder, R. A.: Column abundances of carbon dioxide andmethane retrieved from ground-based near-infrared solar spectra,PhD thesis, California Institute of Technology, Pasadena, Cali-fornia (available at:http://thesis.library.caltech.edu), 2006.
Wunch, D., Toon, G. C., Wennberg, P. O., Wofsy, S. C., Stephens,B. B., Fischer, M. L., Uchino, O., Abshire, J. B., Bernath, P., Bi-raud, S. C., Blavier, J.-F. L., Boone, C., Bowman, K. P., Browell,E. V., Campos, T., Connor, B. J., Daube, B. C., Deutscher, N.M., Diao, M., Elkins, J. W., Gerbig, C., Gottlieb, E., Griffith, D.W. T., Hurst, D. F., Jiménez, R., Keppel-Aleks, G., Kort, E. A.,Macatangay, R., Machida, T., Matsueda, H., Moore, F., Morino,I., Park, S., Robinson, J., Roehl, C. M., Sawa, Y., Sherlock, V.,Sweeney, C., Tanaka, T., and Zondlo, M. A.: Calibration of theTotal Carbon Column Observing Network using aircraft pro-file data, Atmos. Meas. Tech., 3, 1351–1362, doi:10.5194/amt-3-1351-2010, 2010.
Wunch, D., Toon, G. C., Blavier, J.-F. L., Washenfelder, R., Notholt,J., Connor, B. J., Griffith, D. W. T., Sherlock, V., and Wennberg,P. O.: The Total Carbon Column Observing Network, Phil. T.Roy. Soc. A, 369, 2087–2112, doi:10.1098/rsta.2010.0240, 2011.
www.atmos-meas-tech.net/6/3527/2013/ Atmos. Meas. Tech., 6, 3527–3537, 2013