atmosphere will affect: - signal-to-noise · · 2018-02-15atmosphere will affect: applications...
TRANSCRIPT


Applications and Modeling DomainAtmosphere will affect:
- Target signatures
- Signal-to-Noise
- Detection thresholds
- Acquisition range
and time

• Airborne Electro-optical Testbed
• Palletized optical benches
• UV/Visible Imagery & Spectroscopy
• MWIR/LWIR Imagery & Spectroscopy
• LIDAR & Laser Experiments
• Active/Passive remote sensing
• Hyperspectral ExperimentsOptical platform
Argus was the only Air Force C-135E capable of flying extended missions up to
50,000 feet above the earth’s surface, making it unique in the Air Force inventory.
From 1986 to 2000, its mission was to collect data on rocket plume phenomena,
reentry vehicle signatures, kill assessments, sensor checkout for SDI,
and airborne laser remote sensing experiments.
Argus C-135E Electro-Optical Testbed

MSX SPIRIT III SensorMidcourse Space Experiment (MSX) was a Ballistic Missile Defense Organization satellite experiment to map bright
infrared sources in space. MSX offered the first system demonstration of technology in space to identify and track
ballistic missiles during their midcourse flight phase. Operational from 1996-97.
I developed the Sensor Off-Axis Radiance (SOAR) computer code, modeling Bidirectional Reflectance Distribution
Function (BRDF) data to analyze the Mid-Course Space Experiment (MSX) SPIRIT III infrared sensor (5 IR bands).
http://irsa.ipac.caltech.edu/Missions/msx.html

The American Institute of Aeronautics and Astronautics (AIAA) Congressional Visits DayEvery year, AIAA members – engineers, scientists, researchers, students, educators, and technology executives – travel to Washington DC, for a day of advocacy and awareness with national decision makers. My group usually presents 2 key issues with recommendations:
● Aerospace & Defense Work-force Enhancement (& STEM) ● Aerospace & Defense Budget Funding and Procurement
In DC with Ms. Cynthia Kaiser, former Directed Energy Chief Engineer at AFRL, she is now involved with the AfterMath summer camp program for students; Col. Mark Neice (ret.), Executive Director of the Directed Energy Professional Society, Col. Neice was Chief of the Laser Division at AFRL when I was a civilian crew member on the Argus C-135E electro-optical testbed aircraft, he was the pilot for Argus on many missions that I flew on including a deployment to South Korea; and our group leader Dr. James Horkovich (Directed Energy advocate), and Senator Martin Heinrich.


<#>
Astronomy Today, 8th edChaisson/McMillan
Astronomy 1192 Lab Manual (CNM)Dr. Erica Voges, et. al.
Project CLEA Softwarehttp://www3.gettysburg.edu/~marschal/clea/CLEAhome.html

Sponsored by Gettysburg
College and the National
Science Foundation,
Project CLEA,
Contemporary Laboratory
Experiences in Astronomy,
develops laboratory
exercises that illustrate
modern astronomical
techniques using digital
data and color images.

9
● "Cosmic Voyage" (35 min),
narrated by Morgan Freeman.
Cosmic zoom from 6:35 to 11:40.
https://www.youtube.com/watch?v
=xEdpSgz8KU4


0.5 to 15% error,
dep on def of stadion.

Mars is at same
point in orbit
every 687 days.
Kepler found that
the orbit of Mars
is an ellipse.


Johannes Kepler (1571 – 1630)
found that orbits are ellipses,
not circles. Developed Laws of
planetary motion.
P2 = a3
P = Period (in years)
a = semimajor axis (in AU)
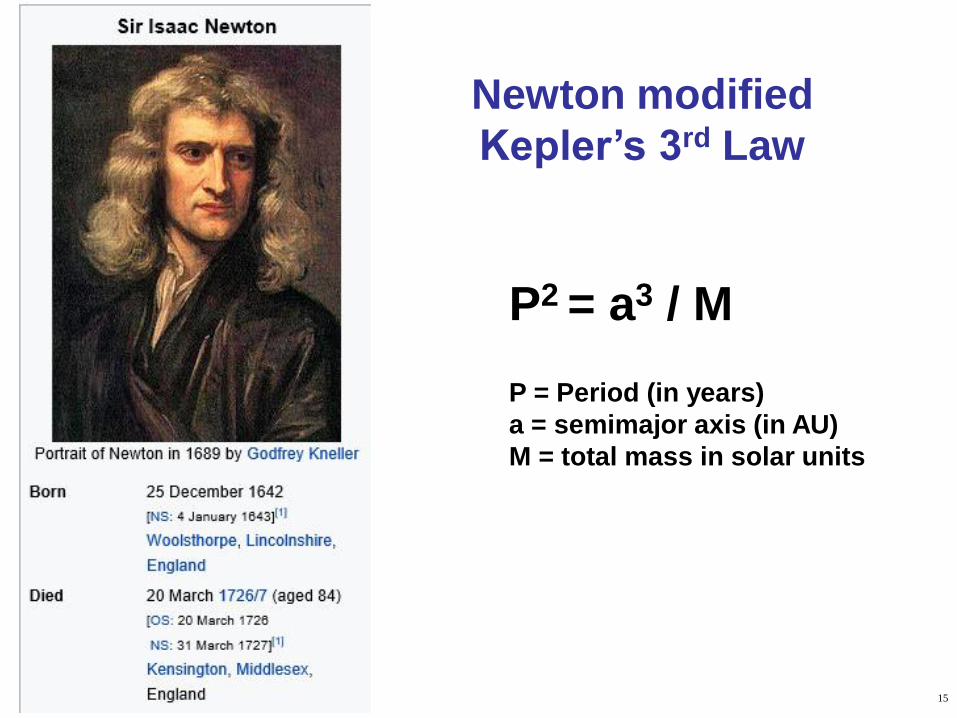
Newton modified
Kepler’s 3rd Law
P2 = a3 / M
P = Period (in years)
a = semimajor axis (in AU)
M = total mass in solar units
15
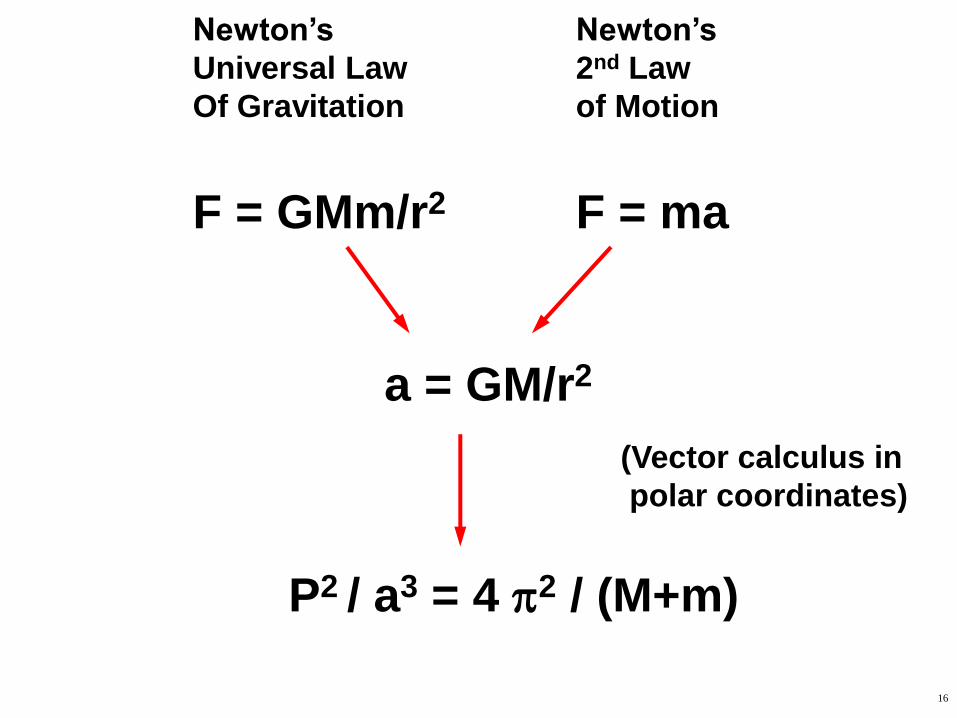
Newton’s Newton’s
Universal Law 2nd Law
Of Gravitation of Motion
F = GMm/r2 F = ma
a = GM/r2
P2 / a3 = 4 2 / (M+m)
16
(Vector calculus in
polar coordinates)

Jupiter
1/1047 mass of Sun

Supermassive black hole Sagittarius A*
4.3 million solar masses
Star S2 reaching speeds exceeding
5000 km/s (11,000,000 mph, or
1/60 the speed of light)


20
B = 100 m
= 60º
tan() = D / B
D = B tan()
= (100m) tan(60º)
= (100m) (1.732)
= 173 m
Triangulation: Measure
baseline and angles,
can calculate distance

Parallax: Similar to
triangulation, but look at
apparent motion of object
against distant
background from two
vantage points
21

Edmond Halley (1656 - 1743)
first to propose method of
finding AU by measuring the
parallax of transits.

Transit – When inner planets pass between Earth
and Sun
• Mercury : 1 or 2 per decade
• Venus: about 1 pair per century
1639
1761
1769
1874
1882
2004
2017


Transits were important to
determine length of the
Astronomical Unit (AU), the
average distance from the
Earth to the Sun.
1 AU = 93 million miles
= 9.22956 x10⁷ mi
= 1.49598 x10⁸ km


The Dimensions of the Solar System
Now measured
using radar. Ratio
of mean radius of
Venus’s orbit to
that of Earth is
very well known.
27

28
https://en.wikipedia.org/wiki/Speed_
of_light#/media/File:Speed_of_light_
from_Earth_to_Moon.gif

Radar astronomy is a technique of observing nearby astronomical objects by
reflecting microwaves off target objects and analyzing the reflections. This
research has been conducted for six decades. Radar astronomy differs from radio
astronomy in that the latter is a passive observation and the former an active one.
Radar systems have been used for a wide range of solar system studies.
The combination of optical and radar observations normally allows the prediction
of orbits at least decades, and sometimes centuries, into the future.
Radar provides the ability to study shape, size and spin state of asteroids and
comets from the ground. Radar imaging has produced images with up to 7.5-m
resolution. With sufficient data, the size, shape, spin and radar albedo of the
target asteroids can be extracted.
Only 19 comets have been studied by radar,[8] including 73P/Schwassmann-
Wachmann. There have been radar observations of 612 Near-Earth asteroids and
138 Main belt asteroids.

The Pale Blue Dot - Cosmos: A Space Time Odyssey (3.5 min)
https://www.youtube.com/watch?v=GO5FwsblpT8
https://en.wikipedia.org/wiki/Pale_Blue_Dot
https://en.wikipedia.org/wiki/Family_Portrait_(Voyager)
https://en.wikipedia.org/wiki/Cosmos:_A_Spacetime_Odyssey
“Family Portrait”, 1990, Voyager 1.6 billion km

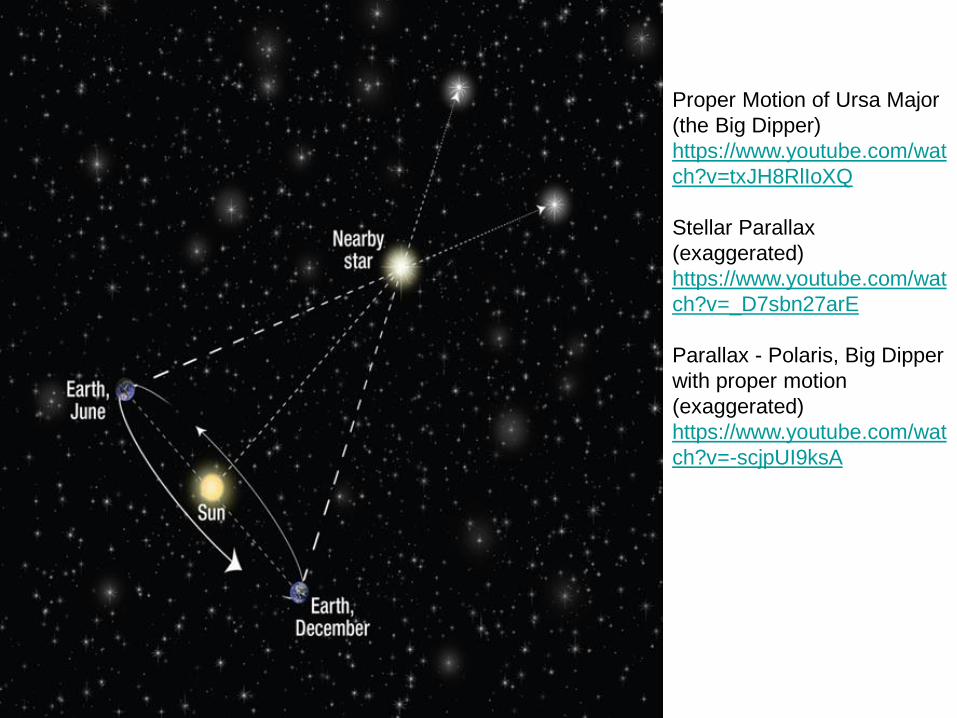
Proper Motion of Ursa Major
(the Big Dipper)
https://www.youtube.com/wat
ch?v=txJH8RlIoXQ
Stellar Parallax
(exaggerated)
https://www.youtube.com/wat
ch?v=_D7sbn27arE
Parallax - Polaris, Big Dipper
with proper motion
(exaggerated)
https://www.youtube.com/wat
ch?v=-scjpUI9ksA

Small angles so use
d(pc) = 1 / p(arcsec)

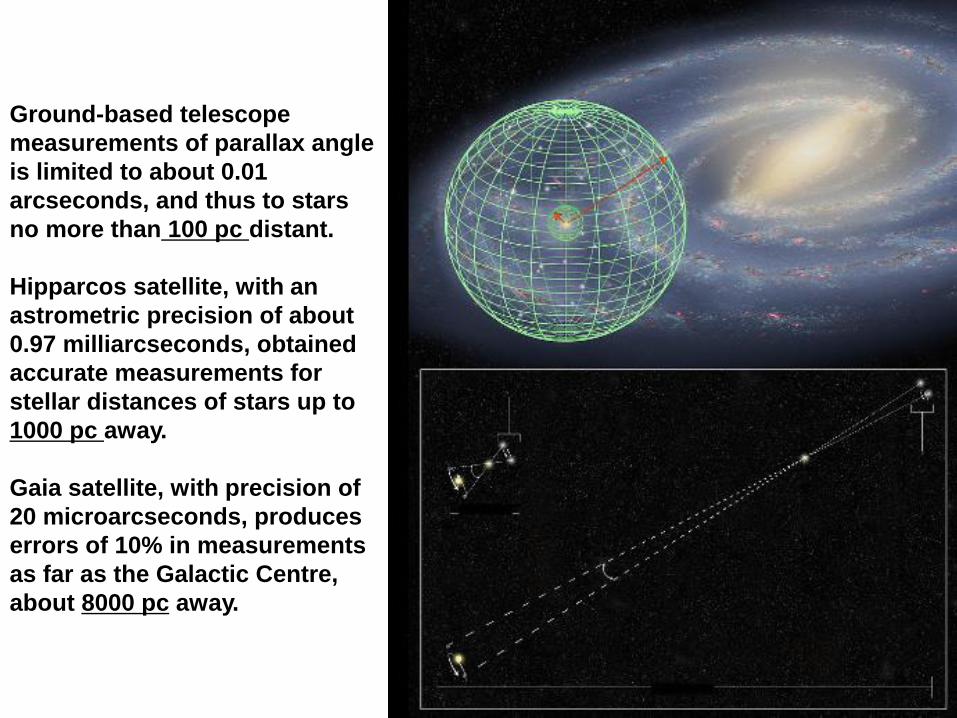
Ground-based telescope
measurements of parallax angle
is limited to about 0.01
arcseconds, and thus to stars
no more than 100 pc distant.
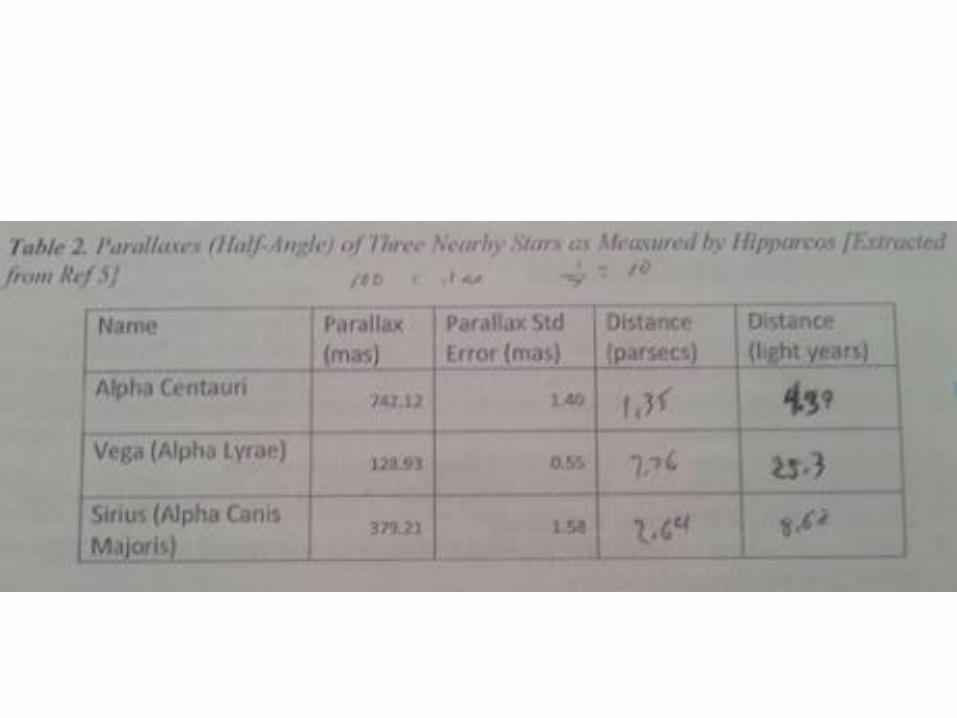
Hipparcos satellite, with an
astrometric precision of about
0.97 milliarcseconds, obtained
accurate measurements for
stellar distances of stars up to
1000 pc away.
Gaia satellite, with precision of
20 microarcseconds, produces
errors of 10% in measurements
as far as the Galactic Centre,
about 8000 pc away.

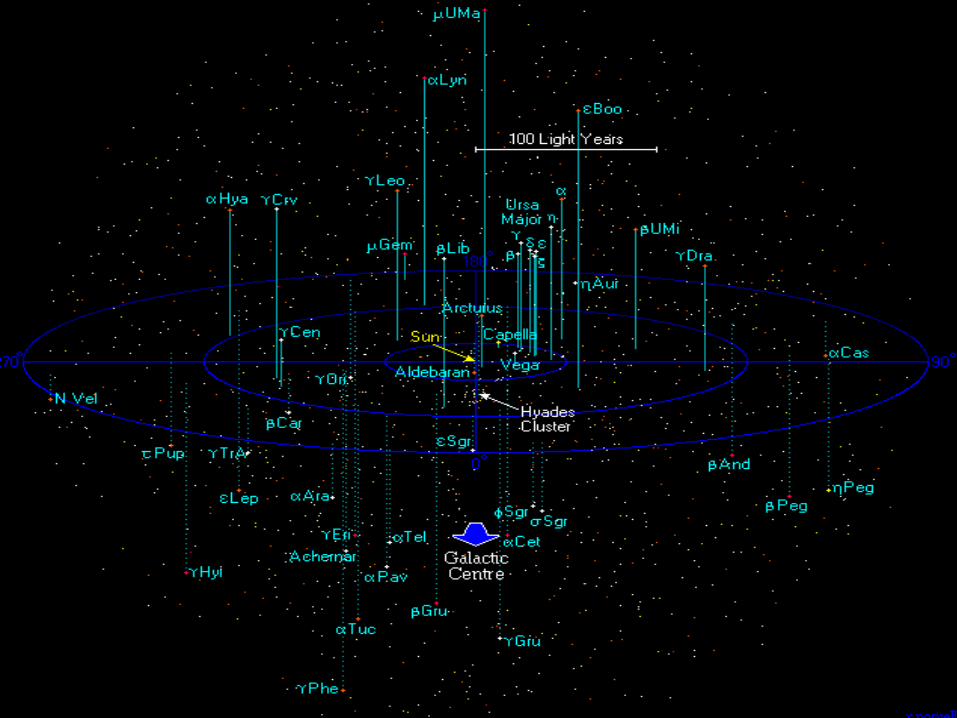
The Solar
Neighborhood
The 30 closest stars
to the Sun
(within 4 pc or 13 ly)
Proxima Centauri
parallax = 0.77”
= 270,000 AU
= 4.3 light-years
The Solar Neighborhood


3.1 Information from the Skies
Visible spectrum:
*ESA em rad
*vio?

Electromagnetic Spectrum
4000 Å 5000 Å 6000 Å 7000 Å (angstroms)
(1 micron = 10-6 meters, 1 nanometer = 10-9 meters , 1 angstrom = 10-10 meters)
0.4 m 0.5 m 0.6 m 0.7 m (microns)
(nanometers)

Human Vision

Biological Hyperspectral
Remote Sensing System
• Most complex vision system in nature
• Hyperspectral – Photoreceptors for 16 bands – Humans & primates see 3 bands (RGB)– Birds see 4 bands
• Ultraviolet / Visible / Near-Infrared range – 300 to >700 nm
• Detects 3 linear polarizations– E-vectors at 0°, 45°, 90° (~500 nm)
• 360° push-broom scanning mode
• Each eye is trinocular– 3 pupils in each eye– Both eyes result in “hexnocular” vision
• Nervous system integrates:– Spatial / Spectral / Temporal / Polarization
• Evolved from crustaceans 400 M years ago– Vision system developed 40 M years ago
Mantis Shrimp (Stomatopod)

“Prawns in Space”
Project
University of
Queensland
Australian Research
Council (ARC)
Mantis Shrimp (Stomatopod)

(high density)
(low density)
Kirchoff’s Laws


An absorption spectrum can also be used to
identify elements. These are the emission and
absorption spectra of sodium:
Spectral Lines


Blackbody Radiation
O
O
Planck’s Radiation Equation
Spectral Radiance (W/cm2/sr/m) Integrate over waveband to
get radiance (W/cm2/sr)
Ref: Spectral Sensing Course at Univ. of New Mexico
Wien’s Displacement Law
max (m) = 2898 / T (K)
Sun peak: max (m) = 2898 / 5800 = 0.5 m
(green-blue)
Earth peak: max (m) = 2898 / 295 = 9.8 m
(LWIR or thermal band)

Harvard Spectral Classification
Each spectral type further subdivided into 10 divisions,
O0 to O9 through M0 to M9.
Our Sun is spectral type G2 (Surface T ~ 5800 K ~ 10,000 F)

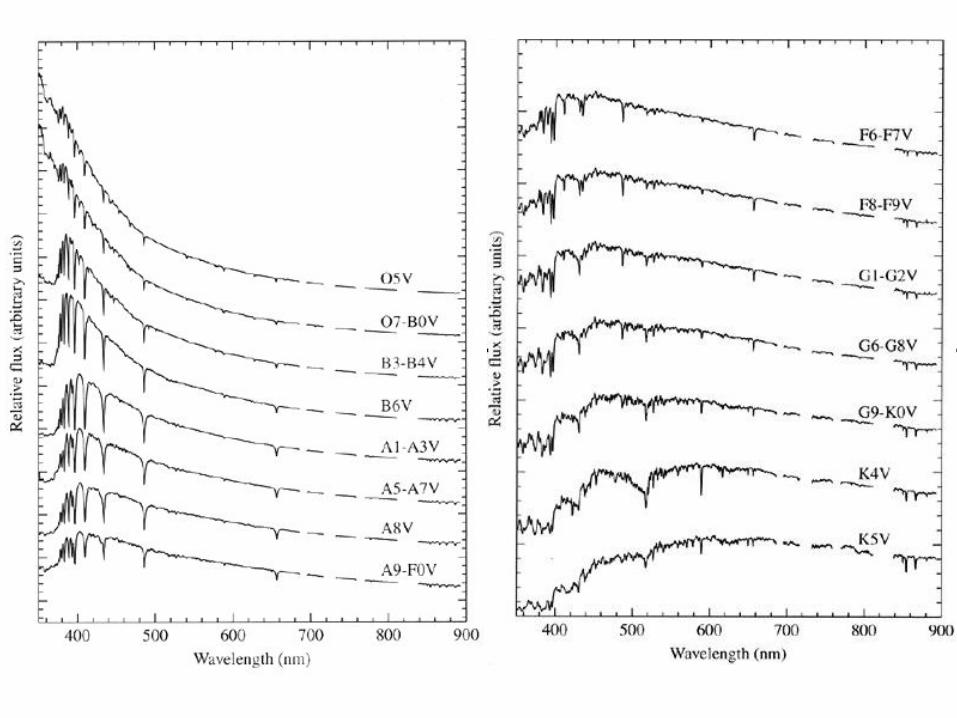
Example Stellar Spectra
Our Sun is spectral type G2V
(Surface T ~ 5800 K ~ 10,000 F, main-sequence star)
4000 Å 5000 Å 6000 Å
7000 Å

Blackbody Curve (Intensity vs Wavelength at temperature):
Peak Intensity shifts left for higher temperature.
Peak Intensity shifts right for lower temperature.
Wien’s Law gives wavelength of maximum intensity
for a given temperature.
λmax (Å) = 2.9 x 10⁷ / T (K)
Our Sun: λmax = 2.9 x 10⁷ / (5800 K) = 5000 Å

Spectral Image (photo)
compared to Spectral Data Plot (Intensity vs Wavelength)
Wavelength (Å)
(1 angstrom = 10-10 meters)
Intensity is
“Normalized” to 1.
Absorption lines.

Classification of Stellar Spectra
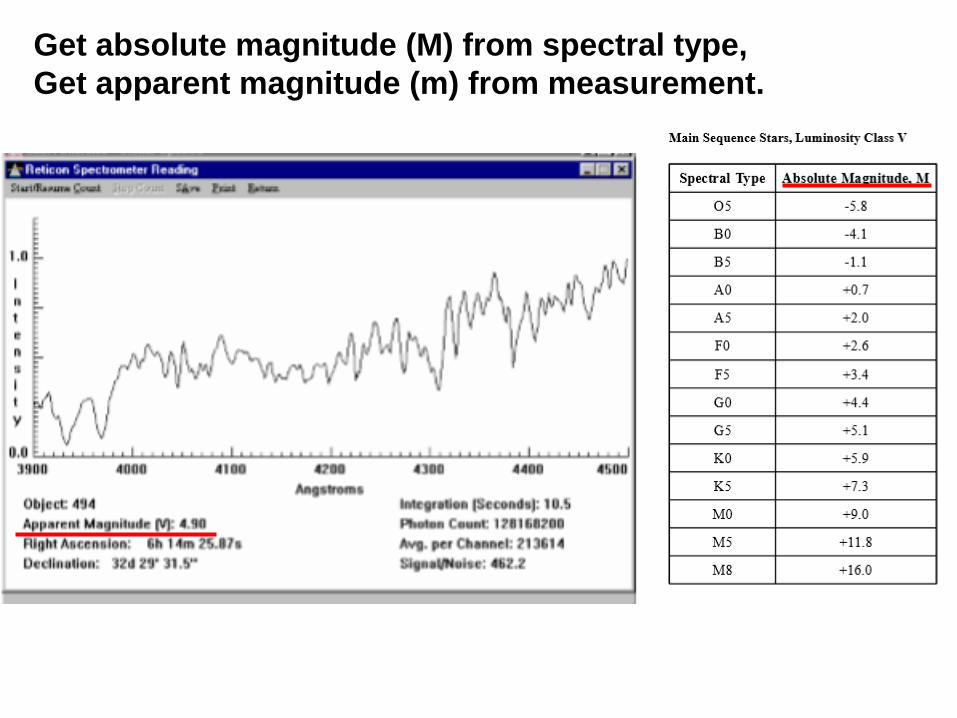
Get absolute magnitude (M) from spectral type,
Get apparent magnitude (m) from measurement.

Apparent and Absolute Magnitude
The apparent magnitude (m) of a celestial body is a measure of its
brightness as seen by an observer on Earth.
The absolute magnitude (M) of a celestial body (outside of the solar
system) is the apparent magnitude it would have if it were 10 parsecs
(~32.6 light years) away.
(The brighter the object appears, the lower its magnitude.)
http://en.wikipedia.org/wiki/Apparent_magnitude
Inverse-square law.
Intensity drops as 1/r2.

Spectroscopic Parallax Method
log D = (m – M + 5)/5 (m-M is “Distance Modulus”)
D = 10 ^ [ (m – M + 5)/5 ]
D = distance to star in parsecs (1 parsec = 3.26 light years = 3.08 x 10¹³ km ~ 19 trillion miles)
m = apparent magnitude (from your spectral plot)
M = absolute magnitude (from Main Sequence Chart, p.23)
Example: M = -2.1, m = 10.5, D = ?
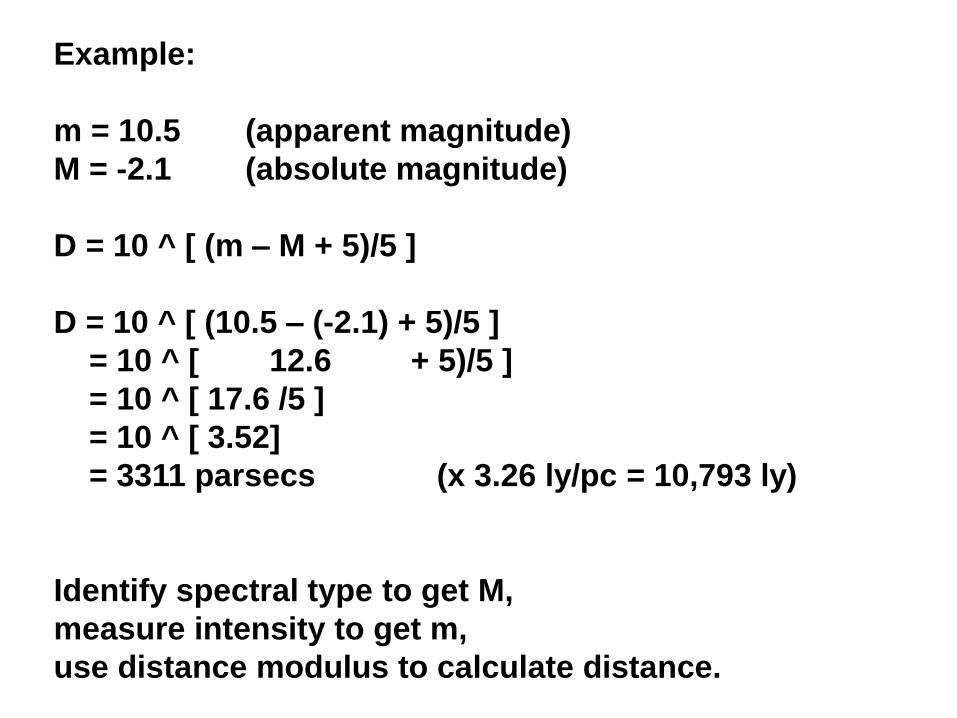
Example:
m = 10.5 (apparent magnitude)
M = -2.1 (absolute magnitude)
D = 10 ^ [ (m – M + 5)/5 ]
D = 10 ^ [ (10.5 – (-2.1) + 5)/5 ]
= 10 ^ [ 12.6 + 5)/5 ]
= 10 ^ [ 17.6 /5 ]
= 10 ^ [ 3.52]
= 3311 parsecs (x 3.26 ly/pc = 10,793 ly)
Identify spectral type to get M,
measure intensity to get m,
use distance modulus to calculate distance.

Photoelectric Photometry of the Pleiades
D = 10 ^ [ (m – M + 5)/5 ]

Pleiades (Seven Sisters)Open star cluster (~1000)Many young blue hot starsDistance ~ 410 light years

The Milky Way, Star Clusters https://www.youtube.com/watch?v=tj_QPnO8vpQ&index=37&list=PL8dPuuaLjXtPAJr1ysd5yGIyiSFuh0mILhttps://www.youtube.com/watch?v=an4rgJ3O21A&list=PL8dPuuaLjXtPAJr1ysd5yGIyiSFuh0mIL&index=35


We are located in the
“Orion Spur”.
Also known as the
Local Spur,
Orion Arm,
Orion-Cygnus Arm.
*Gsizes


The H–R diagram plots
stellar luminosity against
surface temperature.
This is an H–R
diagram of a few
prominent stars.
Hertzsprung–
Russell Diagram
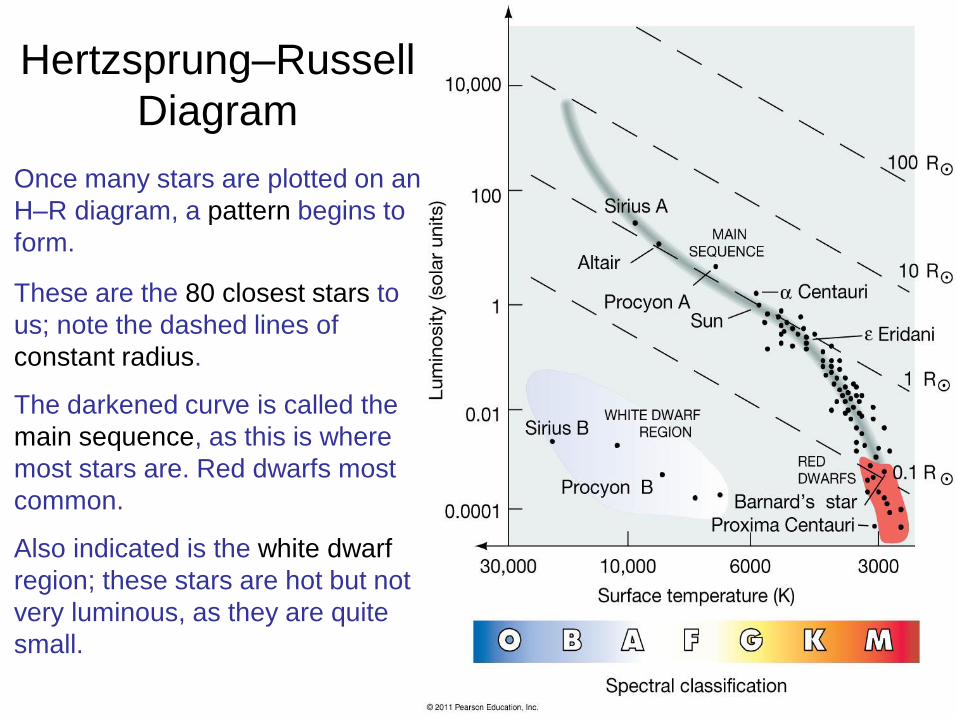
Once many stars are plotted on an
H–R diagram, a pattern begins to
form.
These are the 80 closest stars to
us; note the dashed lines of
constant radius.
The darkened curve is called the
main sequence, as this is where
most stars are. Red dwarfs most
common.
Also indicated is the white dwarf
region; these stars are hot but not
very luminous, as they are quite
small.
Hertzsprung–Russell
Diagram

This is an H–R plot of about
20,000 stars. (Hipparcos
satellite data.) The main
sequence is clear, as is the
red giant region.
About 90% of stars lie on the
main sequence; 9% are red
giants and 1% are white
dwarfs.
Hertzsprung–
Russell Diagram

White Dwarfs
Red Giants

Hertzsprung–Russell (H-R) DiagramPlot of stars magnitude (V) vs color index (B-V)M = absolute visible magnitudeB-V = apparent blue magnitude minus apparent visible magnitude


Main sequence fitting


D = 10 ^ [ (m – M + 5)/5 ]
Example: M45 (Pleiades)

Spectroscopic parallax can extend the cosmic distance scale to several thousand
parsecs
Extending the Cosmic Distance Scale

Pulsar SignalsFirst pulsar detected by Jocelyn Bell in 1967 (“Little Green Men”).More pulsar discoveries confirmed they were rapidly rotating neutron stars with strong magnetic fields.
Most emit in radio region of EM spectrum (some vis, X-ray, gamma).Our radio observatory measures from 400 to 1400 MHz.
Higher frequencies travel faster through interstellar medium causing difference in timing between pulses.This “interstellar dispersion” allows us to calculate distance to pulsar.

Screams of Rapidly Spinning Pulsars (2:33)Start at 0:55.
https://www.youtube.com/watch?v=SRDOCKOq5iQ&nohtml5=False

Dispersion in pulsar timingPulsars are spinning neutron stars that emit pulses at very regular intervals ranging from milliseconds to seconds. Astronomers believe that the pulses are emitted simultaneously over a wide range of frequencies. However, as observed on Earth, the components of each pulse emitted at higher radio frequencies arrive before those emitted at lower frequencies. This dispersion occurs because of the ionized component of the interstellar medium, mainly the free electrons, which make the group velocity frequency dependent.

Measuring distance using dispersionPulsar emits radiation at many different frequencies.Higher frequencies travel faster through interstellar medium.
L = (2 – 1) = 10 km(1/5 – 1/10)

Dispersion formula for interstellar mediumVelocity of pulse depends on EM frequency and electron density.
T = arrival time (sec)f = frequency (MHz)D = distance (parsecs)
v = f2 / (4150 * ne)
electron densityne = 0.03 electrons/cm3
v = f2 / 124.5
1/v = 124.5 / f2

Example
T1 = 3.690 secT2 = 4.355 secT2 - T1 = 0.665 sec
f1 = 800 MHzf2 = 400 MHz
(1/f2) 2 - (1/f1) 2
= (1/400) 2 - (1/800) 2
= 4.687 x 10⁻⁶
D = 0.665 = 1139 parsecs124.5 * 4.687 x 10 -6
T = arrival time (sec)f = frequency (MHz)D = distance (parsecs)


The upper plot is an RR
Lyrae star. All such stars
have essentially the same
luminosity curve with
periods from 0.5 to 1 day.
The lower plot is a Cepheid
variable; Cepheid periods
range from about 1 to 100
days.

The variability of these
stars comes from a
dynamic balance
between gravity and
pressure—they have
large oscillations
around stability.

Cepheid Variable Stars

We have now
expanded our
cosmic distance
ladder one
more step:

This is the Local Group of
galaxies, about 45 galaxies
within about 1 Mpc of the
Milky Way. Three spirals,
mostly dwarf-elliptical or
irregular.

However, some galaxies have no Cepheids, and most are farther
away than 25 Mpc. New distance measures are needed.
• Tully-Fisher relation correlates a galaxy’s rotation speed (which
can be measured using the Doppler effect) to its luminosity. Very
tight correlation. Using 21-cm and IR to avoid dust. 200 Mpc.


A type Ia supernova (type one-a) is a type of supernova that occurs in binary
systems (two stars orbiting one another) in which one of the stars is a white
dwarf. The other star can be anything from a giant star to an even smaller white
dwarf.
Physically, carbon–oxygen white
dwarfs with a low rate of rotation
are limited to below 1.44 solar
masses.
Beyond this, they re-ignite and in
some cases trigger a supernova
explosion.
This type Ia category of
supernovae produces consistent
peak luminosity because of the
uniform mass of white dwarfs that
explode via the accretion
mechanism. The stability of this
value allows these explosions to
be used as standard candles to
measure the distance to their host
galaxies because the visual
magnitude of the supernovae
depends primarily on the distance.

This theory of formation of
new elements in supernova
explosions produces a light
curve that agrees quite well
with observed curves:
Type I supernovae all have about the
same luminosity, as the process by
which they happen doesn’t allow for
much variation. They can be used as
“standard candles”—objects whose
absolute magnitude is known, and
which can therefore be used to
determine distance using their apparent
magnitude.
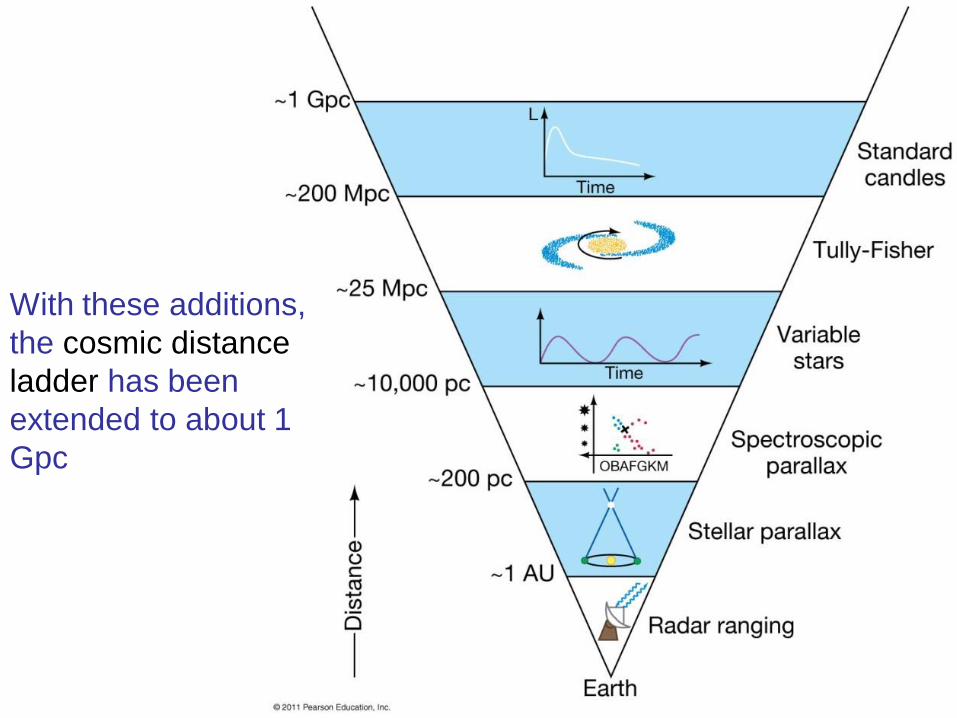
With these additions,
the cosmic distance
ladder has been
extended to about 1
Gpc

Hubble Ultra Deep Field
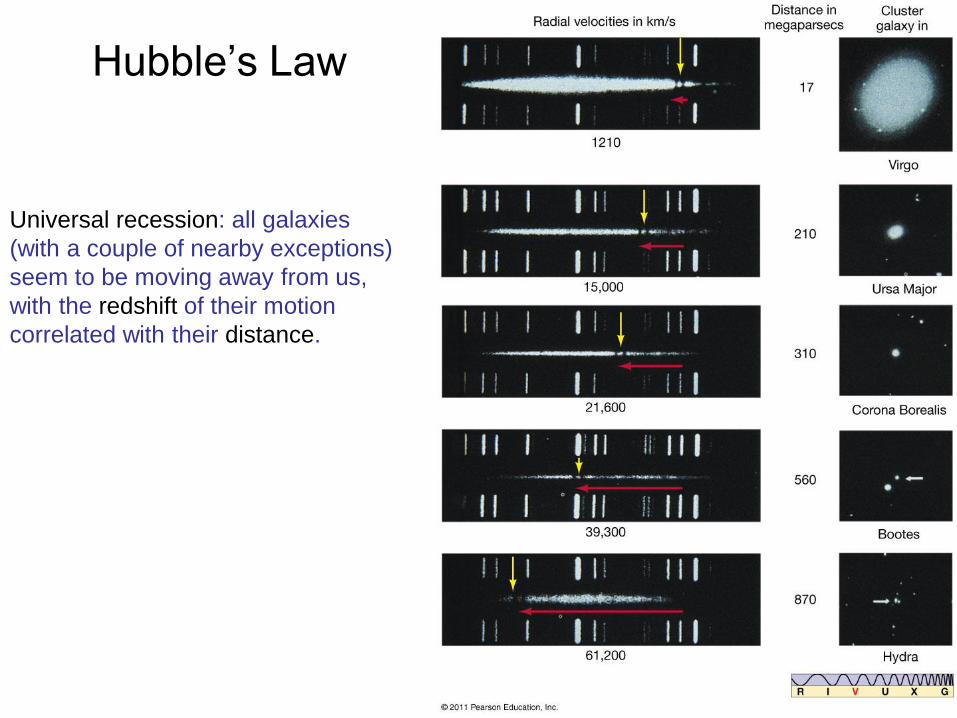
Universal recession: all galaxies
(with a couple of nearby exceptions)
seem to be moving away from us,
with the redshift of their motion
correlated with their distance.
Hubble’s Law

Hubble Diagram
(megaparsec = 106 parsecs)
Get velocity from Doppler equation.Get distance from apparent magnitude.
Hubble Parameter (H) = 67 to 83 km/sec/Mpc

The
Doppler
Effect
Depends only
on the relative
motion of
source and
observer

Doppler Effect on Spectra

Expanding Universe

The same analogy can be used to explain the cosmological redshift

Ca II (K line)
Ca II (H line)
P. 9, Step 11.File / Data / Save Spectrum
VIREO / Tools / Spectrum Measuring
File / Data / Load Saved Spectrum
Record App. Mag. on P. 14.

Velocity from redshift.
Hm = 4088 Å
ΔH = 4088 - 3968.47 Å= 120 Å
vH = (3x10⁵ km/s)(120/3968)= 9x10³ km/s
(at D = 123 Mpc)Å

0 100 200 300 400 500 600 700 800
1 x
10
4
2
x 1
04
3
x 1
04
4
x 1
04
5
x 1
04
Distance (Mpc)
Vel
oci
ty (
km/s
)
Hubble Plot
Draw “Line Fit” through origin.
XFor Step 6 on p.11,pick 800 Mpc on lineto calculate Hubble Parameter.
X

Hubble’s Law
H = (5.2x10⁴ km/s) / (800 Mpc)
= 65 km/s/Mpc
= (65 km/s/Mpc) (Mpc/106pc) (pc/3.26 ly) (ly /9.46x1012 km)
= 2.11x10⁻¹⁸ /s
So T = 1/H = 4.74x10¹⁷ sec
T = 1.5x10¹⁰ yr = 15 Byr

Note: Estimates for Hubble’s Constant (H0) varies from
67 to 77 km/s/Mpc, depending on data sets and
methods.
Data from the WMAP probe collecting data on the cosmic
microwave background radiation gives the age of the
universe at 13.75 ± 0.11 billion years.
13.75 billion years ± 110 million years
(uncertainty of 0.8%)

This puts the final step
on our distance ladder

This galaxy map shows the largest structure known in the Universe, the Sloan Great
Wall. No structure larger than 300 Mpc is seen.
The Universe on the Largest Scales
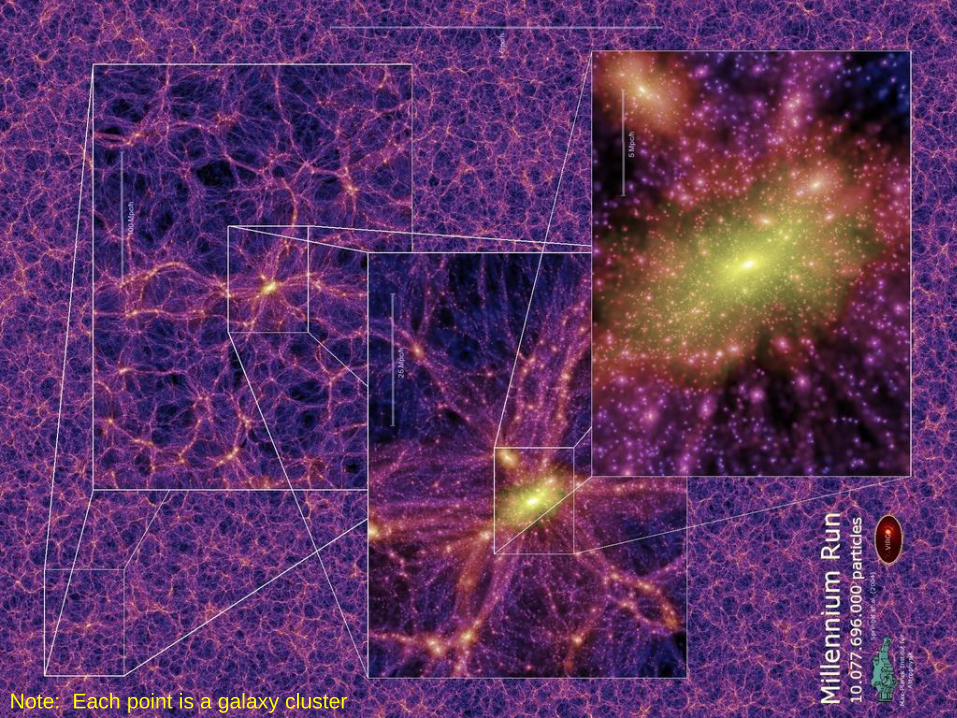
Note: Each point is a galaxy cluster

USS Nimitz UFO incident 2004https://en.wikipedia.org/wiki/USS_Nimitz_UFO_incidenthttps://en.wikipedia.org/wiki/Advanced_Aviation_Threat_Identification_Programhttps://www.msn.com/en-us/video/wonder/moment-ufo-spotted-by-us-navy-jet/vi-BBH16H2?ocid=spartandhp

IT WAS
ALIENS!

Neil deGrasse Tyson said, "The universe brims with mysteries. Just because you don't know what it is you're looking at doesn't mean it's intelligent aliens visiting from another planet.”
https://www.cnn.com/2017/12/20/us/neil-degrasse-tyson-ufos-new-day-cnntv/index.html

Harley D. Rutledge (January 10, 1926 - June 5, 2006) was a U.S. physics professor, and ufologist.
In 1966, Harley Rutledge completed his Ph.D. in solid state physics at the University of Missouri. He subsequently took the position of Professor
and Chairman of the Physics Department at Southeast Missouri State University. He was Department Chairman from 1964 to 1982 and retired
from teaching in 1992.
UFO Research - Challenged to explain sightings of unidentified lights and luminous phenomena in the sky around Piedmont, Missouri, Dr. Harley
Rutledge decided to subject these reports to scientific analysis. He put together a team of observers with college training in the physical
sciences, including a large array of equipment: RF spectrum analyzers, Questar telescopes, low-high frequency audio detectors, electromagnetic
frequency analyzer, cameras, and a galvanometer to measure variations in the Earth's gravitational field.
The resulting Project Identification commenced in April 1973, logging several hundred hours of observation time. This was the first UFO scientific
field study, able to monitor the phenomena in real-time, enabling Rutledge to calculate the objects' actual velocity, course, position, distance, and
size.
Observation of the unclouded night sky often revealed "pseudostars" - stationary lights camouflaged by familiar constellations. Some objects
appeared to mimic the appearance of known aircraft; others violated the laws of physics. The most startling discovery was that on at least 32
recorded occasions, the movement of the lights synchronized with actions of the observers. They appeared to respond to a light being switched
on and off, and to verbal or radio messages. The final results of this project were documented in the 1981 book, Project Identification: The first
Scientific Study of UFO Phenomena.
Books - Project Identification: The first Scientific Study of UFO Phenomena. Prentice-Hall 1981 ISBN 0-13-730713-6 by Harley D. Rutledge,
Ph.D.
Research Papers - Project Identification: Thirteen Years and One-Hundred and Sixty Sightings Later, Harley D. Rutledge, Ph.D. (presented at
the 1986 MUFON symposium). https://en.wikipedia.org/wiki/Harley_Rutledge

Note: Each pt is a galaxy cluster
Millennium Run https://www.youtube.com/watch?v=jzFbLHLJhnM

Existential crisis https://www.facebook.com/JukinVideo/videos/1340165472738386/?hc_ref=NEWSFEED
Note: Each point is a galaxy cluster
"The cosmos is also within us. We're made of star-stuff.We are a way for the cosmos to know itself."
- Carl Sagan, Astronomer

"The cosmos is also within us. We're made of star-stuff.We are a way for the cosmos to know itself."
- Carl Sagan, Astronomer
"We are all connected to each other biologically, to the earth chemically, and to the rest of the universe atomically.We are in the universe and the universe is in us.“
- Neil deGrasse Tyson, Astrophysicist
"We are the cosmos made conscious and life is the means by which the universe understands itself."
- Brian Cox, Physicist
"We are the universe experiencing itself through us." - Mark Fraser, Astronomy Instructor

The Astounding Fact About The Universe Neil deGrasse Tyson (3.5 min)https://www.youtube.com/watch?v=0azoN7t3UhM