atmospheric chemistry and physics (pdf) - atmos-chem … · cal depths during the industrial...
TRANSCRIPT

Atmos. Chem. Phys., 14, 2987–3015, 2014www.atmos-chem-phys.net/14/2987/2014/doi:10.5194/acp-14-2987-2014© Author(s) 2014. CC Attribution 3.0 License.
Atmospheric Chemistry
and PhysicsO
pen Access
Further evidence of important environmental information content inred-to-green ratios as depicted in paintings by great masters
C. S. Zerefos1,2, P. Tetsis1, A. Kazantzidis3, V. Amiridis 4, S. C. Zerefos5, J. Luterbacher6, K. Eleftheratos7,E. Gerasopoulos2,8, S. Kazadzis8, and A. Papayannis9
1Academy of Athens, Athens, Greece2Navarino Environmental Observatory (N.E.O.), Messinia, Greece3Laboratory of Atmospheric Physics, Physics Department, University of Patras, Greece4Institute of Astronomy, Astrophysics, Space Application and Remote Sensing, National Observatory of Athens, Greece5Hellenic Open University, Patras, Greece6Department of Geography, Climatology, Climate Dynamics and Climate Change, Justus Liebig University of Giessen,Giessen, Germany7Faculty of Geology and Geoenvironment, University of Athens, Greece8Institute of Environmental Research and Sustainable Development, National Observatory of Athens, Greece9National Technical University of Athens, Athens, Greece
Correspondence to:C. S. Zerefos ([email protected])
Received: 11 November 2013 – Published in Atmos. Chem. Phys. Discuss.: 18 December 2013Revised: 21 February 2014 – Accepted: 1 March 2014 – Published: 25 March 2014
Abstract. We examine sunsets painted by famous artists asproxy information for the aerosol optical depth after ma-jor volcanic eruptions. Images derived from precision colourprotocols applied to the paintings were compared to onlineimages, and found that the latter, previously analysed, pro-vide accurate information. Aerosol optical depths (AODs)at 550 nm, corresponding to Northern Hemisphere middlelatitudes, calculated by introducing red-to-green (R / G) ra-tios from a large number of paintings to a radiative transfermodel, were significantly correlated with independent prox-ies from stratospheric AOD and optical extinction data, thedust veil index, and ice core volcanic indices. AODs cal-culated from paintings were grouped into 50-year intervalsfrom 1500 to 2000. The year of each eruption and the 3following years were defined as “volcanic”. The remaining“non-volcanic” years were used to provide additional evi-dence of a multidecadal increase in the atmospheric opti-cal depths during the industrial “revolution”. The increaseof AOD at 550 nm calculated from the paintings grows from0.15 in the middle 19th century to about 0.20 by the end ofthe 20th century. To corroborate our findings, an experimentwas designed in which a master painter/colourist paintedsuccessive sunsets during and after the passage of Saharan
aerosols over the island of Hydra in Greece. Independentsolar radiometric measurements confirmed that the mastercolourist’s R / G ratios which were used to model his AODs,matched the AOD values measured in situ by co-locatedsun photometers during the declining phase of the Saharanaerosol. An independent experiment was performed to un-derstand the difference between R / G ratios calculated froma typical volcanic aerosol and those measured from the min-eral aerosol during the Hydra experiment. It was found thatthe differences in terms of R / G ratios were small, rangingbetween−2.6 % and+1.6 %. Also, when analysing differentparts of cloudless skies of paintings following major volcaniceruptions, any structural differences seen in the paintings hadnot altered the results discussed above. However, a detailedstudy on all possible sources of uncertainties involved (suchas the impact of clouds on R / G ratios) still needs to be stud-ied. Because of the large number of paintings studied, we ten-tatively propose the conclusion that regardless of the school,red-to-green ratios from great masters can provide indepen-dent proxy AODs that correlate with widely accepted proxiesand with independent measurements.
Published by Copernicus Publications on behalf of the European Geosciences Union.

2988 C. S. Zerefos et al.: Further evidence of important environmental information content
1 Introduction
In the paper by Zerefos et al. (2007), the monochromatic ra-tios between red, green and blue colours, in paintings before,during and after large volcanic eruptions were examined. Inthat study, digital images from 554 paintings were down-loaded from the websites of several art galleries and muse-ums. These images were processed to derive ratios betweenthe intensities of monochromatic colours. For the calculationof the R / G ratios only the parts of the sky over the fieldof view of the artist near the horizon avoiding clouds wereanalysed. The average values and the standard deviation ofR / G ratio for each painting were presented in Appendix B ofZerefos et al. (2007). In that study, the mean error value was0.014 due to the variability of R / G ratios within the paint-ings/images. That variability and how it could affect the esti-mated AOD values for different aerosol conditions and solarzenith angles was examined. The uncertainty found was lessthan 0.05 for small optical depths and smaller SZA (70◦).The error increased with increasing AOD and SZA (85◦) andcould be as large as 0.18 for AOD values exceeding 0.5. Thestudy by Zerefos et al. (2007) concluded that regardless of theschool or the style of the painter, the R / G ratios at low solarelevation angles, correlated well to the modelled aerosol op-tical depth (AOD) values following large volcanic eruptions.After its publication we were faced with the dilemma thatthe various digital images available at the above-mentionedwebsites were not necessarily accurate representations of thetrue colour profile reproduction, because they were not cre-ated following a single colour profile protocol and thus, wedecided to revisit the issue.
In this work we provide new evidence that our earlier re-sults, based on R / G ratios to estimate and model AODs inpaintings are robust, a hypothesis which is supported us-ing the following three methods: firstly, by correlating theavailable R / G ratios from the above-mentioned public web-sites with the same ratios from their respective high qualitycolour profile protocols. A colour profile protocol is the pro-tocol (set of instructions) used to accurately translate colourthrough different devices. In our work a colour profile wasabsolutely necessary so that the scanned paintings retainedtheir original colour information when distributed throughdigital means. Also by having the colour profile along withcalibrated scanners it was possible to compare paintings fromother colourists without any uncertainty by differences due tocolour translation. Secondly, by comparing our earlier resultsof AODs based on art, with results and indices from otherproxies (ice cores, pyrheliometric and other data) whichcover the past 500 years (Lamb, 1970, 1977, 1983; Sato etal., 1993; Stothers, 1996, 2001; Robertson et al., 2001; Gaoet al., 2008; Crowley and Unterman, 2013). Thirdly, by per-forming an experiment involving the creation of sunset paint-ings and then measuring the ratios of the art piece with col-located AOD measurements actually recorded in the atmo-sphere during and after the passage of a Saharan dust event.
1
1
2
3
Figure 1 4
5
Fig. 1. R / G ratios derived from painting digital images from website (low resolution) vs. R / G ratios for the same paintings obtainedthrough colour profile protocol (high resolution) at the Tate Gallery.The corresponding linear best fit (green line) and the perfect corre-lation line (dashed red line) are also shown. The values correspondto the 124 landscape paintings listed in Appendix A.
More specifically, we have organized an experimental cam-paign where Panayiotis Tetsis1 (a well-known Greek land-scape painter and colourist) painted the sunsets at the Hydraisland in the Aegean Sea, during and after the passage of aSaharan dust event on the 19 and 20 June 2010. During thecreation of the paintings, we performed simultaneous mea-surements of the evolution of the observed AODs and theactual meteorological conditions were carefully monitored.The results from these three methods are described below.
2 Comparison between high and low quality digitalimages of paintings
As mentioned in the introduction, in an earlier study (Zere-fos et al., 2007) the vast majority of images were analysedfrom museum web sites which were not created followinga rigorous colour profile protocol. The method of paintingsampling and an analysis of the corresponding uncertaintiesis described in the study by Zerefos et al. (2007). Since itwas not possible to obtain high quality images of paintingsfrom all galleries, we focus here on the subset kept at theTate Gallery in the United Kingdom (UK). At this gallery wefound 124 digital images of paintings (with a 300 dpi reso-lution, RGB, 8 bit compressed jpeg format files) which werealso analysed in our earlier work (listed in Appendix A).
1http://www.wikipaintings.org/en/panayiotis-tetsis
Atmos. Chem. Phys., 14, 2987–3015, 2014 www.atmos-chem-phys.net/14/2987/2014/

C. S. Zerefos et al.: Further evidence of important environmental information content 2989
1
1
2
3
Figure 2 4
5
Fig. 2. Distribution of the relative differences (in %) between theR / G ratios derived from the high- and the low-resolution im-ages from 124 landscape sunsets at the Tate Gallery (listed in Ap-pendix A).
Figure 1 shows the results of the R / G values retrievedfrom these high quality images in comparison to the ratios(calculated for the same paintings) from the website im-ages, using the same methodology, as described in Zerefos etal. (2007). As can be seen from Fig. 1, the difference betweenthe R / G values of the lower and higher resolution digital im-ages stays within±4 % for almost all paintings. Very fewexceptions with overestimations correspond to solar zenithangles exceeding 90◦.
This result is clearly seen in Fig. 2 which shows the per-cent distribution of the relative differences between the R / Gratios derived from the high vs. the low resolution 124 im-ages from the Tate Gallery.
Additionally, an independent sample of 186 landscapepaintings of high quality/resolution (10000× 10000 pixelimages), covering the 1500–1900 time period, obtained fromthe National Gallery, London, calibrated using the GretagMacbeth 24-patch colour rendition chart (Saunders et al.,2002; McCamy et al., 1976). None of these paintings hasbeen studied in our earlier study because they did not fulfilthe selection criteria set, that is, for representing sunsets andthe possibility for direct or indirect measurements throughclear shades, to facilitate the estimate of solar zenith angle,pertaining to each painting.
The high-quality/resolution images obtained directly fromthe National Gallery were next compared to their correspond-ing low-quality/resolution images obtained from the web-site (http://www.nationalgallery.org.uk/cgi-bin/WebObjects.
1
1
2
3
Figure 3 4
5
Fig. 3.Results from a completely independent sample of paintings.R / G ratios derived from painting digital images from the web site(low resolution) vs. the same R / G ratios from high resolution digi-tal images at the National Gallery, London. The corresponding lin-ear fit (green line) and they = x line (dashed red line) are alsoshown. The values correspond to 186 landscape paintings, whichwere not used in the early study by Zerefos et al. (2007), as de-scribed in the text.
dll/CollectionPublisher) to test further the results obtainedfrom the Tate Gallery comparisons shown in Figs. 1 and 2.
The retrieved R / G values of these images are shown inFig. 3, from which we see that on the average, the R / Gvalues are overestimated by 0.04± 0.08. This result is inagreement with the results from the Tate Gallery sampleof paintings and a tentative result is that the overestima-tion is larger (up to 0.3) deviating from the linear fit forthe higher R / G values. At any rate, the correlation coeffi-cients are still highly significant (99 % confidence level). Itshould be noted here that all images in this study were pro-cessed with the “nip2” software (e.g.http://www.vips.ecs.soton.ac.uk/index.php?title=Nip2) which comfortably workswith multi-gigabyte images. A special work script has beencreated in order to calculate the average R / G values of thesky from each painting, as derived from the low- and high-quality/resolution images.
3 Other factors that might affect the R / G ratios frompaintings
When trying to estimate a number that would describe thetrue colour at given solar zenith angle during a sunset, thereare several factors that are important sources of uncertainty.Among them are the coatings, the degradation of colour due
www.atmos-chem-phys.net/14/2987/2014/ Atmos. Chem. Phys., 14, 2987–3015, 2014
2990 C. S. Zerefos et al.: Further evidence of important environmental information content
to ageing, the unknown systematic practices used by thepainters, the mood of the painter and the different styles ofschools. However, we have to keep in mind that the earlierand present findings, of a relation between high aerosol con-tent at sunsets, were not based on true colours but confinedonly to the case of the R / G ratios. The different factors af-fecting the true colours mentioned above, being either ran-dom or systematic, may also affect the R / G ratios. Althoughthis may be true for an individual painting, the statistics pre-sented here show that when a large number of paintings bydifferent painters are considered, these uncertainties couldbe much reduced. This is supported by the signal-to-noiseratio analysis of the statistical standard errors discussed inthe introduction and in Zerefos et al. (2007). In addition, wehave searched for a possible impact of structural differences.We provide here examples of paintings with and withoutstructural differences following two major volcanic eruptionsnamely Tambora (1815) and Krakatau (1883). The calculatedR / G ratios in parts of the sky give a similar result in whichthe differences are small, anyhow smaller than the standarderrors we have encountered in this work (see paintings in Ap-pendix C). Therefore, we have to tentatively assume that theimpact of structural differences when studying R / G ratios inparts of the sky of the painting are small. We note here thatwe have made every possible effort to avoid measuring R / Gratios in the presence of clouds. It appears that R / G ratiosas measured in this work somehow remind us of the ratiosof solar irradiance in different wavelengths which are usedin spectrophotometers to measure columnar gases in the at-mosphere. In these spectroradiometers the noise introducedby aerosols and other factors related to scattering and relatedeffects are indeed cancelled out and this is how we obtainedthe long series of total ozone, total sulfur dioxide, and to-tal nitrogen dioxide with remarkably small standard error.We think that the reduction of errors when using R / G ra-tios provides useful information on the overhead aerosol con-tent which correlates well when averaged with other proxiesand/or with real AOD measurements as was the case with theHydra experiment, discussed in paragraph 5.
In our study, a detailed quantification of each source ofuncertainty was not possible except for the effects of qual-ity in digitization of the paintings, structural differences andthe solar zenith angle. Potential sources of uncertainty couldbe the atmospheric/aerosol related dynamics which affect themagnitude of the impact of each volcano in the area understudy (of the painter) as well as the impact of cloudiness onthe depicted R / G. We believe any effects from clouds havebeen avoided by trying to confine our R / G “measurements”to the cloudless parts of the sky in each painting. Follow-ing the above discussion and since our goal in this part ofthe manuscript was focused on the validation of the volcaniceruption effect and not on the actual quantification of the vol-canic aerosol in the painting area, we believe that correlationcoefficients with the mentioned proxies provide evidence thatthis goal has been achieved.
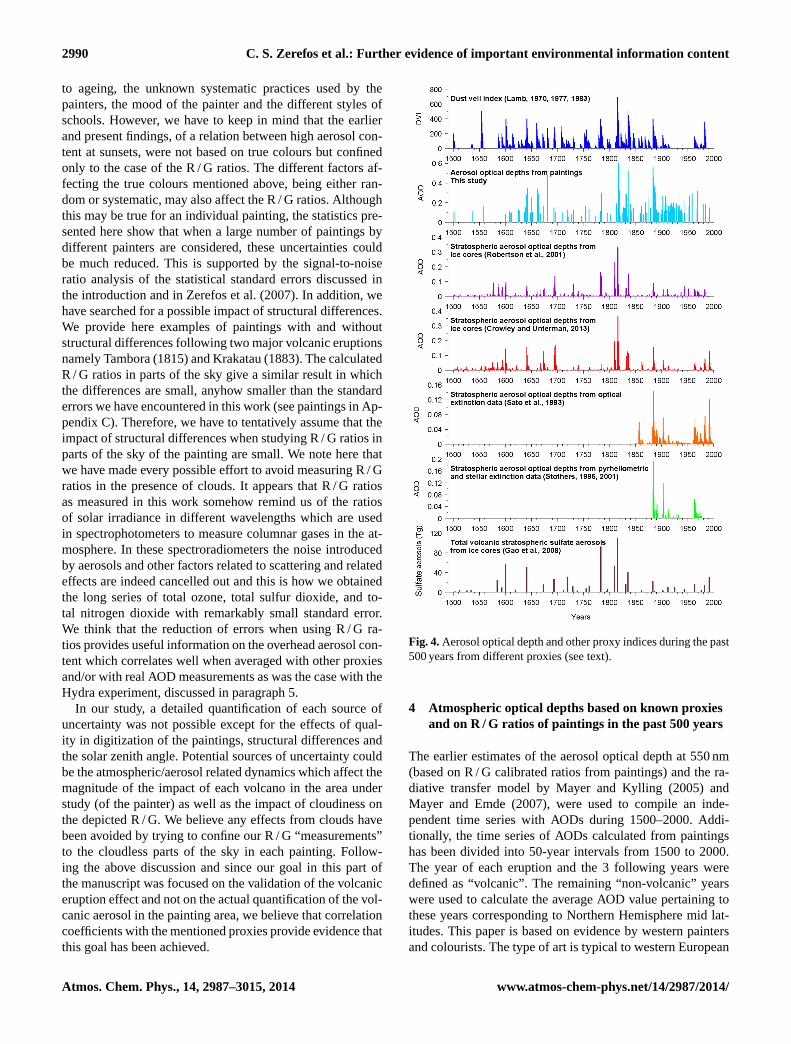
Fig. 4.Aerosol optical depth and other proxy indices during the past500 years from different proxies (see text).
4 Atmospheric optical depths based on known proxiesand on R / G ratios of paintings in the past 500 years
The earlier estimates of the aerosol optical depth at 550 nm(based on R / G calibrated ratios from paintings) and the ra-diative transfer model by Mayer and Kylling (2005) andMayer and Emde (2007), were used to compile an inde-pendent time series with AODs during 1500–2000. Addi-tionally, the time series of AODs calculated from paintingshas been divided into 50-year intervals from 1500 to 2000.The year of each eruption and the 3 following years weredefined as “volcanic”. The remaining “non-volcanic” yearswere used to calculate the average AOD value pertaining tothese years corresponding to Northern Hemisphere mid lat-itudes. This paper is based on evidence by western paintersand colourists. The type of art is typical to western European
Atmos. Chem. Phys., 14, 2987–3015, 2014 www.atmos-chem-phys.net/14/2987/2014/

C. S. Zerefos et al.: Further evidence of important environmental information content 2991
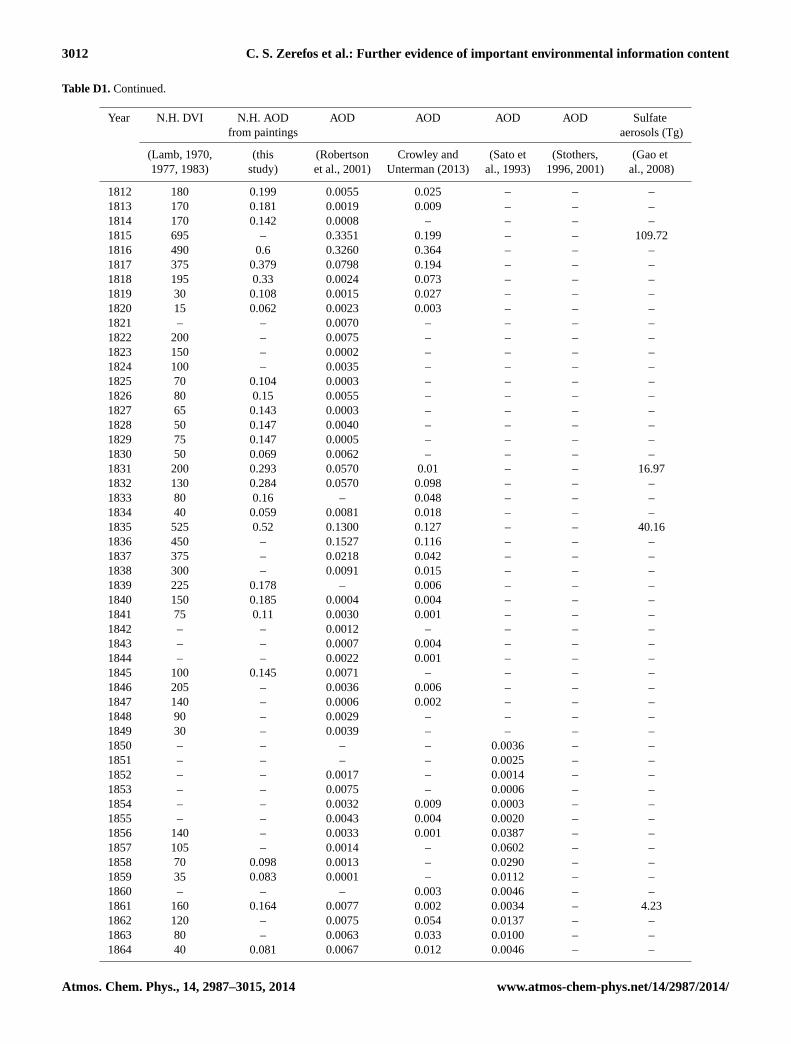
schools so it was inevitable to have more paintings in Euro-pean countries. Nevertheless, the paper focuses on big vol-canic eruptions that have an effect over the entire planet at-mosphere, so the evidence could be noticed in most parts ofthe world. This long-term data set of AODs is compared toother independent proxies as shown in Fig. 4. Detailed infor-mation on those proxies can be found in the primary litera-ture by Lamb (1970, 1977, 1983), Sato et al. (1993), Stothers(1996, 2001), Robertson et al. (2001), Gao et al. (2008) andCrowley and Unterman (2013). Using the data shown in Fig.4, we found that the correlation coefficients between otherproxy indices and the estimated AODs from the R / G ra-tios from paintings are statistically significant (Table 1). Ap-pendix D presents the data used in the calculations shownin Table 1. The reader is also referred to the precision bywhich the extreme AODs between paintings and proxies dur-ing large volcanic eruptions match in most cases. In partic-ular, in 102 cases for which data of both DVI and this studyare simultaneously available, DVI spikes are coinciding withAOD spikes from this study at a percentage of 80 % (9 out of11 cases). As spikes we define the values in both time seriesthat belong in the upper 10 % range of values. In addition,this study revealed two high AOD cases that do not matchwith DVI spikes and it is worth noting that both failing casessucceeded a period of two consecutive years with spikes inboth indices.
Total sulfate is the total measured sulfate concentrationin ppb in the core, as resulted from deposition either fromthe stratosphere (volcanic) or the troposphere (anthropogenicand other biogenic sources), as described by Zielinski etal. (1996) and Robertson et al. (2001). The presented valuesdo not refer directly to the atmospheric concentration, butrather to the deposition on ice which, however, is related toambient concentrations. The values of calculated index of to-tal sulfate from Greenland ice cores (Zielinski, 1995; Zielin-ski et al., 1996) and the longer time series of stratosphericAOD (Robertson et al., 2001) were grouped in 50-year timeintervals with the same procedure described above for AODscalculated from paintings. The three data sets are presentedin Fig. 5. We note here the point raised by Robertson etal. (2001) that the last 150-year increase in total sulfate fromice cores was hypothesized to be the result of troposphericanthropogenic sulfate deposition. The point raised by Robert-son et al. that there have been no major volcanic eruptionsbetween 1900 and 1960, needs some clarification. Indeed inthe list of major volcanic eruptions in the past 500 years (Ap-pendix B after Ammann and Naveau, 2003; Robock, 2000),we can see that based on VEI two eruptions, Santa Maria(1903) and Katmai (1912) have been classified with VEI 6.However, VEI is known to be not a good index of strato-spheric sulfate loading since it measures the explosivity of avolcano and not its stratospheric injection. A good example isthe 1980 St. Helen’s eruption, with a VEI of 5 but no strato-spheric or climatic impact (A. Robock, personal communi-cation, 2014). Stratospheric injection is important to ensure
Fig. 5. Total AOD from paintings and in the stratosphere and totalsulfate in Greenland ice core (in ppb) averaged over 50-year inter-vals for “non-volcanic” years during the period 1500–2000 AD.
its global or hemispheric effects. From the above discussionit can be proposed that compared to the pre-industrial period,the industrial period shows higher painting-derived aerosolcontent, in agreement with what is expected from the litera-ture (e.g. Neftel et al., 1985; Robock and Free, 1995; Robert-son et al., 2001; Forster et al., 2007; Wild, 2012).
5 A live case: the Hydra experiment
To corroborate our findings, a dedicated experimental cam-paign has been organized and implemented in Greece, aim-ing to evaluate the R / G retrieval methodology againstground-truth measurements of the aerosol load in termsof AOD values. The well-known colourist and landscapepainter Panayiotis Tetsis (http://www.wikipaintings.org/en/panayiotis-tetsis) kindly offered to paint in real time a num-ber of sunsets at the island of Hydra. As the great masterwas painting, a suite of ground-based aerosol measurementswere collected, mainly by means of collocated sun photom-etry equipment. The master colourist had no idea of the pas-sage of a Saharan dust cloud over Hydra.
5.1 Experiment organization and instrumentation
The experiment was conducted in Hydra, the painter’s homebase. Hydra is an island located in the Aegean Sea (37.21◦ N,23.28◦ E), 80 km south of Athens, and has a population ofabout 2000 inhabitants. The size of the island satisfies themain requirement for negligible local aerosol emissions (carsare not allowed in the island). Apart from sea spray particles,that constitute the background aerosol component around theisland, the only case of regional pollution influence is un-der northerly winds when the island is within the outflow ofpollution from Athens. In the case of winds from southerlydirections, most of the Athenian sources of aerosols do notreach Hydra island.
For the design of the experiment, paintings and mea-surements during relatively low and high AOD cases wasthe main goal. According to Gerasopoulos et al. (2011),
www.atmos-chem-phys.net/14/2987/2014/ Atmos. Chem. Phys., 14, 2987–3015, 2014

2992 C. S. Zerefos et al.: Further evidence of important environmental information content
Table 1.Correlation coefficients between volcanic aerosol indices and AOD proxies shown in Fig. 4.
1500–2000 DVI AOD AOD AOD AOD AOD Sulfate(this study) (Robertson) (Crowley and (Sato) (Stothers) (Gao)
Unterman)
DVI 1AOD (this study) 0.85[102] 1AOD (Robertson) 0.65[227] 0.58[118] 1AOD (Crowley and Unterman) 0.57[154] 0.54[74] 0.80[239] 1AOD (Sato) 0.65[66] 0.55[61] 0.57[126] 0.91[78] 1AOD (Stothers) (*) [29] (*) [21] 0.83[37] (*) [29] 0.92[38] 1Sulfate (Gao) (*) [23] (*) [14] 0.88[33] (*) [24] (*) [11] (*) [6] 1
Bold: all the above correlations are significant at the 99 % confidence level (t test).∗ missing correlations are those possessing less than 30 years of data.In brackets: number of pairs.
the typical background AOD for the area is 0.12–0.13 cor-responding to long and fast trajectories from westerly tonortherly directions, with origin from high altitudes over theAtlantic. Higher aerosol loading over the area is related to theadvection of dust particles from desert and arid locations ofNorth Africa and is in the AOD range of 0.3–0.4. The mostfrequent season for dust outbreaks over the eastern Mediter-ranean is well documented to be in late spring (e.g. Kalivitiset al., 2007; Gerasopoulos et al., 2011) and early summer (thelatter mostly as elevated dust layers; Papayannis et al., 2008).
For the selection of the experiment days, a regional modeldesigned to simulate and forecast the atmospheric cycle ofmineral dust aerosol over the campaign site was deployed.In particular, forecasts from the BSC-DREAM8b dust re-gional model were used (Nickovic et al., 2001) and the pe-riod finally selected to combine an AOD episode followedby clean conditions and the painter’s availability was 19–20June 2010.
The instrumentation used for the campaign, included amulti-filter rotating shadowband radiometer (MFR-7 YankeeEnv. System Inc., Turner Falls, MA) and a Microtops II sun-photometer (Solar Light Inc., Philadelphia, USA). The MFR-7 installed at Hydra was used to perform measurements ofthe total and diffuse solar irradiance to calculate the directcomponent of the irradiance (Harrison et al., 1994). MFR-7 provided 1 min average measurements and from these theAOD values at 500 nm was extracted. The instrument per-forms valid measurements during daytime and under clearsky conditions. The methodology followed for the extractionof the AOD values from direct solar irradiance is thoroughlydescribed in Gerasopoulos et al. (2003). The calibrated hand-held sunphotometer (Microtops II) was used to provide theAOD at 1020 nm, at 10 min intervals.
5.2 Experimental Results and discussion
As mentioned, the experiment took place in Hydra on 19 and20 June 2010. During the campaign, a Saharan dust eventpassed over Greece (18–21 June 2010). On these two dates
master Tetsis created two successive paintings; before andduring sunset on the 19 and two additional paintings at sun-set on the next day, 20 June 2010. Although the typical sizeand vertical profile of the Saharan aerosols differ from thevolcanic ones, their effect on solar irradiance and R / G closeto sunset was proved to be significant because of their rel-ative high values of AOD (∼ 0.25 at 500 nm). The Tetsisexperiment has initially started as an experiment dedicatedto investigate if AOD’s can be calculated from such a livestudy. During the two day experiment the substantial differ-ence between the aerosol condition of the first and the secondday provided a more adequate data set, supporting the as-sumption that a painter is able to reproduce such an aerosolchange. Quantitatively it has been proven that this assump-tion was correct, as analysed in the following. In the nextparagraph it will be shown that the Saharan dust outbreak ofthe 19 June has been found to affect the R / G ratios of Tetsis’paintings.
The results from the BSC-DREAM8b model simulationsof the space and time evolution of the columnar dust load-ing for the campaign days (19 and 20 June,) are shown inFig. 6, as isopleths of AODs. Additionally, the wind fields at3000 m heights are superimposed, showing clearly a south-western flow affecting the site in both campaign days. Noprecipitation or cloudiness prevailed over Greece during thecampaign period (Fig. 6 – upper panel), also corroborated byMODIS satellite images (not shown here). A massive trans-port of dust from the Saharan desert was observed on the 19June over Greece and western Turkey, while on 20 June thecentre of the dust plume moved to the east and spread and de-clined (Fig. 6 – lower panel). Following the BSC-DREAM8bsimulations, the dust load reached maximum columnar con-centration values of the order of 0.75 g m−2 over the Hydrasite on the 19 June.
The model simulations agree with real-time measure-ments, as shown in Fig. 7 by the time evolution of the ob-served AOD values on site for 19 and 20 June, measured withMFR-7 and Microtops. As stated before, the local pollution
Atmos. Chem. Phys., 14, 2987–3015, 2014 www.atmos-chem-phys.net/14/2987/2014/

C. S. Zerefos et al.: Further evidence of important environmental information content 2993
1
1
2
3
Figure 6 4
5
Fig. 6. Dust optical (AOD) depth at 550 nm and 3000 m wind fields over Greece for the 19 and 20 June 2010, as simulated by theBSC/DREAM model (18:00 UTC). The greater area of Greece is indicated by a red-lined rectangle. The island of Hydra is on the cen-tre of this shape.
at Hydra is considered negligible and under southerly flowsurban pollution from Athens does not reach the island. Themeteorological conditions prevailing during both days (atsunset hours) were similar, namely temperatures between 28and 30◦C (slightly higher on the second day) relative hu-midity between about 45 and 60 %, and calm wind condi-tions (1–2 m s−1). The AOD values observed at Hydra, forthe most part, can be attributed to the presence of the Saha-ran dust aerosol and follow the temporal evolution depictedby the dust simulations shown in Fig. 6, from which we seehigher AOD values on 19 June and lower on the next dayat Hydra. The temporal decay is profound also in the Mi-crotops measurements at 1020 nm, performed at Hydra andshown also in Fig. 7.
Sunphotometric measurements are a trustworthy sourcefor identifying the Saharan dust presence, for which we ex-pect higher AOD values and lower spectral dependences be-tween the multi-wavelength AOD retrievals. This is clearlyseen in the data presented in Fig. 7, where higher AODs for19 June are accompanied by lower spectral dependences be-tween the 500 and 1020 nm channels. Moreover, the respec-tive Ångström exponents were on average 0.4 on the first day,indicative of coarse dust aerosols and in the range 0.7–1.0 onthe second day, representing a mixture of sea salt particleswith low loadings of continental aerosols (see Gerasopouloset al., 2011, for indicative ranges of Ångström exponents inthe area).
Acknowledging the good performance of the BSC-DREAM8b model for the days of our campaign, we presentin Fig. 8 the simulations of the vertical distribution of Sa-haran dust concentrations over the area for 19 and 20 June2010. As can be seen from that Figure, large dust concentra-tions in the lowest one kilometre were observed on the 19 ofJune, while on the next day the dust concentrations declinedsignificantly, in the boundary layer and in the column as well.We focus mainly on the aerosol load in the planetary bound-ary layer since this is expected to impact mostly the painter’sperception during the late afternoon hours. It is evident thatthe dust concentrations within the first kilometre are four (4)times higher on 19 June than those simulated on 20 June.
Figure 9 shows the temporal evolution of the MFR-7 AODvalues at 550 nm during the two days of the campaign to-gether with the R / G ratios from a digital camera on site andfrom the high precision digital images (produced by NationalGallery, London, with the methodology described in para-graph 2) of Tetsis paintings (Fig. 10) for the two sunset cases(high aerosol and low aerosol over Hydra). The paintingswere transported to the National Gallery where the digitalprotocol analysis was done. On 19 June 2010 (Fig. 9, upperpanel), the estimated AOD differences between the paintingsand the closest time digital photos is±0.02. However, a biasof about 30 % is revealed between these and the MFR mea-surements on the day of the Saharan dust event. In all threetypes of measurements/estimations, the variability of AOD
www.atmos-chem-phys.net/14/2987/2014/ Atmos. Chem. Phys., 14, 2987–3015, 2014

2994 C. S. Zerefos et al.: Further evidence of important environmental information content
1
1
2
3
Figure 7. MFR-7 AOD retrievals at 500 nm on 19 and 20 June 2010 at Hydra campaign site. 4
Microtops II AOD retrievals at 1020 nm are superimposed. 5
6
Fig. 7.MFR-7 AOD retrievals at 500 nm on 19 and 20 June 2010 atHydra campaign site. Microtops II AOD retrievals at 1020 nm aresuperimposed.
with time shows a negative trend as we move from 19 Juneto the evening of 20 June. On 20 June 2010, the agreementbetween the digitally derived and the measured AOD valuesis substantially improved: differences as small as 0.02 can befound. The measured decrease of the AOD values is also suc-cessfully represented by the digital estimations. Under eachpainting a digital photograph at the centre of the time intervalit took to paint each painting is displayed for comparison.
Finally, a comparison between the impact of mineralaerosol (Saharan dust) and the impact of a typical volcanicaerosol in terms of RGB is also attempted. The mineralaerosol during the Hydra experiment at 500 nm was mea-sured to vary close to 0.25. Therefore, we have made modelruns with the volcanic aerosol setting the volcanic AOD caseat 500 nm also equal to 0.25. Note here that the mean vol-canic AOD (500 nm) in our paintings is very close to thatnumber and is equal to 0.22. Figure 11 shows the percentdifference in R / G ratios between the ones measured in theHydra Saharan dust aerosol profile and a typical modelledvolcanic aerosol profile as was used previously in this work.In both cases AOD (500 nm) was set to 0.25. The ratios areshown as isopleths in a graph where the position of the sun isfixed at 80◦ solar zenith angle. It was quite surprising to seethat although both the nature, size and the vertical profiles ofthe Saharan and the volcanic aerosols differ, their effect onR / G overhead ratios in the sky induce so small a differenceranging from a minimum of−2.6 % to a maximum+1.6 %,depending on the solar zenith angle and the angle relative tothe position of the sun.
1
1
0 10 20 30 40 50 60 70 80 90 100
0
1
2
3
4
5
6
7
8
9
10
11
12
He
igh
t (k
m)
Dust Concentration (μg / m3)
19 June 2010
20 June 2010
0 10 20 30 40 50 60 70 80 90 1000123456789101112 Height (km) Dust Concentration (μg / m3) 19 June 2010 20 June 2010 2
3
Figure 8 4
5
Fig. 8. Vertical distribution of the Saharan dust concentration load-ing (µg m−3) for the 19 and 20 June 2010, as simulated by theBSC/DREAM model (18:00 UTC).
6 Conclusions
Understanding the atmospheric composition of the past cen-turies is a very difficult task due to scarcity of available mea-surements. Especially for atmospheric components such asaerosols and their variability over the past 500 years, relevantinformation is rare (Thornes and Constable, 1999; Grattan,2006; Zerefos et al., 2007). In this work we have expandedthe idea of Zerefos et al. (2007), which used an alternativeand indirect way of using the Ångström’s law of atmosphericphysics that describes the different effects of aerosols on thedifferent wavelengths (colours) of solar light, together withthe use of an alternative “database of solar light representa-tions”, calculated from paintings by great masters in the pastcenturies.
At first, a series of paintings by master painters (in theperiod of 1500–2000) have been revisited and comparisonsbetween digital images of paintings from lower resolutionvs. high resolution, derived from high precision protocols,showed similar results, as far as the R / G ratios measured atsunsets are concerned. Statistically significant correlation co-efficients were found between the R / G ratio values retrievedfrom low quality/resolution and high quality/resolution dig-ital images at a sample of 124 landscape paintings fromthe Tate Gallery. The earlier estimates of the aerosol opticaldepth at 550 nm (based on R / G calibrated ratios from paint-ings) and the radiative transfer model by Mayer and Kylling(2005) and Mayer and Emde (2007) were used to compile anindependent time series with AODs during 1500–2000. Thecorrelation coefficients between other proxy indices and theestimated AODs from the R / G ratios from paintings are sta-tistically significant. Also the precision by which the extreme
Atmos. Chem. Phys., 14, 2987–3015, 2014 www.atmos-chem-phys.net/14/2987/2014/

C. S. Zerefos et al.: Further evidence of important environmental information content 2995
1
1
2
Figure 9 3
4
Fig. 9. The AOD values from the MFR measurements, the estimations from the digital images and the calculations from R / G ratios of theHydra sunset paintings for 19 June (left panel, higher aerosol content) and on the 20 June 2010 (right panel, lower aerosol content).
1
1
2
Figure 10 3
4
Fig. 10. Upper: digitally compressed paintings by P. Tetsis at theHydra experiment under higher (left panel) and lower (right panel)AOD conditions. Bottom: digital camera photos of the landscape.Under each painting a digital photograph at the centre of the timeinterval it took to paint each painting is displayed for comparison(see text).
AODs between paintings and proxies, during large volcaniceruptions, match in most cases.
The comparison between 50-year averages of the AODs(from R / G paintings) with the total sulfate in ice core andthe stratospheric AOD, from which the year of known largevolcanic eruptions and the three years that followed wereexcluded, shows that compared to the pre-industrial period,the industrial period had higher aerosol content, as it is wellknown and expected from independent data sets in the litera-ture (e.g. Neftel et al., 1985; Robock and Free, 1995; Robert-son et al., 2001; Forster et al., 2007). Based on the informa-tion retrieved from the paintings studied, we estimated this
increase to range from 0.15 (middle 19th century) to about0.20 (by the end of the 20th century).
Finally, to corroborate our findings, an experiment was de-signed in which a master painter/colourist painted successivesunsets during the passage of a Saharan dust outbreak overour experimental site (island of Hydra, Greece) on 19 and 20June 2010. The master painter did not know anything aboutthe passage of a Saharan dust event. Our independent sun-photometric measurements at Hydra confirmed that the cal-culated AOD values from R / G ratios measured in the mastercolourist paintings, matched quite well to the AOD valuesmeasured in situ as well as with measurements from a digitalcamera. It should be noted here that all four watercolours byPanayiotis Tetsis were digitized using the same proceduresand standards applied to all works of art photographed by thePhotographic Department of the National Gallery, London.These findings point to the conclusion that the experimentprovides a new presentation of how a painter, a digital cam-era and scientific instruments capture changes in R / G ratiosat high and low aerosol overhead cases.
The new information in the paper can be summarized asfollows:
The comparison of high precision with low precisioncolour protocol images at independent samples of paint-ings from the Tate and the National Galleries in Londonstrengthen the tentative results proposed in an earlier paperby Zerefos et al. (2007).
AODs from a multi-hundred sample of paintings show sta-tistically significant correlations with independent proxies.
Structural differences in paintings do not seem to alter theabove results. The signal-to-noise ratios following volcaniceruptions are statistically significant.
When averaged in 50-year intervals, AODs from paint-ings in non-volcanic years agree with completely indepen-dent data sets with the observed increases of the industrialaerosol in the past 150 years.
R / G ratios calculated from different natural profiles suchas from volcanic aerosols and Saharan mineral aerosols show
www.atmos-chem-phys.net/14/2987/2014/ Atmos. Chem. Phys., 14, 2987–3015, 2014

2996 C. S. Zerefos et al.: Further evidence of important environmental information content
1
1
2
3
Figure 11 4
5
Fig. 11.Percent difference in R / G ratios between the measured at Hydra Sahara dust mineral aerosol profile and a typical modelled volcanicaerosol profile. In both cases AOD (500 nm) was set to 0.25.
very small differences. This explains how the experimentperformed with an internationally known master colourist ar-rived at similar results with an increase in R / G ratios duringthe passage of a Saharan dust event.
Regardless of the school, red-to-green ratios from greatmasters can provide independent proxy AODs that correlatewith widely accepted proxies and with independent measure-ments.
The main conclusion of the paper is that nature speaks tothe hearts and souls of the artists. When colouring sunsetsthe R / G ratios perceived by the brain contain important en-vironmental information. It remains to an interdisciplinarycommunity to study further the evidence presented in this re-search.
Acknowledgements.The LibRadtran team (www.libradtran.org)is acknowledged for providing the model algorithm. The NationalGallery is acknowledged for providing 186 landscape paintingsof high quality analysis at no charge. BSC-DREAM8b Saharandust simulations were kindly provided by the Barcelona Super-computing Centre. The set of high resolution 124 paintings fromTate were purchased at cost and the four watercolour paintings byPanayiotis Tetsis were photographed using the same proceduresand standards applied to all works of art photographed by the Pho-tographic Department of the National Gallery, London. We greatlyacknowledge the support provided by the Mariolopoulos-KanaginisFoundation for the Environmental Sciences and the EuropeanUnion’s 7th Framework Programme (FP7/2007-2013) under grantagreement no. 218793 (project title: Monitoring Atmospheric
Composition and Climate). The authors would like to thank AlanRobock and two anonymous reviewers for their valuable comments.
Edited by: N. Mihalopoulos
References
Ammann, C. and Naveau, P.: Statistical analysis of tropical explo-sive volcanism occurences over the last 6 centuries, Geophy. Res.Lett., 30, 1210, doi:10.1029/2002GL016388, 2003.
Crowley, T. J. and Unterman, M. B.: Technical details concern-ing development of a 1200 yr proxy index for global volcanism,Earth Syst. Sci. Data, 5, 187–197, doi:10.5194/essd-5-187-2013,2013.
Forster, P., Ramaswamy, V., Artaxo, P., Berntsen, T., Betts, R., Fa-hey, D. W., Haywood, J., Lean, J., Lowe, D. C., Myhre, G.,Nganga, J., Prinn, R., Raga, G., Schulz M., and Van Dorland,R.: Changes in Atmospheric Constituents and in Radiative Forc-ing, in: Climate Change 2007: The Physical Science Basis, Con-tribution of Working Group I to the Fourth Assessment, Reportof the Intergovernmental Panel on Climate Change, edited by:Solomon, S., Qin, D., Manning, M., Chen, Z., Marquis, M., Av-eryt, K. B., Tignor, M., and Miller, H. L., Cambridge UniversityPress, Cambridge, UK, New York, NY, USA, 996 pp., 2007.
Gao, C., Robock, A., and Ammann, C.: Volcanic forcing of cli-mate over the past 1500 years: An improved ice-core-basedindex for climate models, J. Geophys. Res., 113, D23111,doi:10.1029/2008JD010239, 2008.
Gerasopoulos, E., Andreae, M. O., Zerefos, C. S., Andreae,T. W., Balis, D., Formenti, P., Merlet, P., Amiridis, V., and
Atmos. Chem. Phys., 14, 2987–3015, 2014 www.atmos-chem-phys.net/14/2987/2014/

C. S. Zerefos et al.: Further evidence of important environmental information content 2997
Papastefanou, C.: Climatological aspects of aerosol optical prop-erties in Northern Greece, Atmos. Chem. Phys., 3, 2025–2041,doi:10.5194/acp-3-2025-2003, 2003.
Gerasopoulos, E., Amiridis, V., Kazadzis, S., Kokkalis, P., Eleft-heratos, K., Andreae, M. O., Andreae, T. W., El-Askary, H.,and Zerefos, C. S.: Three-year ground based measurements ofaerosol optical depth over the Eastern Mediterranean: the urbanenvironment of Athens, Atmos. Chem. Phys., 11, 2145–2159,doi:10.5194/acp-11-2145-2011, 2011.
Grattan, J.: Aspects of Armageddon: an exploration of the role ofvolcanic eruptions in human history and civilization, Quartern.Int., 151, 10–18, 2006.
Harrison, L., Michalsky, J., and Berndt, J.: Automated multifilterrotating shadow-band radiometer: an instrument for optical depthand radiation measurements, Appl. Optics, 33, 5118–5125, 1994.
Kalivitis, N., Gerasopoulos, E., Vrekoussis, M., Kouvarakis, G.,Kubilay, N., Hatzianastassiou, N., Vardavas, I., and Mihalopou-los, N.: Dust transport over the Eastern Mediterranean fromTOMS, AERONET and surface measurements, J. Geophys. Res.,112, D03202, doi:10.1029/2006JD007510, 2007.
Lamb, H. H.: Volcanic dust in the atmosphere, with a chronologyand assessment of its meteorological significance, Philos. T. R.Soc. Lond., 266, 425–533, 1970.
Lamb, H. H.: Supplementary volcanic dust veil assessments, Cli-mate Monitor, 6, 57–67, 1977.
Lamb, H. H.: Uptake of the chronology of assessments of the vol-canic dust veil index, Climate Monitor., 12, 79–90, 1983.
Mayer, B. and Emde, C.: Comment on “Glory phenomenon informsof presence and phase state of liquid water in cold clouds” byNevzorov, A. N., Atmos. Res., 84, 410–419, 2007.
Mayer, B. and Kylling, A.: Technical note: The libRadtran soft-ware package for radiative transfer calculations – descriptionand examples of use, Atmos. Chem. Phys., 5, 1855–1877,doi:10.5194/acp-5-1855-2005, 2005.
McCamy, C. S., Marcus, H., and Davidson, J. G.: A color-renditionchart, J. Appl. Photogr. Eng., 2, 95–99, 1976.
Neftel, A., Beer, J., Oeschger, H., Zurcher, F., and Finkel, R. C.:Sulphate and nitrate concentrations in snow from South Green-land 1895–1978, Nature, 314, 611–613, doi:10.1038/314611a0,1985.
Nickovic, S., Kallos, G., Papadopoulos, A., and Kakaliagou, O.: Amodel for prediction of desert dust cycle in the atmosphere, J.Geophys. Res., 106, 18113–18129, doi:10.1029/2000JD900794,2001.
Papayannis, A., Amiridis, V., Mona, L., Tsaknakis, G., Balis, D.,Bösenberg, J., Chaikovski, A., De Tomasi, F., Grigorov, I., Mat-tis, I., Mitev, V., Müller, D., Nickovic, S., Perez, C., Pietruczuk,A., Pisani, G., Ravetta, F., Rizi, V., Sicard, M., Trickl, T., Wieg-ner, M., Gerding, M., Mamouri, R. E., D’Amico, G., and Pap-palardo, G.: Systematic lidar observations of Saharan dust overEurope in the frame of EARLINET (2000–2002), J. Geophys.Res., 113, D10204, doi:10.1029/2007JD009028, 2008.
Robertson, A., Overpeck, J., Rind, D., Mosley-Thompson, E.,Zielinski, G., Lean, J., Koch, D., Penner, J., Tegen, I., and Healy,R.: Hypothesized climate forcing time series for the last 500years, J. Geophys. Res., 106, 14783–14803, 2001.
Robock, A.: Volcanic eruptions and climate, Rev. Geophys., 38,191–219, 2000.
Robock, A. and Free, M. P.: Ice cores as an index of global vol-canism from 1850 to the present, J. Geophys. Res., 100, 11549–11567, 1995.
Sato, M., Hansen, J. E., McCormick, M. P., and Pollack, J. B.:Stratospheric aerosol optical depths 1850–1990, J. Geophys.Res., 98, 22987–22994, 1993.
Saunders, D., Cupitt, J., White, C., and Holt, S.: The MARC II Cam-era and the scanning initiative at the national gallery, NationalGallery Technical Bulletin, 23, 76–82, 2002.
Stothers, R. B.: Major optical depth perturbations to the stratospherefrom volcanic eruptions: pyrheliometric period 1881–1960, J.Geophys. Res., 101, 3901–3920, 1996.
Stothers, R. B.: Major optical depth perturbations to the stratospherefrom volcanic eruptions: Stellar extinction period 1961–1978, J.Geophys. Res., 106, 2993–3003, 2001.
Thornes, J. E. and Constable, J.: John Constable’s skies: A Fusionof Art and Science, Ed. Continuum, 288 pp., 1999.
Wild, M.: Enlightening Global Dimming and Brightening, B. Am.Meteorol. Soc., 93, 27–37, 2012.
Zerefos, C. S., Gerogiannis, V. T., Balis, D., Zerefos, S. C., andKazantzidis, A.: Atmospheric effects of volcanic eruptions asseen by famous artists and depicted in their paintings, At-mos. Chem. Phys., 7, 4027–4042, doi:10.5194/acp-7-4027-2007,2007.
Zielinski, G. A.: Stratospheric loading and optical depth estimatesof explosive volcanism over the last 2100 years derived from theGreenland Ice Sheet Project 2 ice core, J. Geophys. Res., 100,20937–20955, 1995.
Zielinski, G. A., Mayewski, P. A., Meeker, L. D., Whitlow, S., andTwickler, M. S.: A 110,000-yr record of explosive volcanismfrom the GISP2 (Greenland) ice core, Quaternary Res., 45, 109–188, 1996.
www.atmos-chem-phys.net/14/2987/2014/ Atmos. Chem. Phys., 14, 2987–3015, 2014

2998 C. S. Zerefos et al.: Further evidence of important environmental information content
Appendix A
Table A1. Paintings from the Tate Gallery analysed in this work.
Image ID Artist name Title
1. D00670 Turner, Joseph Mallord William Windmill on Hill: Valley and Winding River in Middle Distance; Sunset Effect2. D02474 Turner, Joseph Mallord William Helmsley Sketchbook [Finberg LIII], Distant View of Whitby from the Moors: A
Windmill against a3. D04118 Turner, Joseph Mallord William Studies for Pictures Sketchbook [Finberg LXIX], Study for the Composition of
“Dolbadern Castle”4. D04119 Turner, Joseph Mallord William Studies for Pictures Sketchbook [Finberg LXIX], Study for the Composition of
“Dolbadern Castle”,5. D04127 Turner, Joseph Mallord William Studies for Pictures Sketchbook [Finberg LXIX], Snowy Hills beside a Lake:
Evening Sky6. D04128 Turner, Joseph Mallord William Studies for Pictures Sketchbook [Finberg LXIX], Study for the Composition of
“Dolbadern Castle”,7. D08176 Turner, Joseph Mallord William Moonlight at Sea (The Needles)8. D12502 Turner, Joseph Mallord William Skies Sketchbook [Finberg CLVIII], Red Sky and Crescent Moon9. D16131 Turner, Joseph Mallord William Naples: Rome. C. Studies Sketchbook [Finberg CLXXXVII], The Roman Cam-
pagna from Monte Testaccio10. D16482 Turner, Joseph Mallord William Small Roman Colour Studies Sketchbook [Finberg CXC], Moonlight over the Cam-
pagna11. D20254 Turner, Joseph Mallord William Mayen in the Eifel12. D22663 Turner, Joseph Mallord William Evening: A Windmill at Sunset13. D22664 Turner, Joseph Mallord William Sunset across the Park from the Terrace of Petworth House14. D22666 Turner, Joseph Mallord William Evening: A Boat on a River with a Distant Tower15. D22674 Turner, Joseph Mallord William Sunset over the Ridge Seen from the North Pond in Petworth Park16. D22716 Turner, Joseph Mallord William Setting Sun17. D22719 Turner, Joseph Mallord William The Setting Sun over Petworth Park18. D22767 Turner, Joseph Mallord William Petworth Park: Sunset (“Glade and Greensward”)19. D22768 Turner, Joseph Mallord William Sunset: A Boat on a River20. D24635 Turner, Joseph Mallord William A Distant View of the Upperton Monument, from the Lake in Petworth Park21. D24640 Turner, Joseph Mallord William Harbour Scene at Sunrise, possibly Margate22. D24666 Turner, Joseph Mallord William The Scarlet Sunset23. D24698 Turner, Joseph Mallord William Turner’s Annual Tour: The Seine 1834 Watercolours, Le Havre: Sunset in the Port24. D24757 Turner, Joseph Mallord William A View of Metz from the North25. D25132 Turner, Joseph Mallord William Sunlight over Water26. D25141 Turner, Joseph Mallord William Cilgerran Castle, Pembrokeshire27. D25144 Turner, Joseph Mallord William The River: Sunset28. D25201 Turner, Joseph Mallord William Looking out to Sea29. D25233 Turner, Joseph Mallord William River with Trees: Sunset30. D25246 Turner, Joseph Mallord William Castle Upnor, Kent: Preparatory Study31. D25249 Turner, Joseph Mallord William River: Sunset32. D25253 Turner, Joseph Mallord William Studies of Skies33. D25258 Turner, Joseph Mallord William Evening34. D25263 Turner, Joseph Mallord William The Line of Cliffs35. D25300 Turner, Joseph Mallord William The Castle by the Sea36. D25303 Turner, Joseph Mallord William River Scene: Sunset37. D25315 Turner, Joseph Mallord William Sunset38. D25329 Turner, Joseph Mallord William Sunset39. D25330 Turner, Joseph Mallord William Fiery Sunset40. D25331 Turner, Joseph Mallord William Crimson Sunset41. D25332 Turner, Joseph Mallord William Sunset over Water42. D25336 Turner, Joseph Mallord William A Ruin: Sunset43. D25338 Turner, Joseph Mallord William Twilight over the Waters44. D25361 Turner, Joseph Mallord William A Stormy Sunset45. D25368 Turner, Joseph Mallord William Sequels to the Liber Studiorum (“Little Liber”) Watercolours, The Distant Tower:
Evening46. D25403 Turner, Joseph Mallord William The Yellow Sky47. D25412 Turner, Joseph Mallord William A Pink Sky above a Grey Sea48. D25430 Turner, Joseph Mallord William Sequels to the Liber Studiorum (“Little Liber”) Watercolours, Gloucester Cathedral49. D25433 Turner, Joseph Mallord William Running Wave in a Cross-Tide: Evening
Atmos. Chem. Phys., 14, 2987–3015, 2014 www.atmos-chem-phys.net/14/2987/2014/

C. S. Zerefos et al.: Further evidence of important environmental information content 2999
Table A1. Continued.
Image ID Artist Name Title
50. D25443 Turner, Joseph Mallord William Barnstaple Bridge at Sunset51. D25446 Turner, Joseph Mallord William Study for “The Golden Bough”52. D25450 Turner, Joseph Mallord William Sunset53. D25474 Turner, Joseph Mallord William Rochester Castle and Bridge54. D25507 Turner, Joseph Mallord William Sunset over the Sea55. D25514 Turner, Joseph Mallord William St Michael’s Mount from Marazion, Cornwall56. D27601 Turner, Joseph Mallord William Sunset over a City57. D27689 Turner, Joseph Mallord William Rogers’s Poems 1835 Watercolours, Tornaro (Rogers’s “Poems”)58. D27716 Turner, Joseph Mallord William Rogers’s Poems 1835 Watercolours, Datur Hora Quieti59. D28994 Turner, Joseph Mallord William Sunset over Lake or River60. D29026 Turner, Joseph Mallord William Sunset61. D32130 Turner, Joseph Mallord William Roll Sketchbook of Venice [Finberg CCCXV], Venice: Sunset over Santa Maria
della Salute and the62. D32152 Turner, Joseph Mallord William Venice: Sunset63. D32185 Turner, Joseph Mallord William View of Town, with Yellow Sky64. D32191 Turner, Joseph Mallord William Sunset on the Sea65. D32203 Turner, Joseph Mallord William Orange Sunset66. D33479 Turner, Joseph Mallord William Fribourg, Lausanne and Geneva Sketchbook [Finberg CCCXXXII], Geneva, the
Jura Mountains and67. D33484 Turner, Joseph Mallord William Fribourg, Lausanne and Geneva Sketchbook [Finberg CCCXXXII], Sunset on a
Lake68. D33501 Turner, Joseph Mallord William Fribourg, Lausanne and Geneva Sketchbook [Finberg CCCXXXII], Sunset, Lake
of Lucerne69. D33504 Turner, Joseph Mallord William Fribourg, Lausanne and Geneva Sketchbook [Finberg CCCXXXII], Mont Pilatus:
Sunset70. D35260 Turner, Joseph Mallord William The Whalers Sketchbook [Finberg CCCLIII], Sea Monsters and Vessels at Sunset71. D35378 Turner, Joseph Mallord William Ideas of Folkestone Sketchbook [Finberg CCCLVI], Sunset, over the Water72. D35392 Turner, Joseph Mallord William Ambleteuse and Wimereux Sketchbook [Finberg CCCLVII], Yellow Sun over
Water73. D35394 Turner, Joseph Mallord William Ambleteuse and Wimereux Sketchbook [Finberg CCCLVII], Sunset at Ambleteuse74. D35927 Turner, Joseph Mallord William A Lurid Sunset75. D35943 Turner, Joseph Mallord William Sunset over Yellow-Green Waters76. D35950 Turner, Joseph Mallord William Yellow Sunset77. D35973 Turner, Joseph Mallord William The Bass Rock78. D35986 Turner, Joseph Mallord William Sunset: Study for “Flint Castle, on the Welsh Coast”79. D36060 Turner, Joseph Mallord William The Rigi80. D36078 Turner, Joseph Mallord William Sunset. (Sunrise)81. D36123 Turner, Joseph Mallord William The Red Rigi: Sample Study82. D36149 Turner, Joseph Mallord William Sunset, with Smoke from a Distant Steamer83. D36153 Turner, Joseph Mallord William Distant View of Regensburg from the Dreifaltigkeitsberg84. D36159 Turner, Joseph Mallord William Sunset: A Fish Market on the Beach85. D36174 Turner, Joseph Mallord William The Walhalla, near Regensburg on the Danube86. D36211 Turner, Joseph Mallord William Lausanne: Sunset87. D36242 Turner, Joseph Mallord William Geneva88. D36293 Turner, Joseph Mallord William Yellow and Blue Sunset over Water89. D36679 Turner, Joseph Mallord William Sunset Seen from a Beach with Breakwater90. N00304 Wilson, Richard Lake Avernus and the Island of Capri91. N00309 Gainsborough, Thomas Boy Driving Cows near a Pool92. N00342 Callcott, Sir Augustus Wall Dutch Landscape with Cattle93. N00499 Turner, Joseph Mallord William The Decline of the Carthaginian Empire ...94. N00519 Turner, Joseph Mallord William Regulus95. N00559 Turner, Joseph Mallord William Petworth Park: Tillington Church in the Distance96. N00560 Turner, Joseph Mallord William Chichester Canal97. N00886 Reynolds, Sir Joshua Admiral Viscount Keppel98. N00926 Crome, John A Windmill near Norwich99. N01290 Wilson, Richard Landscape with Bathers, Cattle and Ruin100. N01656 McLachlan, Thomas Hope Evening Quiet
www.atmos-chem-phys.net/14/2987/2014/ Atmos. Chem. Phys., 14, 2987–3015, 2014

3000 C. S. Zerefos et al.: Further evidence of important environmental information content
Table A1. Continued.
Image ID Artist name Title
101. N01876 Turner, Joseph Mallord William Sunset102. N01902 Brett, John The British Channel Seen from the Dorsetshire Cliffs103. N02064 Turner, Joseph Mallord William The Chain Pier, Brighton104. N02065 Turner, Joseph Mallord William A Ship Aground105. N02066 Turner, Joseph Mallord William The Arch of Constantine, Rome106. N02067 Turner, Joseph Mallord William Tivoli: Tobias and the Angel107. N02645 Crome, John Moonrise on the Yare (?)108. N02647 Wilson, Richard River View, on the Arno (?)109. N02701 Turner, Joseph Mallord William The Lake, Petworth, Sunset110. N02990 Turner, Joseph Mallord William Ariccia (?): Sunset111. N03026 Turner, Joseph Mallord William Classical Harbour Scene112. N03382 Turner, Joseph Mallord William Claudian Harbour Scene113. N04665 Turner, Joseph Mallord William Sun Setting over a Lake114. N04937 Ward, James L’Amour de Cheval115. N05361 Crome, John Yarmouth Harbour – Evening116. N05486 Turner, Joseph Mallord William Sunset From the Top of the Rigi117. N05530 Turner, Joseph Mallord William Seacoast with Ruin, probably the Bay of Baiae118. N05853 Boitard, Louis Philippe An Exact Representation of the Game of Cricket119. T00921 De Loutherbourg, Philip James Travellers Attacked by Banditti120. T03163 Garstin, Norman Haycocks and Sun121. T03543 Anderton, Henry Mountain Landscape with Dancing Shepherd122. T03883 Turner, Joseph Mallord William The Lake, Petworth: Sunset, Fighting Bucks123. T03884 Turner, Joseph Mallord William The Lake, Petworth: Sunset, a Stag Drinking124. T03885 Turner, Joseph Mallord William Chichester Canal
Atmos. Chem. Phys., 14, 2987–3015, 2014 www.atmos-chem-phys.net/14/2987/2014/

C. S. Zerefos et al.: Further evidence of important environmental information content 3001
Appendix B
Table B1.Volcanic eruptions in 1500–2000 with volcanic explosivity index (VEI) of 4 or more.
No. Year Volcano VEI* Reference
1 1522 ? Arenal, Costa Rica (C-14: 1525) 4 [1]2 1568 ? Billy Mitchell (C-14: 1580) 6 [1]3 1586 Kelut, Java 5? [1]4 1595 Raung, Java 5? [1]5 Ruiz, Colombia 4 [1]6 1600 Huynaputina, Peru 6? [1]7 ?*1605 Momotombo, Nicaragua 4 [1]8 1622 ? Colima, Mexico 4 [1]9 C-14: 1630 Raoul Island, Kermadec 4 [1]10 1641 Parker, Indonesia 6 [1]11 1660 ? Teon, Banda 4? [1]12 ? Guagua Pichinchia, Ecuador 4 [1]13 1665 ? Long Island, New Guinea (C-14: 1660) 6? [1]14 1674 Gamkonora, Indonesia 5? [1]15 1680 Tongkoko, Sulawesi 5? [1]16 1693 Serua, Banda 4? [1]17 ?1721 Raoul Island, Kermadec (C-14: 1720) 4 [1]18 Cerro Bravo, Colombia (T) 4 [1]19 ?1737 Fuego, Guatemala 4? [1]20 1744 Cotopaxi, Equador 4 [1]21 1760 Michoacan, Mexico 4 [1]22 Makian, Indonesia 4? [1]23 1783 Lakagigar, Iceland 4 [2]24 1794 ? San Martin, Mexico 4? [1]25 ?1808 Unknown ? [1]26 1813 Soufriere St. Vincent, W-Indies 4 [1]27 Awu, Indonesia 4? [1]28 Suwanose-Jima, Japan 4 [1]29 1815 Tambora, Indonesia 7 [1, 2]30 1823 Galunggung, Java 5 [1]31 1831 Babuyan Claro, Philippines 4? [1]32 1835 Coseguina, Nicaragua 5 [1, 2]33 1861 Makian, Indonesia 4? [1]34 1875 Askja, Iceland 5 [2]35 1880 Fuego, Guatemala 4? [1]36 1883 Krakatau, Indonesia 6 [1, 2]37 1886 Tarawera, New Zealand 5 [2]38 1890 Colima, Mexico 4 [1]39 1902 Pelee, W-Indies 4 [1]40 Soufriere St. Vincent, W-Indies 4 [1]41 1903 Santa Maria, Guatemala 6 [1, 2]42 1907 Ksudach, Kamchatka, Russia 5 [2]43 ?1911 Lolobau, SW-Pacific 4 [1]44 Taal, Philippines 4 [1]45 1912 Katmai, Alaska 6 [2]46 1953 Ambrym, Vanuatu 4+ [1]47 Lamington, New Guinea 4 [1]48 Bagana, SW-Pacific 4 [1]49 1963 Agung, Indonesia 4 [1, 2]50 1968 Fernandina, Galapagos 4 [1]51 1974 Fuego, Guatemala 4 [1]52 1980 St. Helens, United States 5 [2]53 1982 El Chichon, Mexico 5 [1, 2]54 1991 Pinatubo, Philippines 6 [1, 2]
[1]: after Ammann and Naveau (2003) atftp://ftp.ncdc.noaa.gov/pub/data/paleo/climate_forcing/volcanic_aerosols/ammann2003_eruptions.pdf.[2]: Robock (2000)* It should be mentioned that VEI is not a good index of stratospheric sulfate loading, since it measures theexplosivity of an eruption and not its stratospheric injection.
www.atmos-chem-phys.net/14/2987/2014/ Atmos. Chem. Phys., 14, 2987–3015, 2014

3002 C. S. Zerefos et al.: Further evidence of important environmental information content
Appendix C
R / G ratios with and without structural differences after Tambora (1815) and Krakatau (1883)
1
1
2
3
4
Figure C1 5
6
Fig. C1.Caspar David Friedrich, Griefswald in the Moonlight, 1817. Corresponding R / G ratios were averaged inside each box.
Atmos. Chem. Phys., 14, 2987–3015, 2014 www.atmos-chem-phys.net/14/2987/2014/

C. S. Zerefos et al.: Further evidence of important environmental information content 3003
1
1
2
3
Figure C2 4
5
Fig. C2.Karl Friedrich Schinkel, The Banks of the Spree near Stralau, 1817. Corresponding R / G ratios were averaged inside each box.
1
1
2
3
Figure C3 4
5
Fig. C3.Caspar David Friedrich, Woman in front of the Setting Sun, 1818. Corresponding R / G ratios were averaged inside each box.
www.atmos-chem-phys.net/14/2987/2014/ Atmos. Chem. Phys., 14, 2987–3015, 2014

3004 C. S. Zerefos et al.: Further evidence of important environmental information content
1
1
2
3
Figure C4 4
5
Fig. C4.Joseph Mallord William Turner, Red sky and crescent moon, c. 1818. Corresponding R / G ratios were averaged inside the box.
1
1
2
3
Figure C5 4
5
Fig. C5.Edgar Degas, Landscape on the Orne, c. 1884. Corresponding R / G ratios were averaged inside each box.
Atmos. Chem. Phys., 14, 2987–3015, 2014 www.atmos-chem-phys.net/14/2987/2014/

C. S. Zerefos et al.: Further evidence of important environmental information content 3005
1
1
2
3
Figure C6 4
5
6
Fig. C6.Edgar Degas, Race Horses, 1885. Corresponding R / G ratios were averaged inside the box.
www.atmos-chem-phys.net/14/2987/2014/ Atmos. Chem. Phys., 14, 2987–3015, 2014

3006 C. S. Zerefos et al.: Further evidence of important environmental information content
Appendix D
Table D1.Volcanic aerosol indices and AOD proxies shown in Fig. 4.
Year N.H. DVI N.H. AOD AOD AOD AOD AOD Sulfatefrom paintings aerosols (Tg)
(Lamb, 1970, (this (Robertson Crowley and (Sato et (Stothers, (Gao et1977, 1983) study) et al., 2001) Unterman (2013) al., 1993) 1996, 2001) al., 2008)
1500 200 – 0.0010 – – – –1501 150 0.103 0.0117 – – – –1502 100 – 0.0110 – – – –1503 50 0.12 0.0110 0.01 – – 1.721504 – – 0.0002 0.003 – – –1505 – – 0.0076 0.008 – – –1506 – – – 0.008 – – –1507 – – – 0.002 – – –1508 – – – 0.021 – – –1509 – – 0.0055 0.012 – – –1510 – – 0.0022 0.003 – – –1511 – – 0.0076 0.001 – – –1512 – – – – – – 4.241513 – – 0.0112 – – – –1514 – – 0.0008 – – – –1515 – – 0.0037 0.016 – – –1516 – – 0.0000 0.005 – – –1517 – – 0.0010 0.001 – – –1518 – – 0.0007 – – – –1519 – – 0.0007 – – – –1520 – – – 0.004 – – –1521 – – 0.0039 0.008 – – –1522 – – 0.0013 0.002 – – –1523 – – 0.0031 0.004 – – –1524 – – 0.0035 0.008 – – –1525 – – 0.0023 0.009 – – –1526 – – 0.0010 0.025 – – 3.541527 – – 0.0079 0.006 – – –1528 – – – 0.003 – – –1529 – – 0.0068 – – – –1530 – – 0.0026 0.003 – – –1531 – – 0.0025 0.001 – – –1532 – – 0.0007 – – – –1533 – – 0.0041 0.002 – – –1534 – – 0.0002 – – – 3.861535 50 – – – – – –1536 50 – 0.0009 0.007 – – –1537 50 – 0.0052 0.014 – – –1538 – – 0.0045 0.003 – – –1539 – – 0.0037 0.001 – – –1540 – – 0.0095 – – – –1541 – – 0.0066 – – – –1542 – – 0.0029 0.011 – – –1543 – – 0.0087 0.004 – – –1544 – – 0.0021 0.001 – – –1545 – – – – – – –1546 – – 0.0023 – – – –1547 – – – – – – –
Atmos. Chem. Phys., 14, 2987–3015, 2014 www.atmos-chem-phys.net/14/2987/2014/

C. S. Zerefos et al.: Further evidence of important environmental information content 3007
Table D1.Continued.
Year N.H. DVI N.H. AOD AOD AOD AOD AOD Sulfatefrom paintings aerosols (Tg)
(Lamb, 1970, (this (Robertson Crowley and (Sato et (Stothers, (Gao et1977, 1983) study) et al., 2001) Unterman (2013) al., 1993) 1996, 2001) al., 2008)
1548 – – – – – – –1549 – – 0.0020 – – – –1550 – – 0.0086 – – – –1551 – – 0.0016 – – – –1552 – – 0.0030 – – – –1553 100 – 0.0018 0.012 – – –1554 500 – 0.0020 0.028 – – –1555 350 – 0.0121 0.012 – – –1556 200 – 0.0028 0.003 – – –1557 100 0.168 – – – – –1558 – – 0.0007 – – – –1559 – – 0.0018 – – – –1560 – – 0.0006 – – – –1561 – – 0.0003 0.03 – – –1562 – – 0.0037 0.01 – – –1563 – – 0.0028 0.019 – – –1564 – – 0.0039 0.006 – – –1565 – – 0.0168 0.001 – – –1566 – – 0.0011 – – – –1567 – – 0.0004 0.012 – – –1568 – – 0.0033 0.007 – – –1569 – – 0.0007 0.002 – – –1570 – – 0.0041 0.011 – – –1571 – – 0.0151 0.015 – – –1572 – – – 0.009 – – –1573 – – 0.0003 0.015 – – –1574 – – 0.0024 0.003 – – –1575 – – 0.0092 0.023 – – –1576 – – 0.0335 0.053 – – –1577 – – 0.0917 0.019 – – –1578 – – 0.0067 0.02 – – –1579 – – 0.0064 0.007 – – –1580 – – 0.0071 0.012 – – –1581 – – 0.0052 0.003 – – –1582 – – 0.0003 0.001 – – –1583 – – – 0.011 – – –1584 – – 0.0068 0.003 – – 24.231585 – – 0.0018 0.053 – – –1586 200 – 0.0868 0.018 – – –1587 150 – 0.0639 0.004 – – –1588 100 – 0.0143 0.015 – – –1589 50 – 0.0059 0.005 – – –1590 – – 0.0029 0.001 – – –1591 – – – 0.01 – – –1592 – – – 0.003 – – –1593 200 – 0.0421 0.019 – – 9.541594 150 – 0.0620 0.068 – – –1595 100 – 0.0101 0.028 – – –1596 50 – 0.0010 0.021 – – –1597 40 – 0.0008 0.007 – – –1598 30 – 0.0016 0.001 – – –1599 20 – 0.0147 – – – –
www.atmos-chem-phys.net/14/2987/2014/ Atmos. Chem. Phys., 14, 2987–3015, 2014

3008 C. S. Zerefos et al.: Further evidence of important environmental information content
Table D1.Continued.
Year N.H. DVI N.H. AOD AOD AOD AOD AOD Sulfatefrom paintings aerosols (Tg)
(Lamb, 1970, (this (Robertson Crowley and (Sato et (Stothers, (Gao et1977, 1983) study) et al., 2001) Unterman (2013) al., 1993) 1996, 2001) al., 2008)
1600 10 0.084 0.0729 0.147 – – 56.591601 400 – 0.0994 0.132 – – –1602 300 – 0.0065 0.05 – – –1603 210 – 0.0064 0.019 – – –1604 110 – 0.0062 0.007 – – –1605 10 – 0.0049 – – – –1606 20 – 0.0007 – – – –1607 50 0.112 0.0017 0.013 – – –1608 50 – 0.0011 0.004 – – –1609 50 – 0.0014 0.001 – – –1610 40 0.097 0.0005 0.006 – – –1611 30 – – 0.002 – – –1612 20 0.101 0.0018 – – – –1613 10 – 0.0059 0.005 – – –1614 200 – 0.0010 0.014 – – –1615 150 – – 0.004 – – –1616 100 – – 0.001 – – –1617 50 – 0.0003 – – – –1618 – – 0.0072 – – – –1619 – – 0.0209 – – – 5.231620 – – 0.0042 – – – –1621 – – 0.0017 0.025 – – –1622 – – 0.0102 0.033 – – –1623 – – 0.0017 0.007 – – –1624 – – 0.0056 0.002 – – –1625 100 0.13 0.0069 – – – –1626 75 – – 0.004 – – –1627 50 0.115 0.0005 0.001 – – –1628 25 – 0.0006 – – – –1629 – – 0.0076 – – – –1630 – – 0.0022 0.01 – – –1631 120 – – 0.003 – – –1632 90 – 0.0022 0.001 – – –1633 60 – 0.0010 – – – –1634 30 – 0.0030 – – – –1635 – – 0.0053 – – – –1636 40 0.102 0.0048 – – – –1637 30 0.067 0.0014 – – – –1638 120 0.151 0.0004 – – – –1639 85 – – – – – –1640 150 0.284 0.0462 0.022 – – –1641 400 – 0.0705 0.157 – – 51.61642 275 0.35 0.0355 0.101 – – –1643 175 0.125 0.0019 0.036 – – –1644 75 – – 0.013 – – –1645 – – 0.0036 0.027 – – –1646 60 – 0.0089 0.007 – – –1647 45 – – 0.002 – – –1648 30 0.097 0.0021 – – – –1649 15 0.08 – – – – –1650 100 0.251 0.0017 – – – –1651 75 – 0.0015 – – – –1652 50 0.104 0.0010 – – – –
Atmos. Chem. Phys., 14, 2987–3015, 2014 www.atmos-chem-phys.net/14/2987/2014/

C. S. Zerefos et al.: Further evidence of important environmental information content 3009
Table D1.Continued.
Year N.H. DVI N.H. AOD AOD AOD AOD AOD Sulfatefrom paintings aerosols (Tg)
(Lamb, 1970, (this (Robertson Crowley and (Sato et (Stothers, (Gao et1977, 1983) study) et al., 2001) Unterman (2013) al., 1993) 1996, 2001) al., 2008)
1653 25 – 0.0101 – – – –1654 – – 0.0066 – – – –1655 – – 0.0043 – – – –1656 – – 0.0052 – – – –1657 – – 0.0004 – – – –1658 – – 0.0030 – – – –1659 – – 0.0011 – – – –1660 340 – 0.0157 – – – –1661 255 0.341 0.0316 – – – –1662 170 – – 0.013 – – –1663 85 0.292 0.0024 0.004 – – –1664 130 0.146 – 0.001 – – –1665 100 – 0.0059 – – – –1666 65 0.112 0.0079 – – – –1667 30 0.089 0.0161 0.017 – – –1668 – – 0.0461 0.048 – – –1669 – – – 0.011 – – –1670 – – – 0.002 – – –1671 – – 0.0018 – – – –1672 200 – 0.0011 – – – –1673 150 0.168 0.0446 0.07 – – 16.131674 100 – 0.0539 0.128 – – –1675 50 – 0.0065 0.049 – – –1676 – – 0.0036 0.018 – – –1677 – – – 0.007 – – –1678 – – 0.0001 0.001 – – –1679 – – 0.0051 – – – –1680 280 0.478 0.0008 0.021 – – –1681 210 – 0.0001 0.018 – – –1682 140 – 0.0007 0.007 – – –1683 70 – 0.0065 0.002 – – –1684 – – 0.0009 0.001 – – –1685 – – 0.0019 – – – –1686 – – 0.0080 0.006 – – –1687 – – 0.0020 0.003 – – –1688 – – – 0.002 – – –1689 – – 0.0010 0.001 – – –1690 – – – – – – –1691 – – 0.0005 – – – –1692 – – 0.0106 – – – –1693 140 0.151 0.0563 – – – 27.11694 285 – 0.0777 0.105 – – –1695 205 – 0.1405 0.158 – – –1696 105 0.104 0.0395 0.171 – – –1697 45 – 0.0028 0.075 – – –1698 – – – 0.033 – – –1699 – – 0.0022 0.009 – – –1700 – – 0.0026 0.004 – – –1701 – – 0.0010 0.001 – – –1702 – – – 0.002 – – –1703 – – 0.0003 – – – –1704 – – – 0.005 – – –1705 – – 0.0126 0.002 – – –
www.atmos-chem-phys.net/14/2987/2014/ Atmos. Chem. Phys., 14, 2987–3015, 2014

3010 C. S. Zerefos et al.: Further evidence of important environmental information content
Table D1.Continued.
Year N.H. DVI N.H. AOD AOD AOD AOD AOD Sulfatefrom paintings aerosols (Tg)
(Lamb, 1970, (this (Robertson Crowley and (Sato et (Stothers, (Gao et1977, 1983) study) et al., 2001) Unterman (2013) al., 1993) 1996, 2001) al., 2008)
1706 – – 0.0040 0.004 – – –1707 300 – – 0.001 – – –1708 225 – – – – – –1709 150 – – – – – –1710 75 0.104 0.0031 – – – –1711 – – 0.0078 – – – 3.861712 80 – 0.0022 – – – –1713 60 – 0.0207 – – – –1714 40 – 0.0007 – – – –1715 20 – 0.0025 0.001 – – –1716 – – 0.0027 – – – –1717 120 – 0.0003 – – – –1718 90 0.13 0.0006 – – – –1719 60 – 0.0023 – – – 31.481720 30 0.058 0.0066 0.005 – – –1721 100 – 0.0091 0.001 – – –1722 75 – 0.0042 – – – –1723 50 – 0.0011 0.003 – – –1724 55 – – 0.001 – – –1725 15 – – – – – –1726 15 – 0.0032 – – – –1727 15 0.087 0.0112 – – – –1728 15 – 0.0270 – – – –1729 15 – 0.0043 – – – 12.021730 160 0.126 0.0319 – – – –1731 130 – 0.0854 0.024 – – –1732 90 – 0.0088 0.008 – – –1733 50 – – 0.002 – – –1734 – – 0.0002 – – – –1735 – – 0.0012 – – – –1736 – – 0.0006 – – – –1737 – – 0.0044 – – – –1738 – – 0.0122 – – – 3.341739 – – 0.0167 0.017 – – –1740 – – 0.0359 0.035 – – –1741 – – 0.0032 0.008 – – –1742 – – – 0.002 – – –1743 – – – – – – –1744 60 – 0.0012 – – – –1745 45 – 0.0079 – – – –1746 30 0.067 0.0009 – – – –1747 15 – 0.0200 0.005 – – –1748 – – 0.0001 0.001 – – –1749 – – 0.0154 – – – –1750 – – – – – – –1751 – – 0.0083 – – – –1752 200 – 0.0026 – – – –1753 150 0.167 0.0018 – – – –1754 160 – 0.0018 – – – –1755 255 – 0.0113 – – – 7.961756 150 – 0.0063 – – – –1757 95 – 0.0045 – – – –1758 40 – 0.0077 – – – –
Atmos. Chem. Phys., 14, 2987–3015, 2014 www.atmos-chem-phys.net/14/2987/2014/

C. S. Zerefos et al.: Further evidence of important environmental information content 3011
Table D1.Continued.
Year N.H. DVI N.H. AOD AOD AOD AOD AOD Sulfatefrom paintings aerosols (Tg)
(Lamb, 1970, (this (Robertson Crowley and (Sato et (Stothers, (Gao et1977, 1983) study) et al., 2001) Unterman (2013) al., 1993) 1996, 2001) al., 2008)
1759 80 – 0.0029 – – – –1760 110 0.138 0.0015 0.005 – – –1761 77 – 0.0072 0.001 – – 12.911762 45 – 0.0116 0.024 – – –1763 13 – 0.0074 0.007 – – –1764 – – 0.0028 0.002 – – –1765 – – 0.0028 – – – –1766 – – 0.0136 – – – –1767 – – 0.0035 – – – –1768 – – 0.0002 – – – –1769 – – 0.0056 – – – –1770 – – 0.0041 – – – –1771 – – 0.0012 – – – –1772 50 0.067 0.0029 0.006 – – –1773 37 – 0.0034 0.002 – – –1774 25 – 0.0003 – – – –1775 13 – 0.0051 – – – –1776 – – 0.0032 – – – –1777 – – 0.0002 – – – –1778 – – 0.0011 0.005 – – –1779 180 – 0.0015 0.006 – – –1780 135 – 0.0019 0.001 – – –1781 90 0.094 0.0092 – – – –1782 45 0.115 0.0106 – – – –1783 400 – 0.1643 0.009 – – 92.961784 300 0.3 0.1354 0.042 – – –1785 200 – 0.0005 0.01 – – –1786 160 – 0.0021 0.002 – – –1787 45 – 0.0080 – – – –1788 30 – 0.0035 0.011 – – –1789 15 – 0.0011 0.003 – – –1790 – – 0.0022 0.001 – – –1791 – – – – – – –1792 – – 0.0013 – – – –1793 – – 0.0292 – – – –1794 – – 0.0177 – – – 1.881795 120 0.098 0.0043 – – – –1796 130 – 0.0017 0.018 – – 6.71797 90 – 0.0041 0.006 – – –1798 50 – 0.0048 0.001 – – –1799 130 – 0.0060 – – – –1800 90 – 0.0010 – – – –1801 60 0.081 0.0031 0.012 – – –1802 30 – 0.0036 0.004 – – –1803 – – 0.0047 0.001 – – –1804 – – 0.0019 0.018 – – –1805 – – 0.0043 0.006 – – –1806 – – 0.0011 0.001 – – –1807 – – 0.0021 – – – –1808 – – – – – – –1809 – – 0.1391 0.198 – – 53.741810 – – 0.2308 0.18 – – –1811 80 – 0.0537 0.067 – – –
www.atmos-chem-phys.net/14/2987/2014/ Atmos. Chem. Phys., 14, 2987–3015, 2014
3012 C. S. Zerefos et al.: Further evidence of important environmental information content
Table D1.Continued.
Year N.H. DVI N.H. AOD AOD AOD AOD AOD Sulfatefrom paintings aerosols (Tg)
(Lamb, 1970, (this (Robertson Crowley and (Sato et (Stothers, (Gao et1977, 1983) study) et al., 2001) Unterman (2013) al., 1993) 1996, 2001) al., 2008)
1812 180 0.199 0.0055 0.025 – – –1813 170 0.181 0.0019 0.009 – – –1814 170 0.142 0.0008 – – – –1815 695 – 0.3351 0.199 – – 109.721816 490 0.6 0.3260 0.364 – – –1817 375 0.379 0.0798 0.194 – – –1818 195 0.33 0.0024 0.073 – – –1819 30 0.108 0.0015 0.027 – – –1820 15 0.062 0.0023 0.003 – – –1821 – – 0.0070 – – – –1822 200 – 0.0075 – – – –1823 150 – 0.0002 – – – –1824 100 – 0.0035 – – – –1825 70 0.104 0.0003 – – – –1826 80 0.15 0.0055 – – – –1827 65 0.143 0.0003 – – – –1828 50 0.147 0.0040 – – – –1829 75 0.147 0.0005 – – – –1830 50 0.069 0.0062 – – – –1831 200 0.293 0.0570 0.01 – – 16.971832 130 0.284 0.0570 0.098 – – –1833 80 0.16 – 0.048 – – –1834 40 0.059 0.0081 0.018 – – –1835 525 0.52 0.1300 0.127 – – 40.161836 450 – 0.1527 0.116 – – –1837 375 – 0.0218 0.042 – – –1838 300 – 0.0091 0.015 – – –1839 225 0.178 – 0.006 – – –1840 150 0.185 0.0004 0.004 – – –1841 75 0.11 0.0030 0.001 – – –1842 – – 0.0012 – – – –1843 – – 0.0007 0.004 – – –1844 – – 0.0022 0.001 – – –1845 100 0.145 0.0071 – – – –1846 205 – 0.0036 0.006 – – –1847 140 – 0.0006 0.002 – – –1848 90 – 0.0029 – – – –1849 30 – 0.0039 – – – –1850 – – – – 0.0036 – –1851 – – – – 0.0025 – –1852 – – 0.0017 – 0.0014 – –1853 – – 0.0075 – 0.0006 – –1854 – – 0.0032 0.009 0.0003 – –1855 – – 0.0043 0.004 0.0020 – –1856 140 – 0.0033 0.001 0.0387 – –1857 105 – 0.0014 – 0.0602 – –1858 70 0.098 0.0013 – 0.0290 – –1859 35 0.083 0.0001 – 0.0112 – –1860 – – – 0.003 0.0046 – –1861 160 0.164 0.0077 0.002 0.0034 – 4.231862 120 – 0.0075 0.054 0.0137 – –1863 80 – 0.0063 0.033 0.0100 – –1864 40 0.081 0.0067 0.012 0.0046 – –
Atmos. Chem. Phys., 14, 2987–3015, 2014 www.atmos-chem-phys.net/14/2987/2014/

C. S. Zerefos et al.: Further evidence of important environmental information content 3013
Table D1.Continued.
Year N.H. DVI N.H. AOD AOD AOD AOD AOD Sulfatefrom paintings aerosols (Tg)
(Lamb, 1970, (this (Robertson Crowley and (Sato et (Stothers, (Gao et1977, 1983) study) et al., 2001) Unterman (2013) al., 1993) 1996, 2001) al., 2008)
1865 – – 0.0037 0.005 0.0020 – –1866 – – 0.0021 0.001 0.0008 – –1867 – – 0.0018 – 0.0004 – –1868 160 0.204 0.0020 – 0.0002 – –1869 120 0.196 0.0013 – 0.0006 – –1870 80 – 0.0084 – 0.0006 – –1871 40 0.097 0.0009 – 0.0006 – –1872 – – 0.0091 0.001 0.0013 – –1873 – – 0.0033 0.008 0.0030 – –1874 – – 0.0035 0.002 0.0020 – –1875 120 0.241 0.0012 0.01 0.0013 – –1876 90 – 0.0102 0.003 0.0062 – –1877 60 – 0.0130 0.001 0.0053 – –1878 30 0.143 0.0023 – 0.0032 – –1879 – – 0.0009 – 0.0020 – –1880 – – – – 0.0011 – –1881 – – – – 0.0007 – –1882 – – – – 0.0006 – –1883 400 0.56 0.0410 0.02 0.0473 0.096 21.871884 300 0.46 0.0897 0.157 0.1429 0.192 –1885 240 0.361 0.0138 0.073 0.0635 0.071 –1886 170 0.37 0.0302 0.045 0.0364 0.026 1.931887 50 0.21 0.0325 0.016 0.0371 – –1888 170 0.31 0.0036 0.004 0.0219 – –1889 125 – 0.0019 – 0.0285 – –1890 85 0.132 0.0031 0.004 0.0391 0.026 –1891 45 0.101 0.0128 0.001 0.0300 0.048 –1892 20 0.094 0.0090 0.004 0.0217 0.018 –1893 15 0.108 0.0047 0.001 0.0094 – –1894 10 0.069 0.0007 – 0.0035 – –1895 5 – 0.0005 – 0.0014 – –1896 – – 0.0011 – 0.0183 – –1897 – – 0.0001 – 0.0169 – –1898 30 0.084 0.0041 0.007 0.0121 – –1899 25 0.084 0.0014 0.002 0.0046 – –1900 15 0.13 0.0027 – 0.0018 – –1901 5 – 0.0021 – 0.0007 – –1902 180 0.27 0.0094 0.004 0.0202 0.014 3.771903 135 – 0.0478 0.069 0.0715 0.118 –1904 90 0.118 0.0092 0.038 0.0318 0.061 –1905 45 – 0.0032 0.014 0.0126 – –1906 – 0.17 0.0049 0.005 0.0073 – –1907 60 0.2655 0.0078 0.013 0.0092 0.01 –1908 45 0.2 0.0056 0.006 0.0103 0.004 –1909 30 0.13 – 0.001 0.0040 – –1910 15 – 0.0008 – 0.0031 – –1911 – – 0.0518 – 0.0017 – –1912 60 0.163 0.0161 0.031 0.0193 0.028 11.041913 45 0.16 0.0120 0.029 0.0241 0.019 –1914 30 0.168 0.0048 0.006 0.0099 0.007 –1915 15 0.106 0.0055 0.001 0.0039 – –1916 – 0.177 0.0040 0.009 0.0027 – –1917 – 0.122 0.0016 0.003 0.0022 – –
www.atmos-chem-phys.net/14/2987/2014/ Atmos. Chem. Phys., 14, 2987–3015, 2014

3014 C. S. Zerefos et al.: Further evidence of important environmental information content
Table D1.Continued.
Year N.H. DVI N.H. AOD AOD AOD AOD AOD Sulfatefrom paintings aerosols (Tg)
(Lamb, 1970, (this (Robertson Crowley and (Sato et (Stothers, (Gao et1977, 1983) study) et al., 2001) Unterman (2013) al., 1993) 1996, 2001) al., 2008)
1918 – 0.12 0.0036 0.001 0.0020 – –1919 – 0.195 0.0072 – 0.0020 – –1920 – 0.16 0.0014 – 0.0094 – –1921 – 0.156 0.0012 0.005 0.0077 – –1922 – 0.2 0.0052 0.001 0.0029 0.008 –1923 – 0.13 0.0031 – 0.0011 0.004 –1924 – – 0.0102 0.011 0.0034 – –1925 – 0.15 0.0106 0.005 0.0029 – 11.151926 – – 0.0126 0.001 0.0023 – –1927 – 0.175 0.0029 – 0.0015 – –1928 – 0.195 0.0036 – 0.0053 0.002 –1929 – – 0.0029 0.002 0.0098 0.014 –1930 – – 0.0002 0.002 0.0062 – –1931 – – 0.0075 0.006 0.0047 – –1932 – 0.161 0.0005 0.01 0.0082 0.012 –1933 – 0.172 0.0026 0.003 0.0067 0.002 –1934 – – 0.0028 0.001 0.0038 – –1935 – 0.116 0.0058 – 0.0042 – –1936 – 0.122 0.0021 – 0.0033 – –1937 – – 0.0278 – 0.0028 – –1938 – 0.136 0.0044 – 0.0049 – –1939 – – 0.0054 – 0.0041 – –1940 – 0.094 0.0004 – 0.0032 – –1941 – – 0.0050 – 0.0019 – –1942 – – 0.0036 – 0.0042 – –1943 – 0.094 0.0728 – 0.0044 – 6.611944 – 0.21 0.0499 – 0.0024 – –1945 – – 0.0012 – 0.0022 – –1946 – – 0.0033 – 0.0018 – –1947 – – 0.0056 – 0.0023 – –1948 – – 0.0033 – 0.0017 – –1949 – – 0.0029 – 0.0033 – –1950 – – 0.0027 – 0.0029 – –1951 – – 0.0507 – 0.0020 – –1952 – 0.167 0.0559 – 0.0037 – –1953 – 0.268 0.0056 – 0.0034 – –1954 – – 0.0006 – 0.0036 – –1955 – – 0.0038 – 0.0018 – –1956 – – 0.0068 0.005 0.0011 – –1957 – – 0.0053 0.001 0.0005 – –1958 – 0.293 0.0008 – 0.0003 – –1959 – – 0.0029 – 0.0002 – –1960 – – 0.0005 – 0.0046 – –1961 – – 0.0053 – 0.0108 – –1962 – – 0.0024 – 0.0133 0.012 –1963 160 – 0.0502 0.04 0.0460 0.066 171964 120 – 0.0389 0.055 0.0717 0.051 –1965 80 – 0.0149 0.03 0.0432 0.031 –1966 40 – 0.0027 0.01 0.0232 0.014 –1967 31.4 0.138 0.0053 0.003 0.0145 0.019 –1968 60.7 0.32 0.0164 0.001 0.0274 0.011 –1969 40 – 0.0388 – 0.0344 0.006 –1970 32.4 – 0.0275 – 0.0166 0.006 –
Atmos. Chem. Phys., 14, 2987–3015, 2014 www.atmos-chem-phys.net/14/2987/2014/

C. S. Zerefos et al.: Further evidence of important environmental information content 3015
Table D1.Continued.
Year N.H. DVI N.H. AOD AOD AOD AOD AOD Sulfatefrom paintings aerosols (Tg)
(Lamb, 1970, (this (Robertson Crowley and (Sato et (Stothers, (Gao et1977, 1983) study) et al., 2001) Unterman (2013) al., 1993) 1996, 2001) al., 2008)
1971 23.7 – 0.0141 – 0.0065 0.015 –1972 9.5 – 0.0135 – 0.0039 0.008 –1973 9.3 – 0.0047 – 0.0078 0.001 –1974 56.1 – 0.0055 – 0.0127 0.007 –1975 41 – 0.0071 0.024 0.0301 0.024 –1976 67 – 0.0080 0.015 0.0136 0.007 4.721977 45.4 – – 0.006 0.0051 0.003 –1978 25.8 – 0.0051 0.002 0.0075 0.001 –1979 25.4 0.19 0.0019 0.001 0.0092 – –1980 51 – 0.0010 – 0.0047 – –1981 41 – 0.0098 – 0.0050 – –1982 366.1 – 0.0492 0.048 0.0525 – 141983 267.2 – 0.0370 0.079 0.0752 – –1984 171.1 0.19 – 0.03 0.0302 – –1985 85 – – 0.011 0.0126 – –1986 – – – 0.004 0.0136 – –1987 – – – – 0.0103 – –1988 – – – – 0.0076 – –1989 – – – – 0.0061 – –1990 – – – – 0.0061 – –1991 – 0.15 – 0.037 0.0539 – 30.11992 – – – 0.131 0.1211 – –1993 – – – 0.053 0.0490 – –1994 – – – 0.02 0.0200 – –1995 – – – 0.007 0.0096 – –1996 – 0.22 – 0.001 0.0065 – –1997 – – – – 0.0052 – –1998 – – – – 0.0028 – –1999 – – – – 0.0021 – –2000 – – – – 0.0021 – –
www.atmos-chem-phys.net/14/2987/2014/ Atmos. Chem. Phys., 14, 2987–3015, 2014