atmospheric chemistry in giant planets, brown dwarfs,...
TRANSCRIPT
Icarus 155, 393–424 (2002)
doi:10.1006/icar.2001.6740, available online at http://www.idealibrary.com on
Atmospheric Chemistry in Giant Planets, Brown Dwarfs,and Low-Mass Dwarf Stars
I. Carbon, Nitrogen, and Oxygen
Katharina Lodders and Bruce Fegley, Jr.
Planetary Chemistry Laboratory, Department of Earth and Planetary Sciences, Washington University, Campus Box 1169, St. Louis, Missouri 63130-4899E-mail: [email protected]
Received March 23, 2001; revised August 6, 2001
The chemical species containing carbon, nitrogen, and oxygenin atmospheres of giant planets, brown dwarfs (T and L dwarfs),and low-mass stars (M dwarfs) are identified as part of a compre-hensive set of thermochemical equilibrium and kinetic calculationsfor all elements. The calculations cover a wide temperature andpressure range in the upper portions of giant planetary and T-, L-,and M-dwarf atmospheres. Emphasis is placed on the major gasesCH4, CO, NH3, N2, and H2O but other less abundant gases are in-cluded. The results presented are independent of particular modelatmospheres, and can be used to constrain model atmosphere tem-peratures and pressures from observations of different gases. Theinfluence of metallicity on the speciation of these key elements un-der pressure–temperature (P–T) conditions relevant to low-massobject atmospheres is discussed. The results of the thermochemicalequilibrium computations indicate that several compounds may beuseful to establish temperature or pressure scales for giant planet,brown dwarf, or dwarf star atmospheres. We find that ethane andmethanol abundance are useful temperature probes in giant planetsand methane dwarfs such as Gl 229B, and that CO2 can serve as atemperature probe in more massive objects. Imidogen (NH) abun-dances are a unique pressure-independent temperature probe forall objects. Total pressure probes for warmer brown dwarfs and Mdwarfs are HCN, HCNO, and CH2O. No temperature-independentprobes for the total pressure in giant planets or T-dwarf atmospheresare identified among the more abundant C, N, and O bearing gasesinvestigated here. c© 2002 Elsevier Science (USA)
Key Words: Jupiter; giant planets; extrasolar planets; browndwarfs; Gliese 229B; T dwarfs; L dwarfs; M dwarfs; atmosphericchemistry; carbon; nitrogen; oxygen; methane; carbon monoxide;ammonia; thermo-chemical equilibrium.
INTRODUCTION
carbon bearing gas in giant planet atmospheres and in brown
93
The upper atmospheres of low-mass stars, brown dwarfs, andgiant gas-rich planets are cool enough to allow formation ofmonatomic and molecular gases compared to atmospheres ofstars such as the Sun. Methane (CH4) is the most abundant
3
dwarfs such as Gl 229B, while carbon monoxide (CO) is themost abundant carbon bearing gas in more massive and hotterobjects such as M dwarfs, and the L dwarfs. The new group ofL dwarfs consists of objects that have lower effective temper-atures than M dwarfs. The L-dwarfs spectra are dominated bystrengthening metal hydride bands, neutral alkali lines, and in-creasing depth of the water bands with decreasing temperature,but methane bands at 1.6 and 2.2 µm are absent (Kirkparticket al. 1999, Martin et al. 1997, 1999). The cooler late-type Ldwarfs (Teff < 1800 K) begin to show the strong fundamental3.3-µm methane absorption (Noll et al. 2000). Only in coolerobjects do chemical changes in the atmosphere make methanedominant and the observation of methane and water absorptionin the 1–2.5 micron range in Gl 229B identified it as the firstbona fide brown dwarf (Nakajima et al. 1995, Oppenheimeret al. 1995). Gl 229B is the prototype of the new group of low-mass objects now called “T dwarfs” (Kirkpartick et al. 1999)since several similar objects to Gl 229B were discovered by theSloan Digital Sky Survey (DENIS) and the Two Micron All SkySurvey (2MASS); see Burgasser et al. (1999, 2000a, 2000b),Cuby et al. (1999), Strauss et al. (1999), and Tsvetanov et al.(2000). In T dwarfs, methane and water bands are strong in the1–3-µm region while the 2.3-µm CO band is absent. It wasonly recently that early T dwarfs bridging the transition from Ldwarfs to T dwarfs were discovered, showing both methane andCO absorption bands (Leggett et al. 2000).
There are several motivations for this work. Spectroscopicstudies to characterize substellar mass objects, i.e., T and Ldwarfs, and putative extrasolar gas giant planets such as 51 Pe-gasi B, are highlighted as one of the two most compelling issuesfor scientific study by the Space Studies Board (1998). Our the-oretical modeling is important for interpreting and guiding thesespectroscopic studies (e.g., Geballe et al. 2001, Saumon et al.2000). Second, theoretical models of the chemistry of the deepatmospheres of Jupiter, Saturn, Uranus, and Neptune in the 100–1000-bar region are important for the design of deep atmospheric
0019-1035/02 $35.00c© 2002 Elsevier Science (USA)
All rights reserved.
394 LODDERS AN
entry probes to these planets (e.g., Spilker and Hubbard 1997).The continuing advances in high temperature electronics, minia-turization of analytical instruments for gas chemistry, and in anumber of the required spacecraft systems have made the designof 100–1000-bar probes realistic. We note that the Venera andVega landing probes successfully functioned for about one hourat about 740 K and 100 bars on Venus’ surface. Third, stud-ies of deep atmospheric probe missions to Jupiter, Saturn, andUranus have been recommended by the Space Studies Board(1988, 1991) because of the importance of determining the ele-mental composition, dynamics, and cloud composition to levelswell below the water cloud base on these planets. In the caseof Uranus and Neptune, the water cloud base is at about the100-bar level (Fegley and Prinn 1986) and probes to greaterdepths and higher pressures are required. Last, recent modelsof the internal structure of Jupiter and Saturn indicate that theirinteriors may not be fully convective at temperatures lower thanabout 4000 K (Guillot et al. 1994a, 1994b) and may have radia-tive zones between 1450 and 1900 K (Guillot 1999). However,these models do not include the alkali opacities (T. Guillot, per-sonal communication). Thermodynamic modeling of the molec-ular composition of solar and near-solar composition atmo-spheres at high pressures and temperatures is an essentialinput for opacity calculations that are needed to explore pos-sible radiative zones inside the gas giant planets.
Atmospheres of giant planets, T, L, and M dwarfs have dif-ferent P–T structures and have their own characteristic distribu-tion of the elements between atomic and molecular gases, andsolid and liquid condensates. We use chemical thermodynamicsand kinetics to calculate which gas species and condensates arepresent as a function of temperature (T), pressure (P), and ele-mental abundances (i.e., metallicity). We previously calculatedthe chemical speciation for the elements in the atmospheres ofJupiter and Saturn (Fegley and Lodders 1994). This approachyields information about the chemical probes from the deep in-terior of the giant planets but is restricted to these two specificobjects. The approach of using individual P–T profiles is imprac-tical for calculating the chemical composition for the numerousM, L, and T dwarfs, and extra-solar giant planets.
Instead of selecting a representative P–T profile for each ob-ject to calculate the characteristic chemical composition, weplot contour diagrams of the abundances for each compound inP–T space. This general approach to describe chemical compo-sition as a function of T and P is more indicative of the speciesexpected for a particular group of objects. Furthermore, any P–Tprofile for a specific object can be superimposed on the abun-dance diagrams to find its chemical composition, or vice versa,the chemical speciation can be used to constrain an object’s at-mospheric P–T structure.
We use solar elemental abundances (Lodders and Fegley1998) in the computations as well as metallicities that are 0.5 dex(i.e., half a log unit) higher and lower than solar. Brown dwarfsand low-mass stars among the old disk population or in older
clusters may be deficient in heavier elements (all elements heav-ier than H and He) relative to the Sun, while younger populationD FEGLEY
objects, such as the brown dwarfs in the Pleiades, are more likelyto have relative excesses of heavier elements. The metallicity of“isolated” brown dwarfs and low-mass stars is probably deter-mined by the composition of their primordial molecular cloudsfrom which they formed. However, there is another mechanismto increase the metallicity in objects in binary systems.
Giant planets such as Jupiter and Saturn are known to haveenrichments of heavy elements relative to the Sun. These en-richments are assumed to be caused by preferential accretion ofrock and ice, and incomplete gas capture of H2 and He from thesolar nebula. Such effects may apply to extrasolar giant planets,brown dwarfs, or even some low-mass stars in binary (or mul-tiple) systems. Thus, knowing the metallicity of a primary starand that of an associated giant planet, brown dwarf, or low-massstar can help to decipher the formation and accretion history ofthe system.
We previously reported some results of the thermochemicalcalculations for C and N and the rock-forming elements Al, Ca,Cr, Fe, Mg, Si, Ti, V (Fegley and Lodders 1996) and the alkalielements (Lodders 1999a). These computations were applied todevelop a relative temperature scale for low-mass dwarfs and areused to interpret results of alkali element observations in low-mass stars and brown dwarfs. Here we focus on C, N, and Obecause these elements are typically the next most abundant el-ements after H and He and their chemistry is diagnostic for P andT conditions in low-mass stars, brown dwarfs, and giant planets.
METHOD OF CALCULATION
We use the CONDOR chemical equilibrium code (Fegley andLodders 1994), previously used successfully for modeling chem-istry in the solar nebula (Lodders and Fegley 1993; Lauretta andLodders 1997), in the atmospheres and circumstellar envelopesof cool stars (Lodders and Fegley 1995, 1997a, 1997b, 1999), inthe atmosphere of Venus (Fegley et al. 1997), in volcanic gaseson Jupiter’s satellite Io (Zolotov and Fegley 1998a, 1998b), andin the atmospheres of gas giant planets and brown dwarfs (Fegleyand Lodders 1994, 1996; Lodders 1999a; Lodders and Fegley1994). The results from the CONDOR code agree with resultsfrom a Gibbs free energy minimization code that was developedby others (see Fegley et al. 1997; Zolotov and Fegley 1998a,1998b) and with results from other groups using other computercodes [e.g., the METKON code described by Fegley and Palme(1985) or the code described by Barshay and Lewis (1978)].Some results showing the versatility of the code are describedon our webpage (http://solarsystem.wustl.edu).
Where relevant, we considered the possible effects of verticalmixing on the abundances of gases which are observed (e.g.,CO) or possible (e.g., N2, HCN) chemical probes of the deepatmospheres of the gas giant planets in our solar system. Thesecalculations were done using a chemical dynamical model de-scribed elsewhere (e.g., Fegley and Prinn 1985, 1986, 1988a,1988b; Fegley and Lodders 1994). As discussed below, we com-
pare results from the Prinn and Barshay (1977) and Yung et al.(1988) kinetic schemes for CO reduction to CH4, and show that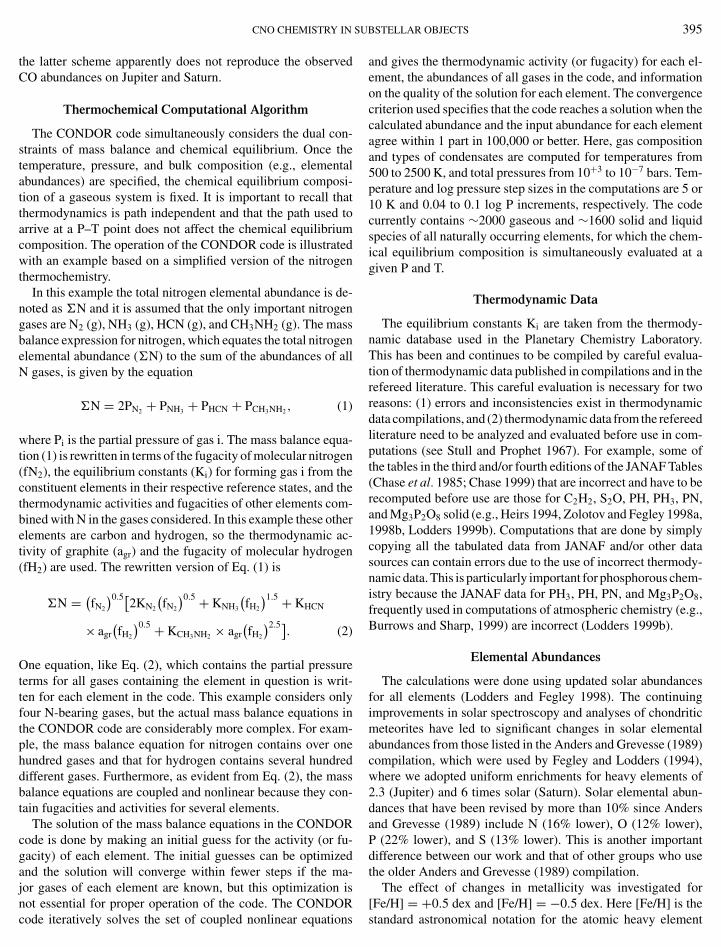
U
CNO CHEMISTRY IN Sthe latter scheme apparently does not reproduce the observedCO abundances on Jupiter and Saturn.
Thermochemical Computational Algorithm
The CONDOR code simultaneously considers the dual con-straints of mass balance and chemical equilibrium. Once thetemperature, pressure, and bulk composition (e.g., elementalabundances) are specified, the chemical equilibrium composi-tion of a gaseous system is fixed. It is important to recall thatthermodynamics is path independent and that the path used toarrive at a P–T point does not affect the chemical equilibriumcomposition. The operation of the CONDOR code is illustratedwith an example based on a simplified version of the nitrogenthermochemistry.
In this example the total nitrogen elemental abundance is de-noted as �N and it is assumed that the only important nitrogengases are N2 (g), NH3 (g), HCN (g), and CH3NH2 (g). The massbalance expression for nitrogen, which equates the total nitrogenelemental abundance (�N) to the sum of the abundances of allN gases, is given by the equation
�N = 2PN2 + PNH3 + PHCN + PCH3NH2 , (1)
where Pi is the partial pressure of gas i. The mass balance equa-tion (1) is rewritten in terms of the fugacity of molecular nitrogen(fN2), the equilibrium constants (Ki) for forming gas i from theconstituent elements in their respective reference states, and thethermodynamic activities and fugacities of other elements com-bined with N in the gases considered. In this example these otherelements are carbon and hydrogen, so the thermodynamic ac-tivity of graphite (agr) and the fugacity of molecular hydrogen(fH2) are used. The rewritten version of Eq. (1) is
�N = (fN2
)0.5[2KN2
(fN2
)0.5 + KNH3
(fH2
)1.5 + KHCN
× agr(fH2
)0.5 + KCH3NH2 × agr(fH2
)2.5]. (2)
One equation, like Eq. (2), which contains the partial pressureterms for all gases containing the element in question is writ-ten for each element in the code. This example considers onlyfour N-bearing gases, but the actual mass balance equations inthe CONDOR code are considerably more complex. For exam-ple, the mass balance equation for nitrogen contains over onehundred gases and that for hydrogen contains several hundreddifferent gases. Furthermore, as evident from Eq. (2), the massbalance equations are coupled and nonlinear because they con-tain fugacities and activities for several elements.
The solution of the mass balance equations in the CONDORcode is done by making an initial guess for the activity (or fu-gacity) of each element. The initial guesses can be optimizedand the solution will converge within fewer steps if the ma-jor gases of each element are known, but this optimization is
not essential for proper operation of the code. The CONDORcode iteratively solves the set of coupled nonlinear equationsBSTELLAR OBJECTS 395
and gives the thermodynamic activity (or fugacity) for each el-ement, the abundances of all gases in the code, and informationon the quality of the solution for each element. The convergencecriterion used specifies that the code reaches a solution when thecalculated abundance and the input abundance for each elementagree within 1 part in 100,000 or better. Here, gas compositionand types of condensates are computed for temperatures from500 to 2500 K, and total pressures from 10+3 to 10−7 bars. Tem-perature and log pressure step sizes in the computations are 5 or10 K and 0.04 to 0.1 log P increments, respectively. The codecurrently contains ∼2000 gaseous and ∼1600 solid and liquidspecies of all naturally occurring elements, for which the chem-ical equilibrium composition is simultaneously evaluated at agiven P and T.
Thermodynamic Data
The equilibrium constants Ki are taken from the thermody-namic database used in the Planetary Chemistry Laboratory.This has been and continues to be compiled by careful evalua-tion of thermodynamic data published in compilations and in therefereed literature. This careful evaluation is necessary for tworeasons: (1) errors and inconsistencies exist in thermodynamicdata compilations, and (2) thermodynamic data from the refereedliterature need to be analyzed and evaluated before use in com-putations (see Stull and Prophet 1967). For example, some ofthe tables in the third and/or fourth editions of the JANAF Tables(Chase et al. 1985; Chase 1999) that are incorrect and have to berecomputed before use are those for C2H2, S2O, PH, PH3, PN,and Mg3P2O8 solid (e.g., Heirs 1994, Zolotov and Fegley 1998a,1998b, Lodders 1999b). Computations that are done by simplycopying all the tabulated data from JANAF and/or other datasources can contain errors due to the use of incorrect thermody-namic data. This is particularly important for phosphorous chem-istry because the JANAF data for PH3, PH, PN, and Mg3P2O8,frequently used in computations of atmospheric chemistry (e.g.,Burrows and Sharp, 1999) are incorrect (Lodders 1999b).
Elemental Abundances
The calculations were done using updated solar abundancesfor all elements (Lodders and Fegley 1998). The continuingimprovements in solar spectroscopy and analyses of chondriticmeteorites have led to significant changes in solar elementalabundances from those listed in the Anders and Grevesse (1989)compilation, which were used by Fegley and Lodders (1994),where we adopted uniform enrichments for heavy elements of2.3 (Jupiter) and 6 times solar (Saturn). Solar elemental abun-dances that have been revised by more than 10% since Andersand Grevesse (1989) include N (16% lower), O (12% lower),P (22% lower), and S (13% lower). This is another importantdifference between our work and that of other groups who usethe older Anders and Grevesse (1989) compilation.
The effect of changes in metallicity was investigated for
[Fe/H] = +0.5 dex and [Fe/H] = −0.5 dex. Here [Fe/H] is thestandard astronomical notation for the atomic heavy element
N
396 LODDERS A(represented by Fe) to hydrogen ratio in a given object rel-ative to the respective solar abundance ratios defined so that[Fe/H] = log(Fe/H)object − log(Fe/H)Sun. Stellar spectroscopyshows that the ratios of heavy elements (e.g., C/O, N/C, Fe/Si,etc.) remain solar for metallicities down to [Fe/H] ∼ −1 andonly elemental abundance ratios relative to hydrogen changefrom the solar ratio. Below [Fe/H] < −1 the abundance ratiosof heavy elements deviate from solar abundance ratios (see, e.g.,Edvardsson et al. (1993) for determination of stellar elementalabundances over a wide range of metallicities).
Abundances with [Fe/H] = +0.5 (equivalent to ∼3.2 timessolar values) are appropriate for Jupiter, where recent GalileoProbe results show heavy element enrichments of about threetimes the solar value (e.g., Niemann et al., 1998, Mahaffy et al.2000). On the other hand, the brown dwarf Gl 299B likely isof subsolar metallicity. Depending on adopted gravity (g), themetallicity may range from −0.5(log g = 4.5, Teff = 870 K) to[Fe/H] = −0.1(log g = 5.5, Teff = 1030 K) and at the most likelyTeff of 940 K, [Fe/H] is −0.3 for log g = 5.0 (Saumon et al.2000).
Condensate Formation
The CONDOR code takes possible liquid and solid conden-sates into account. This is illustrated using nitrogen chemistryas an example. Solid ammonium hydrosulfide (NH4SH) is ex-pected to condense in the atmospheres of gas giant planets suchas Jupiter. At chemical equilibrium, the condensation of NH4SH(solid) occurs when the thermodynamic activity of this phasebecomes equal to one. The thermodynamic activity of NH4SH(solid) is dependent only upon the bulk composition, pressure,and temperature of the system and not upon the P–T path usedto arrive at a given P–T point. In other words, the NH4SH (solid)condensation curve can be plotted as a function of pressure andtemperature for each metallicity we consider. However, nucle-ation constraints may cause condensation of NH4SH (and othercondensates) at temperatures below the chemical equilibriumcondensation temperature. We do not consider nucleation con-straints here.
Once the CONDOR code finds that a(NH4SH) is equal to(or greater than) one, it computes the temperature at which theactivity first reached unity, resets the thermodynamic activity ofNH4SH (solid) to unity at all lower temperatures, and adds a newterm A(NH4SH) to the mass balance equations for nitrogen andsulfur which takes into account the amount of NH4SH that iscondensed. (The hydrogen abundance is so large relative to thatof nitrogen and sulfur that a mass balance correction for NH4SHcondensation is very small for a solar or near solar compositiongas, but this term is necessary in a very high metallicity sys-tem, such as the atmospheres of Uranus and Neptune.) The gasphase and condensation calculations are coupled, and are donesimultaneously using iterative methods.
The total abundance of each condensate is limited by the leastabundant element in the condensate. For example, condensation
of NH4SH from a solar or a near solar composition system suchD FEGLEY
as the jovian atmosphere occurs via the net thermochemicalreaction
NH3 (g) + H2S (g) = NH4SH (solid) (3)
at about 230 K in Jupiter’s atmosphere. The solar atomic abun-dances of hydrogen, nitrogen, and sulfur are 2.82 × 10¹⁰, 2.63 ×10⁶, and 4.47 × 10⁵ atoms, respectively, on the cosmochemicalscale where Si = 1.00 × 10⁶ atoms (Lodders and Fegley 1998).Here sulfur is the least abundant element and limits the amountof NH4SH that condenses. At 230 K on Jupiter, NH3 and H2Sare the dominant nitrogen-bearing and sulfur-bearing gases andcontain ∼100% of all nitrogen and ∼100% of all sulfur in theatmosphere. The NH3 abundance decreases by about 17% (i.e.,by the S/N atomic abundance ratio) due to the condensation ofNH4SH, but H2S is almost completely consumed by NH4SHcondensation. The H2S abundance at lower temperatures is verysmall (effectively zero) and is an exponential function of temper-ature because it is controlled by its vapor pressure over NH4SH(solid). Analogous constraints control the abundances of othercondensates and affect the abundances of gaseous species aftercondensation occurs.
There is an important difference between condensate for-mation in a planetary, brown dwarf, or stellar atmosphere andcondensate formation in a low-gravity environment such as thesolar nebula (or other protoplanetary disks). In a planetary atmo-sphere, condensates forming directly from the gas at high tem-peratures (“primary condensates”) settle and form cloud layers.These primary condensates do not react with the gas at alti-tudes � Hcloud (the cloud particle number density scale height)above the condensate clouds. These condensate clouds are outof equilibrium with the overlying atmosphere. In contrast, pri-mary condensates in the solar nebula remain dispersed in the gas.In this environment, secondary condensates form by gas–solidreactions of the primary condensates with the surrounding gasduring cooling. However, in planetary atmospheres the primarycondensates are segregated by condensate cloud formation andsecondary condensates cannot form.
Several sets of observations demonstrate the depletion of re-fractory elements via condensate cloud formation at high tem-peratures deep in the atmospheres of gas giant planets and browndwarfs. The absence of silane (SiH4) and the presence of ger-mane (GeH4) in the atmospheres of Jupiter and Saturn is dueto depletion of refractory Si, but not of volatile Ge, by conden-sate formation deep in their atmospheres (Fegley and Lodders1994). Silicon is much more abundant than germanium in asolar composition gas, which has an atomic Si/Ge ratio of ∼8300(Lodders and Fegley 1998). Still, SiH4 is not observed on ei-ther Jupiter or Saturn, and the observational upper limits areSiH4/H2 ∼ 1 × 10⁻⁹ by volume (1 ppbv). For comparison, thesolar Si/H2 molar ratio is 7.09 × 10⁻⁵, which is about 71,000times larger than the observational upper limit on the silaneabundance. In contrast, GeH4 is observed with a GeH4/H2 ratio∼0.7 ppbv on Jupiter and ∼0.4 ppbv on Saturn (Lodders andFegley 1998). These values are close to the solar Ge/H2 molar
ratio of 8.5 ppbv and the difference arises because not all Ge in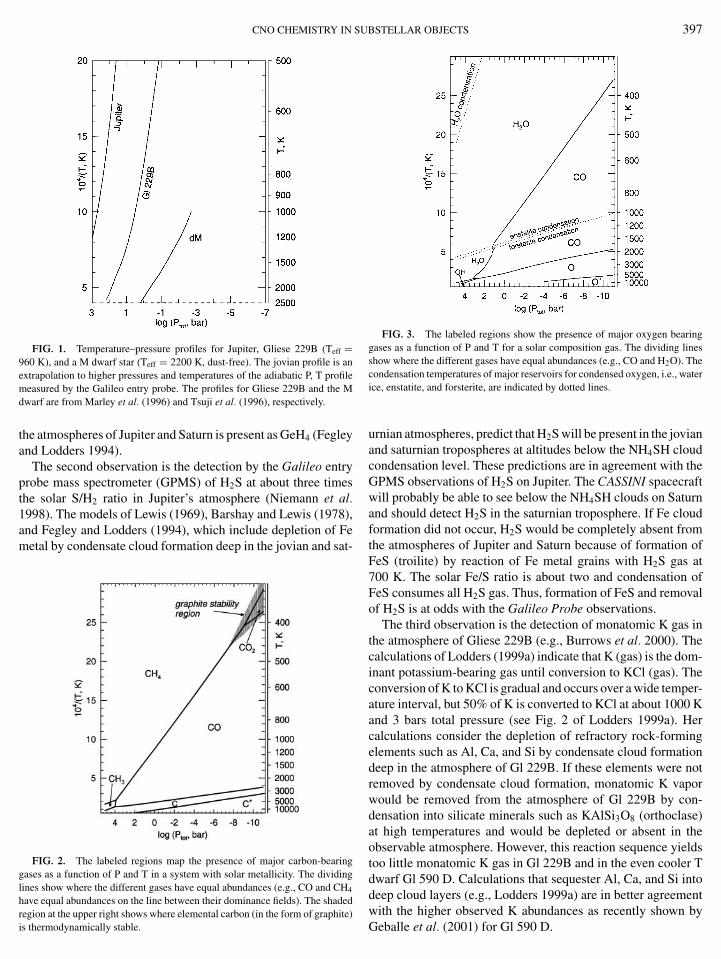
U
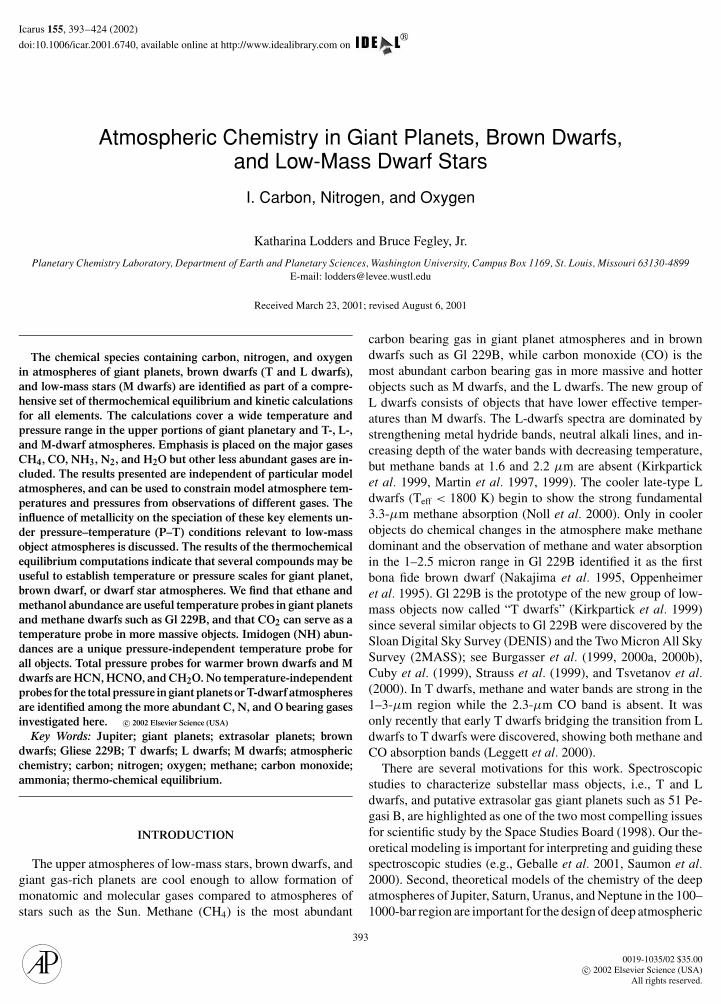
CNO CHEMISTRY IN SFIG. 1. Temperature–pressure profiles for Jupiter, Gliese 229B (Teff =960 K), and a M dwarf star (Teff = 2200 K, dust-free). The jovian profile is anextrapolation to higher pressures and temperatures of the adiabatic P, T profilemeasured by the Galileo entry probe. The profiles for Gliese 229B and the Mdwarf are from Marley et al. (1996) and Tsuji et al. (1996), respectively.
the atmospheres of Jupiter and Saturn is present as GeH4 (Fegleyand Lodders 1994).
The second observation is the detection by the Galileo entryprobe mass spectrometer (GPMS) of H2S at about three timesthe solar S/H2 ratio in Jupiter’s atmosphere (Niemann et al.1998). The models of Lewis (1969), Barshay and Lewis (1978),and Fegley and Lodders (1994), which include depletion of Femetal by condensate cloud formation deep in the jovian and sat-
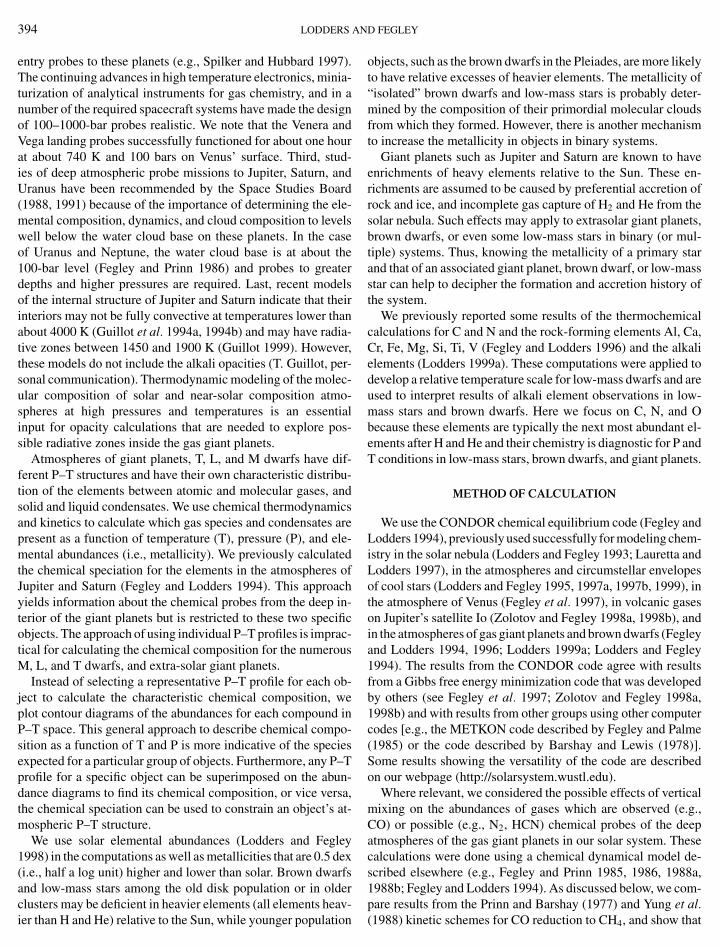
FIG. 2. The labeled regions map the presence of major carbon-bearinggases as a function of P and T in a system with solar metallicity. The dividinglines show where the different gases have equal abundances (e.g., CO and CH4
have equal abundances on the line between their dominance fields). The shadedregion at the upper right shows where elemental carbon (in the form of graphite)
is thermodynamically stable.BSTELLAR OBJECTS 397
FIG. 3. The labeled regions show the presence of major oxygen bearinggases as a function of P and T for a solar composition gas. The dividing linesshow where the different gases have equal abundances (e.g., CO and H2O). Thecondensation temperatures of major reservoirs for condensed oxygen, i.e., waterice, enstatite, and forsterite, are indicated by dotted lines.
urnian atmospheres, predict that H2S will be present in the jovianand saturnian tropospheres at altitudes below the NH4SH cloudcondensation level. These predictions are in agreement with theGPMS observations of H2S on Jupiter. The CASSINI spacecraftwill probably be able to see below the NH4SH clouds on Saturnand should detect H2S in the saturnian troposphere. If Fe cloudformation did not occur, H2S would be completely absent fromthe atmospheres of Jupiter and Saturn because of formation ofFeS (troilite) by reaction of Fe metal grains with H2S gas at700 K. The solar Fe/S ratio is about two and condensation ofFeS consumes all H2S gas. Thus, formation of FeS and removalof H2S is at odds with the Galileo Probe observations.
The third observation is the detection of monatomic K gas inthe atmosphere of Gliese 229B (e.g., Burrows et al. 2000). Thecalculations of Lodders (1999a) indicate that K (gas) is the dom-inant potassium-bearing gas until conversion to KCl (gas). Theconversion of K to KCl is gradual and occurs over a wide temper-ature interval, but 50% of K is converted to KCl at about 1000 Kand 3 bars total pressure (see Fig. 2 of Lodders 1999a). Hercalculations consider the depletion of refractory rock-formingelements such as Al, Ca, and Si by condensate cloud formationdeep in the atmosphere of Gl 229B. If these elements were notremoved by condensate cloud formation, monatomic K vaporwould be removed from the atmosphere of Gl 229B by con-densation into silicate minerals such as KAlSi3O8 (orthoclase)at high temperatures and would be depleted or absent in theobservable atmosphere. However, this reaction sequence yieldstoo little monatomic K gas in Gl 229B and in the even cooler Tdwarf Gl 590 D. Calculations that sequester Al, Ca, and Si intodeep cloud layers (e.g., Lodders 1999a) are in better agreementwith the higher observed K abundances as recently shown by
Geballe et al. (2001) for Gl 590 D.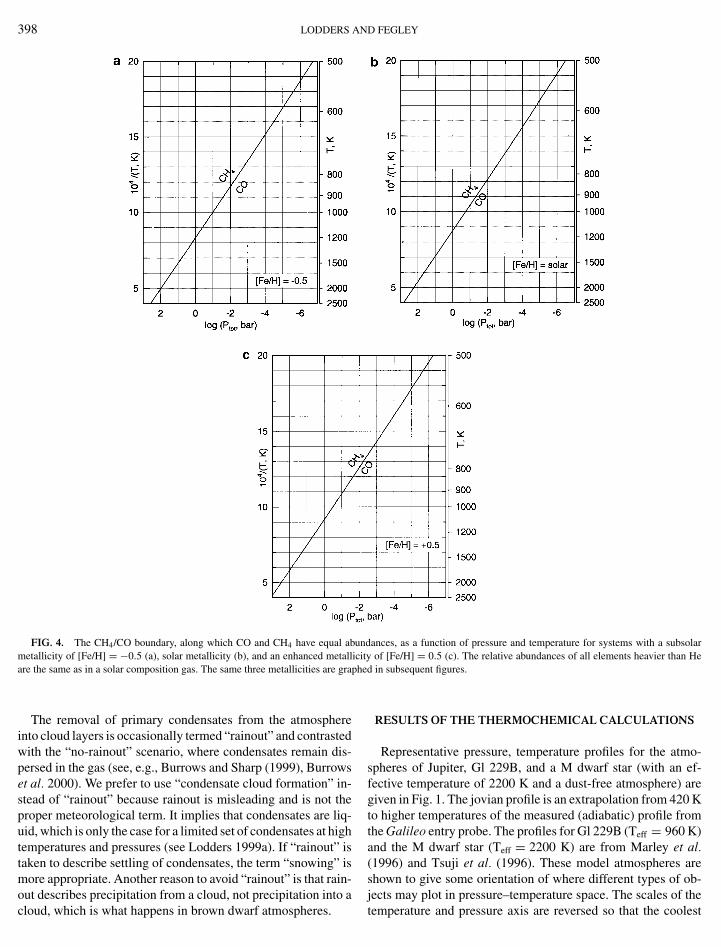
398 LODDERS AND FEGLEY
FIG. 4. The CH4/CO boundary, along which CO and CH4 have equal abundances, as a function of pressure and temperature for systems with a subsolar
metallicity of [Fe/H] = −0.5 (a), solar metallicity (b), and an enhanced metallicity of [Fe/H] = 0.5 (c). The relative abundances of all elements heavier than Heare the same as in a solar composition gas. The same three metallicities are grapheThe removal of primary condensates from the atmosphereinto cloud layers is occasionally termed “rainout” and contrastedwith the “no-rainout” scenario, where condensates remain dis-persed in the gas (see, e.g., Burrows and Sharp (1999), Burrowset al. 2000). We prefer to use “condensate cloud formation” in-stead of “rainout” because rainout is misleading and is not theproper meteorological term. It implies that condensates are liq-uid, which is only the case for a limited set of condensates at hightemperatures and pressures (see Lodders 1999a). If “rainout” istaken to describe settling of condensates, the term “snowing” ismore appropriate. Another reason to avoid “rainout” is that rain-
out describes precipitation from a cloud, not precipitation into acloud, which is what happens in brown dwarf atmospheres.d in subsequent figures.
RESULTS OF THE THERMOCHEMICAL CALCULATIONS
Representative pressure, temperature profiles for the atmo-spheres of Jupiter, Gl 229B, and a M dwarf star (with an ef-fective temperature of 2200 K and a dust-free atmosphere) aregiven in Fig. 1. The jovian profile is an extrapolation from 420 Kto higher temperatures of the measured (adiabatic) profile fromthe Galileo entry probe. The profiles for Gl 229B (Teff = 960 K)and the M dwarf star (Teff = 2200 K) are from Marley et al.(1996) and Tsuji et al. (1996). These model atmospheres areshown to give some orientation of where different types of ob-
jects may plot in pressure–temperature space. The scales of thetemperature and pressure axis are reversed so that the coolest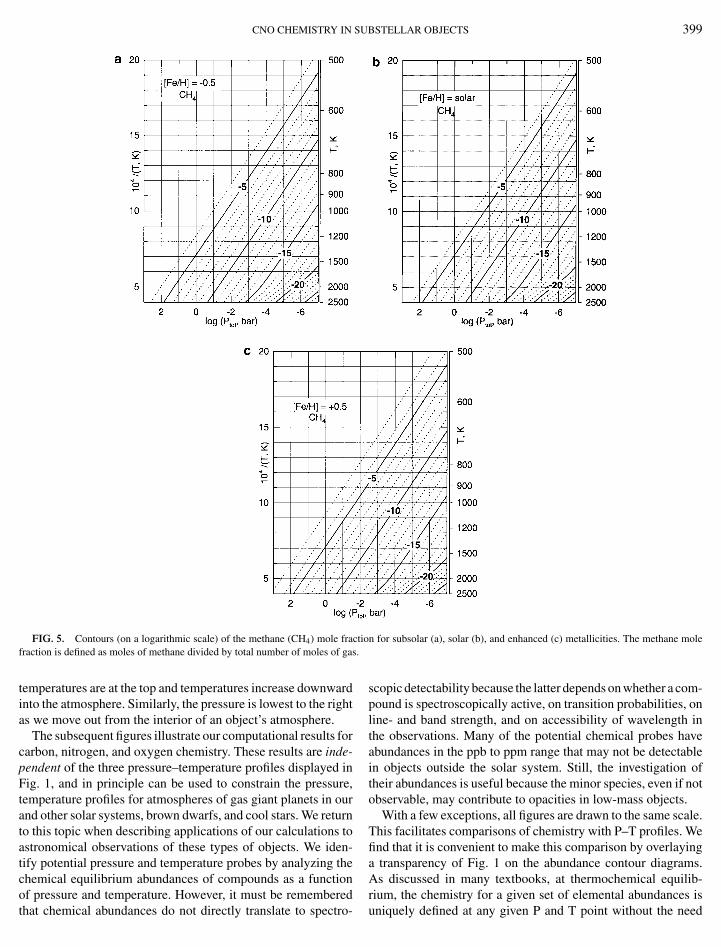
CNO CHEMISTRY IN SUBSTELLAR OBJECTS 399
io
FIG. 5. Contours (on a logarithmic scale) of the methane (CH4) mole fractfraction is defined as moles of methane divided by total number of moles of gas.temperatures are at the top and temperatures increase downwardinto the atmosphere. Similarly, the pressure is lowest to the rightas we move out from the interior of an object’s atmosphere.
The subsequent figures illustrate our computational results forcarbon, nitrogen, and oxygen chemistry. These results are inde-pendent of the three pressure–temperature profiles displayed inFig. 1, and in principle can be used to constrain the pressure,temperature profiles for atmospheres of gas giant planets in ourand other solar systems, brown dwarfs, and cool stars. We returnto this topic when describing applications of our calculations toastronomical observations of these types of objects. We iden-tify potential pressure and temperature probes by analyzing thechemical equilibrium abundances of compounds as a function
of pressure and temperature. However, it must be rememberedthat chemical abundances do not directly translate to spectro-n for subsolar (a), solar (b), and enhanced (c) metallicities. The methane mole
scopic detectability because the latter depends on whether a com-pound is spectroscopically active, on transition probabilities, online- and band strength, and on accessibility of wavelength inthe observations. Many of the potential chemical probes haveabundances in the ppb to ppm range that may not be detectablein objects outside the solar system. Still, the investigation oftheir abundances is useful because the minor species, even if notobservable, may contribute to opacities in low-mass objects.
With a few exceptions, all figures are drawn to the same scale.This facilitates comparisons of chemistry with P–T profiles. Wefind that it is convenient to make this comparison by overlayinga transparency of Fig. 1 on the abundance contour diagrams.As discussed in many textbooks, at thermochemical equilib-
rium, the chemistry for a given set of elemental abundances isuniquely defined at any given P and T point without the need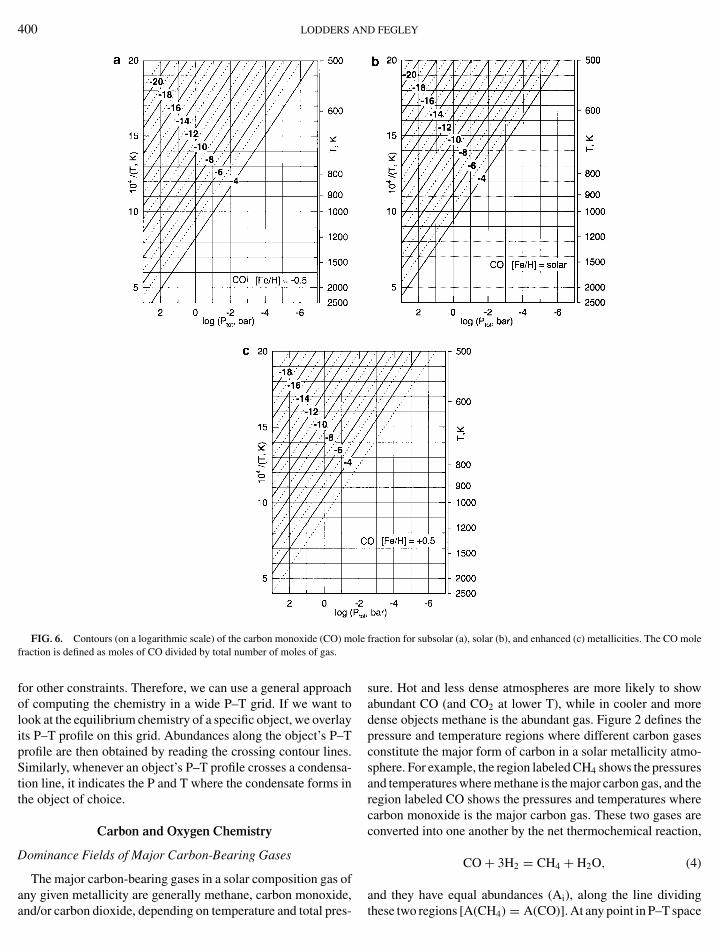
400 LODDERS AND FEGLEY
FIG. 6. Contours (on a logarithmic scale) of the carbon monoxide (CO) mole fraction for subsolar (a), solar (b), and enhanced (c) metallicities. The CO mole
fraction is defined as moles of CO divided by total number of moles of gas.for other constraints. Therefore, we can use a general approachof computing the chemistry in a wide P–T grid. If we want tolook at the equilibrium chemistry of a specific object, we overlayits P–T profile on this grid. Abundances along the object’s P–Tprofile are then obtained by reading the crossing contour lines.Similarly, whenever an object’s P–T profile crosses a condensa-tion line, it indicates the P and T where the condensate forms inthe object of choice.
Carbon and Oxygen Chemistry
Dominance Fields of Major Carbon-Bearing Gases
The major carbon-bearing gases in a solar composition gas of
any given metallicity are generally methane, carbon monoxide,and/or carbon dioxide, depending on temperature and total pres-sure. Hot and less dense atmospheres are more likely to showabundant CO (and CO2 at lower T), while in cooler and moredense objects methane is the abundant gas. Figure 2 defines thepressure and temperature regions where different carbon gasesconstitute the major form of carbon in a solar metallicity atmo-sphere. For example, the region labeled CH4 shows the pressuresand temperatures where methane is the major carbon gas, and theregion labeled CO shows the pressures and temperatures wherecarbon monoxide is the major carbon gas. These two gases areconverted into one another by the net thermochemical reaction,
CO + 3H2 = CH4 + H2O, (4)
and they have equal abundances (Ai), along the line dividingthese two regions [A(CH4) = A(CO)]. At any point in P–T space
CNO CHEMISTRY IN SU
the abundances of these two gases do not drop to zero as thisline is crossed. Methane is present (although no longer domi-nant) inside the region where CO is the major carbon gas, andvice versa. Except at very high temperatures, this line showswhere CH4 and CO are equivalent to about one-half of the to-tal carbon abundance [A(CH4) = A(CO) ≈ 1
2�C]. At very hightemperatures, methane and CO thermally dissociate via the netthermochemical reactions
CH4 = CH3 + H (5)
CO = C + O, (6)
and the methyl radical (CH3) and monatomic carbon vapor (Cgas) become the major forms of carbon. The CH4-CH3-CO triplepoint, where the three gases have equal abundances [A(CH4) =A(CH3) = A(CO)] is at ∼4695 K and ∼8904 bar (the abundanceof each gas equals about one third of the total carbon abundance).The CO-CH3-C triple point [A(CO) = A(CH3) = A(C)] is at∼7718 K and ∼10,000 bars. At higher temperatures, monatomiccarbon vapor thermally ionizes via the net reaction
C = C+ + e−, (7)
and C+ is the major carbon gas. The C-C+ boundary takes ther-mal ionization of other elements and compounds into accountbecause thermal ionization of the alkali metals (and other specieswith ionization potentials lower than that of carbon) contributesto the electron pressure in the equilibrium constant expressionfor reaction (7) and hence affects the position of the C/C+ equalabundance boundary.
At equilibrium at low temperatures, CH4 and CO react to formgraphite via the net thermochemical reactions
CO + CH4 = H2O + H2 + 2C (graphite) (8)
CO + H2 = H2O + C (graphite) (9)
CH4 = 2H2 + C (graphite). (10)
The complex phase relations at low temperatures fall into threeimportant regions: (1) the region where graphite is thermody-namically stable, but not necessarily the most abundant form ofcarbon, (2) the region where graphite is both stable and also themost abundant form of carbon, and (3) the region where CO2 isthe major form of carbon.
The shaded region in Fig. 2 indicates where graphite is ther-modynamically stable and where the thermodynamic activity ofgraphite is unity. The maximum temperature and pressure forgraphite formation at equilibrium in a solar metallicity gas are463 K and 10−7.365 bar. Our calculated graphite stability fieldagrees with the results of Urey (1953) and Lewis et al. (1979)but includes the revisions in solar elemental abundances and inthermodynamic data since the earlier work was done.
The region where graphite is the major form of carbon is
bounded at higher pressures by the graphite =CH4 equal abun-dance line and at lower pressures by either the graphite =COBSTELLAR OBJECTS 401
or graphite =CO2 equal abundance lines. The maximum tem-perature and pressure at which graphite is the most abundantform of carbon (i.e., the graphite-CH4-CO triple point) is 423.1 Kand 10−8.505 bars. Two other triple points inside the graphitestability field are (1) the CO-CH4-CO2 triple point at 407.8 K and10−9.025 bars where A(CO) = A(CH4) = A(CO2) and A(CO) ≈A(CH4) ≈ A(CO2) ≈ 1/5�C ≈ 1
2 A(graphite); and (2) thegraphite-CO-CO2 triple point at 396.6 K and 10−9.754 bars.
The third region where CO2 is the major form of carbonsurrounds the graphite-rich region. Carbon dioxide is producedfrom CO and CH4 via the net thermochemical reactions
CO + H2O = CO2 + H2 (11)
CH4 + 2H2O = CO2 + 4H2. (12)
The net thermochemical reactions
2CO = CO2 + C (graphite) (13)
2CH4 + 2H2O = CO2 + 2H2 + C (graphite) (14)
CO2 + CH4 = 2H2O + 2C (graphite), (15)
which form graphite are also important in this field.
Dominance Fields of Major Oxygen-Bearing Gases
Figure 3 shows the major oxygen-bearing gases as a functionof T and P as done for carbon-bearing gases in Fig. 2. Themajor oxygen-bearing gases in a solar composition gas of anygiven metallicity are water and carbon monoxide, depending ontemperature and total pressure. Generally, H2O gas is the major
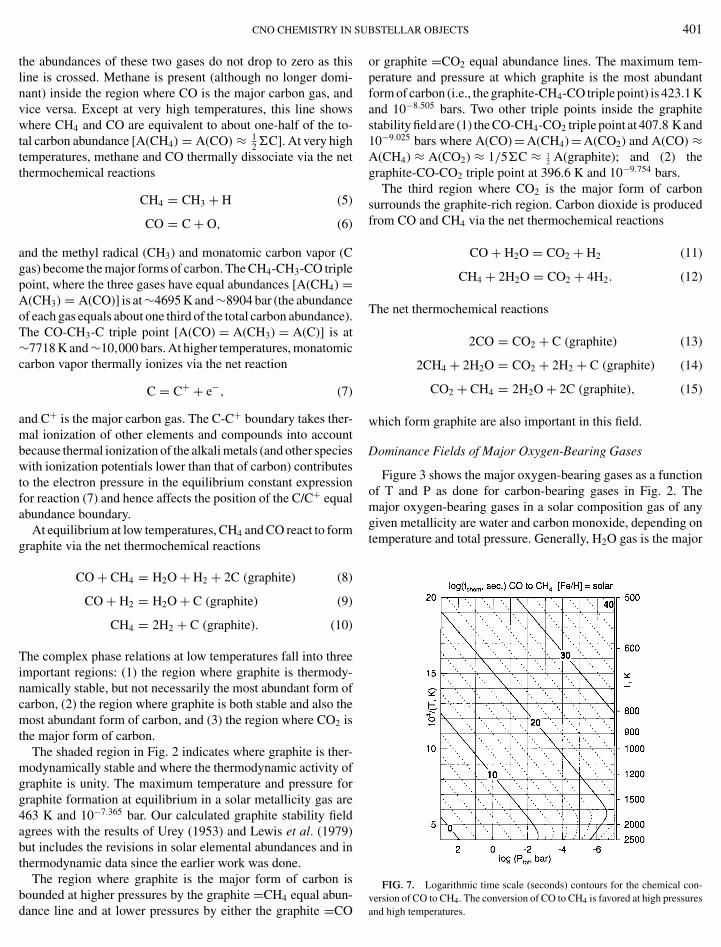
FIG. 7. Logarithmic time scale (seconds) contours for the chemical con-
version of CO to CH4. The conversion of CO to CH4 is favored at high pressuresand high temperatures.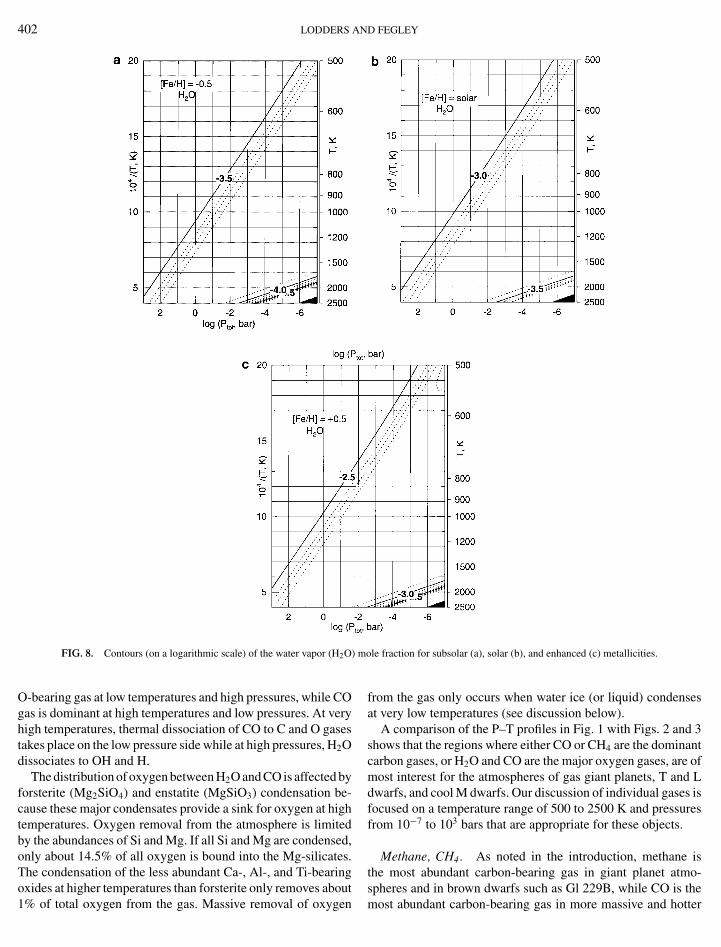
402
oxi1%
LODDERS AND FEGLEY
o
FIG. 8. Contours (on a logarithmic scale) of the water vapor (H2O) mO-bearing gas at low temperatures and high pressures, while COgas is dominant at high temperatures and low pressures. At veryhigh temperatures, thermal dissociation of CO to C and O gasestakes place on the low pressure side while at high pressures, H2Odissociates to OH and H.
The distribution of oxygen between H2O and CO is affected byforsterite (Mg2SiO4) and enstatite (MgSiO3) condensation be-cause these major condensates provide a sink for oxygen at hightemperatures. Oxygen removal from the atmosphere is limitedby the abundances of Si and Mg. If all Si and Mg are condensed,only about 14.5% of all oxygen is bound into the Mg-silicates.The condensation of the less abundant Ca-, Al-, and Ti-bearing
des at higher temperatures than forsterite only removes aboutof total oxygen from the gas. Massive removal of oxygen
le fraction for subsolar (a), solar (b), and enhanced (c) metallicities.
from the gas only occurs when water ice (or liquid) condensesat very low temperatures (see discussion below).
A comparison of the P–T profiles in Fig. 1 with Figs. 2 and 3shows that the regions where either CO or CH4 are the dominantcarbon gases, or H2O and CO are the major oxygen gases, are ofmost interest for the atmospheres of gas giant planets, T and Ldwarfs, and cool M dwarfs. Our discussion of individual gases isfocused on a temperature range of 500 to 2500 K and pressuresfrom 10−7 to 103 bars that are appropriate for these objects.
Methane, CH4. As noted in the introduction, methane isthe most abundant carbon-bearing gas in giant planet atmo-
spheres and in brown dwarfs such as Gl 229B, while CO is themost abundant carbon-bearing gas in more massive and hotter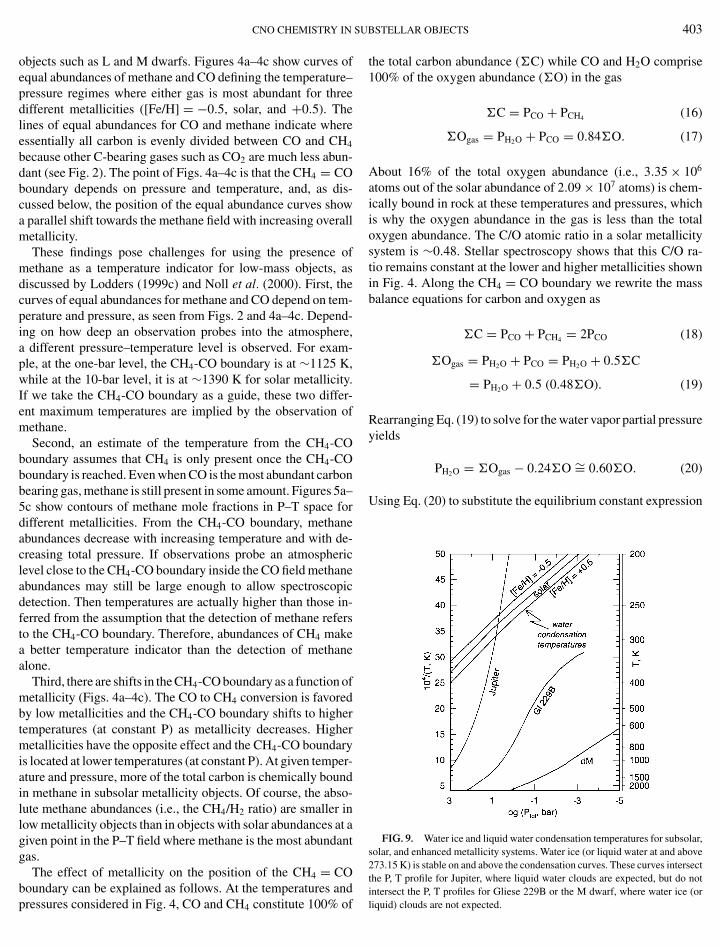
U
CNO CHEMISTRY IN Sobjects such as L and M dwarfs. Figures 4a–4c show curves ofequal abundances of methane and CO defining the temperature–pressure regimes where either gas is most abundant for threedifferent metallicities ([Fe/H] = −0.5, solar, and +0.5). Thelines of equal abundances for CO and methane indicate whereessentially all carbon is evenly divided between CO and CH4
because other C-bearing gases such as CO2 are much less abun-dant (see Fig. 2). The point of Figs. 4a–4c is that the CH4 = COboundary depends on pressure and temperature, and, as dis-cussed below, the position of the equal abundance curves showa parallel shift towards the methane field with increasing overallmetallicity.
These findings pose challenges for using the presence ofmethane as a temperature indicator for low-mass objects, asdiscussed by Lodders (1999c) and Noll et al. (2000). First, thecurves of equal abundances for methane and CO depend on tem-perature and pressure, as seen from Figs. 2 and 4a–4c. Depend-ing on how deep an observation probes into the atmosphere,a different pressure–temperature level is observed. For exam-ple, at the one-bar level, the CH4-CO boundary is at ∼1125 K,while at the 10-bar level, it is at ∼1390 K for solar metallicity.If we take the CH4-CO boundary as a guide, these two differ-ent maximum temperatures are implied by the observation ofmethane.
Second, an estimate of the temperature from the CH4-COboundary assumes that CH4 is only present once the CH4-COboundary is reached. Even when CO is the most abundant carbonbearing gas, methane is still present in some amount. Figures 5a–5c show contours of methane mole fractions in P–T space fordifferent metallicities. From the CH4-CO boundary, methaneabundances decrease with increasing temperature and with de-creasing total pressure. If observations probe an atmosphericlevel close to the CH4-CO boundary inside the CO field methaneabundances may still be large enough to allow spectroscopicdetection. Then temperatures are actually higher than those in-ferred from the assumption that the detection of methane refersto the CH4-CO boundary. Therefore, abundances of CH4 makea better temperature indicator than the detection of methanealone.
Third, there are shifts in the CH4-CO boundary as a function ofmetallicity (Figs. 4a–4c). The CO to CH4 conversion is favoredby low metallicities and the CH4-CO boundary shifts to highertemperatures (at constant P) as metallicity decreases. Highermetallicities have the opposite effect and the CH4-CO boundaryis located at lower temperatures (at constant P). At given temper-ature and pressure, more of the total carbon is chemically boundin methane in subsolar metallicity objects. Of course, the abso-lute methane abundances (i.e., the CH4/H2 ratio) are smaller inlow metallicity objects than in objects with solar abundances at agiven point in the P–T field where methane is the most abundantgas.
The effect of metallicity on the position of the CH4 = CO
boundary can be explained as follows. At the temperatures andpressures considered in Fig. 4, CO and CH4 constitute 100% ofBSTELLAR OBJECTS 403
the total carbon abundance (�C) while CO and H2O comprise100% of the oxygen abundance (�O) in the gas
�C = PCO + PCH4 (16)
�Ogas = PH2O + PCO = 0.84�O. (17)
About 16% of the total oxygen abundance (i.e., 3.35 × 10⁶
atoms out of the solar abundance of 2.09 × 10⁷ atoms) is chem-ically bound in rock at these temperatures and pressures, whichis why the oxygen abundance in the gas is less than the totaloxygen abundance. The C/O atomic ratio in a solar metallicitysystem is ∼0.48. Stellar spectroscopy shows that this C/O ra-tio remains constant at the lower and higher metallicities shownin Fig. 4. Along the CH4 = CO boundary we rewrite the massbalance equations for carbon and oxygen as
�C = PCO + PCH4 = 2PCO (18)
�Ogas = PH2O + PCO = PH2O + 0.5�C
= PH2O + 0.5 (0.48�O). (19)
Rearranging Eq. (19) to solve for the water vapor partial pressureyields
PH2O = �Ogas − 0.24�O ∼= 0.60�O. (20)
Using Eq. (20) to substitute the equilibrium constant expression
FIG. 9. Water ice and liquid water condensation temperatures for subsolar,solar, and enhanced metallicity systems. Water ice (or liquid water at and above273.15 K) is stable on and above the condensation curves. These curves intersectthe P, T profile for Jupiter, where liquid water clouds are expected, but do not
intersect the P, T profiles for Gliese 229B or the M dwarf, where water ice (orliquid) clouds are not expected.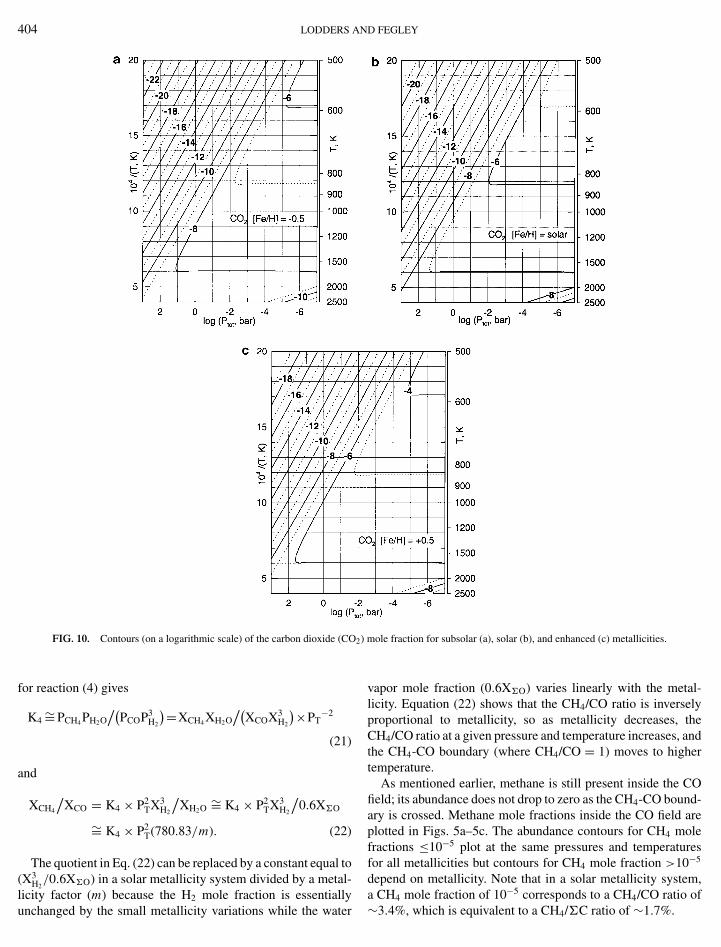
40
liun
4 LODDERS AND FEGLEY
)
FIG. 10. Contours (on a logarithmic scale) of the carbon dioxide (CO2for reaction (4) gives
K4∼= PCH4 PH2O
/(PCOP3
H2
)=XCH4 XH2O/(
XCOX3H2
)×PT−2
(21)
and
XCH4
/XCO = K4 × P2
TX3H2
/XH2O
∼= K4 × P2TX3
H2
/0.6X�O
∼= K4 × P2T(780.83/m). (22)
The quotient in Eq. (22) can be replaced by a constant equal to(X3
H2/0.6X�O) in a solar metallicity system divided by a metal-
city factor (m) because the H2 mole fraction is essentiallychanged by the small metallicity variations while the water
mole fraction for subsolar (a), solar (b), and enhanced (c) metallicities.
vapor mole fraction (0.6X�O) varies linearly with the metal-licity. Equation (22) shows that the CH4/CO ratio is inverselyproportional to metallicity, so as metallicity decreases, theCH4/CO ratio at a given pressure and temperature increases, andthe CH4-CO boundary (where CH4/CO = 1) moves to highertemperature.
As mentioned earlier, methane is still present inside the COfield; its abundance does not drop to zero as the CH4-CO bound-ary is crossed. Methane mole fractions inside the CO field areplotted in Figs. 5a–5c. The abundance contours for CH4 molefractions ≤10−5 plot at the same pressures and temperaturesfor all metallicities but contours for CH4 mole fraction >10−5
depend on metallicity. Note that in a solar metallicity system,−5
a CH4 mole fraction of 10 corresponds to a CH4/CO ratio of∼3.4%, which is equivalent to a CH4/�C ratio of ∼1.7%.
05
CNO CHEMISTRY IN SUBSTELLAR OBJECTS 4)
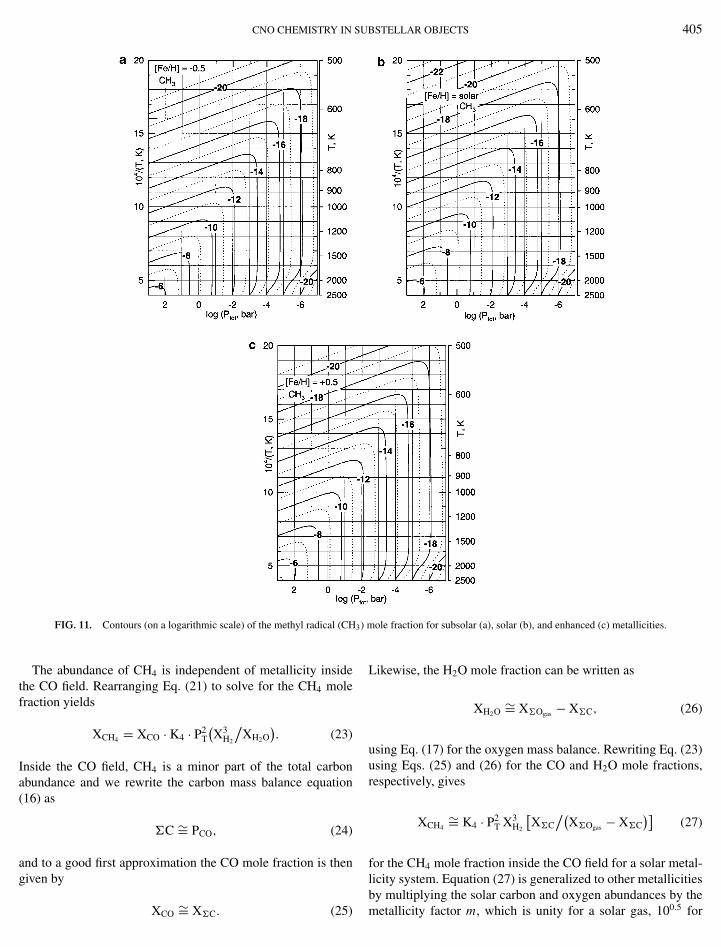
FIG. 11. Contours (on a logarithmic scale) of the methyl radical (CH3The abundance of CH4 is independent of metallicity insidethe CO field. Rearranging Eq. (21) to solve for the CH4 molefraction yields
XCH4 = XCO · K4 · P2T
(X3
H2
/XH2O
). (23)
Inside the CO field, CH4 is a minor part of the total carbonabundance and we rewrite the carbon mass balance equation(16) as
�C ∼= PCO, (24)
and to a good first approximation the CO mole fraction is thengiven by
XCO∼= X�C. (25)
mole fraction for subsolar (a), solar (b), and enhanced (c) metallicities.
Likewise, the H2O mole fraction can be written as
XH2O∼= X�Ogas − X�C, (26)
using Eq. (17) for the oxygen mass balance. Rewriting Eq. (23)using Eqs. (25) and (26) for the CO and H2O mole fractions,respectively, gives
XCH4∼= K4 · P2
T X3H2
[X�C
/(X�Ogas − X�C
)](27)
for the CH4 mole fraction inside the CO field for a solar metal-licity system. Equation (27) is generalized to other metallicities
by multiplying the solar carbon and oxygen abundances by themetallicity factor m, which is unity for a solar gas, 100.5 for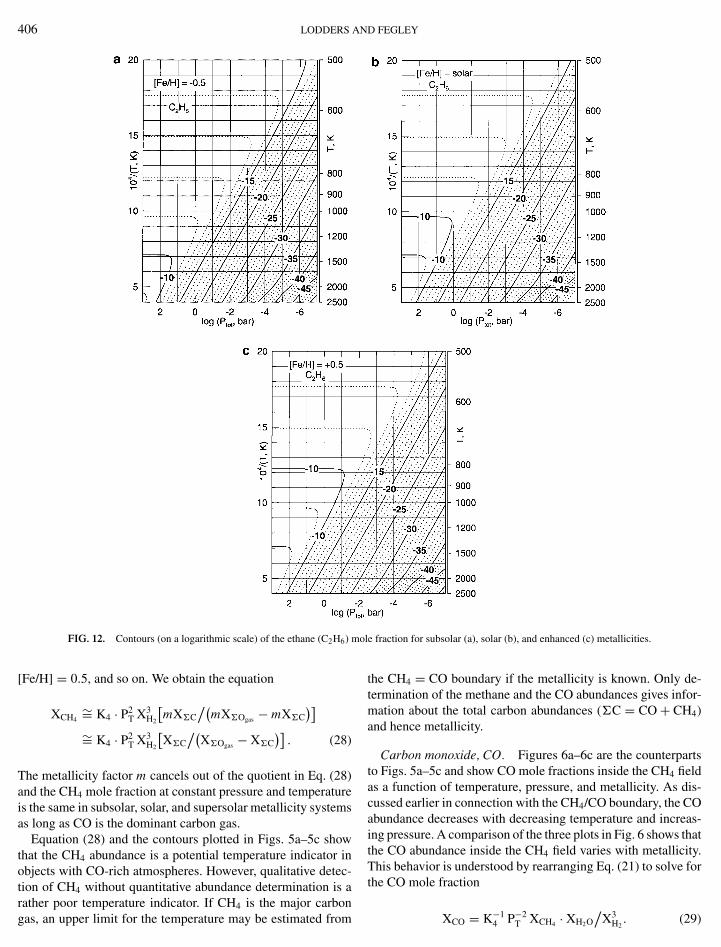
406
rathergas, a
LODDERS AND FEGLEY
o
FIG. 12. Contours (on a logarithmic scale) of the ethane (C2H6) m[Fe/H] = 0.5, and so on. We obtain the equation
XCH4∼= K4 · P2
T X3H2
[mX�C
/(mX�Ogas − mX�C
)]
∼= K4 · P2T X3
H2
[X�C
/(X�Ogas − X�C
)]. (28)
The metallicity factor m cancels out of the quotient in Eq. (28)and the CH4 mole fraction at constant pressure and temperatureis the same in subsolar, solar, and supersolar metallicity systemsas long as CO is the dominant carbon gas.
Equation (28) and the contours plotted in Figs. 5a–5c showthat the CH4 abundance is a potential temperature indicator inobjects with CO-rich atmospheres. However, qualitative detec-tion of CH4 without quantitative abundance determination is a
poor temperature indicator. If CH4 is the major carbonn upper limit for the temperature may be estimated from
le fraction for subsolar (a), solar (b), and enhanced (c) metallicities.
the CH4 = CO boundary if the metallicity is known. Only de-termination of the methane and the CO abundances gives infor-mation about the total carbon abundances (�C = CO + CH4)and hence metallicity.
Carbon monoxide, CO. Figures 6a–6c are the counterpartsto Figs. 5a–5c and show CO mole fractions inside the CH4 fieldas a function of temperature, pressure, and metallicity. As dis-cussed earlier in connection with the CH4/CO boundary, the COabundance decreases with decreasing temperature and increas-ing pressure. A comparison of the three plots in Fig. 6 shows thatthe CO abundance inside the CH4 field varies with metallicity.This behavior is understood by rearranging Eq. (21) to solve forthe CO mole fraction
XCO = K−14 P−2
T XCH4 · XH2O/
X3H2
. (29)
407
Subsmeta
CNO CHEMISTRY IN SUBSTELLAR OBJECTS
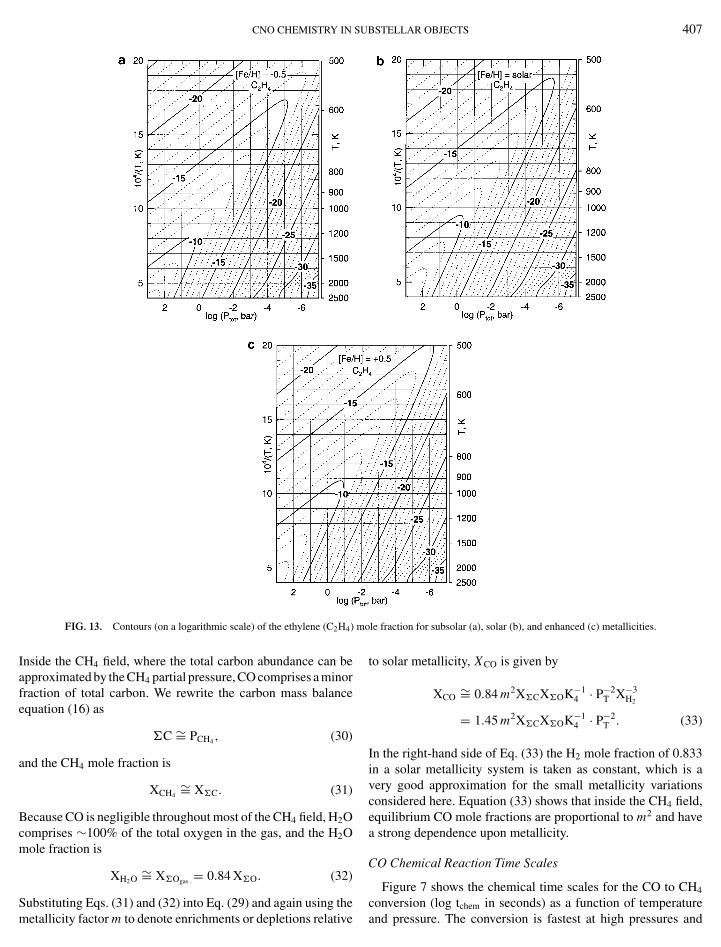
FIG. 13. Contours (on a logarithmic scale) of the ethylene (C2H4) m
Inside the CH4 field, where the total carbon abundance can beapproximated by the CH4 partial pressure, CO comprises a minorfraction of total carbon. We rewrite the carbon mass balanceequation (16) as
�C ∼= PCH4 , (30)
and the CH4 mole fraction is
XCH4∼= X�C. (31)
Because CO is negligible throughout most of the CH4 field, H2Ocomprises ∼100% of the total oxygen in the gas, and the H2Omole fraction is
XH2O∼= X�Ogas = 0.84 X�O. (32)
tituting Eqs. (31) and (32) into Eq. (29) and again using thellicity factor m to denote enrichments or depletions relative
ole fraction for subsolar (a), solar (b), and enhanced (c) metallicities.
to solar metallicity, XCO is given by
XCO∼= 0.84 m2X�CX�OK−1
4 · P−2T X−3
H2
= 1.45 m2X�CX�OK−14 · P−2
T . (33)
In the right-hand side of Eq. (33) the H2 mole fraction of 0.833in a solar metallicity system is taken as constant, which is avery good approximation for the small metallicity variationsconsidered here. Equation (33) shows that inside the CH4 field,equilibrium CO mole fractions are proportional to m2 and havea strong dependence upon metallicity.
CO Chemical Reaction Time Scales
Figure 7 shows the chemical time scales for the CO to CH4
conversion (log tchem in seconds) as a function of temperatureand pressure. The conversion is fastest at high pressures and
408
tuneatm
LODDERS AND FEGLEY
m
FIG. 14. Contours (on a logarithmic scale) of the acetylene (C2H2)temperatures, but is very slow at low temperatures and low pres-sures. The details for the calculation of these reaction time scalesare based on the model by Prinn and Barshay (1977) and aregiven in Fegley and Lodders (1994). We adopted this kineticscheme here because the results well reproduce the observedCO abundances for Jupiter and Saturn.
Carbon monoxide is observed in the upper atmospheres ofJupiter and Saturn at ∼1 part per billion by volume, and in theupper atmosphere of Neptune at ∼0.65 part per million by vol-ume (Tables 8.3, 9.7, and 11.3 in Lodders and Fegley 1998).As first shown by Prinn and Barshay (1977), the observed COabundances are many orders of magnitude higher than its chem-ical equilibrium abundance at the observed level. The presenceof CO in the upper atmospheres of Jupiter, Saturn, and Nep-
is probably due to rapid vertical mixing from the deepospheres where the equilibrium abundances of CO is much
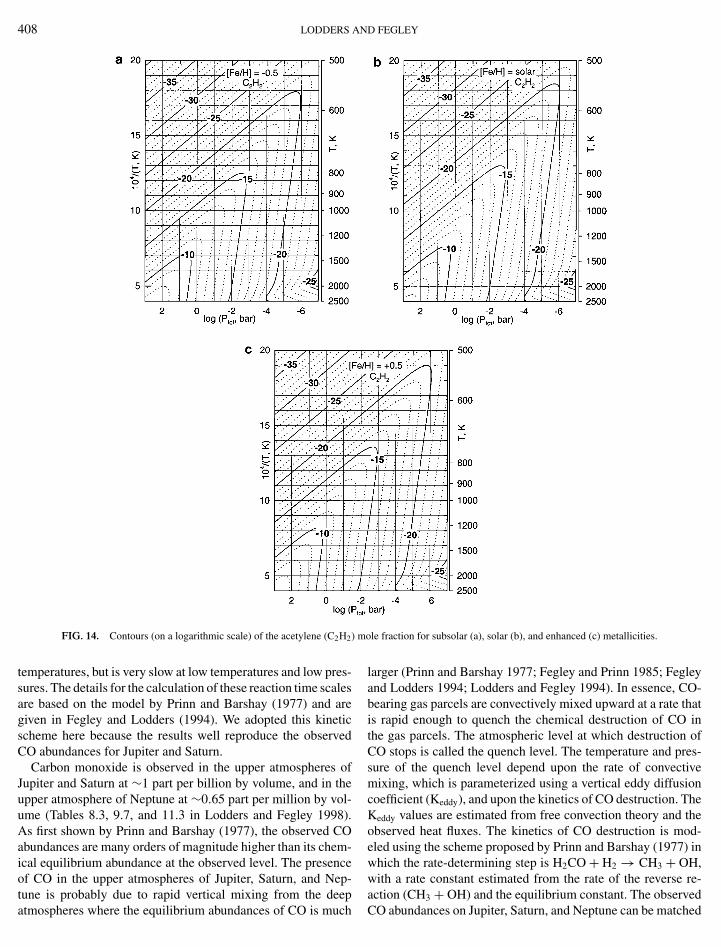
ole fraction for subsolar (a), solar (b), and enhanced (c) metallicities.
larger (Prinn and Barshay 1977; Fegley and Prinn 1985; Fegleyand Lodders 1994; Lodders and Fegley 1994). In essence, CO-bearing gas parcels are convectively mixed upward at a rate thatis rapid enough to quench the chemical destruction of CO inthe gas parcels. The atmospheric level at which destruction ofCO stops is called the quench level. The temperature and pres-sure of the quench level depend upon the rate of convectivemixing, which is parameterized using a vertical eddy diffusioncoefficient (Keddy), and upon the kinetics of CO destruction. TheKeddy values are estimated from free convection theory and theobserved heat fluxes. The kinetics of CO destruction is mod-eled using the scheme proposed by Prinn and Barshay (1977) inwhich the rate-determining step is H2CO + H2 → CH3 + OH,with a rate constant estimated from the rate of the reverse re-
action (CH3 + OH) and the equilibrium constant. The observedCO abundances on Jupiter, Saturn, and Neptune can be matched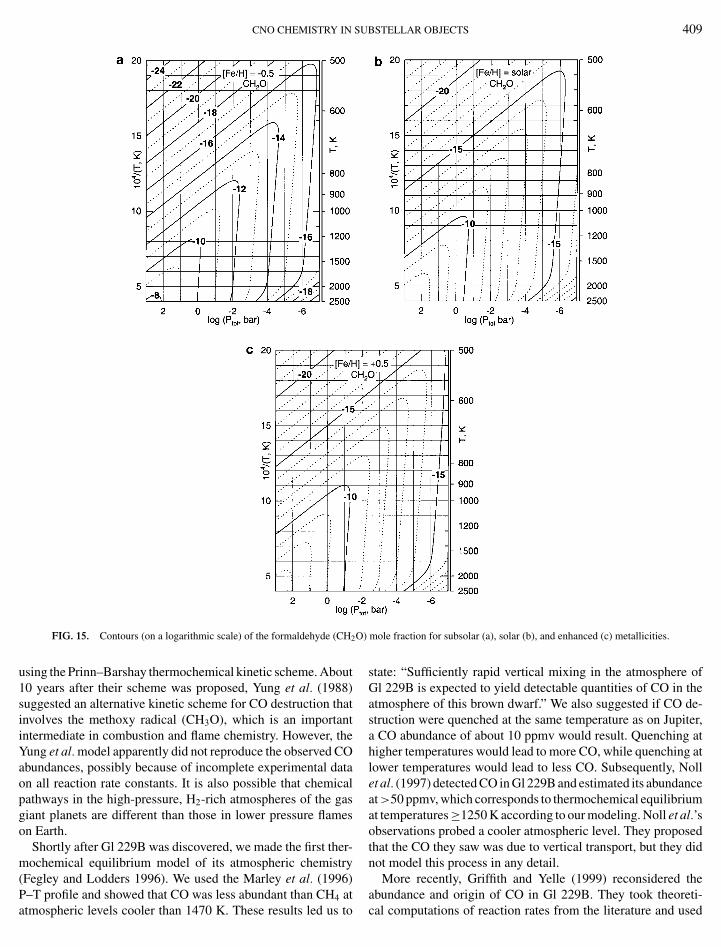
409
P–atm
CNO CHEMISTRY IN SUBSTELLAR OBJECTS
)
FIG. 15. Contours (on a logarithmic scale) of the formaldehyde (CH2Ousing the Prinn–Barshay thermochemical kinetic scheme. About10 years after their scheme was proposed, Yung et al. (1988)suggested an alternative kinetic scheme for CO destruction thatinvolves the methoxy radical (CH3O), which is an importantintermediate in combustion and flame chemistry. However, theYung et al. model apparently did not reproduce the observed COabundances, possibly because of incomplete experimental dataon all reaction rate constants. It is also possible that chemicalpathways in the high-pressure, H2-rich atmospheres of the gasgiant planets are different than those in lower pressure flameson Earth.
Shortly after Gl 229B was discovered, we made the first ther-mochemical equilibrium model of its atmospheric chemistry(Fegley and Lodders 1996). We used the Marley et al. (1996)
T profile and showed that CO was less abundant than CH4 atospheric levels cooler than 1470 K. These results led us to
mole fraction for subsolar (a), solar (b), and enhanced (c) metallicities.
state: “Sufficiently rapid vertical mixing in the atmosphere ofGl 229B is expected to yield detectable quantities of CO in theatmosphere of this brown dwarf.” We also suggested if CO de-struction were quenched at the same temperature as on Jupiter,a CO abundance of about 10 ppmv would result. Quenching athigher temperatures would lead to more CO, while quenching atlower temperatures would lead to less CO. Subsequently, Nollet al. (1997) detected CO in Gl 229B and estimated its abundanceat >50 ppmv, which corresponds to thermochemical equilibriumat temperatures ≥1250 K according to our modeling. Noll et al.’sobservations probed a cooler atmospheric level. They proposedthat the CO they saw was due to vertical transport, but they didnot model this process in any detail.
More recently, Griffith and Yelle (1999) reconsidered the
abundance and origin of CO in Gl 229B. They took theoreti-cal computations of reaction rates from the literature and used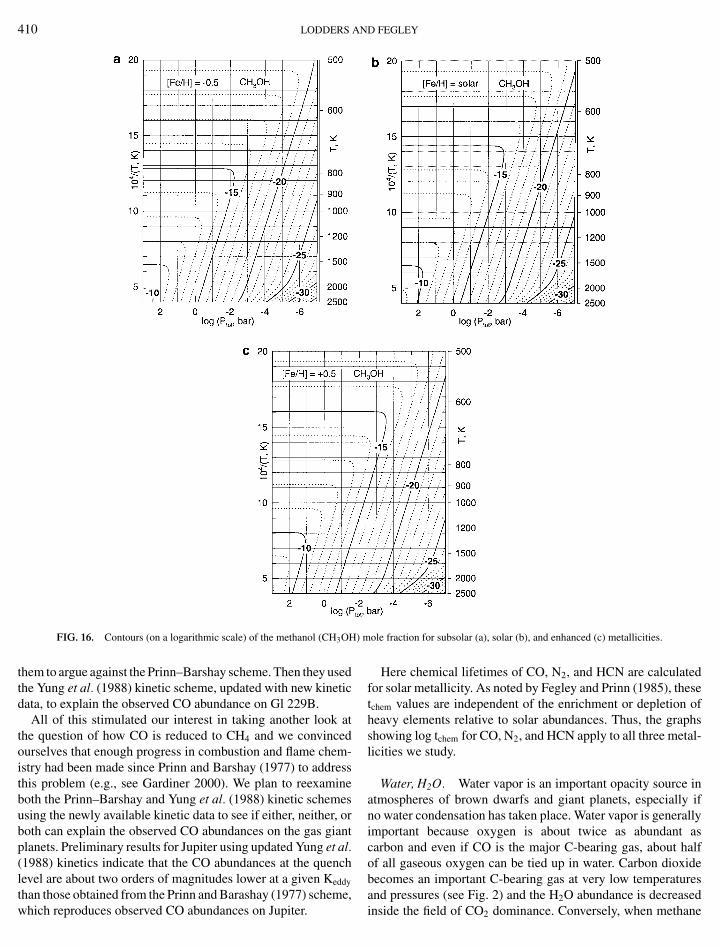
41
thawh
0 LODDERS AND FEGLEY
)
FIG. 16. Contours (on a logarithmic scale) of the methanol (CH3OHthem to argue against the Prinn–Barshay scheme. Then they usedthe Yung et al. (1988) kinetic scheme, updated with new kineticdata, to explain the observed CO abundance on Gl 229B.
All of this stimulated our interest in taking another look atthe question of how CO is reduced to CH4 and we convincedourselves that enough progress in combustion and flame chem-istry had been made since Prinn and Barshay (1977) to addressthis problem (e.g., see Gardiner 2000). We plan to reexamineboth the Prinn–Barshay and Yung et al. (1988) kinetic schemesusing the newly available kinetic data to see if either, neither, orboth can explain the observed CO abundances on the gas giantplanets. Preliminary results for Jupiter using updated Yung et al.(1988) kinetics indicate that the CO abundances at the quenchlevel are about two orders of magnitudes lower at a given Keddy
n those obtained from the Prinn and Barashay (1977) scheme,ich reproduces observed CO abundances on Jupiter.
mole fraction for subsolar (a), solar (b), and enhanced (c) metallicities.
Here chemical lifetimes of CO, N2, and HCN are calculatedfor solar metallicity. As noted by Fegley and Prinn (1985), thesetchem values are independent of the enrichment or depletion ofheavy elements relative to solar abundances. Thus, the graphsshowing log tchem for CO, N2, and HCN apply to all three metal-licities we study.
Water, H2O. Water vapor is an important opacity source inatmospheres of brown dwarfs and giant planets, especially ifno water condensation has taken place. Water vapor is generallyimportant because oxygen is about twice as abundant ascarbon and even if CO is the major C-bearing gas, about halfof all gaseous oxygen can be tied up in water. Carbon dioxidebecomes an important C-bearing gas at very low temperatures
and pressures (see Fig. 2) and the H2O abundance is decreasedinside the field of CO2 dominance. Conversely, when methane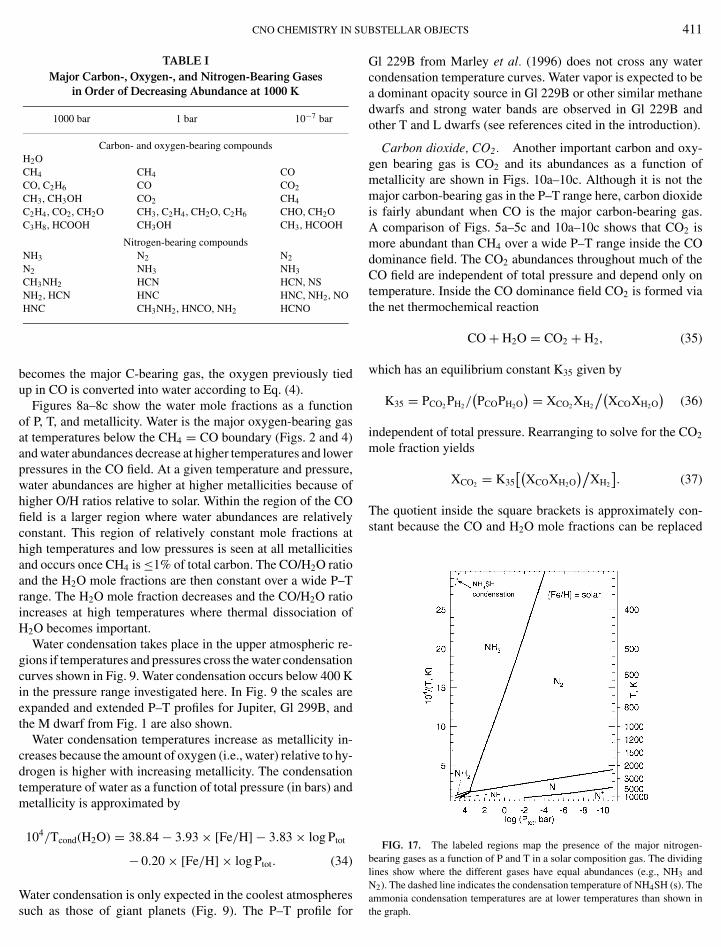
U
CNO CHEMISTRY IN STABLE IMajor Carbon-, Oxygen-, and Nitrogen-Bearing Gases
in Order of Decreasing Abundance at 1000 K
1000 bar 1 bar 10−7 bar
Carbon- and oxygen-bearing compoundsH2OCH4 CH4 COCO, C2H6 CO CO2
CH3, CH3OH CO2 CH4
C2H4, CO2, CH2O CH3, C2H4, CH2O, C2H6 CHO, CH2OC3H8, HCOOH CH3OH CH3, HCOOH
Nitrogen-bearing compoundsNH3 N2 N2
N2 NH3 NH3
CH3NH2 HCN HCN, NSNH2, HCN HNC HNC, NH2, NOHNC CH3NH2, HNCO, NH2 HCNO
becomes the major C-bearing gas, the oxygen previously tiedup in CO is converted into water according to Eq. (4).
Figures 8a–8c show the water mole fractions as a functionof P, T, and metallicity. Water is the major oxygen-bearing gasat temperatures below the CH4 = CO boundary (Figs. 2 and 4)and water abundances decrease at higher temperatures and lowerpressures in the CO field. At a given temperature and pressure,water abundances are higher at higher metallicities because ofhigher O/H ratios relative to solar. Within the region of the COfield is a larger region where water abundances are relativelyconstant. This region of relatively constant mole fractions athigh temperatures and low pressures is seen at all metallicitiesand occurs once CH4 is ≤1% of total carbon. The CO/H2O ratioand the H2O mole fractions are then constant over a wide P–Trange. The H2O mole fraction decreases and the CO/H2O ratioincreases at high temperatures where thermal dissociation ofH2O becomes important.
Water condensation takes place in the upper atmospheric re-gions if temperatures and pressures cross the water condensationcurves shown in Fig. 9. Water condensation occurs below 400 Kin the pressure range investigated here. In Fig. 9 the scales areexpanded and extended P–T profiles for Jupiter, Gl 299B, andthe M dwarf from Fig. 1 are also shown.
Water condensation temperatures increase as metallicity in-creases because the amount of oxygen (i.e., water) relative to hy-drogen is higher with increasing metallicity. The condensationtemperature of water as a function of total pressure (in bars) andmetallicity is approximated by
104/Tcond(H2O) = 38.84 − 3.93 × [Fe/H] − 3.83 × log Ptot
− 0.20 × [Fe/H] × log Ptot. (34)
Water condensation is only expected in the coolest atmospheressuch as those of giant planets (Fig. 9). The P–T profile for
BSTELLAR OBJECTS 411
Gl 229B from Marley et al. (1996) does not cross any watercondensation temperature curves. Water vapor is expected to bea dominant opacity source in Gl 229B or other similar methanedwarfs and strong water bands are observed in Gl 229B andother T and L dwarfs (see references cited in the introduction).
Carbon dioxide, CO2. Another important carbon and oxy-gen bearing gas is CO2 and its abundances as a function ofmetallicity are shown in Figs. 10a–10c. Although it is not themajor carbon-bearing gas in the P–T range here, carbon dioxideis fairly abundant when CO is the major carbon-bearing gas.A comparison of Figs. 5a–5c and 10a–10c shows that CO2 ismore abundant than CH4 over a wide P–T range inside the COdominance field. The CO2 abundances throughout much of theCO field are independent of total pressure and depend only ontemperature. Inside the CO dominance field CO2 is formed viathe net thermochemical reaction
CO + H2O = CO2 + H2, (35)
which has an equilibrium constant K35 given by
K35 = PCO2 PH2/(PCOPH2O
) = XCO2 XH2
/(XCOXH2O
)(36)
independent of total pressure. Rearranging to solve for the CO2
mole fraction yields
XCO2 = K35[(
XCOXH2O)/
XH2
]. (37)
The quotient inside the square brackets is approximately con-stant because the CO and H2O mole fractions can be replaced
FIG. 17. The labeled regions map the presence of the major nitrogen-bearing gases as a function of P and T in a solar composition gas. The dividinglines show where the different gases have equal abundances (e.g., NH3 andN2). The dashed line indicates the condensation temperature of NH4SH (s). Theammonia condensation temperatures are at lower temperatures than shown in
the graph.
412 LODDERS AND FEGLEY
FIG. 18. The NH3 = N2 boundary, along which NH3 and N2 have equal abundances, as a function of pressure and temperature for subsolar (a), solar (b), and
enhanced (c) metallicities.by Eqs. (25) and (26) to give
XCO2 = K35X�C(X�Ogas − X�C
)/XH2 . (38)
Equation (38) is a function of temperature only until sufficientlyhigh temperatures where H2O thermal dissociation becomes ap-preciable.
The inflection points on the CO2 mole fraction contours occuralong the CH4 = CO boundary. The CO2 mole fractions are afunction of both temperature and pressure inside the field whereCH4 is the dominant C-bearing gas because there CO2 is formedvia the net thermochemical reaction
CH4 + 2H2O = CO2 + 4H2. (39)
The equilibrium constant (K39) for reaction (39) is
K39 = PCO2 P4H2
/(PCH4 P2
H2O
)= XCO2 X4H2
/(XCH4 X2
H2O
)P2
T.
(40)
Rearranging to find the CO2 mole fraction and substituting forXCH4 and XH2O using the mass balance equations (31) and (32)gives
XCO2 = K39X�C(0.84X�O)2/(0.833)4 · P−2T
∼= 1.465 K39X�CX2�Ogas
· P−2T . (41)
Equation (41) shows that the CO2 mole fraction is inverselyproportional to (PT)2 and varies with temperature inside the CH4

413
CNO CHEMISTRY IN SUBSTELLAR OBJECTSFIG. 19. Contours (on a logarithmic scale) of the ammonia (NH3) m
field. The CO2 mole fractions shown in Figs. 10a–10c are a po-tential temperature indicator for early L and M dwarfs, providedthat the overall metallicity is known because higher metallici-ties favor higher CO2 abundances for a given temperature andpressure.
Methyl, CH3. The methyl radical is among the next mostabundant hydrocarbons after methane. Methyl mole fractionsare shown in Figs. 11a–11c as a function of metallicity. Insidethe CH4 field, CH3 radicals are formed by thermal dissociationof CH4
CH4 = CH3 + H, (42)
and their abundance is inversely proportional to total pressure
XCH3 = K42XCH4
/XH · P−1
T . (43)
ole fraction for subsolar (a), solar (b), and enhanced (c) metallicities.
Inside the CO field, CH3 radicals form via the net reaction
CO + 3H2 = H2O + CH3 + H (44)
and their abundance is proportional to total pressure
XCH3 = K44XCOX3H2
/(XH2OXH
) · PT
∼= 0.578 · K44X�C/(X�Ogas − X�C
) · PT/XH. (45)
The CH3 abundance contours are relatively insensitive to tem-perature and are nearly parallel to isobars inside the CO field,and are potential pressure indicators for early L and M dwarfs ofknown metallicity. Methyl radicals formed by solar UV driven
photochemistry have been observed in the upper atmospheresof Saturn and Neptune (Bezard et al. 1998, 1999) at column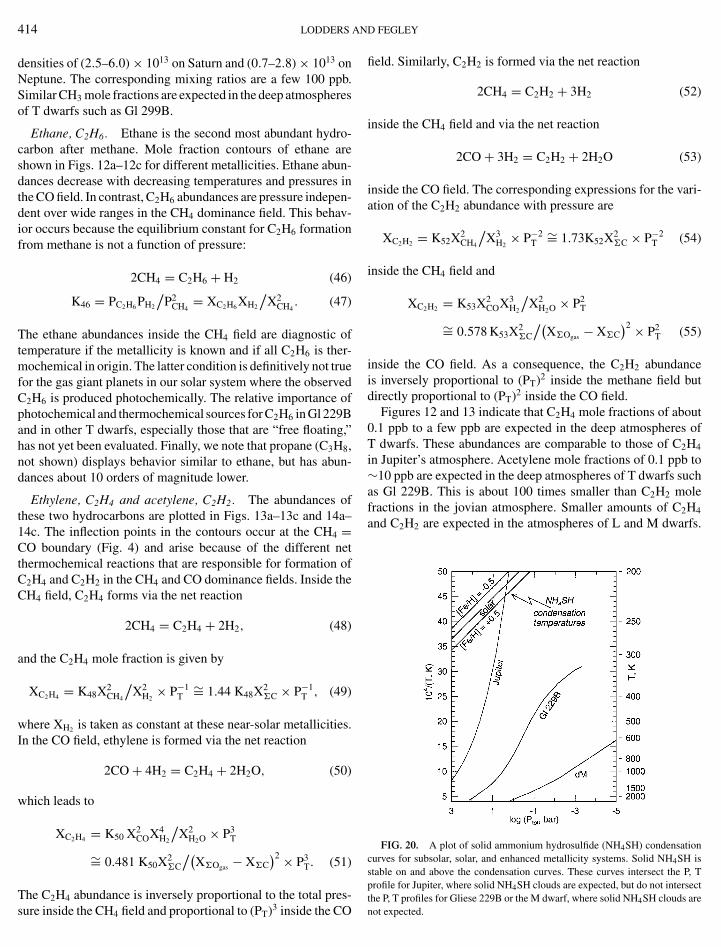
N
414 LODDERS Adensities of (2.5–6.0) × 1013 on Saturn and (0.7–2.8) × 1013 onNeptune. The corresponding mixing ratios are a few 100 ppb.Similar CH3 mole fractions are expected in the deep atmospheresof T dwarfs such as Gl 299B.
Ethane, C2H6. Ethane is the second most abundant hydro-carbon after methane. Mole fraction contours of ethane areshown in Figs. 12a–12c for different metallicities. Ethane abun-dances decrease with decreasing temperatures and pressures inthe CO field. In contrast, C2H6 abundances are pressure indepen-dent over wide ranges in the CH4 dominance field. This behav-ior occurs because the equilibrium constant for C2H6 formationfrom methane is not a function of pressure:
2CH4 = C2H6 + H2 (46)
K46 = PC2H6 PH2
/P2
CH4= XC2H6 XH2
/X2
CH4. (47)
The ethane abundances inside the CH4 field are diagnostic oftemperature if the metallicity is known and if all C2H6 is ther-mochemical in origin. The latter condition is definitively not truefor the gas giant planets in our solar system where the observedC2H6 is produced photochemically. The relative importance ofphotochemical and thermochemical sources for C2H6 in Gl 229Band in other T dwarfs, especially those that are “free floating,”has not yet been evaluated. Finally, we note that propane (C3H8,not shown) displays behavior similar to ethane, but has abun-dances about 10 orders of magnitude lower.
Ethylene, C2H4 and acetylene, C2H2. The abundances ofthese two hydrocarbons are plotted in Figs. 13a–13c and 14a–14c. The inflection points in the contours occur at the CH4 =CO boundary (Fig. 4) and arise because of the different netthermochemical reactions that are responsible for formation ofC2H4 and C2H2 in the CH4 and CO dominance fields. Inside theCH4 field, C2H4 forms via the net reaction
2CH4 = C2H4 + 2H2, (48)
and the C2H4 mole fraction is given by
XC2H4 = K48X2CH4
/X2
H2× P−1
T∼= 1.44 K48X2
�C × P−1T , (49)
where XH2 is taken as constant at these near-solar metallicities.In the CO field, ethylene is formed via the net reaction
2CO + 4H2 = C2H4 + 2H2O, (50)
which leads to
XC2H4 = K50 X2COX4
H2
/X2
H2O × P3T
∼= 0.481 K50X2�C
/(X�Ogas − X�C
)2 × P3T. (51)
The C2H4 abundance is inversely proportional to the total pres-sure inside the CH4 field and proportional to (PT)3 inside the CO
D FEGLEY
field. Similarly, C2H2 is formed via the net reaction
2CH4 = C2H2 + 3H2 (52)
inside the CH4 field and via the net reaction
2CO + 3H2 = C2H2 + 2H2O (53)
inside the CO field. The corresponding expressions for the vari-ation of the C2H2 abundance with pressure are
XC2H2 = K52X2CH4
/X3
H2× P−2
T∼= 1.73K52X2
�C × P−2T (54)
inside the CH4 field and
XC2H2 = K53X2COX3
H2
/X2
H2O × P2T
∼= 0.578 K53X2�C
/(X�Ogas − X�C
)2 × P2T (55)
inside the CO field. As a consequence, the C2H2 abundanceis inversely proportional to (PT)2 inside the methane field butdirectly proportional to (PT)2 inside the CO field.
Figures 12 and 13 indicate that C2H4 mole fractions of about0.1 ppb to a few ppb are expected in the deep atmospheres ofT dwarfs. These abundances are comparable to those of C2H4
in Jupiter’s atmosphere. Acetylene mole fractions of 0.1 ppb to∼10 ppb are expected in the deep atmospheres of T dwarfs suchas Gl 229B. This is about 100 times smaller than C2H2 molefractions in the jovian atmosphere. Smaller amounts of C2H4
and C2H2 are expected in the atmospheres of L and M dwarfs.
FIG. 20. A plot of solid ammonium hydrosulfide (NH4SH) condensationcurves for subsolar, solar, and enhanced metallicity systems. Solid NH4SH isstable on and above the condensation curves. These curves intersect the P, Tprofile for Jupiter, where solid NH4SH clouds are expected, but do not intersect
the P, T profiles for Gliese 229B or the M dwarf, where solid NH4SH clouds arenot expected.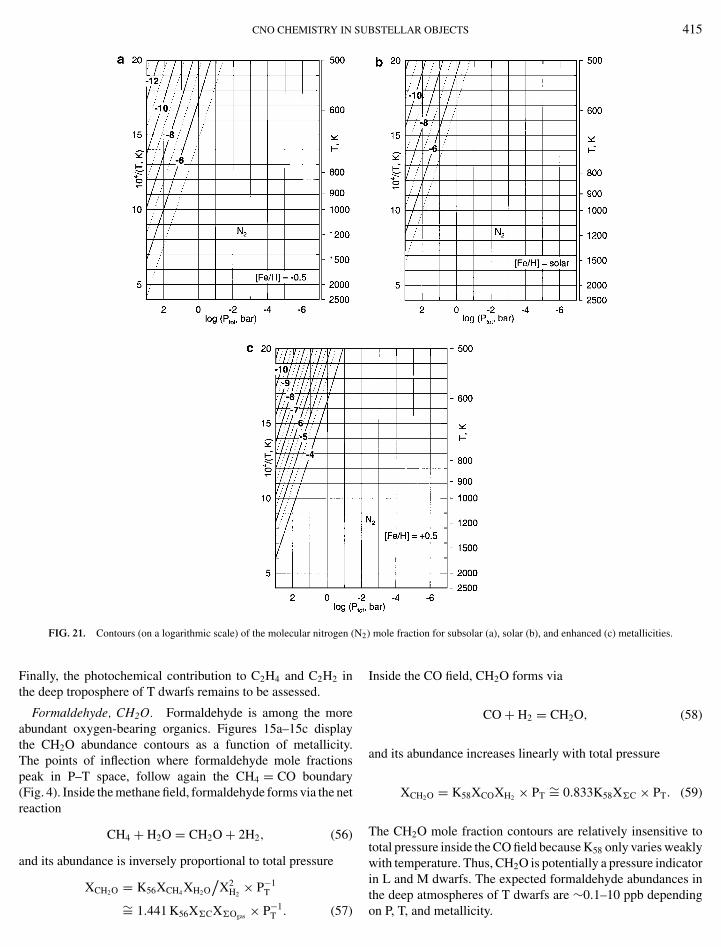
15
CNO CHEMISTRY IN SUBSTELLAR OBJECTS 42
FIG. 21. Contours (on a logarithmic scale) of the molecular nitrogen (NFinally, the photochemical contribution to C2H4 and C2H2 inthe deep troposphere of T dwarfs remains to be assessed.
Formaldehyde, CH2O. Formaldehyde is among the moreabundant oxygen-bearing organics. Figures 15a–15c displaythe CH2O abundance contours as a function of metallicity.The points of inflection where formaldehyde mole fractionspeak in P–T space, follow again the CH4 = CO boundary(Fig. 4). Inside the methane field, formaldehyde forms via the netreaction
CH4 + H2O = CH2O + 2H2, (56)
and its abundance is inversely proportional to total pressure
XCH2O = K56XCH4 XH2O/
X2H2
× P−1T
∼= 1.441 K56X�CX�Ogas × P−1T . (57)
) mole fraction for subsolar (a), solar (b), and enhanced (c) metallicities.
Inside the CO field, CH2O forms via
CO + H2 = CH2O, (58)
and its abundance increases linearly with total pressure
XCH2O = K58XCOXH2 × PT∼= 0.833K58X�C × PT. (59)
The CH2O mole fraction contours are relatively insensitive tototal pressure inside the CO field because K58 only varies weaklywith temperature. Thus, CH2O is potentially a pressure indicatorin L and M dwarfs. The expected formaldehyde abundances in
the deep atmospheres of T dwarfs are ∼0.1–10 ppb dependingon P, T, and metallicity.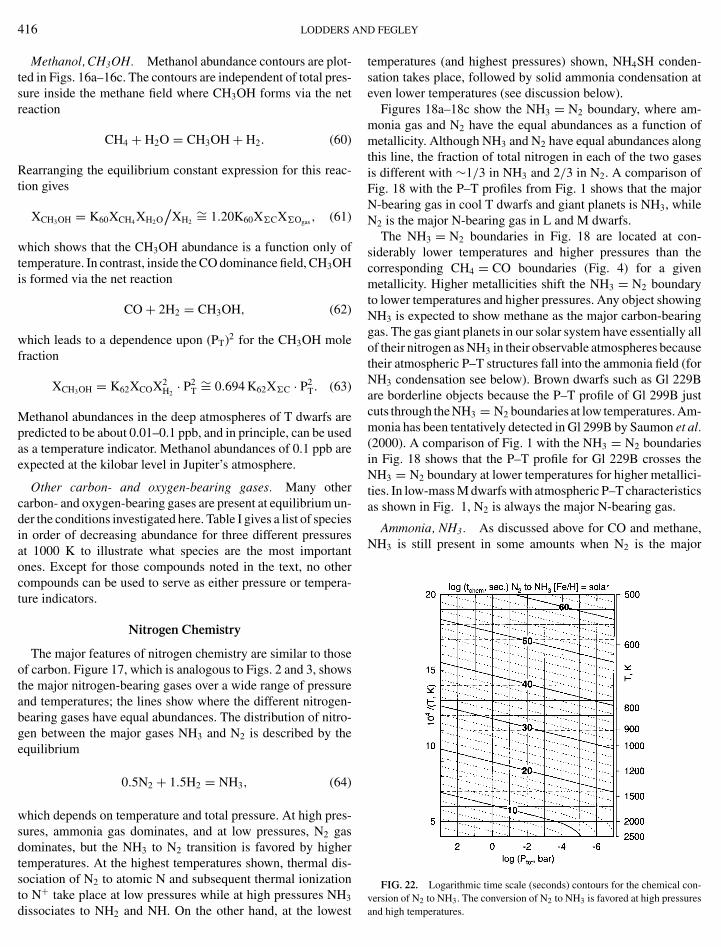
N
416 LODDERS AMethanol, CH3OH. Methanol abundance contours are plot-ted in Figs. 16a–16c. The contours are independent of total pres-sure inside the methane field where CH3OH forms via the netreaction
CH4 + H2O = CH3OH + H2. (60)
Rearranging the equilibrium constant expression for this reac-tion gives
XCH3OH = K60XCH4 XH2O/
XH2∼= 1.20K60X�CX�Ogas , (61)
which shows that the CH3OH abundance is a function only oftemperature. In contrast, inside the CO dominance field, CH3OHis formed via the net reaction
CO + 2H2 = CH3OH, (62)
which leads to a dependence upon (PT)2 for the CH3OH molefraction
XCH3OH = K62XCOX2H2
· P2T
∼= 0.694 K62X�C · P2T. (63)
Methanol abundances in the deep atmospheres of T dwarfs arepredicted to be about 0.01–0.1 ppb, and in principle, can be usedas a temperature indicator. Methanol abundances of 0.1 ppb areexpected at the kilobar level in Jupiter’s atmosphere.
Other carbon- and oxygen-bearing gases. Many othercarbon- and oxygen-bearing gases are present at equilibrium un-der the conditions investigated here. Table I gives a list of speciesin order of decreasing abundance for three different pressuresat 1000 K to illustrate what species are the most importantones. Except for those compounds noted in the text, no othercompounds can be used to serve as either pressure or tempera-ture indicators.
Nitrogen Chemistry
The major features of nitrogen chemistry are similar to thoseof carbon. Figure 17, which is analogous to Figs. 2 and 3, showsthe major nitrogen-bearing gases over a wide range of pressureand temperatures; the lines show where the different nitrogen-bearing gases have equal abundances. The distribution of nitro-gen between the major gases NH3 and N2 is described by theequilibrium
0.5N2 + 1.5H2 = NH3, (64)
which depends on temperature and total pressure. At high pres-sures, ammonia gas dominates, and at low pressures, N2 gasdominates, but the NH3 to N2 transition is favored by highertemperatures. At the highest temperatures shown, thermal dis-sociation of N2 to atomic N and subsequent thermal ionization
+
to N take place at low pressures while at high pressures NH3dissociates to NH2 and NH. On the other hand, at the lowest
D FEGLEY
temperatures (and highest pressures) shown, NH4SH conden-sation takes place, followed by solid ammonia condensation ateven lower temperatures (see discussion below).
Figures 18a–18c show the NH3 = N2 boundary, where am-monia gas and N2 have the equal abundances as a function ofmetallicity. Although NH3 and N2 have equal abundances alongthis line, the fraction of total nitrogen in each of the two gasesis different with ∼1/3 in NH3 and 2/3 in N2. A comparison ofFig. 18 with the P–T profiles from Fig. 1 shows that the majorN-bearing gas in cool T dwarfs and giant planets is NH3, whileN2 is the major N-bearing gas in L and M dwarfs.
The NH3 = N2 boundaries in Fig. 18 are located at con-siderably lower temperatures and higher pressures than thecorresponding CH4 = CO boundaries (Fig. 4) for a givenmetallicity. Higher metallicities shift the NH3 = N2 boundaryto lower temperatures and higher pressures. Any object showingNH3 is expected to show methane as the major carbon-bearinggas. The gas giant planets in our solar system have essentially allof their nitrogen as NH3 in their observable atmospheres becausetheir atmospheric P–T structures fall into the ammonia field (forNH3 condensation see below). Brown dwarfs such as Gl 229Bare borderline objects because the P–T profile of Gl 299B justcuts through the NH3 = N2 boundaries at low temperatures. Am-monia has been tentatively detected in Gl 299B by Saumon et al.(2000). A comparison of Fig. 1 with the NH3 = N2 boundariesin Fig. 18 shows that the P–T profile for Gl 229B crosses theNH3 = N2 boundary at lower temperatures for higher metallici-ties. In low-mass M dwarfs with atmospheric P–T characteristicsas shown in Fig. 1, N2 is always the major N-bearing gas.
Ammonia, NH3. As discussed above for CO and methane,NH3 is still present in some amounts when N2 is the major
FIG. 22. Logarithmic time scale (seconds) contours for the chemical con-
version of N2 to NH3. The conversion of N2 to NH3 is favored at high pressuresand high temperatures.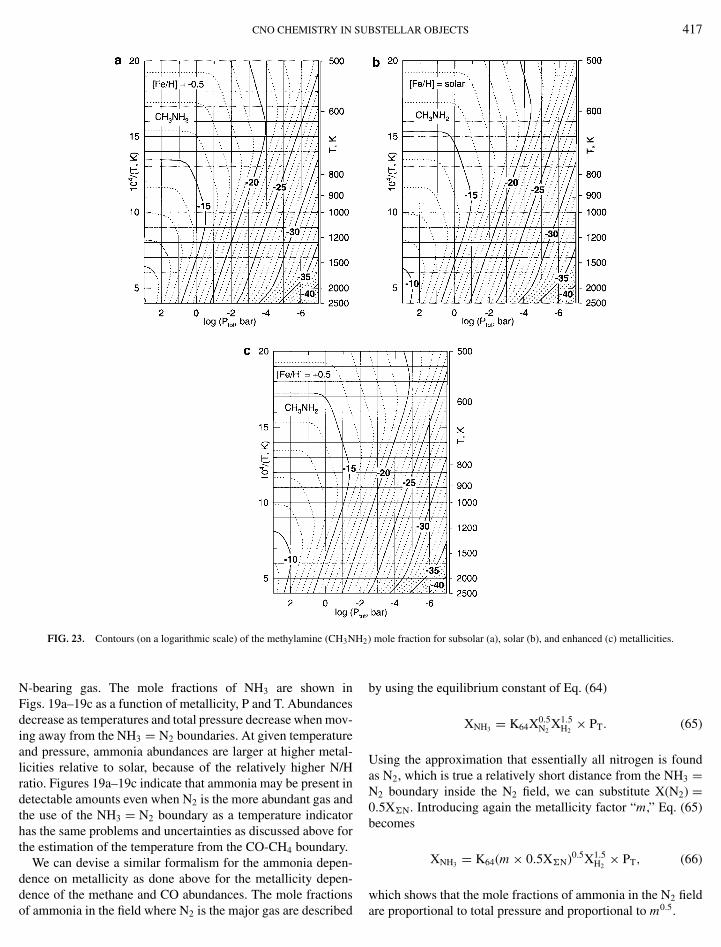
417
dencof a
CNO CHEMISTRY IN SUBSTELLAR OBJECTS
2
FIG. 23. Contours (on a logarithmic scale) of the methylamine (CH3NHN-bearing gas. The mole fractions of NH3 are shown inFigs. 19a–19c as a function of metallicity, P and T. Abundancesdecrease as temperatures and total pressure decrease when mov-ing away from the NH3 = N2 boundaries. At given temperatureand pressure, ammonia abundances are larger at higher metal-licities relative to solar, because of the relatively higher N/Hratio. Figures 19a–19c indicate that ammonia may be present indetectable amounts even when N2 is the more abundant gas andthe use of the NH3 = N2 boundary as a temperature indicatorhas the same problems and uncertainties as discussed above forthe estimation of the temperature from the CO-CH4 boundary.
We can devise a similar formalism for the ammonia depen-dence on metallicity as done above for the metallicity depen-
e of the methane and CO abundances. The mole fractionsmmonia in the field where N2 is the major gas are described
) mole fraction for subsolar (a), solar (b), and enhanced (c) metallicities.
by using the equilibrium constant of Eq. (64)
XNH3 = K64X0.5N2
X1.5H2
× PT. (65)
Using the approximation that essentially all nitrogen is foundas N2, which is true a relatively short distance from the NH3 =N2 boundary inside the N2 field, we can substitute X(N2) =0.5X�N. Introducing again the metallicity factor “m,” Eq. (65)becomes
XNH3 = K64(m × 0.5X�N)0.5X1.5H2
× PT, (66)
which shows that the mole fractions of ammonia in the N2 fieldare proportional to total pressure and proportional to m0.5.
41
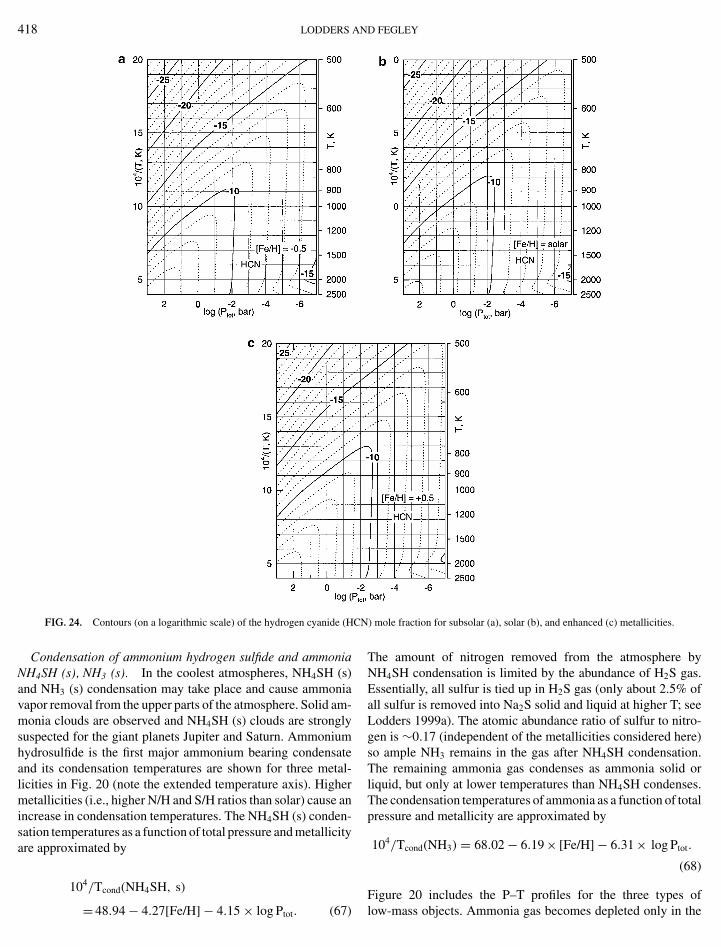
8 LODDERS AND FEGLEYFIG. 24. Contours (on a logarithmic scale) of the hydrogen cyanide (HC
Condensation of ammonium hydrogen sulfide and ammoniaNH4SH (s), NH3 (s). In the coolest atmospheres, NH4SH (s)and NH3 (s) condensation may take place and cause ammoniavapor removal from the upper parts of the atmosphere. Solid am-monia clouds are observed and NH4SH (s) clouds are stronglysuspected for the giant planets Jupiter and Saturn. Ammoniumhydrosulfide is the first major ammonium bearing condensateand its condensation temperatures are shown for three metal-licities in Fig. 20 (note the extended temperature axis). Highermetallicities (i.e., higher N/H and S/H ratios than solar) cause anincrease in condensation temperatures. The NH4SH (s) conden-sation temperatures as a function of total pressure and metallicityare approximated by
104/Tcond(NH4SH, s)
= 48.94 − 4.27[Fe/H] − 4.15 × log Ptot. (67)
N) mole fraction for subsolar (a), solar (b), and enhanced (c) metallicities.
The amount of nitrogen removed from the atmosphere byNH4SH condensation is limited by the abundance of H2S gas.Essentially, all sulfur is tied up in H2S gas (only about 2.5% ofall sulfur is removed into Na2S solid and liquid at higher T; seeLodders 1999a). The atomic abundance ratio of sulfur to nitro-gen is ∼0.17 (independent of the metallicities considered here)so ample NH3 remains in the gas after NH4SH condensation.The remaining ammonia gas condenses as ammonia solid orliquid, but only at lower temperatures than NH4SH condenses.The condensation temperatures of ammonia as a function of totalpressure and metallicity are approximated by
104/Tcond(NH3) = 68.02 − 6.19 × [Fe/H] − 6.31 × log Ptot.
(68)
Figure 20 includes the P–T profiles for the three types oflow-mass objects. Ammonia gas becomes depleted only in the
U
CNO CHEMISTRY IN Supper atmospheres of objects whose P–T profiles cross the NH4SHcondensation curves, which is found for Jupiter. In T dwarfssuch as Gl 229B, removal of ammonia by condensation is notexpected and is of no relevance in warmer L and M dwarfs,where ammonia gas never is the major nitrogen-bearing gas tobegin with.
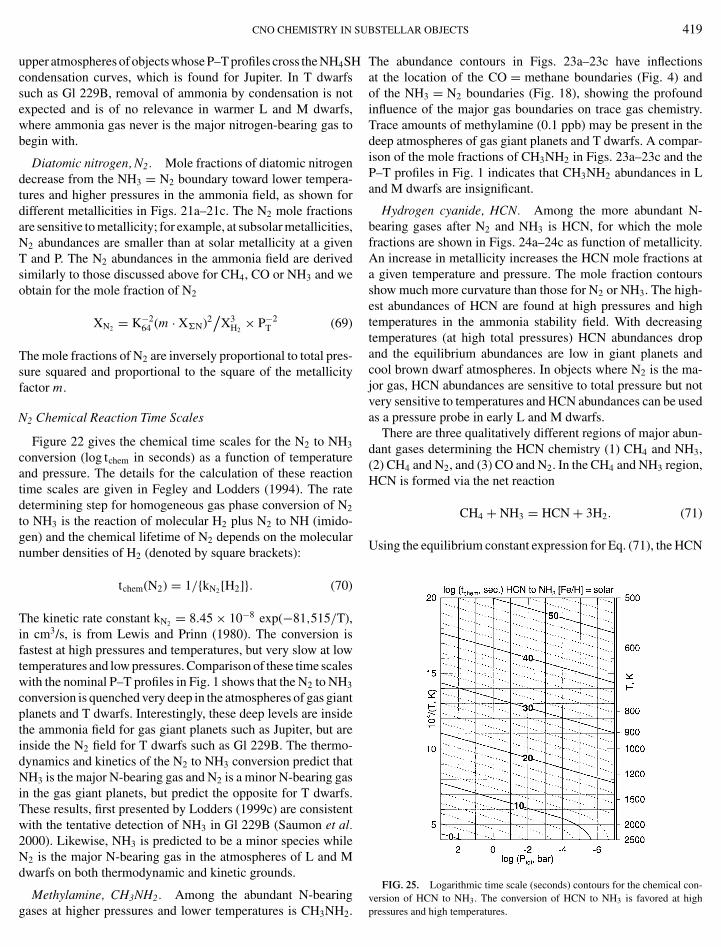
Diatomic nitrogen, N2. Mole fractions of diatomic nitrogendecrease from the NH3 = N2 boundary toward lower tempera-tures and higher pressures in the ammonia field, as shown fordifferent metallicities in Figs. 21a–21c. The N2 mole fractionsare sensitive to metallicity; for example, at subsolar metallicities,N2 abundances are smaller than at solar metallicity at a givenT and P. The N2 abundances in the ammonia field are derivedsimilarly to those discussed above for CH4, CO or NH3 and weobtain for the mole fraction of N2
XN2 = K−264 (m · X�N)2
/X3
H2× P−2
T (69)
The mole fractions of N2 are inversely proportional to total pres-sure squared and proportional to the square of the metallicityfactor m.
N2 Chemical Reaction Time Scales
Figure 22 gives the chemical time scales for the N2 to NH3
conversion (log tchem in seconds) as a function of temperatureand pressure. The details for the calculation of these reactiontime scales are given in Fegley and Lodders (1994). The ratedetermining step for homogeneous gas phase conversion of N2
to NH3 is the reaction of molecular H2 plus N2 to NH (imido-gen) and the chemical lifetime of N2 depends on the molecularnumber densities of H2 (denoted by square brackets):
tchem(N2) = 1/{kN2 [H2]}. (70)
The kinetic rate constant kN2 = 8.45 × 10⁻⁸ exp(−81,515/T),in cm3/s, is from Lewis and Prinn (1980). The conversion isfastest at high pressures and temperatures, but very slow at lowtemperatures and low pressures. Comparison of these time scaleswith the nominal P–T profiles in Fig. 1 shows that the N2 to NH3
conversion is quenched very deep in the atmospheres of gas giantplanets and T dwarfs. Interestingly, these deep levels are insidethe ammonia field for gas giant planets such as Jupiter, but areinside the N2 field for T dwarfs such as Gl 229B. The thermo-dynamics and kinetics of the N2 to NH3 conversion predict thatNH3 is the major N-bearing gas and N2 is a minor N-bearing gasin the gas giant planets, but predict the opposite for T dwarfs.These results, first presented by Lodders (1999c) are consistentwith the tentative detection of NH3 in Gl 229B (Saumon et al.2000). Likewise, NH3 is predicted to be a minor species whileN2 is the major N-bearing gas in the atmospheres of L and Mdwarfs on both thermodynamic and kinetic grounds.
Methylamine, CH3NH2. Among the abundant N-bearinggases at higher pressures and lower temperatures is CH3NH2.
BSTELLAR OBJECTS 419
The abundance contours in Figs. 23a–23c have inflectionsat the location of the CO = methane boundaries (Fig. 4) andof the NH3 = N2 boundaries (Fig. 18), showing the profoundinfluence of the major gas boundaries on trace gas chemistry.Trace amounts of methylamine (0.1 ppb) may be present in thedeep atmospheres of gas giant planets and T dwarfs. A compar-ison of the mole fractions of CH3NH2 in Figs. 23a–23c and theP–T profiles in Fig. 1 indicates that CH3NH2 abundances in Land M dwarfs are insignificant.
Hydrogen cyanide, HCN. Among the more abundant N-bearing gases after N2 and NH3 is HCN, for which the molefractions are shown in Figs. 24a–24c as function of metallicity.An increase in metallicity increases the HCN mole fractions ata given temperature and pressure. The mole fraction contoursshow much more curvature than those for N2 or NH3. The high-est abundances of HCN are found at high pressures and hightemperatures in the ammonia stability field. With decreasingtemperatures (at high total pressures) HCN abundances dropand the equilibrium abundances are low in giant planets andcool brown dwarf atmospheres. In objects where N2 is the ma-jor gas, HCN abundances are sensitive to total pressure but notvery sensitive to temperatures and HCN abundances can be usedas a pressure probe in early L and M dwarfs.
There are three qualitatively different regions of major abun-dant gases determining the HCN chemistry (1) CH4 and NH3,(2) CH4 and N2, and (3) CO and N2. In the CH4 and NH3 region,HCN is formed via the net reaction
CH4 + NH3 = HCN + 3H2. (71)
Using the equilibrium constant expression for Eq. (71), the HCN
FIG. 25. Logarithmic time scale (seconds) contours for the chemical con-
version of HCN to NH3. The conversion of HCN to NH3 is favored at highpressures and high temperatures.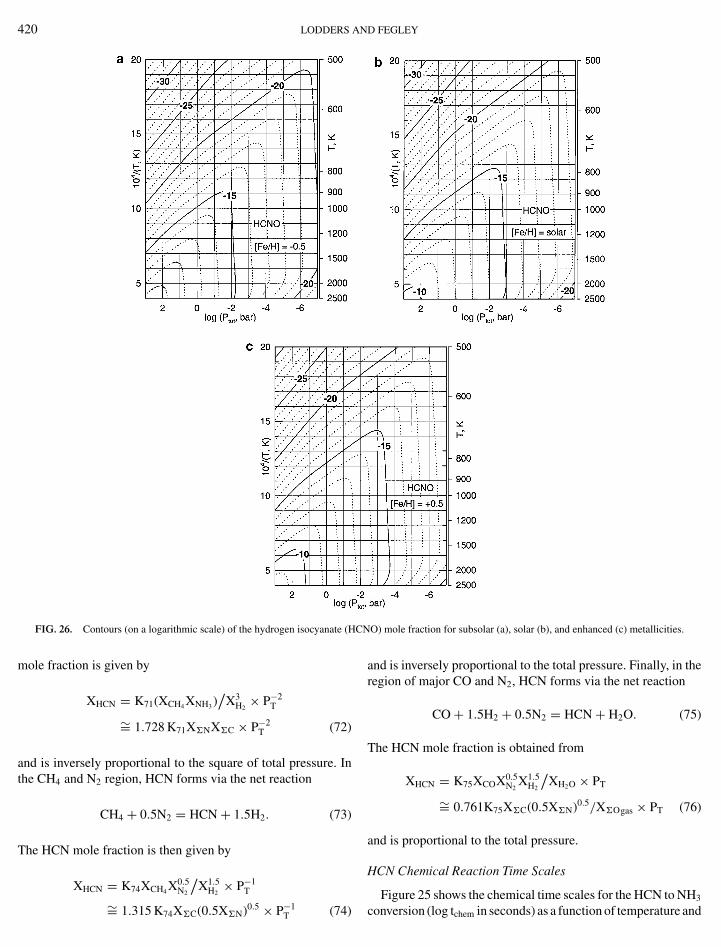
420 LODDERS AND FEGLEY
N
Figure 25 shows the chemical time scales for the HCN to NH3
FIG. 26. Contours (on a logarithmic scale) of the hydrogen isocyanate (HC
mole fraction is given by
XHCN = K71(XCH4 XNH3 )/
X3H2
× P−2T
∼= 1.728 K71X�NX�C × P−2T (72)
and is inversely proportional to the square of total pressure. Inthe CH4 and N2 region, HCN forms via the net reaction
CH4 + 0.5N2 = HCN + 1.5H2. (73)
The HCN mole fraction is then given by
XHCN = K74XCH4 X0.5N2
/X1.5
H2× P−1
T
∼= 1.315 K74X�C(0.5X�N)0.5 × P−1T (74)
O) mole fraction for subsolar (a), solar (b), and enhanced (c) metallicities.
and is inversely proportional to the total pressure. Finally, in theregion of major CO and N2, HCN forms via the net reaction
CO + 1.5H2 + 0.5N2 = HCN + H2O. (75)
The HCN mole fraction is obtained from
XHCN = K75XCOX0.5N2
X1.5H2
/XH2O × PT
∼= 0.761K75X�C(0.5X�N)0.5/X�Ogas × PT (76)
and is proportional to the total pressure.
HCN Chemical Reaction Time Scales
conversion (log tchem in seconds) as a function of temperature and
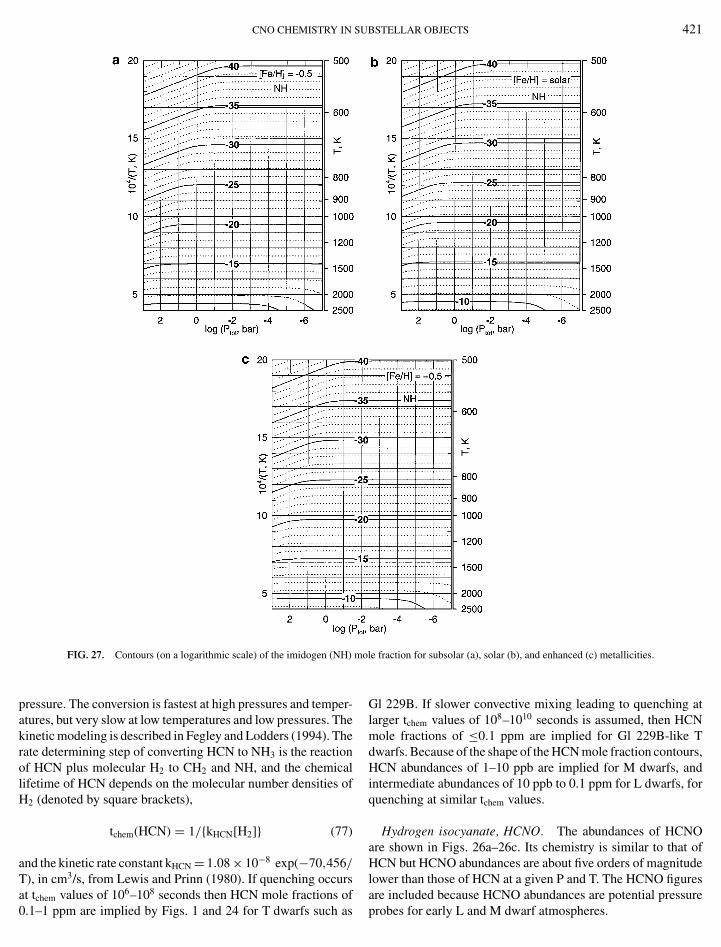
421
at tchem
0.1–1
CNO CHEMISTRY IN SUBSTELLAR OBJECTS
FIG. 27. Contours (on a logarithmic scale) of the imidogen (NH) mo
pressure. The conversion is fastest at high pressures and temper-atures, but very slow at low temperatures and low pressures. Thekinetic modeling is described in Fegley and Lodders (1994). Therate determining step of converting HCN to NH3 is the reactionof HCN plus molecular H2 to CH2 and NH, and the chemicallifetime of HCN depends on the molecular number densities ofH2 (denoted by square brackets),
tchem(HCN) = 1/{kHCN[H2]} (77)
and the kinetic rate constant kHCN = 1.08 × 10⁻⁸ exp(−70,456/
T), in cm3/s, from Lewis and Prinn (1980). If quenching occurs6 8
values of 10 –10 seconds then HCN mole fractions ofppm are implied by Figs. 1 and 24 for T dwarfs such as
le fraction for subsolar (a), solar (b), and enhanced (c) metallicities.
Gl 229B. If slower convective mixing leading to quenching atlarger tchem values of 108–1010 seconds is assumed, then HCNmole fractions of ≤0.1 ppm are implied for Gl 229B-like Tdwarfs. Because of the shape of the HCN mole fraction contours,HCN abundances of 1–10 ppb are implied for M dwarfs, andintermediate abundances of 10 ppb to 0.1 ppm for L dwarfs, forquenching at similar tchem values.
Hydrogen isocyanate, HCNO. The abundances of HCNOare shown in Figs. 26a–26c. Its chemistry is similar to that ofHCN but HCNO abundances are about five orders of magnitudelower than those of HCN at a given P and T. The HCNO figures
are included because HCNO abundances are potential pressureprobes for early L and M dwarf atmospheres.
N
422 LODDERS AImidogen, NH. Among the minor abundant N-bearing gases,NH is a good temperature indicator because its mole fractionsare virtually independent of total pressure for the pressure rangecovered here (Figs. 27a–27c). The NH mole fractions are below10−20 at T < 1000 K for all metallicities and detection of thistemperature probe is probably only possible in the deep atmo-spheres of L dwarfs and photospheres of M dwarfs. This is theonly compound among the C-, N-, and O-bearing compoundsinvestigated here which shows a pressure-independent distribu-tion over a wide total pressure range.
Other N-bearing compounds. Table I lists other N-bearingcompounds that are next most abundant after N2, NH3, CH3NH2,and HCN. There are no other major abundant N-bearing gaseswhich could be used as either temperature or pressure indicators.
IMPLICATIONS AND CONCLUSIONS
The equilibrium thermochemistry for carbon, oxygen, andnitrogen reveals the following trends in chemical speciation:Methane and ammonia formation are favorable at low tempera-tures, high total pressures, and low metallicities. The presenceor absence of major CO, N2, CH4, and/or NH3 establishes arelative effective temperature scale and indicates that five po-tential types of objects exist: (1) Objects with major CO and N2
have the highest effective temperatures; these are most likelylow-mass early L and M dwarfs. (2) Next are objects with majorCH4 and N2; these are in the methane brown dwarf (T dwarfs)category. (3) The objects with the coolest effective temperaturesshow major CH4 and NH3, which are very cool brown dwarfcandidates (late T dwarfs). The brown dwarf Gl 229B is a bor-derline case for this cool T-dwarf scale. G1570D, one of thecoolest T dwarfs with Teff in the range of 784–824 K (Burgasseret al. 2000a, Geballe et al. 2001) may fall into the methane plusammonia group. All objects with CH4 and ammonia bands areexpected to have water vapor if their atmospheres are sufficientlyhot to prevent water condensation. Again, Gl 229B whose modelP–T just “misses” the water condensation curve is a borderlinecase. (4) The fourth type of object is cool enough so that watercondenses into clouds and they show methane and ammoniabands. (5) Among the fifth type of objects are very cool, giantplanet-like objects, which only show methane but no ammonia,because ammonia has condensed as NH4SH and/or NH3. Suchcool objects lack water vapor in their upper atmospheres, be-cause water condenses at higher temperatures (greater depth) inthe atmosphere than does ammonia.
The presence of CH4 alone does not constrain temperature,and an abundance determination of methane is needed to obtaina reasonable temperature estimate. The abundance of methaneis temperature and pressure dependent. If total pressure (or tem-perature) is independently determined and abundances of CH4
are known, the temperature (or pressure) is uniquely defined.The mole fractions of methane are relatively metallicity inde-
pendent under conditions where CO is the major C-bearing gasand the abundance of CH4 provides a metallicity independent
D FEGLEY
constraint on the temperature. At constant T and P, mole frac-tions of other species discussed here generally show an increasewhen metallicity is increased.
Several other temperature and pressure indicators are identi-fied. These species may prove useful if there are spectral win-dows that allow their detection deep in the atmosphere. For giantplanets and cool methane dwarfs, the deep atmospheric abun-dances of ethane (Fig. 12) and methanol (Fig. 16) are diagnostictemperature probes because their abundances are relatively inde-pendent of total pressure. We did not find a good T-independentpressure indicator for these objects among the more abundantC-, N-, and O-bearing species investigated here.
The total pressure in the deep atmospheres of the more mas-sive L and M dwarfs can be probed by the abundances of methyl(Fig. 11), HCN (Fig. 24) and HCNO (Fig. 26). Their abundancesare relatively insensitive to the temperature at the expected P–Tconditions for these hotter objects. A temperature indicator forM dwarfs is the abundance of CO2 (Fig. 10). Finally, the abun-dances of NH are a potential temperature indicator for all typesof objects with atmospheric conditions spanning the T and Pranges investigated here.
ACKNOWLEDGMENTS
Work supported by NAG5-6366 from the NASA Planetary AtmospheresProgram (B.F.) and NSF AST-0086487 (K.L.). We thank Tristan Guillot fora detailed referee report and Mark Marley for comments.
REFERENCES
Anders, E., and N. Grevesse 1989. Abundances of the elements: Meteoritic andsolar. Geochim. Cosmochim. Acta 53, 197–214.
Barshay, S. S., and J. S. Lewis 1978. Chemical structure of the deep atmosphereof Jupiter. Icarus 33, 593–611.
Bezard, B., H. Feuchtgruber, and Th. Encrenaz 1998. Detection of methyl radi-cals (CH3) on Saturn. Astron. Astrophys. 334, L41–L44.
Bezard, B., P. N. Romani, H. Feuchtgruber, and Th. Encrenaz 1999. Detectionof the methyl radical on Neptune. Astrophys. J. 515, 868–872.
Burgasser, A. J., J. D. Kirkpatrick, M. E. Brown, I. N. Reid, J. E. Gizis, C. C.Dahn, D. G. Monet, C. A. Beichman, J. Liebert, R. M. Cutri, and M. F.Skrutskie 1999. Discovery of four field methane (T-type) dwarfs with the twomicron all-sky survey. Astrophys. J. 522, L65–L68.
Burgasser, A. J., J. D. Kirkpartick, R. M. Cutri, H. McCallon, G. Kopan, J. E.Gizis, J. Liebert, I. N. Reid, M. E. Brown, D. G. Monet, C. C. Dahn, C. A.Beichman, and M. F. Skrutskie 2000a. Discovery of a brown dwarf companionto Gliese 570 ABC: A 2MASS T dwarf significantly cooler than Gliese 229B.Astrophys. J. 531, L57–L60.
Burgasser, A. J., J. C. Wilson, J. D. Kirkpartick, M. F. Skrutskie, M. R. Colonno,A. T. Enos, J. D. Smith, C. P. Henderson, J. E. Gizis, M. E. Brown, and J. R.Houck 2000b. Discovery of a bright field methane (T-type) brown dwarf by2MASS. Astron. J. 120, 1100–1105.
Burrows, A., and C. M. Sharp 1999. Chemical equilibrium abundances in browndwarf and extrasolar giant planet atmospheres. Astrophys. J. 512, 843–863.
Burrows, A., M. S. Marley, and C. M. Sharp 2000. The near-infrared and opticalspectra of methane dwarfs and brown dwarfs. Astrophys. J. 531, 438–446.
Chase, M. W. 1999. NIST-JANAF thermochemical tables, 4th ed., J. Phys. Chem.
Ref. Data 28, Monograph No. 9, Am. Chem. Soc. and Amer. Inst. of Physics,Washington, DC.
CNO CHEMISTRY IN SU
Chase, M. W., Jr., C. A. Davies, J. R. Downey, Jr., D. J. Frurip, R. A. McDonald,and A. N. Syverud 1985. JANAF thermochemical tables, 3rd. ed., J. Phys.Chem. Ref. Data 14, Suppl. 1, Am. Chem. Soc. and Amer. Inst. of Physics,Washington, DC.
Cuby, J. G., P. Saracco, A. F. Moorwood, S. d’Odorico, C. Lidman, F. Comeron,and J. Spyromilio 1999. Discovery of a faint field methane brown dwarf fromESO NTT and VLT observations. Astron. Astrophys. 349, L41–L44.
Edvardsson, B., J. Andersen, B. Gustafsson, D. L. Lambert, P. E. Nissen, andJ. Tomkin 1993. The chemical evolution of the galactic disk I. Analysis andresults. Astron. Astrophys. 275, 101–152.
Fegley, B., Jr., and K. Lodders 1994. Chemical models of the deep atmospheresof Jupiter and Saturn. Icarus 110, 117–154.
Fegley, B., Jr., and K. Lodders 1996. Atmospheric chemistry of the brown dwarfGliese 229B: Thermochemical equilibrium predictions. Astrophys. J. 472,L37–L39.
Fegley, B., Jr., and H. Palme 1985. Evidence for oxidizing conditions in the solarnebula from Mo and W depletions in refractory inclusions in carbonaceouschondrites. Earth Planet. Sci. Lett. 72, 311–326.
Fegley, B., Jr., and R. G. Prinn 1985. Equilibrium and non-equilibrium chemistryof Saturn’s atmosphere: Implications for the observability of PH3, N2, CO,and GeH4. Astrophys. J. 299, 1067–1078.
Fegley, B., Jr., and R. G. Prinn 1986. Chemical models of the deep atmosphereof Uranus. Astrophys. J. 307, 852–865.
Fegley, B., Jr., and R. G. Prinn 1988a. Chemical constraints on the water andtotal oxygen abundance in the deep atmosphere of Jupiter. Astrophys. J. 324,621–625.
Fegley, B., Jr., and R. G. Prinn 1988b. The predicted abundances of deuterium-bearing gases in the atmospheres of Jupiter and Saturn. Astrophys. J. 326,490–508.
Fegley, B., Jr., M. Yu. Zolotov, and K. Lodders 1997. The oxidation state of thelower atmosphere and surface of Venus. Icarus 125, 416–439.
Gardiner, W. C. (ed.) 2000. Gas-Phase Combustion Chemistry. Springer-Verlag,New York.
Geballe, T. R., D. Saumon, S. K. Leggett, G. R. Knapp, M. S. Marley, and K.Lodders 2001. Infrared observations and modeling of one of the coolest Tdwarfs, Gl 570 D. Astrophys. J. 556, 373–379.
Griffith, C. A., and R. V. Yelle 1999. Disequilibrium in a brown dwarf’satmosphere: Carbon monoxide in Gliese 299B. Astrophys. J. 519, L85–L88.
Guillot, T. 1999. A comparison of the interiors of Jupiter and Saturn. Planet.Space. Sci. 47, 1183–1200.
Guillot, T., G. Chabrier, P. Morel, and D. Gautier 1994a. Nonadiabatic modelsof Jupiter and Saturn. Icarus 112, 354–367.
Guillot, T., D. Gautier, G. Chabrier, and B. Mosser 1994b. Are the giant planetsfully convective? Icarus 112, 337–353.
Heirs, R. S., III 1994. Errors in JANAF thermodynamic formation functions foracetylene. J. Thermophys. Heat Trans. 8, 181–182.
Kirkpatrick, J. D., I. N. Reid, J. Liebert, R. M. Cutri, B. Nelson, C. A. Beichmann,C. C. Dahn, D. G. Monet, J. E. Gizis, and M. F. Skrutskie 1999. Dwarfs coolerthan “M”: The definition of spectral type “L” using discoveries from the2-Micron All-Sky Survey (2MASS). Astrophys. J. 519, 802–833.
Lauretta, D. S., and K. Lodders 1997. The cosmochemical behavior of berylliumand boron. Earth Planet. Sci. Lett. 146, 315–327.
Leggett, S. K., T. R. Geballe, X. Fan, D. P. Schneider, J. E. Gunn, R. H. Lupton,G. R. Knapp, M. A. Strauss, A. McDaniel, D. A. Golimowski, T. J. Henry,E. Peng, Z. I. Tsvetanov, A. Uomoto, W. Zheng, G. J. Hill, L. W. Ramsey,S. F. Anderson, J. A. Annis, N. A. Bahcall, J. Brinkmann, B. Chen, I. Csabai,M. Fukugita, G. S. Hennessy, R. B. Hindsley, Z. Ivezic, D. Q. Lamb, J. A.Munn, J. R. Pier, D. J. Schlegel, J. A. Smith, C. Stoughton, A. R. Thakar, and
D. G. York 2000. The missing link: Early methane (“T”) dwarfs in the SloanDigital Sky Survey. Astrophys. J. 536, L35–L38.BSTELLAR OBJECTS 423
Lewis, J. S. 1969. Observability of spectroscopically active compounds in theatmosphere of Jupiter. Icarus 10, 393–409.
Lewis, J. S., and R. G. Prinn 1980. Kinetic inhibition of CO and N2 reductionin the solar nebula. Astrophys. J. 238, 357–364.
Lewis, J. S., S. S. Barshay, and B. Noyes 1979. Primordial retention of carbonby the terrestrial planets. Icarus 37, 190–206.
Lodders, K. 1999a. Alkali element chemistry in cool dwarf atmospheres. Astro-phys. J. 519, 793–801.
Lodders, K. 1999b. Revised thermochemical properties of phosphinidene(PH), phosphine (PH3), phosphorus nitride (PN), and magnesium phosphate(Mg3P2O8). J. Phys. Chem. Ref. Data 28, 1705–1712.
Lodders, K. 1999c, Thermochemistry of atmospheres: From low-mass stars toJupiter-like planets. In Workshop Booklet and Scientific Program “From giantplanets to cool stars,” p. 29. Northern Arizona University, Flagstaff, AZ.
Lodders, K., and B. Fegley, Jr. 1993. Actinide and lanthanide chemistry at highC/O ratios in the solar nebula. Earth Planet. Sci. Lett. 117, 125–145.
Lodders, K., and B. Fegley, Jr. 1994. The origin of carbon monoxide in Neptune’satmosphere. Icarus 112, 368–375.
Lodders, K., and B. Fegley, Jr. 1995. The origin of circumstellar SiC grainsfound in meteorites. Meteoritics 30, 661–678.
Lodders, K., and B. Fegley, Jr. 1997a. Complementary trace element abundancesin meteoritic SiC grains and carbon star atmospheres. Astrophys. J. 484, L71–L74.
Lodders, K., and B. Fegley, Jr. 1997b. Condensation chemistry of carbon stars. InAstrophysical Implications of the Laboratory Study of Presolar Materials (T. J.Bernatowicz and E. Zinner, Eds.), pp. 391–423. AIP Conference Proceedings402, American Institute of Physics, Woodbury, NY.
Lodders, K., and B. Fegley, Jr. 1998. The Planetary Scientist’s Companion,Oxford Univ. Press, New York.
Lodders, K., and B. Fegley, Jr. 1999. Condensation chemistry of circumstel-lar grains. In Asymptotic Giant Branch Stars (T. Le Bertre, A. Lebre, andC. Waelkens, Eds.), pp. 279–291. IAU Symposium No. 191, AstronomicalSociety of the Pacific, San Francisco, CA.
Mahaffy, P. R., H. B. Niemann, A. Alpert, S. K. Atreya, J. Demick, T. M.Donahue, D. N. Harpold, T. C. Owen 2000. Noble gas abundances and isotoperatios in the atmosphere of Jupiter from the Galileo Probe mass spectrometer.J. Geophys. Res. 105, E15061–E15071.
Marley, M. S., D. Saumon, T. Guillot, R. S. Freedman, W. B. Hubbard, A.Burrows, and J. I. Lunine 1996. Atmospheric, evolutionary, and spectral mod-els of the brown dwarf Gliese 229B. Science 272, 1919–1921.
Martin, E. L., G. Basri, X. Delfosse, and T. Forveille 1997. Keck HIRES spectraof the brown dwarf DENIS-P J1228.2-1547. Astron. Astrophys. 327, L29–L32.
Martin, E. L., X. Delfosse, G. Basri, B. Goldman, T. Forveille, and M. R.Zapatero Osorio 1999. Spectroscopic classification of late-M and L fielddwarfs. Astron. J. 118, 2466–2482.
Nakajima, T., B. R. Oppenheimer, S. R. Kulkarni, D. A. Golimowski, K.Matthews, and S. T. Durrance 1995. Discovery of a cool brown dwarf. Nature378, 463–465.
Niemann, H. B., S. K. Atreya, G. R. Carignan, T. M. Donahue, J. A. Haberman,D. N. Harpold, R. E. Hartle, D. M. Hunten, W. T. Kasprzak, P. R. Mahaffy,T. C. Owen, and S. H. Way 1998. The composition of the jovian atmosphereas determined by the Galileo probe mass spectrometer. J. Geophys. Res. 103,22831–22845.
Noll, K. S., T. R. Geballe, and M. S. Marley 1997. Detection of abundant carbonmonoxide in the brown dwarf Gliese 229B. Astrophys. J. 489, L87–L90.
Noll, K. S., T. R. Geballe, S. K. Leggett, and M. S. Marley 2000. The onset ofmethane in L dwarfs. Astrophys. J. 541, L75–L78.
Oppenheimer, B. R., S. R. Kulkarni, K. Matthews, and T. Nakajima 1995. In-frared spectrum of the cool brown dwarf Gl 229B. Science 270, 1478–1479.
N
424 LODDERS APrinn, R. G., and S. S. Barshay 1977. Carbon monoxide on Jupiter and implica-tions for atmospheric convection. Science 198, 1031–1034.
Saumon, D., T. R. Geballe, S. K. Leggett, M. S. Marley, R. S. Freedman,K. Lodders, B. Fegley, and S. K. Sengupta 2000. Molecular abundancesin the atmosphere of the T dwarf Gl 229B. Astrophys. J. 541, 374–389.
Space Studies Board 1988. Space science in the twenty-first century.Imperatives for the decades 1995 to 2015. Overview, available athttp://www.nas.edu/ssb/21och3.htm.
Space Studies Board 1991. Assessment of Solar System exploration pro-grams 1991. 3 Exploration of the outer planets, available at http://www.nas.edu/ssb/ssep91ch3.htm.
Space Studies Board 1998. Failed stars and super planets. A report based onthe January 1998 workshop on sub-stellar mass objects. Executive Summary,available at http://www.nas.edu/ssb/wsmoexecsum.htm.
Spilker, T. R., and W. B. Hubbard 1997. Science investigations from multipledeep (100 bar) Jupiter atmospheric entry probes. Bull. Am. Astron. Soc. 29,1019.
Strauss, M. A., and 28 colleagues 1999. The discovery of a field methane dwarffrom Sloan digital sky survey commissioning data. Astrophys. J. 522, L61–L64.
Stull, D., and H. Prophet 1967. The calculation of thermodynamic proper-ties of materials over wide temperature ranges. In The Characterization
D FEGLEY
of High Temperature Vapors (J. L. Margrave, Ed.), pp. 359–424. Wiley,New York.
Tsvetanov, Z. I., D. A. Golimowski, W. Zheng, T. R. Geballe, S. K. Leggett,H. C. Ford, A. F. Davidsen, A. Uomoto, X. Fan, G. R. Knapp, M. A. Strauss,J. Brinkmann, D. Q. Lamb, H. J. Newberg, R. Rechenmacher, D. P. Schnider,D. G. York, R. H. Lupton, J. R. Pier, J. Annis, I. Csabair, R. B. Hindsley, Z.Ivesic, J. A. Munn, A. R. Thakar, and P. Waddell 2000. The discovery of asecond field methane brown dwarfs from Sloan Digital Sky Survey commis-sioning data. Astrophys. J. 531, L61–L65.
Tsuji, T., K. Ohnaka, and W. Aoki 1996. Dust formation in stellar photospheres:A case of very low mass stars and a possible resolution on the effectivetemperature scale of M dwarfs. Astron. Astrophys. 305, L1–L4.
Urey, H. C. 1953. Chemical evidence regarding the Earth’s origin. In XIIIthInternational Congress Pure and Applied Chemistry and Plenary Lecture,pp. 188–217. Almqvist and Wiksells, Stockholm.
Yung, Y. L., W. A. Drew, J. P. Pinto, and R. R. Friendl 1988. Estimation of thereaction rate for the formation of methoxy radical from atomic hydrogen +formaldehyde: Implications for chemistry in the Solar System. Icarus 73,516–526.
Zolotov, M. Yu., and B. Fegley, Jr. 1998a. Volcanic production of sulfur monox-ide (SO) on Io. Icarus 132, 431–434.
Zolotov, M. Yu., and B. Fegley, Jr. 1998b. Volcanic origin of disulfur monoxide(S2O) on Io. Icarus 133, 293–297.