atmospheric impact report: air products acetylene · pdf fileair products acetylene plant,...
TRANSCRIPT
Project Done on Behalf of
Environmental Resources Management Southern Africa (Pty) Ltd
ATMOSPHERIC IMPACT REPORT:
AIR PRODUCTS ACETYLENE PLANT, GAUTENG
Report Number: 13ERM12
Report Version: Rev 1.0
Date: May 2014
Author(s):
N Grobler
H Liebenberg-Enslin
Airshed Planning Professionals (Pty) Ltd
PO Box 5260
Halfway House
1685
Tel: +27 (11) 805 1940
Fax: +27 (11) 805 7010
e-mail: [email protected]
Atmospheric Impact Report: AIR Products Acetylene Plant, Gauteng
Report No.: 13ERM12 Rev 1.0 i
Preface
The proposed AIR Products Acetylene plant in Daleside, south of Johannesburg, will be required to comply with the
Minimum Emission Standards, for new plants in terms of Section 21 of the National Environment Management: Air Quality
Act (Act No 39 of 2004). AIR Products will submit an application for an Atmospheric Emissions License. In support of the
application and to fulfil the requirements stipulated in the Air Quality Act and the Minimum Emission Standards, an air quality
study is required to substantiate the application.
Airshed Planning Professionals (Pty) Ltd (hereafter referred to as Airshed) was appointed by Environmental Resources
Management Southern Africa (Pty) Ltd to provide independent and competent services for the compilation of an Atmospheric
Impact Report as set out in the Draft Regulations and detailing the results of the dispersion model runs. The tasks to be
undertaken consisted of:
1. Prepare meteorological data for inclusion in a suitable atmospheric dispersion model;
a. Prepare topography and land-use data for use in dispersion model;
2. Evaluate the baseline ambient air quality conditions as measured by the DEA operated monitoring stations in the
study area.
3. Prepare emissions inventory for the emissions from the proposed AIR Products Acetylene Plant
4. Simulate dispersion of sulfur dioxide, oxides of nitrogen, particulate matter, acetone, acetylene (phosphine
impurities) and volatile organic compound emissions and calculate ground-level concentrations for various
averaging periods, including hourly, daily and annual averages.
5. Prepare a comprehensive report with
a. A summary of all baseline monitoring results
b. Emissions inventory
c. Model input parameter description
d. Model results
e. Discussion of model results, with specific reference to the motivation for the AEL application.

Atmospheric Impact Report: AIR Products Acetylene Plant, Gauteng
Report No.: 13ERM12 Rev 1.0 ii
Table of Contents
1 Enterprise Details ............................................................................................................................................................. 1
Enterprise Details .................................................................................................................................................... 1 1.1
Location and Extent of the Plant ............................................................................................................................. 1 1.2
Description of Surrounding Land Use (within 5 km radius) ..................................................................................... 2 1.3
Atmospheric Emission Licence and other Authorisations ....................................................................................... 4 1.4
2 Nature of the Process ....................................................................................................................................................... 4
Process Description (Source Draft Scoping Report for the Proposed Acetylene Gas Production Facility in 2.1
Gauteng, ERM 2014) ............................................................................................................................................................. 4
Listed Processes ..................................................................................................................................................... 5 2.2
Unit Processes ........................................................................................................................................................ 5 2.3
3 Technical Information ....................................................................................................................................................... 8
Raw Materials Used and Production Rates ............................................................................................................ 8 3.1
Production Rates..................................................................................................................................................... 8 3.2
4 Atmospheric Emissions .................................................................................................................................................... 9
Point Source Parameters ........................................................................................................................................ 9 4.1
Point Source Maximum Emission Rates during Normal Operating Conditions..................................................... 10 4.2
Fugitive Emissions ................................................................................................................................................ 11 4.3
Emergency Incidents............................................................................................................................................. 14 4.4
5 Impact of Enterprise on the Receiving Environment ....................................................................................................... 14
Analysis of Emissions’ Impact on Human Health .................................................................................................. 14 5.1
5.1.1 Study Methodology........................................................................................................................................... 14
5.1.2 Legal Requirements ......................................................................................................................................... 15
5.1.3 Atmospheric Dispersion Potential .................................................................................................................... 19
Air Quality Monitoring data .................................................................................................................................... 24 5.2
5.2.1 PM10 ................................................................................................................................................................. 25
5.2.2 NO2 ................................................................................................................................................................... 27
5.2.3 SO2 ................................................................................................................................................................... 28
5.2.4 Benzene ........................................................................................................................................................... 30
Dispersion Modelling Results ................................................................................................................................ 32 5.3
5.3.1 Particulate (PM10) emissions ............................................................................................................................ 32
5.3.2 Nitrogen dioxide emissions .............................................................................................................................. 35
5.3.3 Sulphur dioxide emissions................................................................................................................................ 38
5.3.4 Acetone emissions ........................................................................................................................................... 38

Atmospheric Impact Report: AIR Products Acetylene Plant, Gauteng
Report No.: 13ERM12 Rev 1.0 iii
5.3.5 Phosphine emissions ....................................................................................................................................... 38
5.3.6 VOC emissions................................................................................................................................................. 40
Impact Significance Ratings .................................................................................................................................. 42 5.4
Main Findings and Conclusions ............................................................................................................................ 43 5.5
Analysis of Emissions’ Impact on the Environment............................................................................................... 43 5.6
6 Complaints ...................................................................................................................................................................... 43
7 Current or planned air quality management interventions .............................................................................................. 45
8 Compliance and Enforcement Actions ............................................................................................................................ 46
9 Additional Information ..................................................................................................................................................... 46
10 Annexure A ..................................................................................................................................................................... 47
11 Annexure B ..................................................................................................................................................................... 48
Atmospheric Impact Report: AIR Products Acetylene Plant, Gauteng
Report No.: 13ERM12 Rev 1.0 iv
List of Tables
Table 1-1: Enterprise details ...................................................................................................................................................... 1
Table 1-2: Contact details of responsible person ....................................................................................................................... 1
Table 1-3: Location and extent of the plant ................................................................................................................................ 1
Table 2-1: Listed activities at AIR Product Acetylene Plant ....................................................................................................... 5
Table 2-2: The unit processes for the AIR Products Acetylene Plant ........................................................................................ 5
Table 2-3: Location of unit processes (Source Draft Scoping Report for the Proposed Acetylene Gas Production Facility in
Gauteng, ERM 2014) ................................................................................................................................................................. 7
Table 3-1: Raw materials used ................................................................................................................................................... 8
Table 3-2: Production rates ........................................................................................................................................................ 8
Table 3-3: By-products ............................................................................................................................................................... 8
Table 4-1: Point sources of atmospheric pollutant emissions at the AIR Products Acetylene Plant .......................................... 9
Table 4-2: Atmospheric pollutant emission rates for the point sources at the AIR Products Acetylene plant. ......................... 10
Table 4-3: Information sources used to estimate emission rates for point source emissions .................................................. 10
Table 4-4: Area and/or line source parameters ........................................................................................................................ 11
Table 4-5: Area source emissions ............................................................................................................................................ 12
Table 4-6: Area Source Emission Estimation Information ........................................................................................................ 13
Table 5-1: National Ambient Air Quality Standards .................................................................................................................. 18
Table 5-2: Health Screening Levels for Non-Criteria Pollutants. .............................................................................................. 18
Table 5-3: Atmospheric stability classes .................................................................................................................................. 22
Table 5-4: Long-term minimum, maximum and mean temperature ......................................................................................... 23
Table 5-5: Long-term average monthly rainfall (Schulze, 1986) .............................................................................................. 24
Table 5-6: Impact Significance Ratings ................................................................................................................................... 42
Table 6-1: Questions and Comments ...................................................................................................................................... 43
Table 8-1: AIR Products Acetylene plant compliance with MEL and NAAQS ......................................................................... 46
Atmospheric Impact Report: AIR Products Acetylene Plant, Gauteng
Report No.: 13ERM12 Rev 1.0 v
List of Figures
Figure 1-1: Location of the proposed AIR Products Acetylene plant in relation to surroundings ............................................... 3
Figure 2-1: Process Flow Diagram for a Typical Acetylene Plant (Source Draft Scoping Report for the Proposed Acetylene
Gas Production Facility in Gauteng, ERM 2014) ........................................................................................................................ 6
Figure 2-1: Boundaries of the Vaal Triangle Airshed Priority Area, as declared on 21 April 2006 ..................................... 16
Figure 5-1: Average, day-time and night-time wind roses for Vereeniging, 2010 to 2012 ....................................................... 20
Figure 5-2: Seasonal variation in wind patterns of Vereeniging, 2010 to 2012 ........................................................................ 21
Figure 5-3: Atmospheric stability of Vereeniging for the period 2010 – 2012. .......................................................................... 22
Figure 5-4: Monthly rainfall (Vereeniging, Jul 2006 – Dec 2007) ............................................................................................. 23
Figure 5-5: DEA operated ambient air quality monitoring stations close to the project site ..................................................... 25
Figure 5-6: Measured monthly average PM10 concentrations at the Vaal Airshed monitoring stations (SAAQIS, 2014) ......... 26
Figure 5-7: Measured diurnal average PM10 concentrations at the Vaal Airshed monitoring stations (SAAQIS, 2014) .......... 26
Figure 5-8: Measured monthly average NO2 concentrations at the Vaal Airshed monitoring stations (SAAQIS, 2014) .......... 27
Figure 5-9: Measured diurnal average NO2 concentrations at the Vaal Airshed monitoring stations (SAAQIS, 2014) ............ 28
Figure 5-10: Measured monthly average SO2 concentrations at the Vaal Airshed monitoring stations (SAAQIS, 2014) ........ 29
Figure 5-11: Measured diurnal average SO2 concentrations at the Vaal Airshed monitoring stations (SAAQIS, 2014) .......... 29
Figure 5-12: Measured monthly average benzene concentrations at the Vaal Airshed monitoring stations (SAAQIS, 2014) . 30
Figure 5-13: Measured diurnal average benzene concentrations at the Vaal Airshed monitoring stations (SAAQIS, 2014) ... 31
Figure 5-14: Predicted annual average PM10 concentrations during the construction phase. ................................................. 32
Figure 5-15: Predicted increase in annual average PM10 concentrations from baseline conditions during the construction
phase. ....................................................................................................................................................................................... 33
Figure 5-16: Predicted annual average PM10 concentrations during the operational phase. ................................................... 34
Figure 5-17: Predicted increase in annual average PM10 concentrations from baseline conditions during the operational
phase. ....................................................................................................................................................................................... 34
Figure 5-18: Predicted highest daily incremental PM10 concentrations during the operational phase. .................................... 35
Figure 5-19: Predicted incremental annual average NO2 concentrations during the operational phase. ................................. 36
Figure 5-20: Predicted incremental highest hourly NO2 concentrations during the operational phase. ................................... 36
Figure 5-21: Predicted cumulative annual average NO2 concentrations during the operational phase. .................................. 37
Figure 5-22: Predicted increase in annual average NO2 concentrations from baseline conditions during the construction
phase. ....................................................................................................................................................................................... 37
Figure 5-23: Predicted incremental annual average PH3 concentrations during the operational phase. ................................. 39
Figure 5-24: Predicted incremental highest daily PH3 concentrations during the operational phase. ...................................... 39
Figure 5-25: Predicted annual average VOC concentrations during the operational phase. ................................................... 40
Figure 5-26: Predicted cumulative annual average VOC concentrations during the operational phase. ................................. 41
Figure 5-27: Predicted increase in annual average VOC concentrations from baseline conditions during the operational
phase. ....................................................................................................................................................................................... 41
Atmospheric Impact Report: AIR Products Acetylene Plant, Gauteng
Report No.: 13ERM12 Rev 1.0 1
Atmospheric Impact Report
1 ENTERPRISE DETAILS
Enterprise Details 1.1
The details of the AIR Products Acetylene plant operations are summarised in Table 1-1. The contact details of the
responsible person are provided in Table 1-2.
Table 1-1: Enterprise details
Enterprise Name AIR Products South Africa (Pty) Ltd
Trading as Air Products
Type of Enterprise Private Company
Company Registration Number
Registered Address 4 Spencer Road, Spartan Ext.1, Kempton Park, Johannesburg
Telephone Number (General) (011) 570 5184
Industry Type/Nature of Trade Speciality Gas Production
Land Use Zoning as per Town Planning Scheme Industrial
Land Use Rights if Outside Town Planning Scheme N/A
Table 1-2: Contact details of responsible person
Responsible Person Mr. Tom Maclean (Project Support Manager)
Telephone Number (011) 570 5184
Cell Number (082) 566 6354
Fax Number (011) 570 5294
Email Address [email protected]
After Hours Contact Details (082) 566 6354
Location and Extent of the Plant 1.2
Table 1-3: Location and extent of the plant
Physical Address of the Plant Tillet Road
Description of Site (Where no Street Address) Stand 88 and 89 of Valley Settlements Agricultural Holdings at Daleside.
Coordinates of Approximate Centre of Operations 26.5064°S , 28.0530°E
Extent 4.4 ha
Elevation Above Sea Level 1503 m
Province Gauteng
Metropolitan/District Municipality Sedibeng District Municipality
Local Municipality Midvaal Local Municipality
Designated Priority Area Vaal Triangle Airshed Priority Area
Atmospheric Impact Report: AIR Products Acetylene Plant, Gauteng
Report No.: 13ERM12 Rev 1.0 2
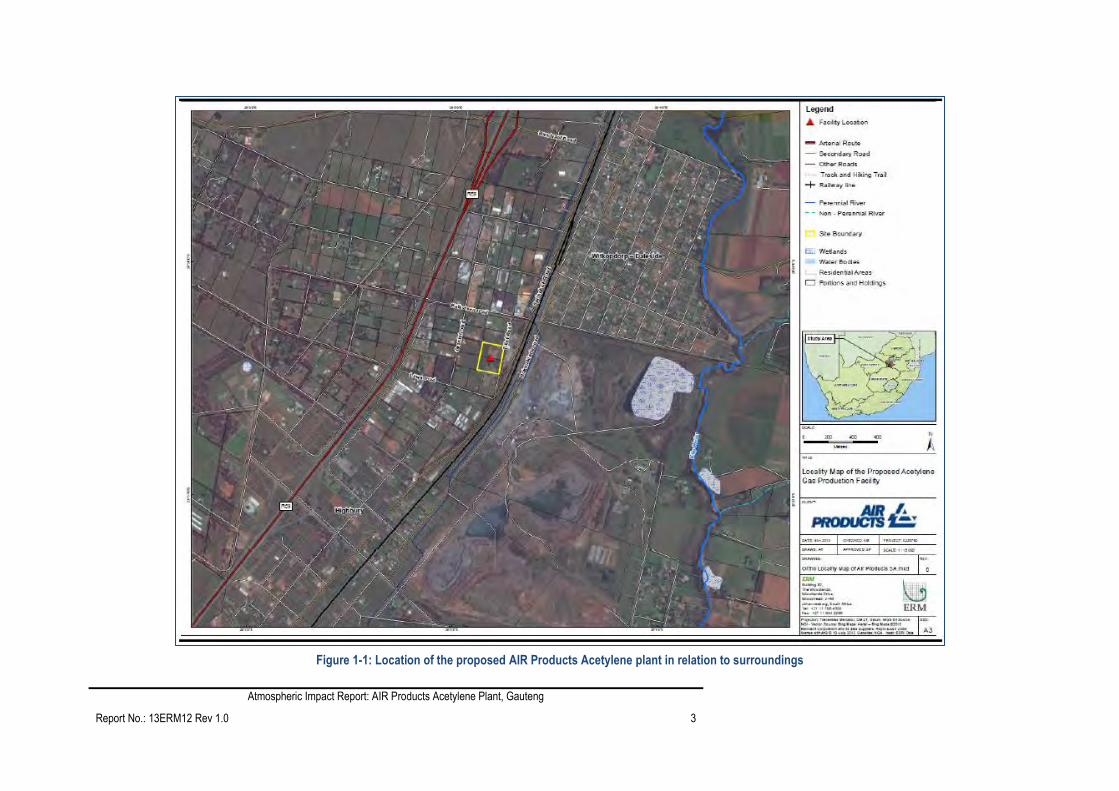
Description of Surrounding Land Use (within 5 km radius) 1.3
Figure 1-1 is an aerial photograph (source: Draft Scoping Report for the Proposed Acetylene Gas Production Facility in
Gauteng, ERM 2014) indicating the location of the AIR Products Acetylene plant.
The proposed site is located in the light industrial area of Daleside, 1 km south west of the residential area of Witkopdorp.
The R59 highway is situated 600 m to the west, this highway is bordered by residential, commercial and industrial areas
running north-south next to the highway. The Pendale agricultural holdings are situated to the west of the highway. The site
is bordered by warehousing facilities and the M61 to the east, with a railway beyond that, and land use further east is mainly
agricultural and mining. The residential area of Henley-on-Klip is situated 3 km to the southeast.
Atmospheric Impact Report: AIR Products Acetylene Plant, Gauteng
Report No.: 13ERM12 Rev 1.0 3
Figure 1-1: Location of the proposed AIR Products Acetylene plant in relation to surroundings
Atmospheric Impact Report: AIR Products Acetylene Plant, Gauteng
Report No.: 13ERM12 Rev 1.0 4
Atmospheric Emission Licence and other Authorisations 1.4
The AIR Products Acetylene plant is a new plant and as such does not have an atmospheric emissions licence yet. This
report will accompany the atmospheric emissions licence application.
2 NATURE OF THE PROCESS
Process Description (Source Draft Scoping Report for the Proposed Acetylene Gas Production Facility in Gauteng, 2.1
ERM 2014)
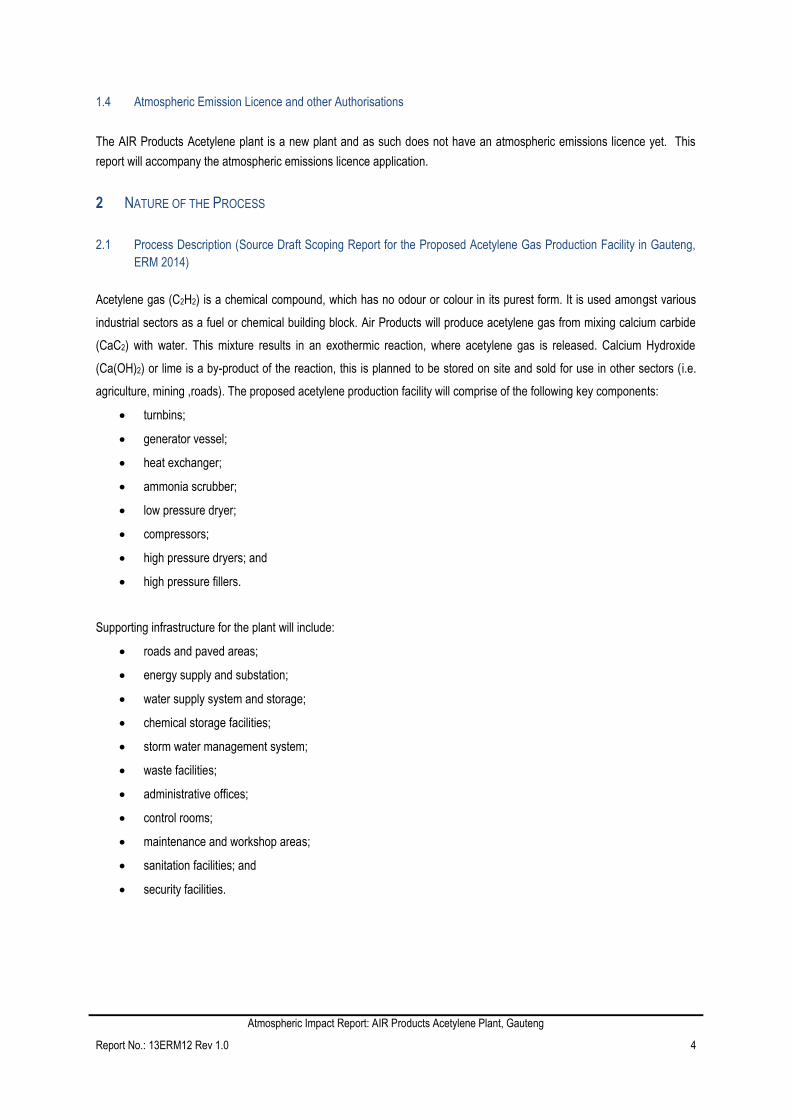
Acetylene gas (C2H2) is a chemical compound, which has no odour or colour in its purest form. It is used amongst various
industrial sectors as a fuel or chemical building block. Air Products will produce acetylene gas from mixing calcium carbide
(CaC2) with water. This mixture results in an exothermic reaction, where acetylene gas is released. Calcium Hydroxide
(Ca(OH)2) or lime is a by-product of the reaction, this is planned to be stored on site and sold for use in other sectors (i.e.
agriculture, mining ,roads). The proposed acetylene production facility will comprise of the following key components:
turnbins;
generator vessel;
heat exchanger;
ammonia scrubber;
low pressure dryer;
compressors;
high pressure dryers; and
high pressure fillers.
Supporting infrastructure for the plant will include:
roads and paved areas;
energy supply and substation;
water supply system and storage;
chemical storage facilities;
storm water management system;
waste facilities;
administrative offices;
control rooms;
maintenance and workshop areas;
sanitation facilities; and
security facilities.
Atmospheric Impact Report: AIR Products Acetylene Plant, Gauteng
Report No.: 13ERM12 Rev 1.0 5
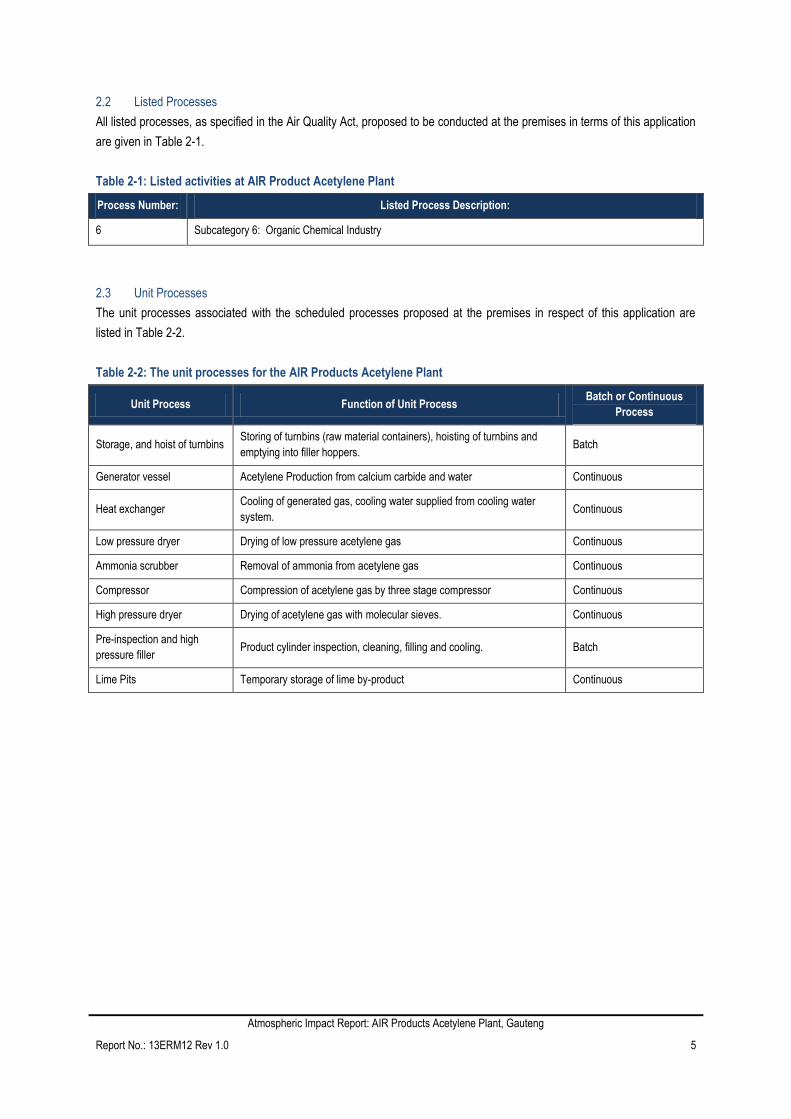
Listed Processes 2.2
All listed processes, as specified in the Air Quality Act, proposed to be conducted at the premises in terms of this application
are given in Table 2-1.
Table 2-1: Listed activities at AIR Product Acetylene Plant
Process Number: Listed Process Description:
6 Subcategory 6: Organic Chemical Industry
Unit Processes 2.3
The unit processes associated with the scheduled processes proposed at the premises in respect of this application are
listed in Table 2-2.
Table 2-2: The unit processes for the AIR Products Acetylene Plant
Unit Process Function of Unit Process Batch or Continuous
Process
Storage, and hoist of turnbins Storing of turnbins (raw material containers), hoisting of turnbins and
emptying into filler hoppers. Batch
Generator vessel Acetylene Production from calcium carbide and water Continuous
Heat exchanger Cooling of generated gas, cooling water supplied from cooling water
system. Continuous
Low pressure dryer Drying of low pressure acetylene gas Continuous
Ammonia scrubber Removal of ammonia from acetylene gas Continuous
Compressor Compression of acetylene gas by three stage compressor Continuous
High pressure dryer Drying of acetylene gas with molecular sieves. Continuous
Pre-inspection and high
pressure filler Product cylinder inspection, cleaning, filling and cooling. Batch
Lime Pits Temporary storage of lime by-product Continuous
Atmospheric Impact Report: AIR Products Acetylene Plant, Gauteng
Report No.: 13ERM12 Rev 1.0 6
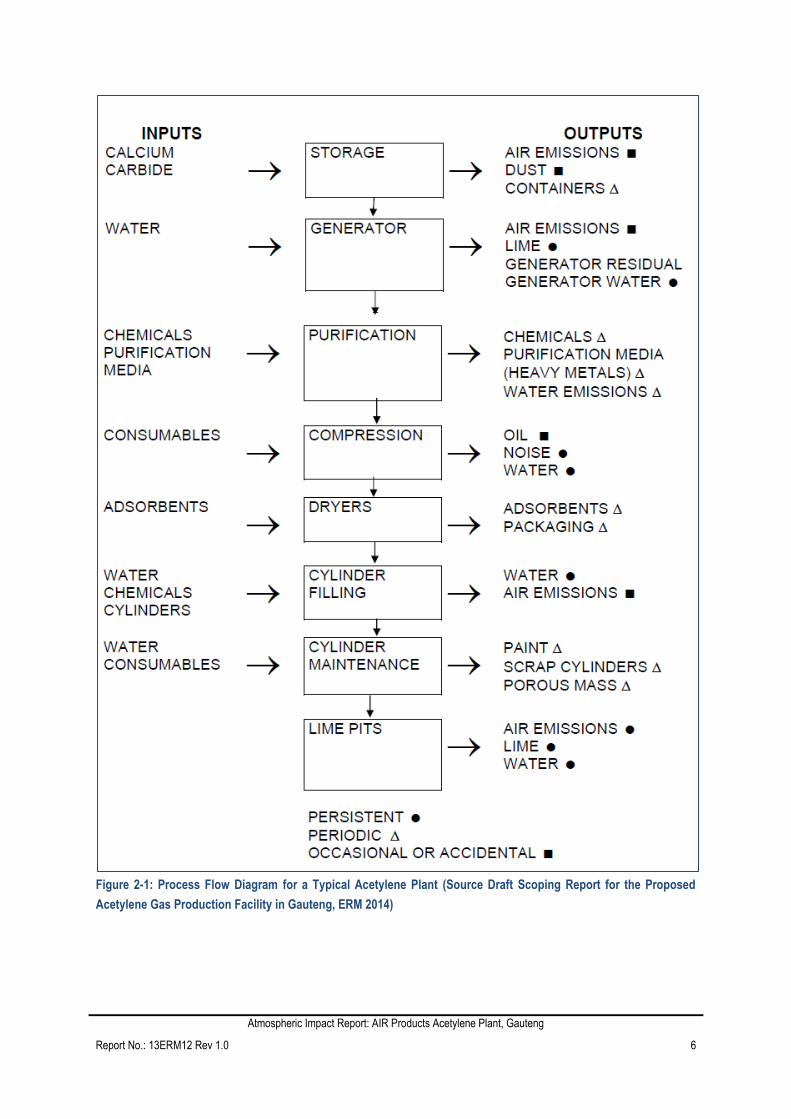
Figure 2-1: Process Flow Diagram for a Typical Acetylene Plant (Source Draft Scoping Report for the Proposed
Acetylene Gas Production Facility in Gauteng, ERM 2014)
Atmospheric Impact Report: AIR Products Acetylene Plant, Gauteng
Report No.: 13ERM12 Rev 1.0 7
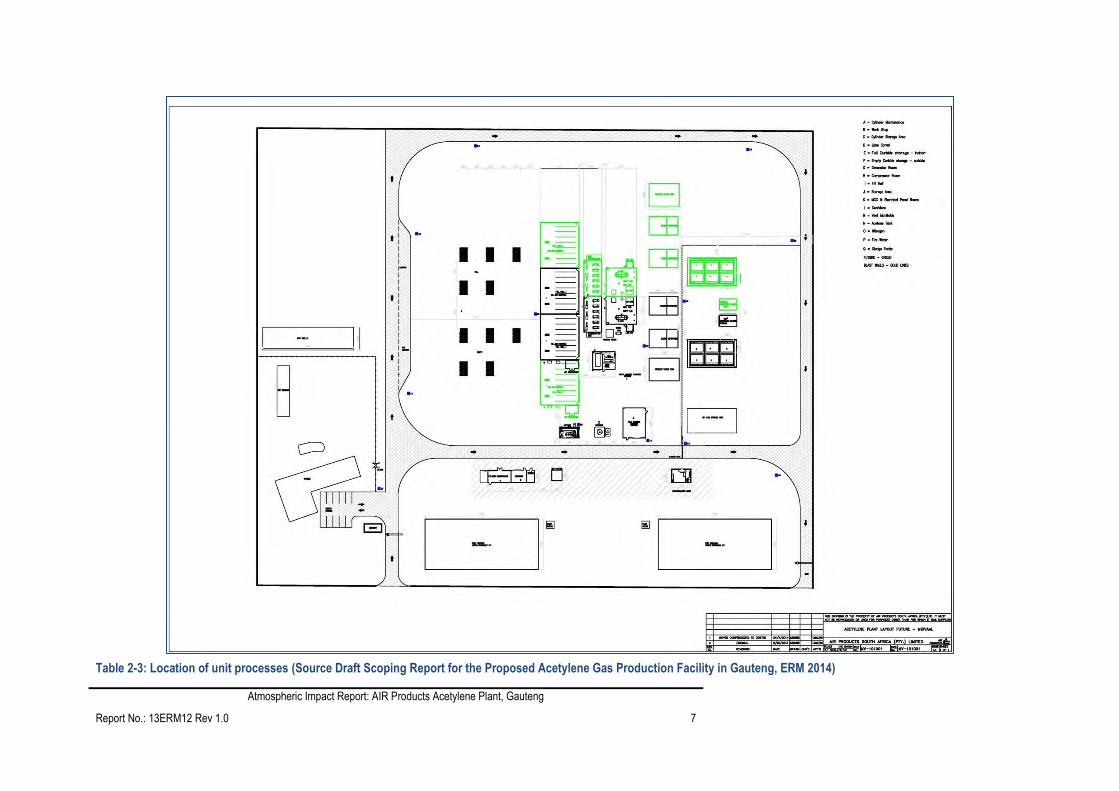
Table 2-3: Location of unit processes (Source Draft Scoping Report for the Proposed Acetylene Gas Production Facility in Gauteng, ERM 2014)

Atmospheric Impact Report: AIR Products Acetylene Plant, Gauteng
Report No.: 13ERM12 Rev 1.0 8
3 TECHNICAL INFORMATION
Raw material consumption, production rates and by-product productions rates are tabulated in Table 3-1, Table 3-2 and
Table 3-3 respectively.
Raw Materials Used and Production Rates 3.1
Table 3-1: Raw materials used
Production Rates 3.2
Table 3-2: Production rates
Table 3-3: By-products
Raw Material Type
Maximum Permitted
Consumption Rate
(Volume)
Design Consumption
Rate (Volume)
Actual Consumption
Rate (Volume) Units (quantity/period)
CaC2 24 24 tons/day
Production
Name
Maximum Production Capacity
Permitted (Volume)
Design Production
Capacity (Volume)
Actual Production
Capacity (Volume) Units (quantity/period)
Acetylene 10 10 tons/day
By-Product
Name
Maximum Production Capacity
Permitted (Volume)
Design Production
Capacity (Volume)
Actual Production
Capacity (Volume)
Units
(quantity/period)
Lime 28 28 tons/day
Atmospheric Impact Report: AIR Products Acetylene Plant, Gauteng
Report No.: 13ERM12 Rev 1.0 9
4 ATMOSPHERIC EMISSIONS
The establishment of a comprehensive emissions inventory formed the basis for the assessment of the air quality impacts from AIR Products Acetylene Plant operations on the receiving
environment.
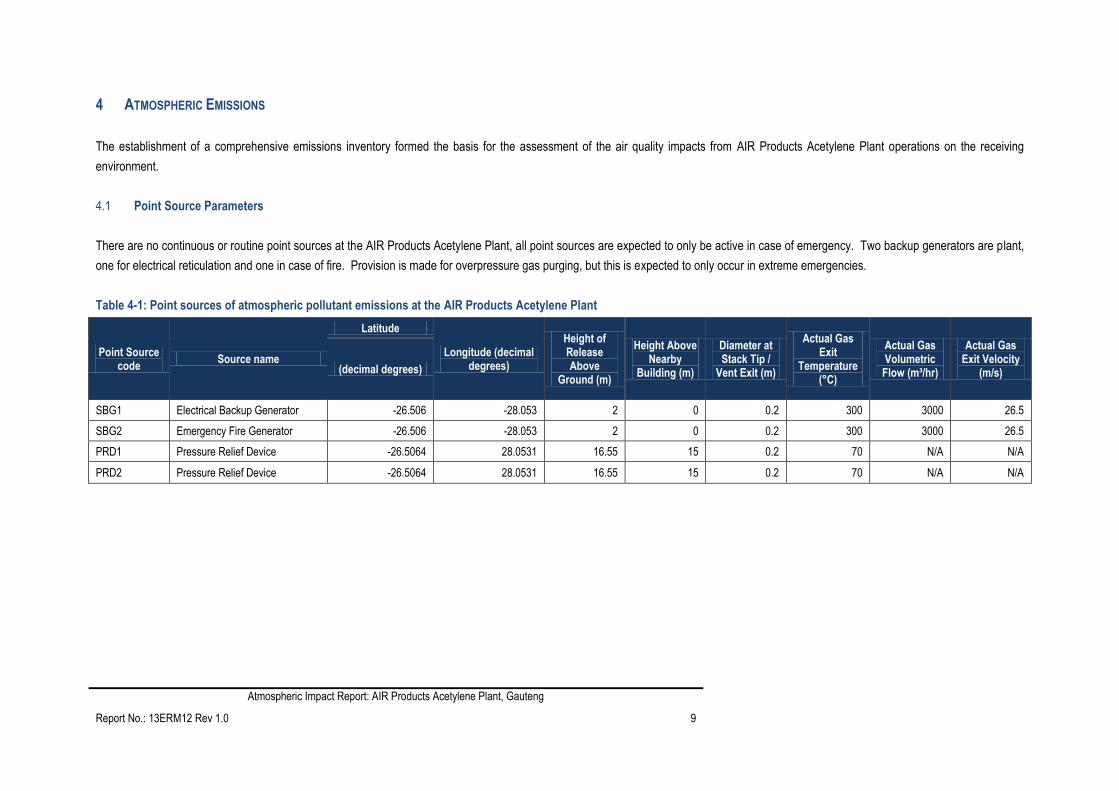
Point Source Parameters 4.1
There are no continuous or routine point sources at the AIR Products Acetylene Plant, all point sources are expected to only be active in case of emergency. Two backup generators are plant,
one for electrical reticulation and one in case of fire. Provision is made for overpressure gas purging, but this is expected to only occur in extreme emergencies.
Table 4-1: Point sources of atmospheric pollutant emissions at the AIR Products Acetylene Plant
Point Source code
Source name
Latitude
Longitude (decimal degrees)
Height of Release Above
Ground (m)
Height Above Nearby
Building (m)
Diameter at Stack Tip /
Vent Exit (m)
Actual Gas Exit
Temperature (°C)
Actual Gas Volumetric Flow (m³/hr)
Actual Gas Exit Velocity
(m/s) (decimal degrees)
SBG1 Electrical Backup Generator -26.506 -28.053 2 0 0.2 300 3000 26.5
SBG2 Emergency Fire Generator -26.506 -28.053 2 0 0.2 300 3000 26.5
PRD1 Pressure Relief Device -26.5064 28.0531 16.55 15 0.2 70 N/A N/A
PRD2 Pressure Relief Device -26.5064 28.0531 16.55 15 0.2 70 N/A N/A
Atmospheric Impact Report: AIR Products Acetylene Plant, Gauteng
Report No.: 13ERM12 Rev 1.0 10
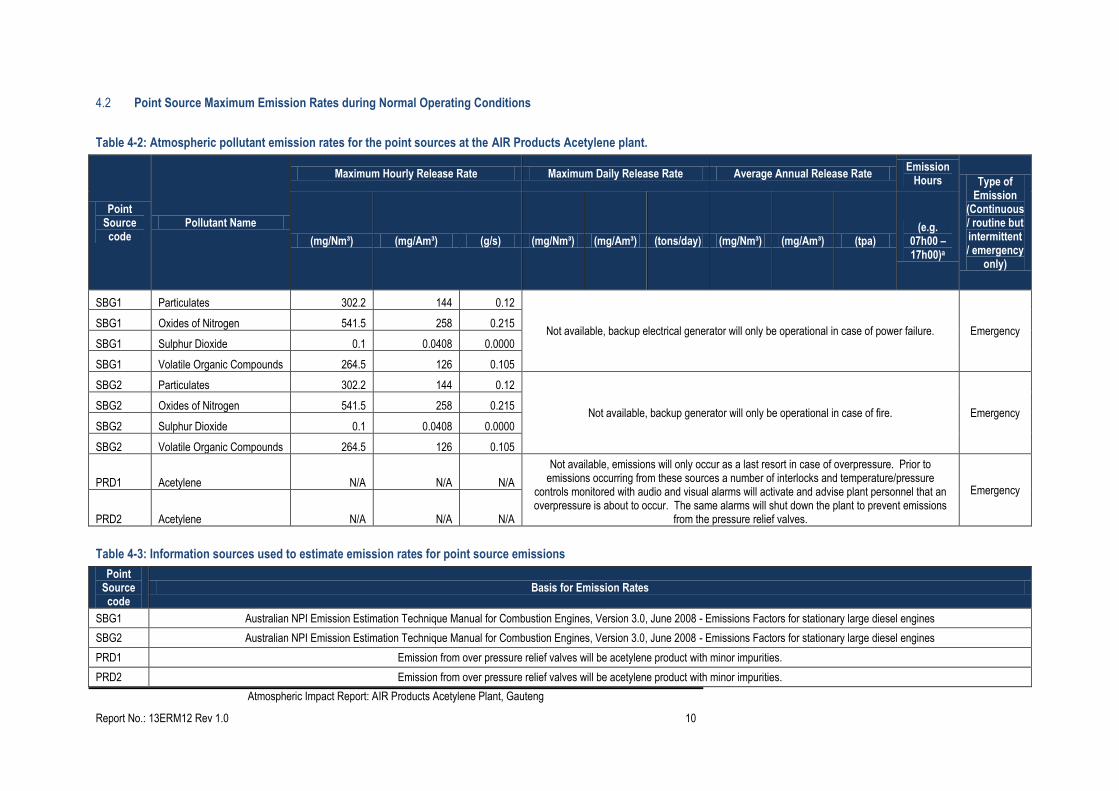
Point Source Maximum Emission Rates during Normal Operating Conditions 4.2
Table 4-2: Atmospheric pollutant emission rates for the point sources at the AIR Products Acetylene plant.
Point Source code
Pollutant Name
Maximum Hourly Release Rate Maximum Daily Release Rate Average Annual Release Rate Emission
Hours Type of Emission
(Continuous / routine but intermittent / emergency
only)
(mg/Nm³) (mg/Am³) (g/s) (mg/Nm³) (mg/Am³) (tons/day) (mg/Nm³) (mg/Am³) (tpa) (e.g.
07h00 – 17h00)a
SBG1 Particulates 302.2 144 0.12
Not available, backup electrical generator will only be operational in case of power failure. Emergency SBG1 Oxides of Nitrogen 541.5 258 0.215
SBG1 Sulphur Dioxide 0.1 0.0408 0.0000
SBG1 Volatile Organic Compounds 264.5 126 0.105
SBG2 Particulates 302.2 144 0.12
Not available, backup generator will only be operational in case of fire. Emergency SBG2 Oxides of Nitrogen 541.5 258 0.215
SBG2 Sulphur Dioxide 0.1 0.0408 0.0000
SBG2 Volatile Organic Compounds 264.5 126 0.105
PRD1 Acetylene N/A N/A N/A
Not available, emissions will only occur as a last resort in case of overpressure. Prior to emissions occurring from these sources a number of interlocks and temperature/pressure
controls monitored with audio and visual alarms will activate and advise plant personnel that an overpressure is about to occur. The same alarms will shut down the plant to prevent emissions
from the pressure relief valves.
Emergency
PRD2 Acetylene N/A N/A N/A
Table 4-3: Information sources used to estimate emission rates for point source emissions
Point Source code
Basis for Emission Rates
SBG1 Australian NPI Emission Estimation Technique Manual for Combustion Engines, Version 3.0, June 2008 - Emissions Factors for stationary large diesel engines
SBG2 Australian NPI Emission Estimation Technique Manual for Combustion Engines, Version 3.0, June 2008 - Emissions Factors for stationary large diesel engines
PRD1 Emission from over pressure relief valves will be acetylene product with minor impurities.
PRD2 Emission from over pressure relief valves will be acetylene product with minor impurities.

Atmospheric Impact Report: AIR Products Acetylene Plant, Gauteng
Report No.: 13ERM12 Rev 1.0 11
Fugitive Emissions 4.3
Parameters and emission rates for line and area sources at the Air Products Acetylene plant are given in Table 4-4 and Table 4-5.
Table 4-4: Area and/or line source parameters
Area Source code
Source name Source Description Latitude (decimal degrees) of SW
corner
Longitude (decimal
degrees) of SW corner
Height of Release Above
Ground (m)
Length of Area (m)
Width of Area (m)
Angle of Rotation
from True North (°)
FRK Forklifts Vehicle tailpipe emissions from on-site forklifts -26.053 28.053 0.5 60 60 10
ACT Acetone Tanks Standing and working losses from the Acetone tank
-26.5061 28.0532 4.8 2.2 2.2 10
ROAD1 On-site paved road
Vehicle entrainment and tailpipe emissions from product and raw materials on the on-site paved
roads.
-26.5055 28.0523 0 182 6 101
ROAD2 On-site paved road -26.5069 28.0519 0 160 6 12
ROAD3 On-site paved road -26.5069 28.0519 0 182 6 101
ROAD4 On-site paved road -26.5072 28.0534 0 160 6 12
CGL Closed Generator Loading Fugitive acetylene emissions during generator loading
-26.5064 28.0531 2 11 10 12
LST Lime sludge tanks Fugitive acetylene emissions from the lime sludge tanks
-26.5063 28.0532 1 10 7 12
Atmospheric Impact Report: AIR Products Acetylene Plant, Gauteng
Report No.: 13ERM12 Rev 1.0 12
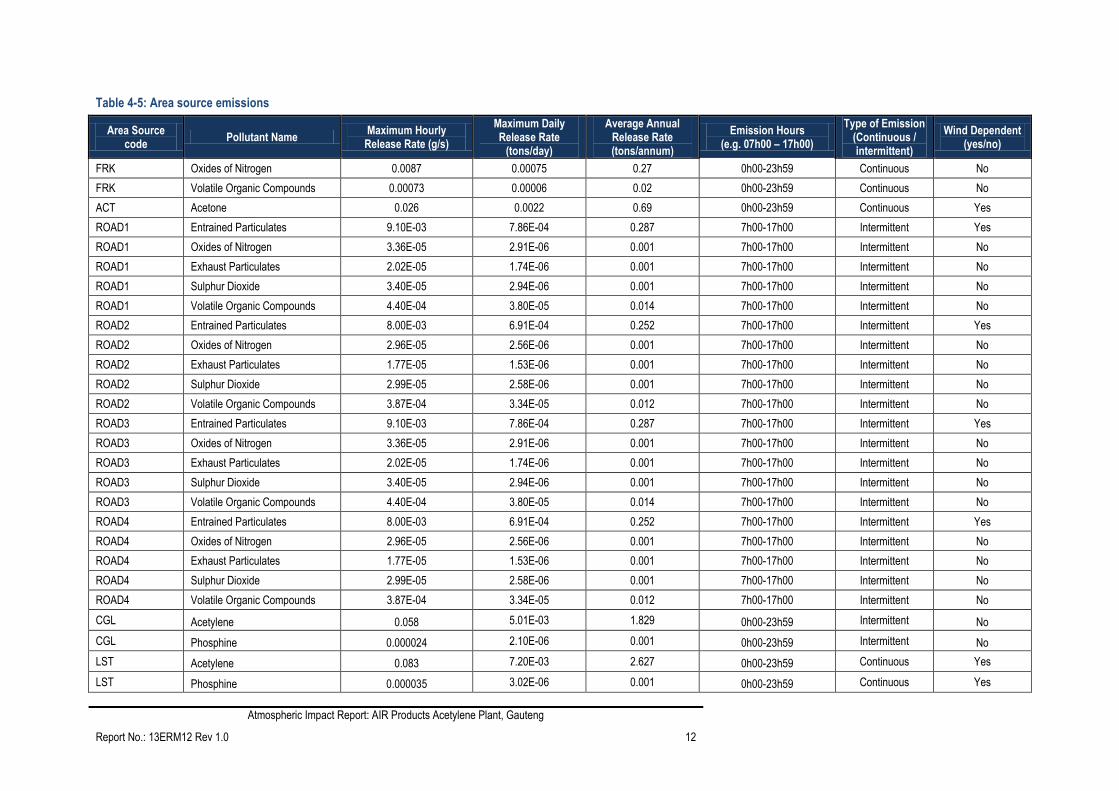
Table 4-5: Area source emissions
Area Source code
Pollutant Name Maximum Hourly Release Rate (g/s)
Maximum Daily Release Rate
(tons/day)
Average Annual Release Rate (tons/annum)
Emission Hours (e.g. 07h00 – 17h00)
Type of Emission (Continuous / intermittent)
Wind Dependent (yes/no)
FRK Oxides of Nitrogen 0.0087 0.00075 0.27 0h00-23h59 Continuous No
FRK Volatile Organic Compounds 0.00073 0.00006 0.02 0h00-23h59 Continuous No
ACT Acetone 0.026 0.0022 0.69 0h00-23h59 Continuous Yes
ROAD1 Entrained Particulates 9.10E-03 7.86E-04 0.287 7h00-17h00 Intermittent Yes
ROAD1 Oxides of Nitrogen 3.36E-05 2.91E-06 0.001 7h00-17h00 Intermittent No
ROAD1 Exhaust Particulates 2.02E-05 1.74E-06 0.001 7h00-17h00 Intermittent No
ROAD1 Sulphur Dioxide 3.40E-05 2.94E-06 0.001 7h00-17h00 Intermittent No
ROAD1 Volatile Organic Compounds 4.40E-04 3.80E-05 0.014 7h00-17h00 Intermittent No
ROAD2 Entrained Particulates 8.00E-03 6.91E-04 0.252 7h00-17h00 Intermittent Yes
ROAD2 Oxides of Nitrogen 2.96E-05 2.56E-06 0.001 7h00-17h00 Intermittent No
ROAD2 Exhaust Particulates 1.77E-05 1.53E-06 0.001 7h00-17h00 Intermittent No
ROAD2 Sulphur Dioxide 2.99E-05 2.58E-06 0.001 7h00-17h00 Intermittent No
ROAD2 Volatile Organic Compounds 3.87E-04 3.34E-05 0.012 7h00-17h00 Intermittent No
ROAD3 Entrained Particulates 9.10E-03 7.86E-04 0.287 7h00-17h00 Intermittent Yes
ROAD3 Oxides of Nitrogen 3.36E-05 2.91E-06 0.001 7h00-17h00 Intermittent No
ROAD3 Exhaust Particulates 2.02E-05 1.74E-06 0.001 7h00-17h00 Intermittent No
ROAD3 Sulphur Dioxide 3.40E-05 2.94E-06 0.001 7h00-17h00 Intermittent No
ROAD3 Volatile Organic Compounds 4.40E-04 3.80E-05 0.014 7h00-17h00 Intermittent No
ROAD4 Entrained Particulates 8.00E-03 6.91E-04 0.252 7h00-17h00 Intermittent Yes
ROAD4 Oxides of Nitrogen 2.96E-05 2.56E-06 0.001 7h00-17h00 Intermittent No
ROAD4 Exhaust Particulates 1.77E-05 1.53E-06 0.001 7h00-17h00 Intermittent No
ROAD4 Sulphur Dioxide 2.99E-05 2.58E-06 0.001 7h00-17h00 Intermittent No
ROAD4 Volatile Organic Compounds 3.87E-04 3.34E-05 0.012 7h00-17h00 Intermittent No
CGL Acetylene 0.058 5.01E-03 1.829 0h00-23h59 Intermittent No
CGL Phosphine 0.000024 2.10E-06 0.001 0h00-23h59 Intermittent No
LST Acetylene 0.083 7.20E-03 2.627 0h00-23h59 Continuous Yes
LST Phosphine 0.000035 3.02E-06 0.001 0h00-23h59 Continuous Yes
Atmospheric Impact Report: AIR Products Acetylene Plant, Gauteng
Report No.: 13ERM12 Rev 1.0 13
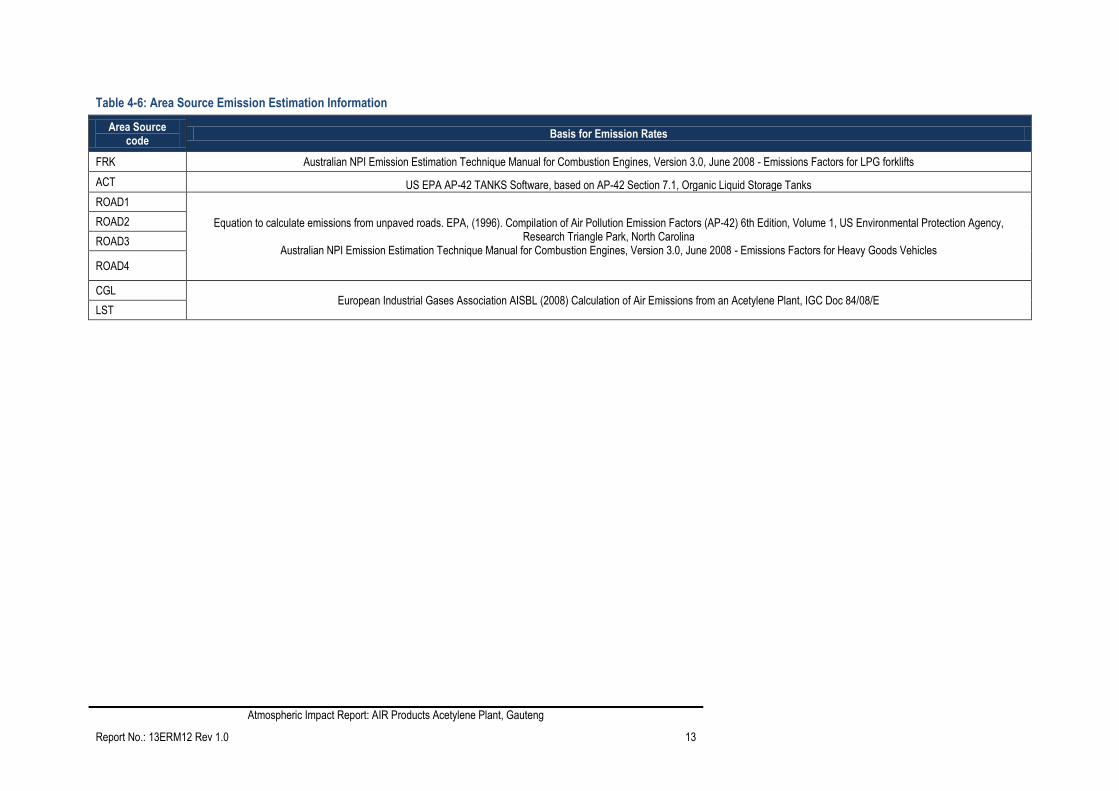
Table 4-6: Area Source Emission Estimation Information
Area Source code
Basis for Emission Rates
FRK Australian NPI Emission Estimation Technique Manual for Combustion Engines, Version 3.0, June 2008 - Emissions Factors for LPG forklifts
ACT US EPA AP-42 TANKS Software, based on AP-42 Section 7.1, Organic Liquid Storage Tanks
ROAD1
Equation to calculate emissions from unpaved roads. EPA, (1996). Compilation of Air Pollution Emission Factors (AP-42) 6th Edition, Volume 1, US Environmental Protection Agency, Research Triangle Park, North Carolina
Australian NPI Emission Estimation Technique Manual for Combustion Engines, Version 3.0, June 2008 - Emissions Factors for Heavy Goods Vehicles
ROAD2
ROAD3
ROAD4
CGL European Industrial Gases Association AISBL (2008) Calculation of Air Emissions from an Acetylene Plant, IGC Doc 84/08/E
LST
Atmospheric Impact Report: AIR Products Acetylene Plant, Gauteng
Report No.: 13ERM12 Rev 1.0 14
Emergency Incidents 4.4
The AIR Products Acetylene plant is a new plant and as such no emergency incidents have been recorded.
5 IMPACT OF ENTERPRISE ON THE RECEIVING ENVIRONMENT
Analysis of Emissions’ Impact on Human Health 5.1
5.1.1 Study Methodology
5.1.1.1 Study Plan
The study methodology may conveniently be divided into a “preparatory phase” and an “execution phase”.
The preparatory phase included the flowing basic steps prior to performing the actual dispersion modelling and analyses:
1. Understand Scope of Work
2. Assign Appropriate Specialists (See Appendix A)
3. Review of legal requirements (e.g. dispersion modeling guideline) (see Section 5.1.2)
4. Decide on Dispersion Model (see Section 5.1.1.2)
The Draft Regulations Regarding Air Dispersion Modelling (Gazette No 35981 published 14 December 2012) was
referenced for the dispersion model selection.
Three levels of assessment are defined in the Draft Regulations regarding Air Dispersion Modelling:
Level 1: where worst-case air quality impacts are assessed using simpler screening models
Level 2: for assessment of air quality impacts as part of license application or amendment processes, where
impacts are the greatest within a few kilometers downwind (less than 50km)
Level 3: requires more sophisticated dispersion models (and corresponding input data, resources and model
operator expertise) in situations:
- where a detailed understanding of air quality impacts, in time and space, is required;
- where it is important to account for causality effects, calms, non-linear plume trajectories, spatial
variations in turbulent mixing, multiple source types, and chemical transformations;
- when conducting permitting and/or environmental assessment process for large industrial developments
that have considerable social, economic and environmental consequences;
- when evaluating air quality management approaches involving multi-source, multi-sector contributions
from permitted and non-permitted sources in an airshed; or,
- when assessing contaminants resulting from non-linear processes (e.g. deposition, ground-level ozone
(O3), particulate formation, visibility).
This study was considered to meet the requirements of a Level 2 assessment, and AERMOD was selected on the basis that
this Gaussian plume model is well suited to simulate dispersion where transport distances are likely to be less than 50 km.
The execution phase (i.e. dispersion modelling and analyses) firstly involves gathering specific information in relation to the
emission source(s) and site(s) to be assessed. This includes:
Source information: Emission rate, exit temperature, volume flow, exit velocity, etc.;
Site information: Site building layout, terrain information, land use data;
Atmospheric Impact Report: AIR Products Acetylene Plant, Gauteng
Report No.: 13ERM12 Rev 1.0 15
Meteorological data: Wind speed, wind direction, temperature, cloud cover, mixing height;
Receptor information: Locations using discrete receptors and/or gridded receptors.
The model uses this specific input data to run various algorithms to estimate the dispersion of pollutants between the source
and receptor. The model output is in the form of a predicted time-averaged concentration at the receptor. These predicted
concentrations are added to suitable background concentrations and compared with the relevant ambient air quality
standard or guideline. In some cases post-processing can be carried out to produce percentile concentrations or contour
plots that can be prepared for reporting purposes.
5.1.1.2 Dispersion Model Selection
Gaussian plume models are best used for near-field applications where the steady-state meteorology assumption is most
likely to apply. One of the most widely used Gaussian plume model is the US EPA AERMOD model that was used in this
study. AERMOD is a model developed with the support of the AMS/EPA Regulatory Model Improvement Committee
(AERMIC), whose objective has been to include state-of the-art science in regulatory models (Hanna et al, 19991).
AERMOD is a dispersion modelling system with three components, namely: AERMOD (AERMIC Dispersion Model),
AERMAP (AERMOD terrain pre-processor), and AERMET (AERMOD meteorological pre-processor).
AERMOD is an advanced new-generation model. It is designed to predict pollution concentrations from continuous point,
flare, area, line, and volume sources. AERMOD offers new and potentially improved algorithms for plume rise and
buoyancy, and the computation of vertical profiles of wind, turbulence and temperature however retains the single straight
line trajectory limitation. AERMET is a meteorological pre-processor for AERMOD. Input data can come from hourly cloud
cover observations, surface meteorological observations and twice-a-day upper air soundings. Output includes surface
meteorological observations and parameters and vertical profiles of several atmospheric parameters. AERMAP is a terrain
pre-processor designed to simplify and standardise the input of terrain data for AERMOD. Input data includes receptor
terrain elevation data. The terrain data may be in the form of digital terrain data. The output includes, for each receptor,
location and height scale, which are elevations used for the computation of air flow around hills.
A disadvantage of the model is that spatial varying wind fields, due to topography or other factors cannot be included.
Input data types required for the AERMOD model include: source data, meteorological data (pre-processed by the AERMET
model), terrain data and information on the nature of the receptor grid.
Version (version 7.2.5) of the AERMOD and its pre-processors were used in the study.
5.1.2 Legal Requirements
5.1.2.1 Vaal Triangle Airshed Priority Area
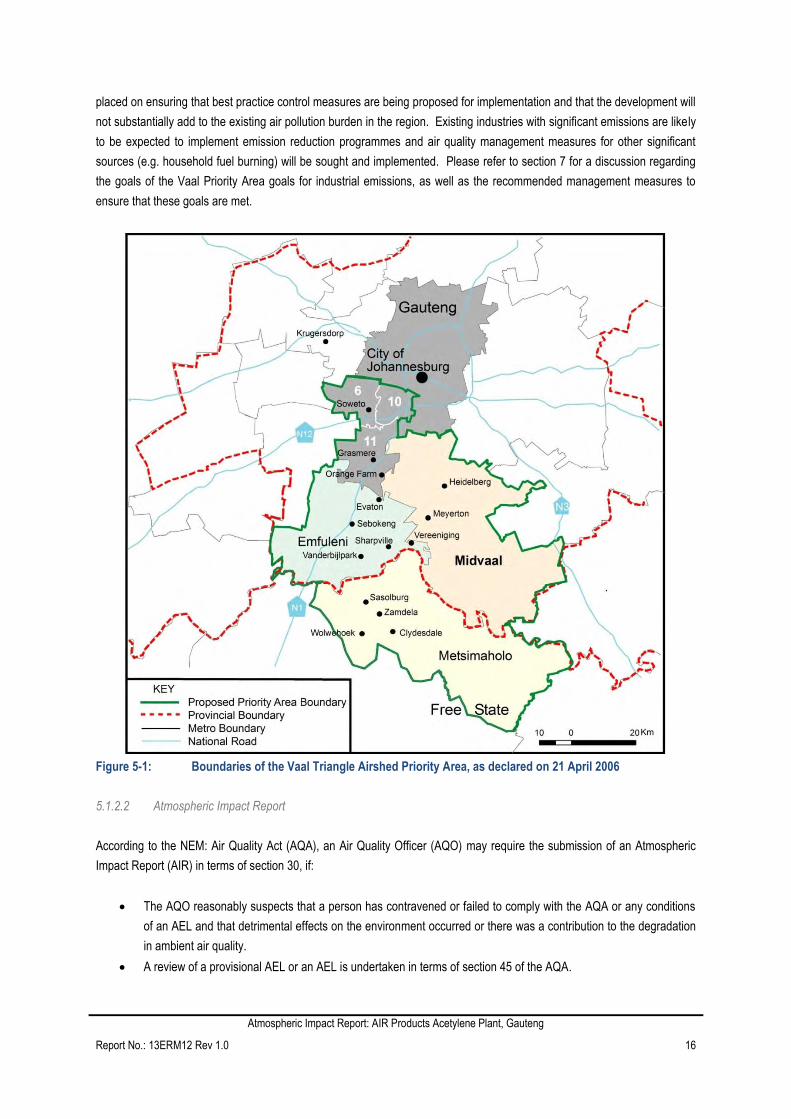
The Vaal Triangle Airshed was declared the first priority area by the minister on 21 April 2006 (Figure 2-1). The location of
the proposed Air Products Acetylene Plant within the Vaal Triangle Priority area has several important implications for these
operations. New developments which are associated with atmospheric emissions and hence the potential for contributing to
air pollutant concentrations are being subject to intense scrutiny by national air pollution control officers. Emphasis is being
1 Hanna S. R., Egan B. A. Purdum J. and Wagler J. (1999) Evaluation of the ADMS, AERMOD, and ISC3 Dispersion Models with the
Optex, Duke Forest, Kincaid, Indianapolis, and Lovett Field Data Sets, International Journal of Environment and Pollution (Volume 16,
Nos. 1-6, 2001).
Atmospheric Impact Report: AIR Products Acetylene Plant, Gauteng
Report No.: 13ERM12 Rev 1.0 16
placed on ensuring that best practice control measures are being proposed for implementation and that the development will
not substantially add to the existing air pollution burden in the region. Existing industries with significant emissions are likely
to be expected to implement emission reduction programmes and air quality management measures for other significant
sources (e.g. household fuel burning) will be sought and implemented. Please refer to section 7 for a discussion regarding
the goals of the Vaal Priority Area goals for industrial emissions, as well as the recommended management measures to
ensure that these goals are met.
Figure 5-1: Boundaries of the Vaal Triangle Airshed Priority Area, as declared on 21 April 2006
5.1.2.2 Atmospheric Impact Report
According to the NEM: Air Quality Act (AQA), an Air Quality Officer (AQO) may require the submission of an Atmospheric
Impact Report (AIR) in terms of section 30, if:
The AQO reasonably suspects that a person has contravened or failed to comply with the AQA or any conditions
of an AEL and that detrimental effects on the environment occurred or there was a contribution to the degradation
in ambient air quality.
A review of a provisional AEL or an AEL is undertaken in terms of section 45 of the AQA.
Atmospheric Impact Report: AIR Products Acetylene Plant, Gauteng
Report No.: 13ERM12 Rev 1.0 17
The format of the Atmospheric Impact Report is stipulated in the Regulations Prescribing the Format of the Atmospheric
Impact Report, Government Gazette No. 36904, Notice Number 747 of 2013 (11 October 2013).
5.1.2.3 National Ambient Air Quality Standards and Health Effect Screening Levels
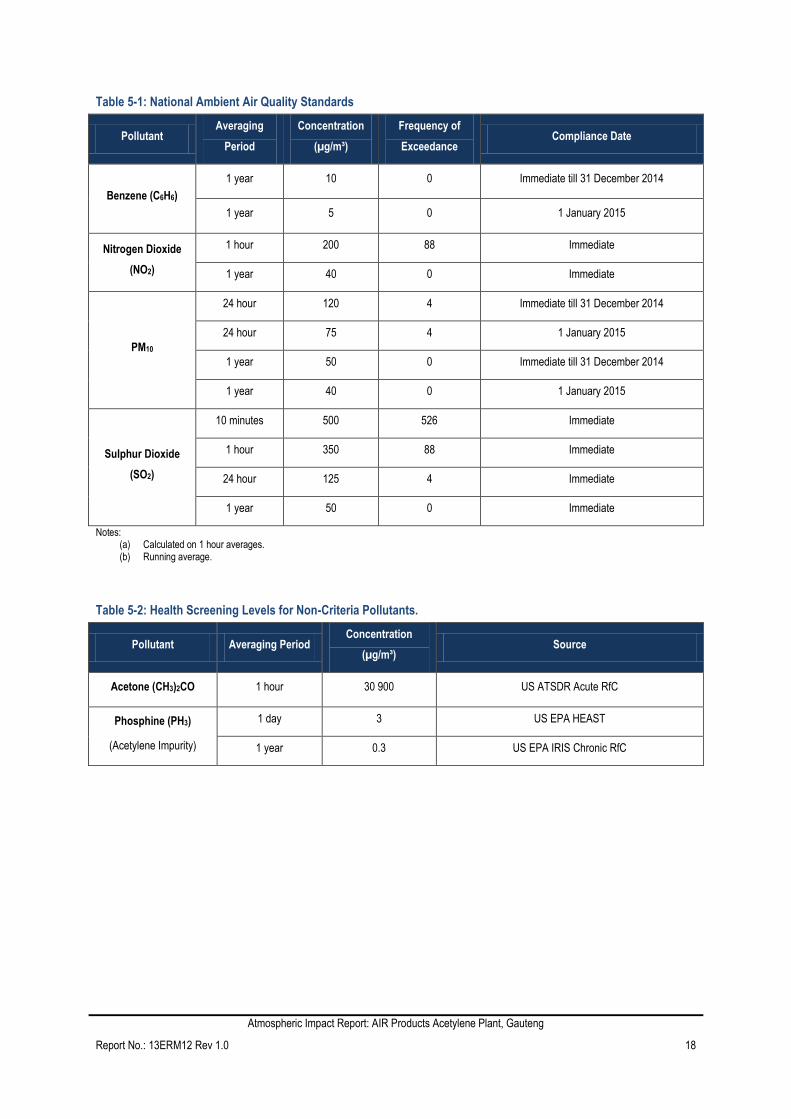
Measured and modelled concentrations were assessed against National Ambient Air Quality Standards (NAAQS - Table
5-1). Sulphur dioxide (SO2), nitrogen dioxide (NO2) and respirable particulates (PM10) are the pollutants of concern in this
assessment. The health effect screening levels used in this assessment for non-criteria pollutants (Phosphine PH3 and
VOCs) are discussed below (Table 5-2).
The four closest monitoring stations, to the project site (Section 5.2), do not measure VOC concentrations and a SA NAAQS
has also not been established for VOCs. It was therefore decided to calculate cumulative VOC impacts with baseline
benzene concentrations, which are measured at the four closest monitoring stations, and to assess cumulative
concentrations against the SA annual NAAQS for benzene (5 µg/m³).
Acetylene is considered non-toxic at normal ambient concentrations, but some acetylene impurities (especially phosphine)
could be detrimental to human health if sufficient quantities of acetylene are emitted.
Acetone, like acetylene, is considered non-toxic at normal ambient concentrations, the most stringent health guideline
identified for acetone is the United States Agency for Toxic Substance and Disease Registry (US ATSDR) acute inhalation
reference concentration (RfC) of 30 900 µg/m³.
The United States Environmental Protection Agency’s Integrated Risk Information System (US EPA IRIS) provides a
Chronic inhalation reference concentration (RfC) of 0.3 µg/m³ for phosphine. This is the reference level under which an
individual is expected not to incur any adverse effects over a lifetime’s exposure. Annual average PH3 concentrations were
evaluated against this RfC.
For short term averages PH3 concentrations were evaluated against the US EPA Health Effects Assessment Summary
Tables (HEAST) sub-chronic RfC of 3 µg/m³. This is the reference level under which an individual is expected not to incur
any adverse effects over a short term (14-day) exposure.
Atmospheric Impact Report: AIR Products Acetylene Plant, Gauteng
Report No.: 13ERM12 Rev 1.0 18
Table 5-1: National Ambient Air Quality Standards
Pollutant Averaging
Period
Concentration
(µg/m³)
Frequency of
Exceedance Compliance Date
Benzene (C6H6)
1 year 10 0 Immediate till 31 December 2014
1 year 5 0 1 January 2015
Nitrogen Dioxide
(NO2)
1 hour 200 88 Immediate
1 year 40 0 Immediate
PM10
24 hour 120 4 Immediate till 31 December 2014
24 hour 75 4 1 January 2015
1 year 50 0 Immediate till 31 December 2014
1 year 40 0 1 January 2015
Sulphur Dioxide
(SO2)
10 minutes 500 526 Immediate
1 hour 350 88 Immediate
24 hour 125 4 Immediate
1 year 50 0 Immediate
Notes: (a) Calculated on 1 hour averages. (b) Running average.
Table 5-2: Health Screening Levels for Non-Criteria Pollutants.
Pollutant Averaging Period Concentration
(µg/m³) Source
Acetone (CH3)2CO 1 hour 30 900 US ATSDR Acute RfC
Phosphine (PH3)
(Acetylene Impurity)
1 day 3 US EPA HEAST
1 year 0.3 US EPA IRIS Chronic RfC
Atmospheric Impact Report: AIR Products Acetylene Plant, Gauteng
Report No.: 13ERM12 Rev 1.0 19
5.1.3 Atmospheric Dispersion Potential
Meteorological mechanisms govern the dispersion, transformation, and eventual removal of pollutants from the atmosphere.
The analysis of hourly average meteorological data is necessary to facilitate a comprehensive understanding of the
dispersion potential of the site. The horizontal dispersion of pollution is largely a function of the wind field. The wind speed
determines both the distance of downward transport and the rate of dilution of pollutants.
For this assessment, SAWS measured meteorological data from the nearby Vereeniging SAWS weather station (located
11 km south west of the proposed plant site) provided the parameters useful for describing the dispersion and dilution
potential of the site i.e. wind speed, wind direction, temperature and atmospheric stability, as discussed below.
5.1.3.1 Surface Wind Field
The speed and direction of the surface wind field is responsible for the horizontal dispersion of pollution in the atmospheric
boundary layer. The wind speed determines both the distance of downwind transport and the rate of dilution as a result of
plume stretching. Similarly, wind speed and surface roughness determine the amount of mechanical turbulence in the
atmospheric boundary layer. In turn, the dominant wind direction and the variability in wind direction determine the general
path pollutants will follow and the extent of crosswind spreading.
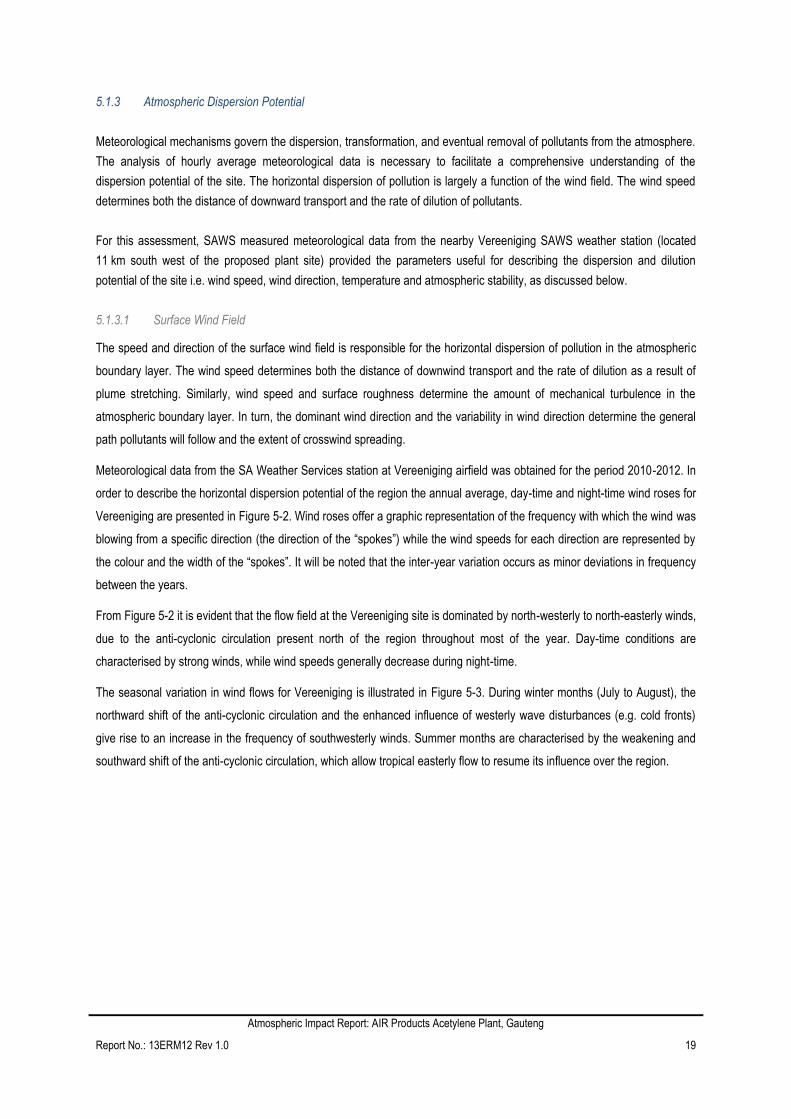
Meteorological data from the SA Weather Services station at Vereeniging airfield was obtained for the period 2010-2012. In
order to describe the horizontal dispersion potential of the region the annual average, day-time and night-time wind roses for
Vereeniging are presented in Figure 5-2. Wind roses offer a graphic representation of the frequency with which the wind was
blowing from a specific direction (the direction of the “spokes”) while the wind speeds for each direction are represented by
the colour and the width of the “spokes”. It will be noted that the inter-year variation occurs as minor deviations in frequency
between the years.
From Figure 5-2 it is evident that the flow field at the Vereeniging site is dominated by north-westerly to north-easterly winds,
due to the anti-cyclonic circulation present north of the region throughout most of the year. Day-time conditions are
characterised by strong winds, while wind speeds generally decrease during night-time.
The seasonal variation in wind flows for Vereeniging is illustrated in Figure 5-3. During winter months (July to August), the
northward shift of the anti-cyclonic circulation and the enhanced influence of westerly wave disturbances (e.g. cold fronts)
give rise to an increase in the frequency of southwesterly winds. Summer months are characterised by the weakening and
southward shift of the anti-cyclonic circulation, which allow tropical easterly flow to resume its influence over the region.
Atmospheric Impact Report: AIR Products Acetylene Plant, Gauteng
Report No.: 13ERM12 Rev 1.0 20
Figure 5-2: Average, day-time and night-time wind roses for Vereeniging, 2010 to 2012
An increase in the frequency of north-easterly winds during summer months (December to February) and the continued
prevalence of north-westerly and northerly airflow reflects the combined influence of anti-cyclonic subsidence and tropical
easterly wave systems.

Atmospheric Impact Report: AIR Products Acetylene Plant, Gauteng
Report No.: 13ERM12 Rev 1.0 21
Figure 5-3: Seasonal variation in wind patterns of Vereeniging, 2010 to 2012
5.1.3.2 Mixing Depth and Atmospheric Stability
The vertical component of dispersion is a function of the extent of thermal turbulence and the depth of the surface-mixing
layer. Unfortunately, the mixing layer is not easily measured and is often estimated using prognostic models that derive the
depth from other parameters that are routinely measured, e.g. solar radiation and temperature.
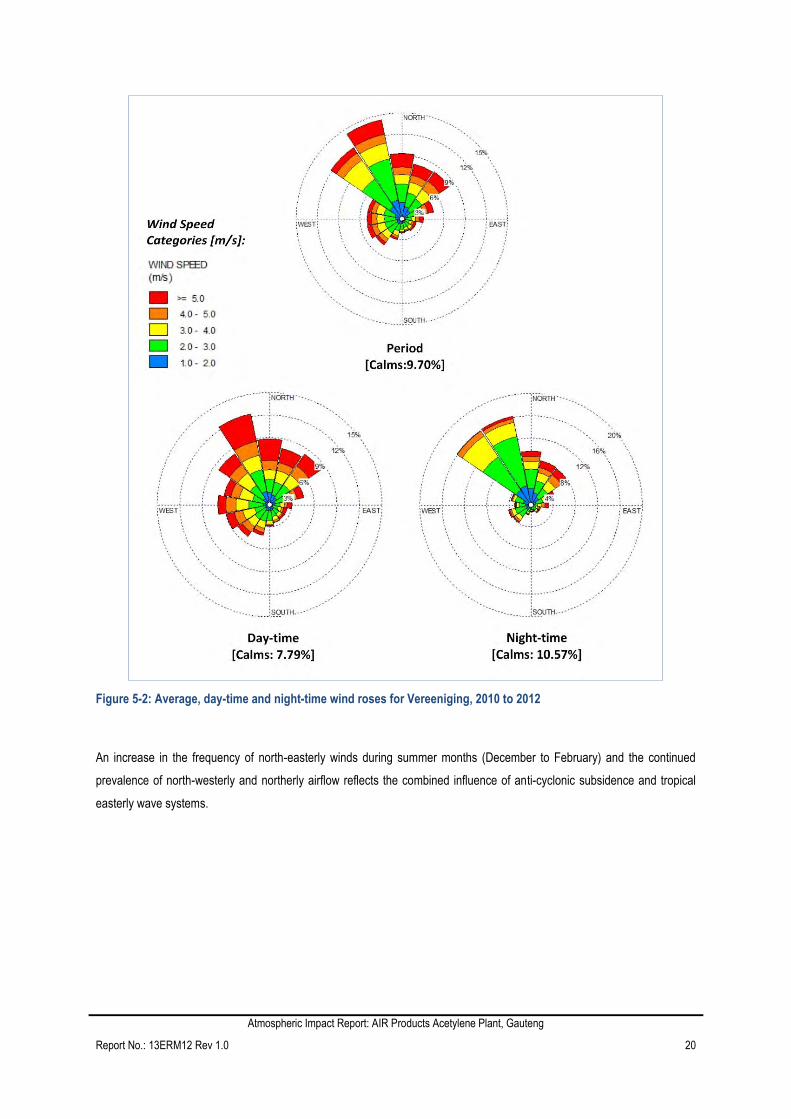
In older models, atmospheric stability is frequently categorised into one of six stability classes. These are described in Table
5-3. The atmospheric stability of Vereeniging for the period between 2010 and 2012 is illustrated in Figure 5-4. Stable
conditions normally result in high ground level concentrations for low level releases, e.g. fugitive emissions from vehicle
entrainment. Air pollution episodes also frequently occur just prior to the passage of a frontal system, which is characterised
by calm winds and stable conditions. Most of the stable conditions occurred during north to north-westerly flows, followed by
east to north-easterlies. Unstable conditions were more dominant during south-easterly to south-westerly winds and the
frequency of occurrence for neutral conditions was relatively high for all wind flows.
Atmospheric Impact Report: AIR Products Acetylene Plant, Gauteng
Report No.: 13ERM12 Rev 1.0 22
Table 5-3: Atmospheric stability classes
Class Description
A Very unstable Calm wind, clear skies, hot daytime conditions
B Moderately unstable Clear skies, daytime conditions
C Unstable Moderate wind, slightly overcast daytime conditions
D Neutral High winds or cloudy days and nights
E Stable Moderate wind, slightly overcast night-time conditions
F Very stable Low winds, clear skies, cold night-time conditions
Figure 5-4: Atmospheric stability of Vereeniging for the period 2010 – 2012.
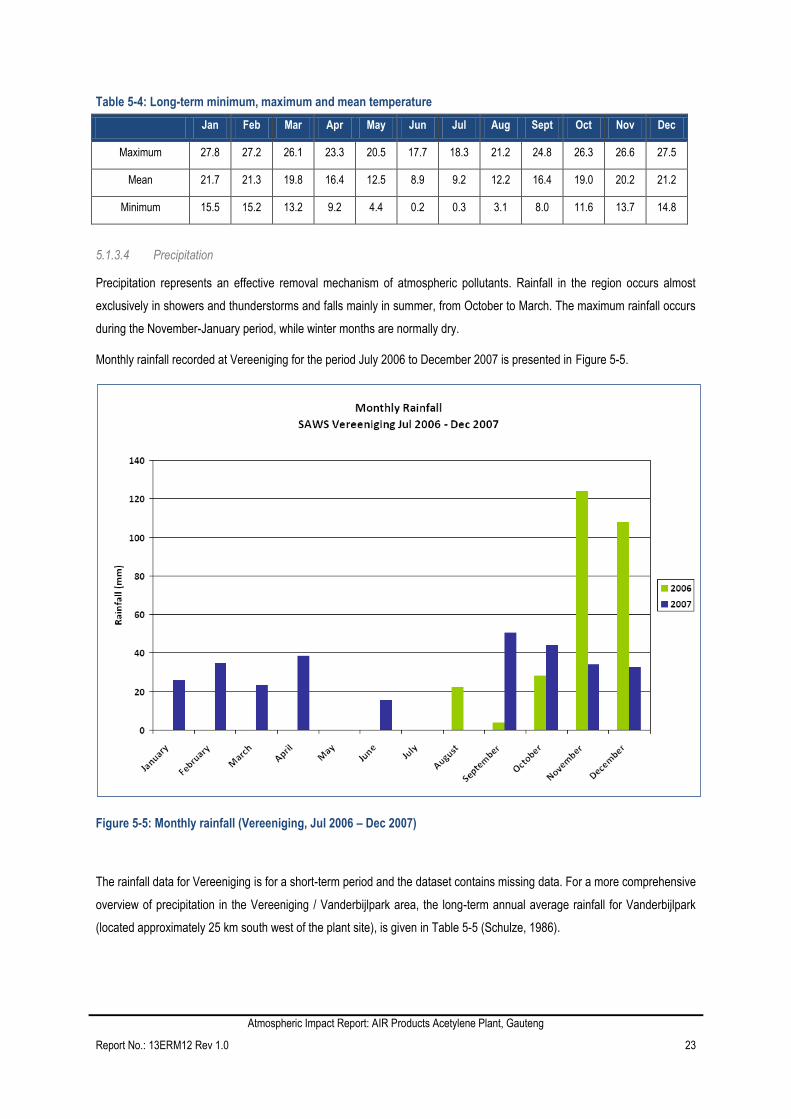
5.1.3.3 Temperature
Air temperature is important in determining the effect of plume buoyancy and the development of mixing and inversion
layers. The larger the temperature difference between the plume and the ambient air, the higher the plume is able to rise.
The long-term average (1903-1984) maximum, mean and minimum temperatures for Vereeniging are summarised in Table
5-4 (Schulze, 19862).
The annual maximum, minimum and mean temperatures are given as 23.9°C, 9.1°C and 16.6°C, respectively. Average
daily maximum temperatures range from 27.8°C in January to 17.7°C in July, with daily minima ranging from 15.5°C in
January to just above 0°C in June and July.
2 Schulze, B.R., (1986): Climate of South Africa, Part 8, General Survey, S.A Weather Bureau, WB28, 322pp
Atmospheric Impact Report: AIR Products Acetylene Plant, Gauteng
Report No.: 13ERM12 Rev 1.0 23
Table 5-4: Long-term minimum, maximum and mean temperature
Jan Feb Mar Apr May Jun Jul Aug Sept Oct Nov Dec
Maximum 27.8 27.2 26.1 23.3 20.5 17.7 18.3 21.2 24.8 26.3 26.6 27.5
Mean 21.7 21.3 19.8 16.4 12.5 8.9 9.2 12.2 16.4 19.0 20.2 21.2
Minimum 15.5 15.2 13.2 9.2 4.4 0.2 0.3 3.1 8.0 11.6 13.7 14.8
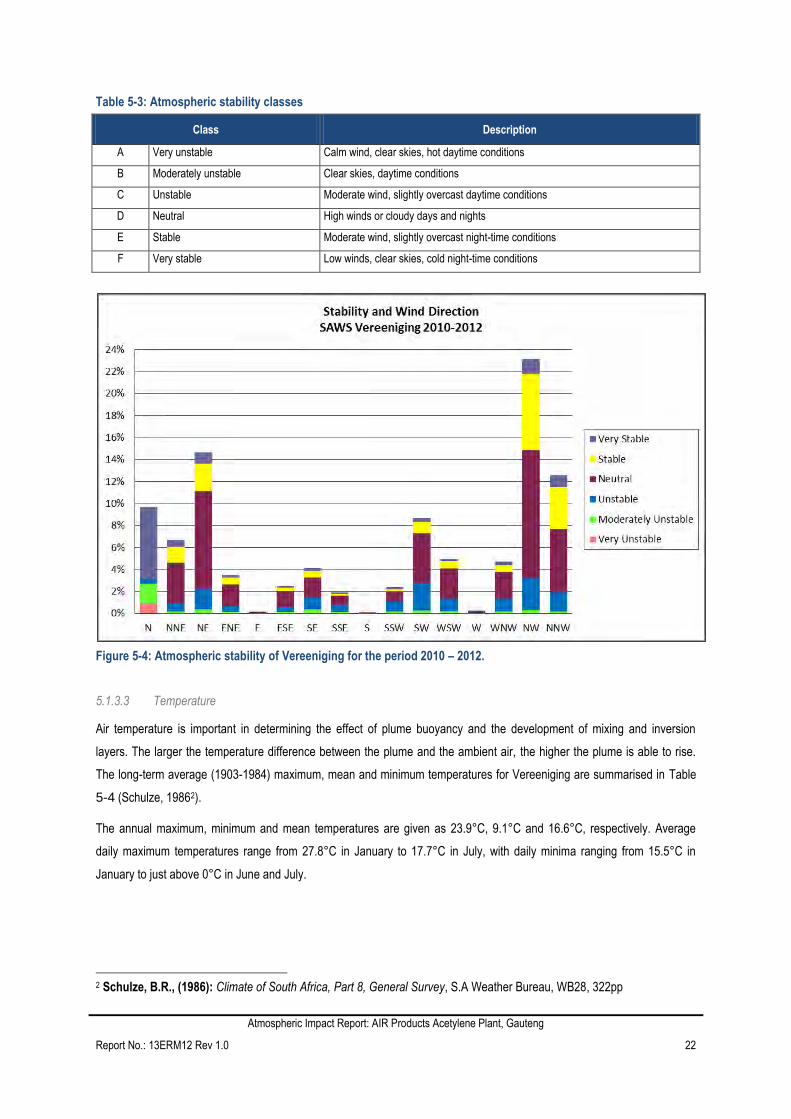
5.1.3.4 Precipitation
Precipitation represents an effective removal mechanism of atmospheric pollutants. Rainfall in the region occurs almost
exclusively in showers and thunderstorms and falls mainly in summer, from October to March. The maximum rainfall occurs
during the November-January period, while winter months are normally dry.
Monthly rainfall recorded at Vereeniging for the period July 2006 to December 2007 is presented in Figure 5-5.
Figure 5-5: Monthly rainfall (Vereeniging, Jul 2006 – Dec 2007)
The rainfall data for Vereeniging is for a short-term period and the dataset contains missing data. For a more comprehensive
overview of precipitation in the Vereeniging / Vanderbijlpark area, the long-term annual average rainfall for Vanderbijlpark
(located approximately 25 km south west of the plant site), is given in Table 5-5 (Schulze, 1986).
Atmospheric Impact Report: AIR Products Acetylene Plant, Gauteng
Report No.: 13ERM12 Rev 1.0 24
Table 5-5: Long-term average monthly rainfall (Schulze, 1986)
Jan Feb Mar Apr May Jun Jul Aug Sep Oct Nov Dec Total
Average rainfall
(mm) 120 87 68 65 22 8 11 4 24 65 102 101 677
No of rain days 12.8 9.5 9.4 8.0 4.1 1.8 1.6 0.8 3.6 8.2 11.8 12.5 84.1
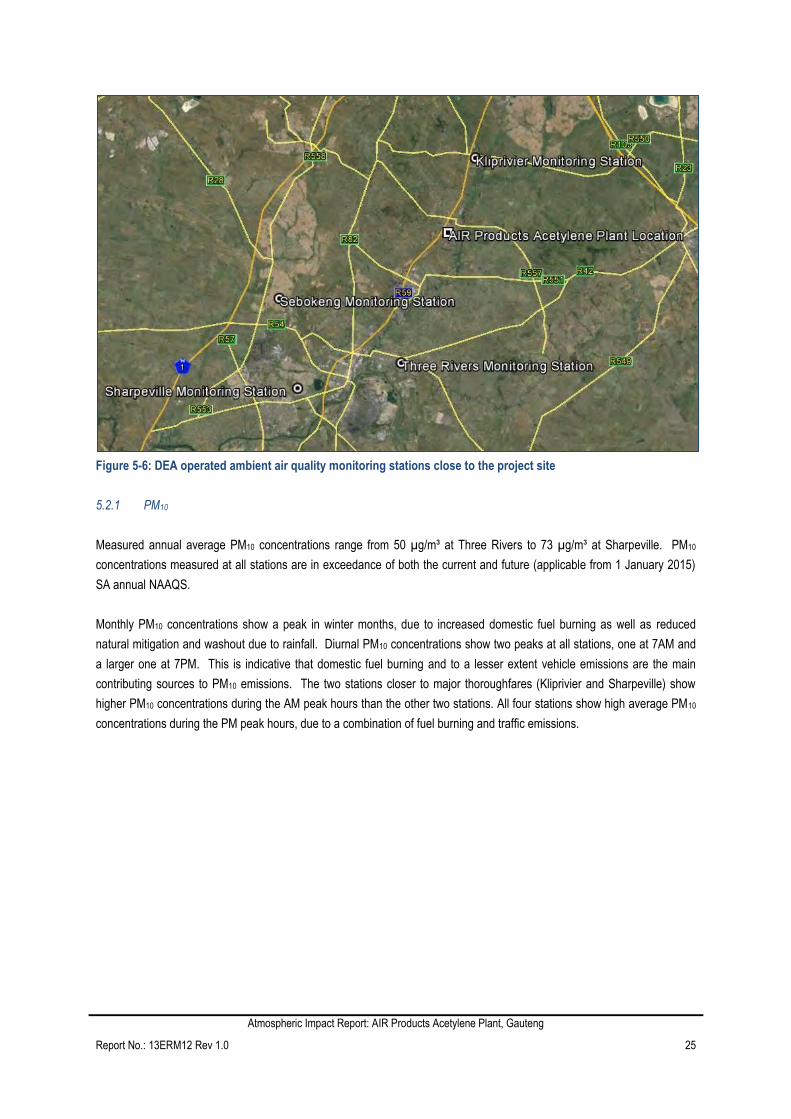
Air Quality Monitoring data 5.2
The Department of Environmental Affairs (DEA) operates six ambient monitoring stations in the Vaal Airshed Priority area,
four of which are situated close to the project site (Figure 5-6) and assumed to be representative of ambient air quality in the
study area. The monitoring stations from which baseline air quality information will be assessed, as well as the distance to
each and advantages and disadvantages of each (relating to this study) include:
Kliprivier, situated approximately 10 km north-northeast of the project site at the Kliprivier police station is situated
in a small industrial area, but is also downwind from the major industrial area of Alrode in Ekurhuleni, as well as
downwind from the townships of Katlehong and Thokoza. This site is expected to reflect higher ambient pollutant
concentrations - compared to the project site - due to impacts from localized sources as well as the
abovementioned industrial and residential areas. The Kliprivier station is situated a similar distance from the R59
highway as the project site.
Sharpeville, situated approximately 27 km southwest of the project site in the Sharpeville township. The
Sharpeville monitoring station is expected to reflect higher pollutant concentrations - compared to the project site -
due to domestic fuel burning activities in the township, especially during winter months. The Sharpeville station
also lies between the industrial areas of Vereeniging and Vanderbijlpark and is expected to reflect industrial
emissions from these areas.
Sebokeng, situated approximately 23 km west-southwest of the project site in the northern parts of the Sebokeng
township. This site is expected to reflect the impact of domestic fuel burning for heating and cooking in the
Sebokeng township, especially in winter months.
Three Rivers, situated approximately 17 km south-southwest of the project site. The Three Rivers monitoring
station is not expected to reflect the impact of household fuel burning (compared to the other three monitoring
stations), but will reflect the industrial impacts from Meyerton. This site is considered to be most representative of
ambient air quality in the project area with respect to background air pollution sources and ambient air quality.
Atmospheric Impact Report: AIR Products Acetylene Plant, Gauteng
Report No.: 13ERM12 Rev 1.0 25
Figure 5-6: DEA operated ambient air quality monitoring stations close to the project site
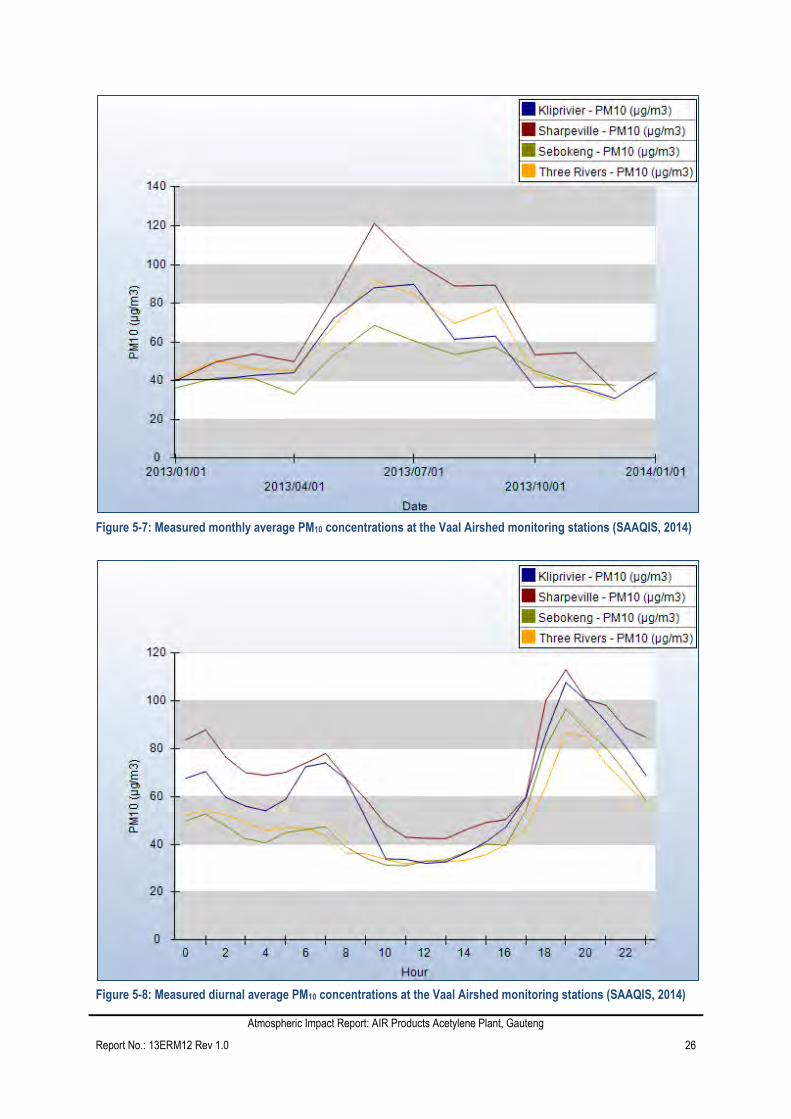
5.2.1 PM10
Measured annual average PM10 concentrations range from 50 µg/m³ at Three Rivers to 73 µg/m³ at Sharpeville. PM10
concentrations measured at all stations are in exceedance of both the current and future (applicable from 1 January 2015)
SA annual NAAQS.
Monthly PM10 concentrations show a peak in winter months, due to increased domestic fuel burning as well as reduced
natural mitigation and washout due to rainfall. Diurnal PM10 concentrations show two peaks at all stations, one at 7AM and
a larger one at 7PM. This is indicative that domestic fuel burning and to a lesser extent vehicle emissions are the main
contributing sources to PM10 emissions. The two stations closer to major thoroughfares (Kliprivier and Sharpeville) show
higher PM10 concentrations during the AM peak hours than the other two stations. All four stations show high average PM10
concentrations during the PM peak hours, due to a combination of fuel burning and traffic emissions.
Atmospheric Impact Report: AIR Products Acetylene Plant, Gauteng
Report No.: 13ERM12 Rev 1.0 26
Figure 5-7: Measured monthly average PM10 concentrations at the Vaal Airshed monitoring stations (SAAQIS, 2014)
Figure 5-8: Measured diurnal average PM10 concentrations at the Vaal Airshed monitoring stations (SAAQIS, 2014)
Atmospheric Impact Report: AIR Products Acetylene Plant, Gauteng
Report No.: 13ERM12 Rev 1.0 27
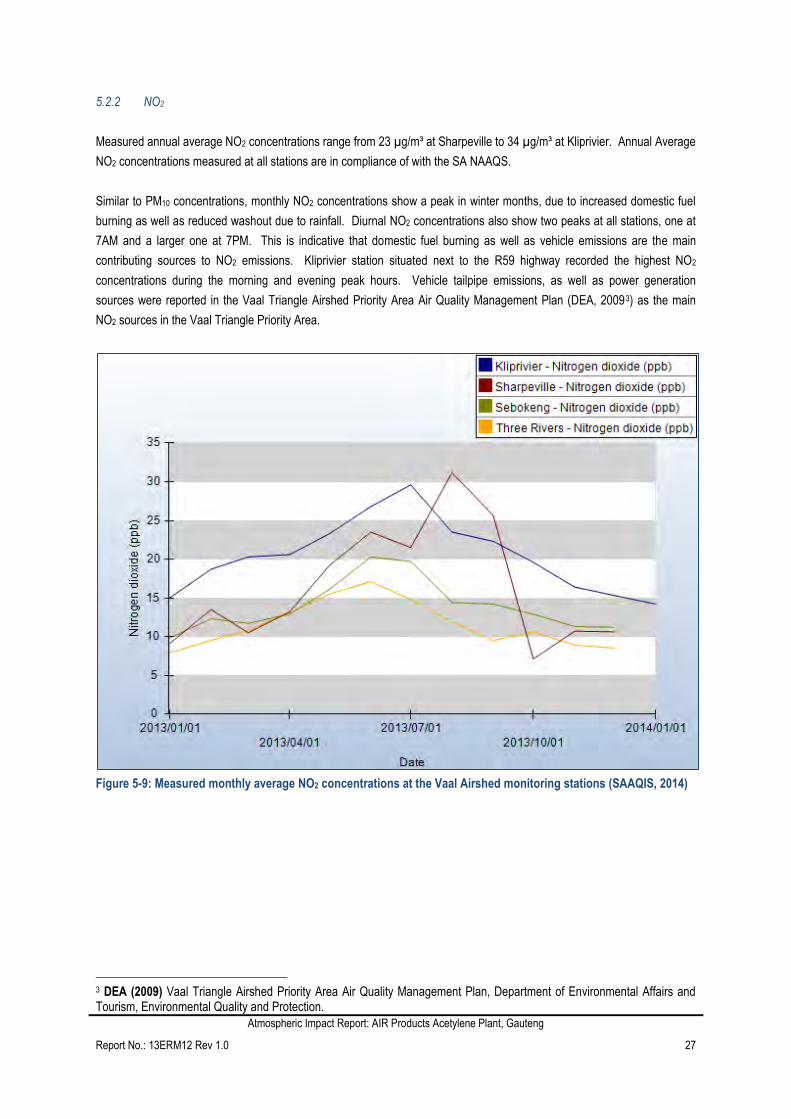
5.2.2 NO2
Measured annual average NO2 concentrations range from 23 µg/m³ at Sharpeville to 34 µg/m³ at Kliprivier. Annual Average
NO2 concentrations measured at all stations are in compliance of with the SA NAAQS.
Similar to PM10 concentrations, monthly NO2 concentrations show a peak in winter months, due to increased domestic fuel
burning as well as reduced washout due to rainfall. Diurnal NO2 concentrations also show two peaks at all stations, one at
7AM and a larger one at 7PM. This is indicative that domestic fuel burning as well as vehicle emissions are the main
contributing sources to NO2 emissions. Kliprivier station situated next to the R59 highway recorded the highest NO2
concentrations during the morning and evening peak hours. Vehicle tailpipe emissions, as well as power generation
sources were reported in the Vaal Triangle Airshed Priority Area Air Quality Management Plan (DEA, 20093) as the main
NO2 sources in the Vaal Triangle Priority Area.
Figure 5-9: Measured monthly average NO2 concentrations at the Vaal Airshed monitoring stations (SAAQIS, 2014)
3 DEA (2009) Vaal Triangle Airshed Priority Area Air Quality Management Plan, Department of Environmental Affairs and Tourism, Environmental Quality and Protection.
Atmospheric Impact Report: AIR Products Acetylene Plant, Gauteng
Report No.: 13ERM12 Rev 1.0 28
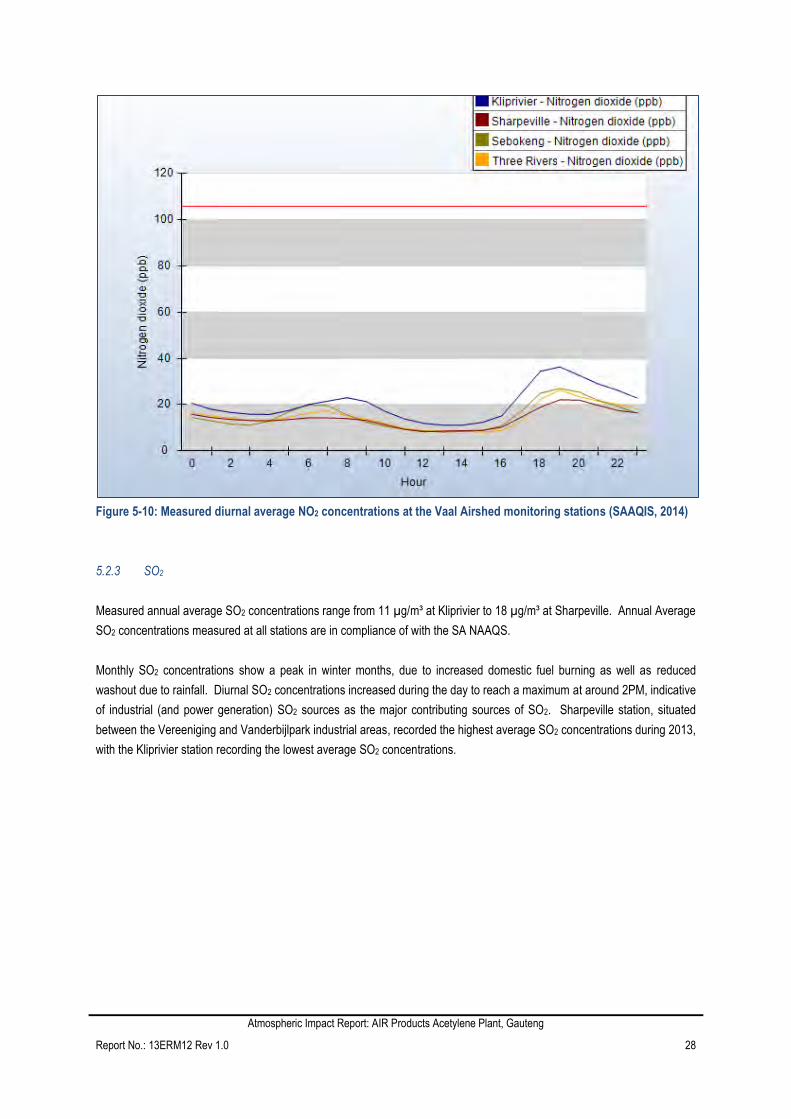
Figure 5-10: Measured diurnal average NO2 concentrations at the Vaal Airshed monitoring stations (SAAQIS, 2014)
5.2.3 SO2
Measured annual average SO2 concentrations range from 11 µg/m³ at Kliprivier to 18 µg/m³ at Sharpeville. Annual Average
SO2 concentrations measured at all stations are in compliance of with the SA NAAQS.
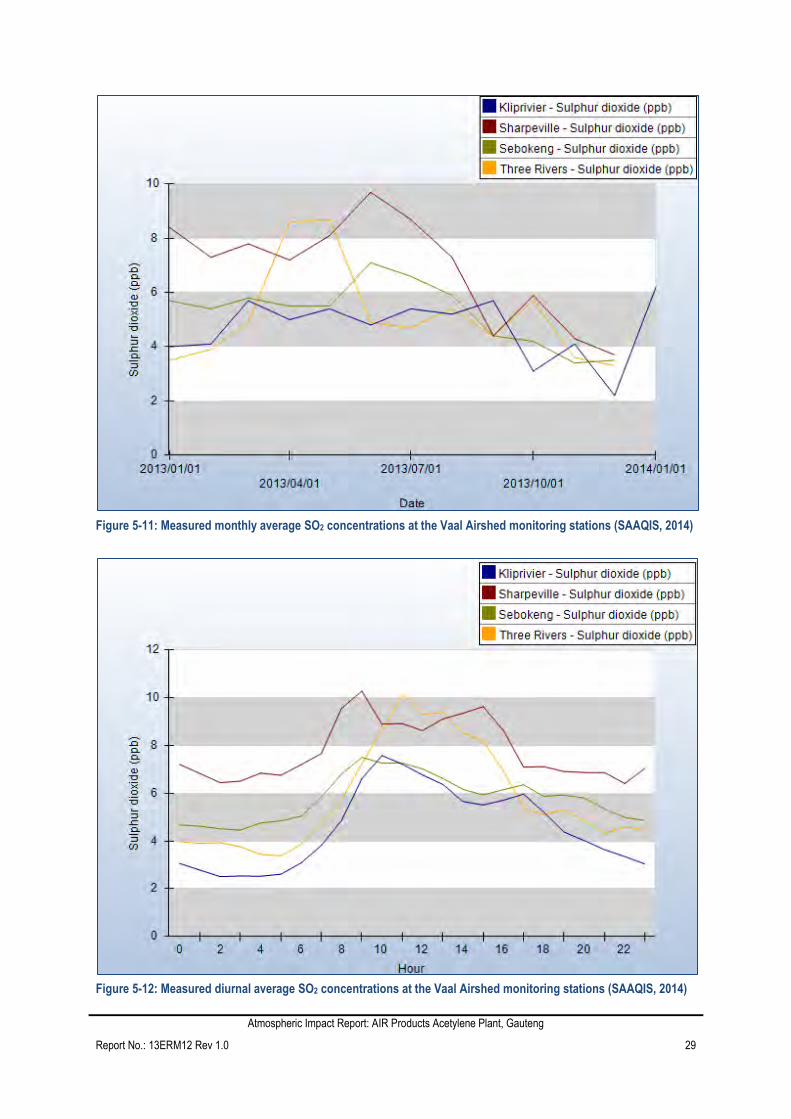
Monthly SO2 concentrations show a peak in winter months, due to increased domestic fuel burning as well as reduced
washout due to rainfall. Diurnal SO2 concentrations increased during the day to reach a maximum at around 2PM, indicative
of industrial (and power generation) SO2 sources as the major contributing sources of SO2. Sharpeville station, situated
between the Vereeniging and Vanderbijlpark industrial areas, recorded the highest average SO2 concentrations during 2013,
with the Kliprivier station recording the lowest average SO2 concentrations.
Atmospheric Impact Report: AIR Products Acetylene Plant, Gauteng
Report No.: 13ERM12 Rev 1.0 29
Figure 5-11: Measured monthly average SO2 concentrations at the Vaal Airshed monitoring stations (SAAQIS, 2014)
Figure 5-12: Measured diurnal average SO2 concentrations at the Vaal Airshed monitoring stations (SAAQIS, 2014)
Atmospheric Impact Report: AIR Products Acetylene Plant, Gauteng
Report No.: 13ERM12 Rev 1.0 30
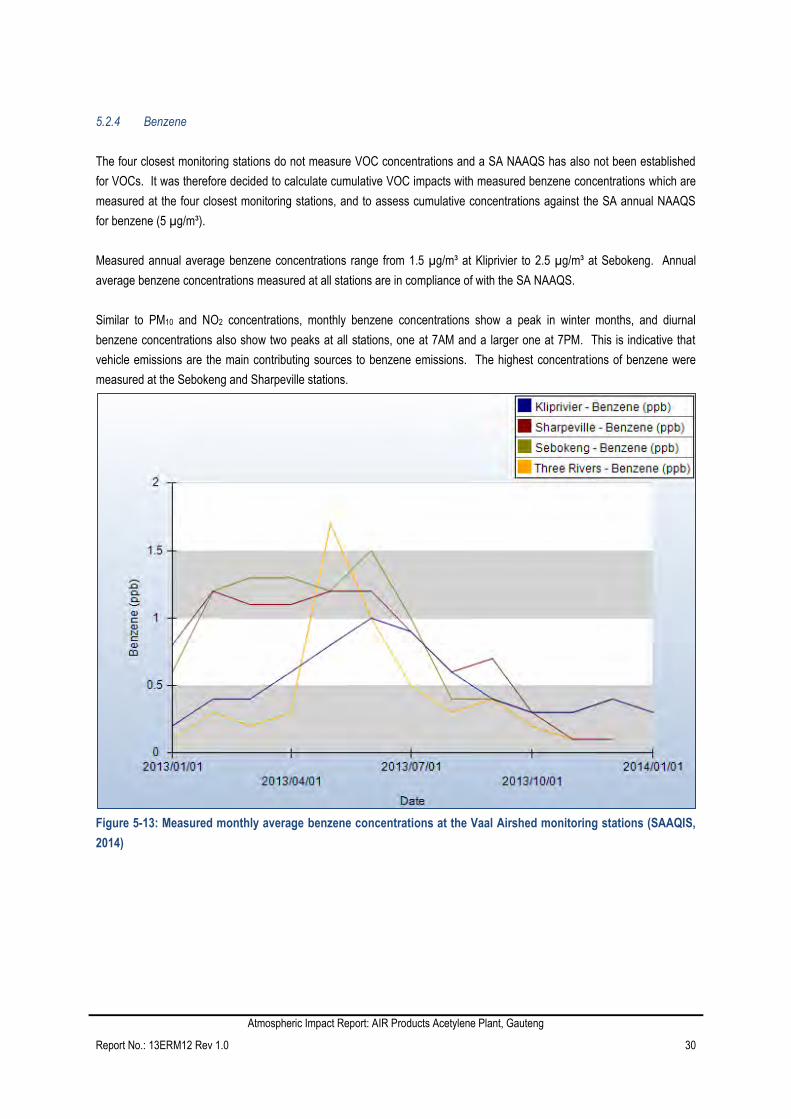
5.2.4 Benzene
The four closest monitoring stations do not measure VOC concentrations and a SA NAAQS has also not been established
for VOCs. It was therefore decided to calculate cumulative VOC impacts with measured benzene concentrations which are
measured at the four closest monitoring stations, and to assess cumulative concentrations against the SA annual NAAQS
for benzene (5 µg/m³).
Measured annual average benzene concentrations range from 1.5 µg/m³ at Kliprivier to 2.5 µg/m³ at Sebokeng. Annual
average benzene concentrations measured at all stations are in compliance of with the SA NAAQS.
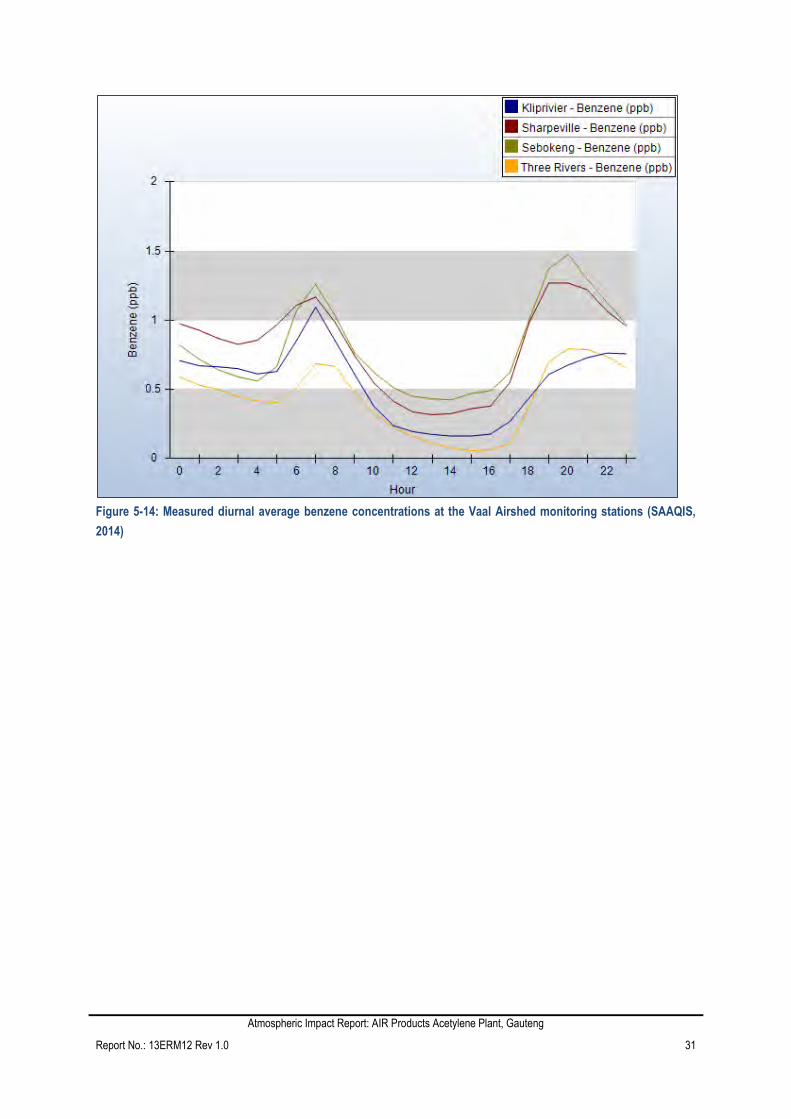
Similar to PM10 and NO2 concentrations, monthly benzene concentrations show a peak in winter months, and diurnal
benzene concentrations also show two peaks at all stations, one at 7AM and a larger one at 7PM. This is indicative that
vehicle emissions are the main contributing sources to benzene emissions. The highest concentrations of benzene were
measured at the Sebokeng and Sharpeville stations.
Figure 5-13: Measured monthly average benzene concentrations at the Vaal Airshed monitoring stations (SAAQIS,
2014)
Atmospheric Impact Report: AIR Products Acetylene Plant, Gauteng
Report No.: 13ERM12 Rev 1.0 31
Figure 5-14: Measured diurnal average benzene concentrations at the Vaal Airshed monitoring stations (SAAQIS,
2014)

Atmospheric Impact Report: AIR Products Acetylene Plant, Gauteng
Report No.: 13ERM12 Rev 1.0 32
Dispersion Modelling Results 5.3
5.3.1 Particulate (PM10) emissions
The identified emission sources of PM10 at the AIR Products Acetylene Plant include:
Construction activities during the construction phase
Vehicle entrainment from product and raw material trucks on the paved on-site ring road.
Vehicle tailpipe exhaust from forklifts as well as product and raw material trucks.
Backup generator exhaust
5.3.1.1 Predicted PM10 and PM2.5 ambient concentrations
Reported baseline ambient PM10 concentrations exceed the SA NAAQS at the four closest monitoring stations, and is
assumed to also exceed the SA NAAQS at the project site. Predicted PM10 concentrations are therefore presented as
incremental impacts (Figure 5-17 and Figure 5-19) as well as the percentage increase from baseline conditions. Measured
annual average PM10 concentrations at the four monitoring stations range between 50 µg/m³ and 73 µg/m³, therefore no
cumulative impacts are presented as baseline concentrations are assumed to exceed the SA NAAQS for all areas.
Construction Phase Impacts
Annual Average PM10 concentrations during the construction phase (Figure 5-15) are predicted to increase (Figure 5-16)
with up to 40 µg/m³ on the AIR Products Acetylene Plant property and immediately to the south and south-east. Due to the
nature of construction activities during the construction phase; impacts are expected to be intermittent and of limited
duration.
Figure 5-15: Predicted annual average PM10 concentrations during the construction phase.

Atmospheric Impact Report: AIR Products Acetylene Plant, Gauteng
Report No.: 13ERM12 Rev 1.0 33
Figure 5-16: Predicted increase in annual average PM10 concentrations from baseline conditions during the
construction phase.
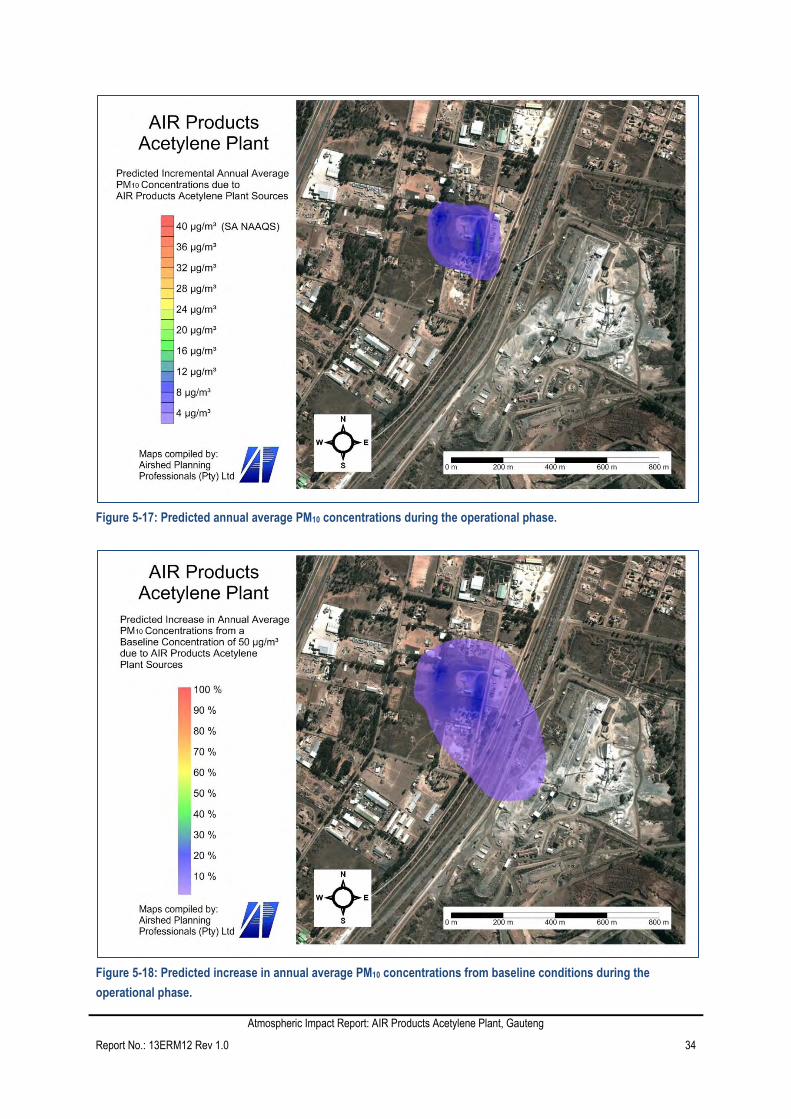
Operational Phase Impacts
Incremental annual average PM10 concentrations during the operational phase are predicted to be very low, less than 4
µg/m³ just outside the property boundary.
An increase from baseline PM10 concentrations (Figure 5-18) of approximately 15% due to the AIR Product Acetylene Plant
operations were predicted to be limited to the Plant property, with PM10 concentrations predicted to increase less than 10%
from baseline concentrations directly to the south-east of the plant site.
The possibility exists for the SA daily PM10 NAAQS to be exceeded directly outside the property boundary should the
backup generators be used continuously (more than 24 hours) for more than four days per year.
Atmospheric Impact Report: AIR Products Acetylene Plant, Gauteng
Report No.: 13ERM12 Rev 1.0 34
Figure 5-17: Predicted annual average PM10 concentrations during the operational phase.
Figure 5-18: Predicted increase in annual average PM10 concentrations from baseline conditions during the
operational phase.
Atmospheric Impact Report: AIR Products Acetylene Plant, Gauteng
Report No.: 13ERM12 Rev 1.0 35
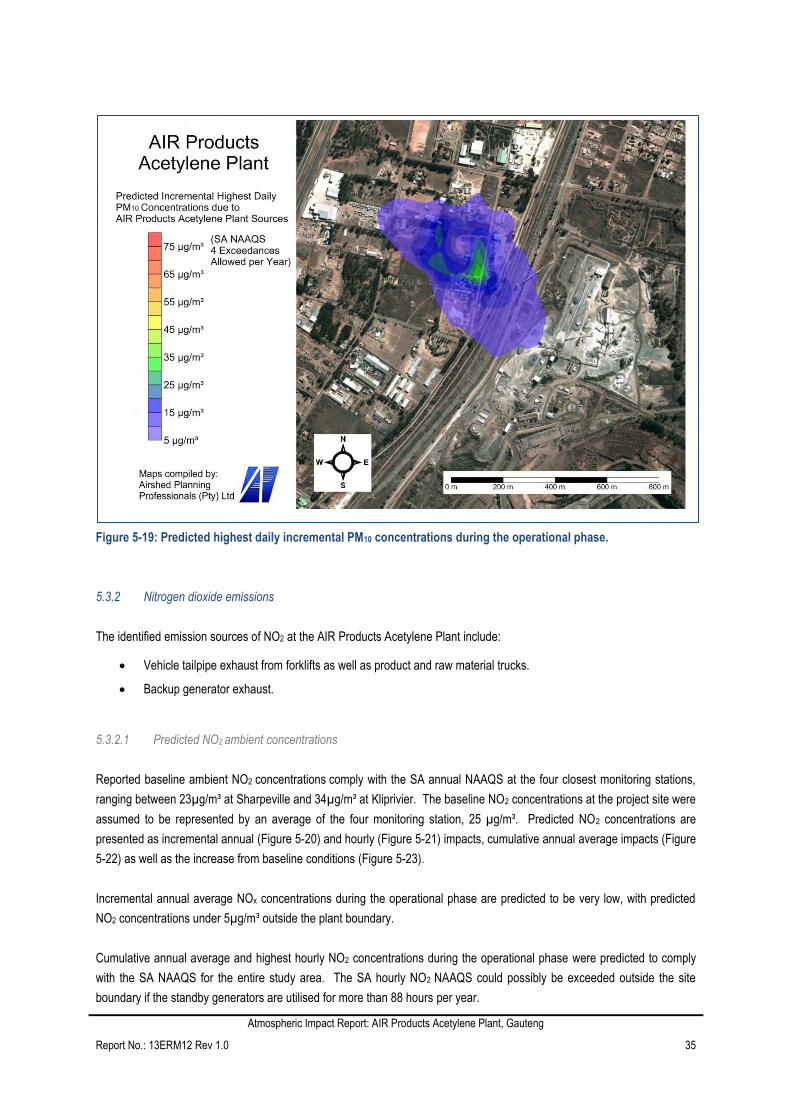
Figure 5-19: Predicted highest daily incremental PM10 concentrations during the operational phase.
5.3.2 Nitrogen dioxide emissions
The identified emission sources of NO2 at the AIR Products Acetylene Plant include:
Vehicle tailpipe exhaust from forklifts as well as product and raw material trucks.
Backup generator exhaust.
5.3.2.1 Predicted NO2 ambient concentrations
Reported baseline ambient NO2 concentrations comply with the SA annual NAAQS at the four closest monitoring stations,
ranging between 23µg/m³ at Sharpeville and 34µg/m³ at Kliprivier. The baseline NO2 concentrations at the project site were
assumed to be represented by an average of the four monitoring station, 25 µg/m³. Predicted NO2 concentrations are
presented as incremental annual (Figure 5-20) and hourly (Figure 5-21) impacts, cumulative annual average impacts (Figure
5-22) as well as the increase from baseline conditions (Figure 5-23).
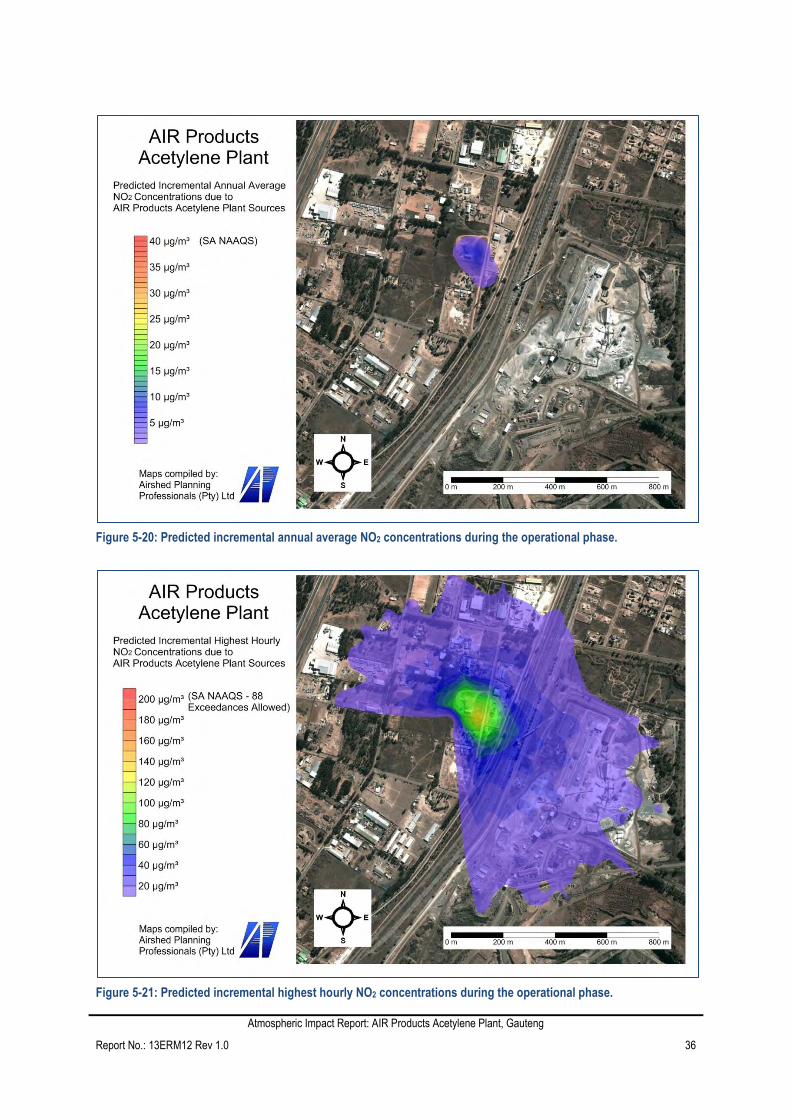
Incremental annual average NOx concentrations during the operational phase are predicted to be very low, with predicted
NO2 concentrations under 5µg/m³ outside the plant boundary.
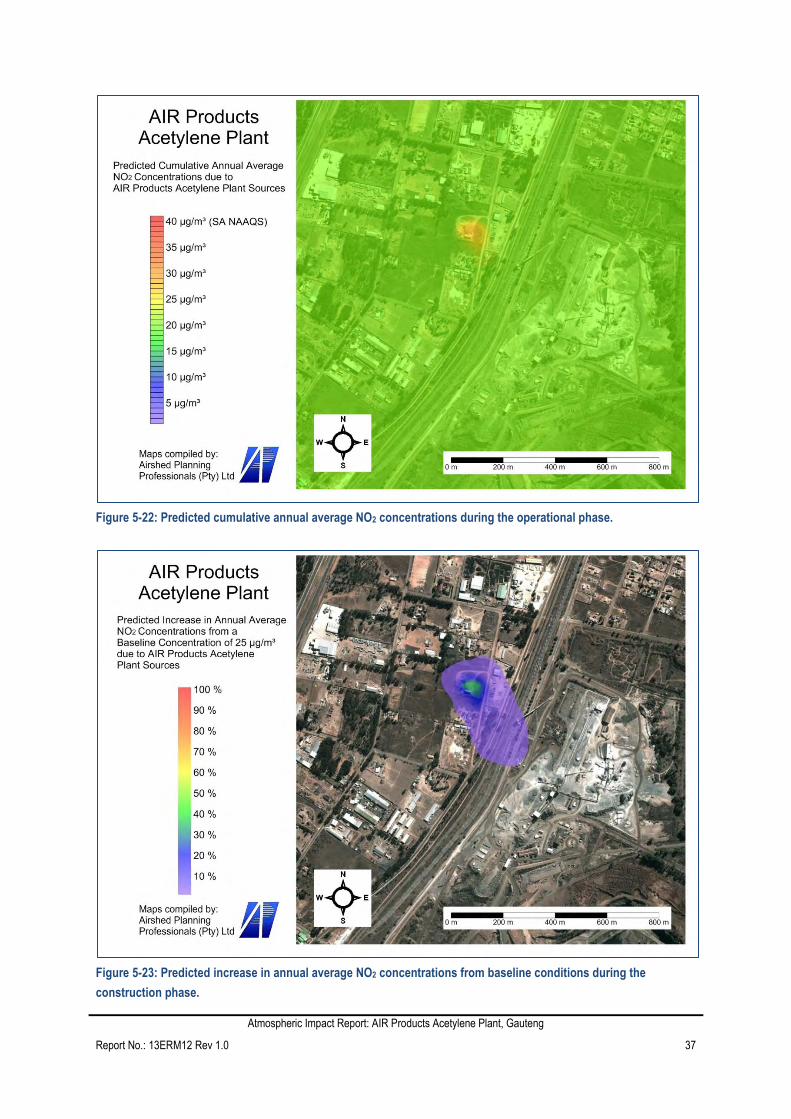
Cumulative annual average and highest hourly NO2 concentrations during the operational phase were predicted to comply
with the SA NAAQS for the entire study area. The SA hourly NO2 NAAQS could possibly be exceeded outside the site
boundary if the standby generators are utilised for more than 88 hours per year.
Atmospheric Impact Report: AIR Products Acetylene Plant, Gauteng
Report No.: 13ERM12 Rev 1.0 36
Figure 5-20: Predicted incremental annual average NO2 concentrations during the operational phase.
Figure 5-21: Predicted incremental highest hourly NO2 concentrations during the operational phase.
Atmospheric Impact Report: AIR Products Acetylene Plant, Gauteng
Report No.: 13ERM12 Rev 1.0 37
Figure 5-22: Predicted cumulative annual average NO2 concentrations during the operational phase.
Figure 5-23: Predicted increase in annual average NO2 concentrations from baseline conditions during the
construction phase.

Atmospheric Impact Report: AIR Products Acetylene Plant, Gauteng
Report No.: 13ERM12 Rev 1.0 38
5.3.3 Sulphur dioxide emissions
The identified emission sources of SO2 at the AIR Products Acetylene Plant include:
Vehicle tailpipe exhaust from forklifts as well as product and raw material trucks.
Backup generator exhaust.
5.3.3.1 Predicted SO2 ambient concentrations
SO2 sources at the AIR Products Acetylene plant were expected to result in insignificant increases in ambient SO2
concentrations (0.1% increase in annual average SO2 concentrations). Predicted cumulative ambient SO2 comply with the
SA NAAQS for all three averaging periods.
5.3.4 Acetone emissions
The identified emission sources of acetone at the AIR Products Acetylene Plant include:
Working and standing losses from the acetone storage tank.
Fugitive acetone emissions from cylinder cleaning and filling operations.
5.3.4.1 Predicted ambient acetone concentrations
Impacts on ambient acetone concentrations were predicted to be negligible, with annual average concentrations predicted to
be 12 µg/m³ at most, less than 0.1% of the lowest health guideline (the US ATSDR RfC of 30 900 µg/m³).
5.3.5 Phosphine emissions
The identified emission sources of acetylene (and phosphine impurities) at the AIR Products Acetylene Plant include:
Fugitive emissions from the charging of the generator.
Fugitive emissions from the lime sludge tanks.
Fugitive emissions from tank filling operations.
5.3.5.1 Predicted ambient phosphine (PH3) concentrations
Acetylene is considered non-toxic at normal ambient concentrations, but some acetylene impurities (especially phosphine)
could be detrimental to human health if sufficient quantities of acetylene are emitted.
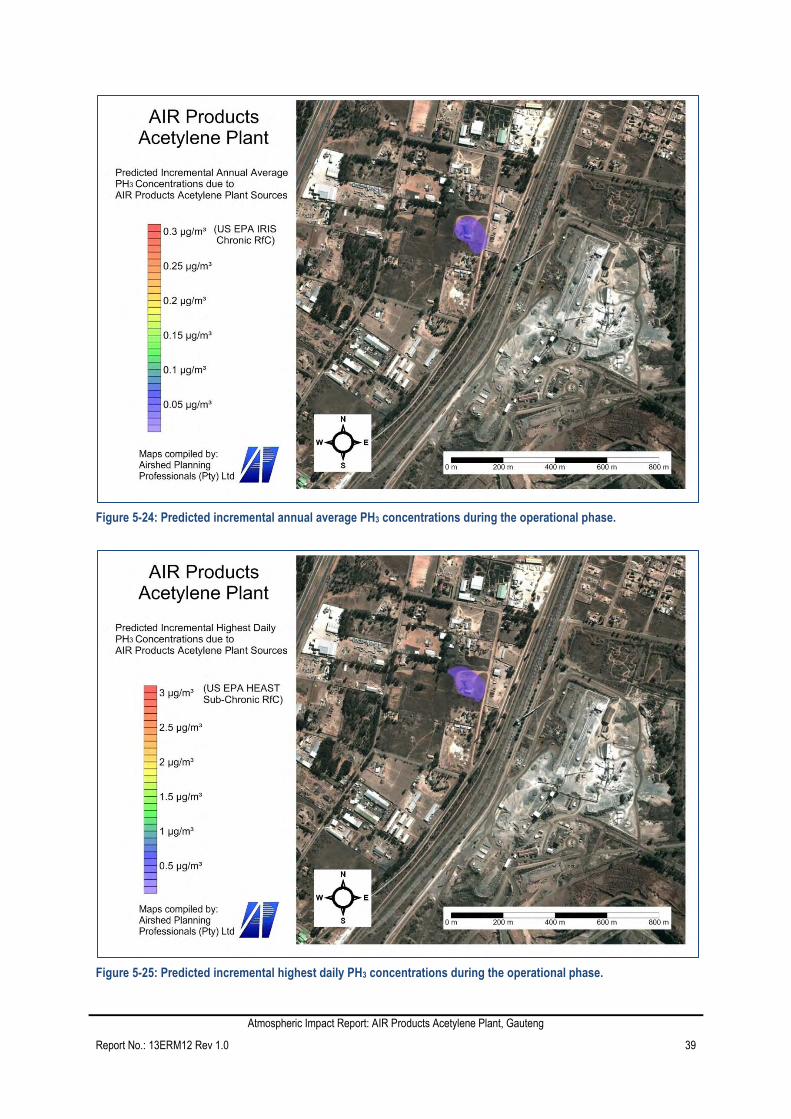
Predicted annual average (Figure 5-24) and highest daily (Figure 5-25) PH3 concentrations were well below the strictest
international health guidelines (the US EPA IRIS Chronic RfC and US EPA HEAST Sub-chronic RfC respectively).
Atmospheric Impact Report: AIR Products Acetylene Plant, Gauteng
Report No.: 13ERM12 Rev 1.0 39
Figure 5-24: Predicted incremental annual average PH3 concentrations during the operational phase.
Figure 5-25: Predicted incremental highest daily PH3 concentrations during the operational phase.

Atmospheric Impact Report: AIR Products Acetylene Plant, Gauteng
Report No.: 13ERM12 Rev 1.0 40
5.3.6 VOC emissions
The identified emission sources of volatile organic compounds at the AIR Products Acetylene Plant include:
Fugitive emissions from plant operations.
Vehicle tailpipe emissions from forklifts and product and raw material trucks.
Backup-generator exhaust emissions.
5.3.6.1 Predicted ambient VOC concentrations
As discussed in Sections 5.1.2.3 and 5.2.4, it was decided to calculate cumulative impacts with measured benzene
concentrations at the four closest monitoring stations, and to assess cumulative concentrations against the SA annual
NAAQS for benzene (5 µg/m³).
An annual average benzene concentration of approximately 1 ppb (2.8 µg/m³) benzene is reported at the four closest
monitoring stations.
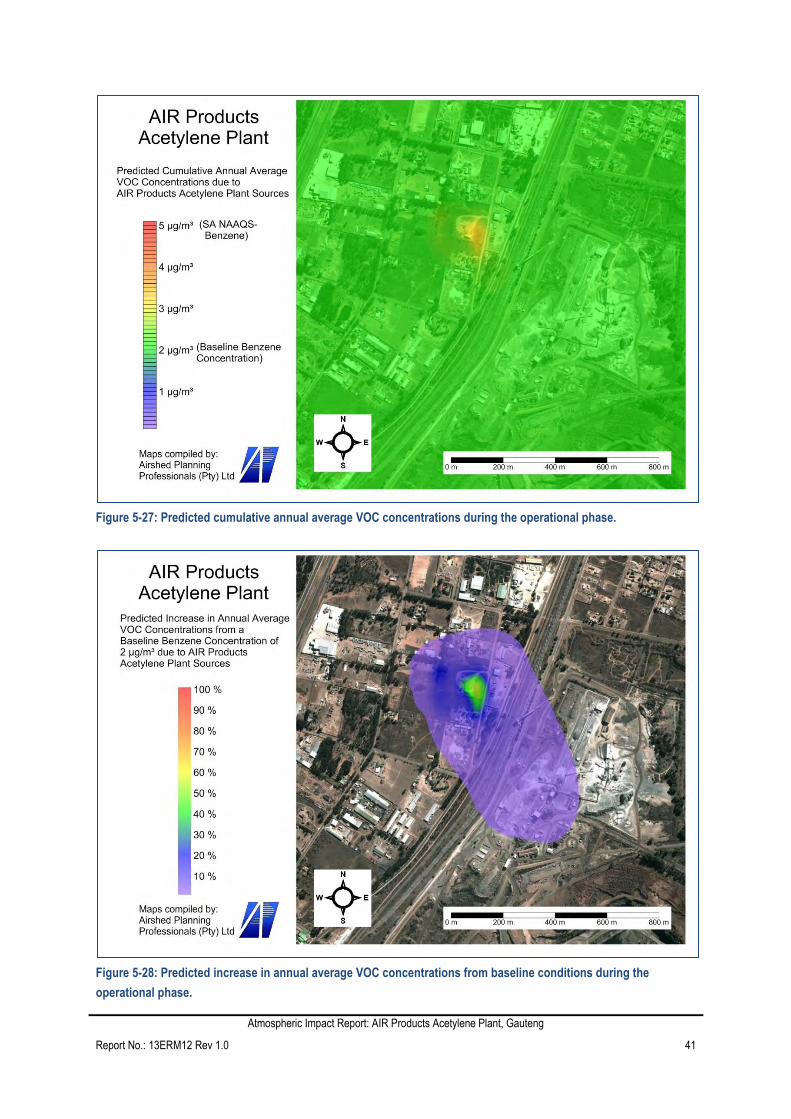
Incremental (Figure 5-26) and cumulative VOC concentrations (Figure 5-27) were predicted to comply with the SA annual
NAAQS for benzene for the entire study area. VOC concentrations were predicted to increase (Figure 5-28) by
approximately 40% from baseline conditions within the site boundary, and up to 10% south-east of the plant site.
Figure 5-26: Predicted annual average VOC concentrations during the operational phase.
Atmospheric Impact Report: AIR Products Acetylene Plant, Gauteng
Report No.: 13ERM12 Rev 1.0 41
Figure 5-27: Predicted cumulative annual average VOC concentrations during the operational phase.
Figure 5-28: Predicted increase in annual average VOC concentrations from baseline conditions during the
operational phase.

Atmospheric Impact Report: AIR Products Acetylene Plant, Gauteng
Report No.: 13ERM12 Rev 1.0 42
Impact Significance Ratings 5.4
The characteristics of the impact of each pollutant on the receiving environment are described in Table 5-6.
Table 5-6: Impact Significance Ratings
Aspect Type Duration Extent Scale Frequency Likelihood Magnitude
PM10 Concentrations Cumulative
Construction phase: Short Term
Duration of operations, medium-term, mainly during
movement of vehicles on site.
Local
Exceedance of
SA NAAQS on-
site (Baseline
PM10
concentrations
in exceedance
of SA NAAQS)
During on-site vehicle
movement. During use of
backup generators
Likely Small
NO2 Concentration Cumulative Short term - only during use of backup generators Local Comply with SA
NAAQS
During use of backup
generators Possible Negligible
SO2 Concentrations Cumulative Short term - only during use of backup generators On-site Insignificant During use of backup
generators Possible Negligible
Acetone
Concentrations Cumulative
Medium-term, standing and working losses from acetone
tanks and fugitive emissions from cylinder cleaning and filling
operations
On-site Insignificant Constant Likely Negligible
Acetylene and
Phosphine
Concentrations
Incremental, (no
baseline data
available)
Medium-term, Fugitive emissions from plant operations On-site
Below health
screening
criteria
During filling operations
and emergency releases Possible Negligible
VOC Concentrations Cumulative Medium-term. Fugitive emissions from plant operations On-site Comply with SA
NAAQS
Intermittent depending on
plant activities Likely Negligible
Atmospheric Impact Report: AIR Products Acetylene Plant, Gauteng
Report No.: 13ERM12 Rev 1.0 43
Main Findings and Conclusions 5.5
The main findings from the air quality impact assessment are:
Measured PM10 baseline concentrations are in non-compliance with the NAAQS. Simulated PM10 concentrations
from the proposed AIR Products plant indicate a 10% increase to the off-site PM10 concentrations. Operation of
the stand-by generators could result in non-compliance for more than 4-days per year.
Simulated NO2 concentrations are low resulting in cumulative increases of less than 10% and likely to remain
within compliance with the NAAQS. Operation of the stand-by generators could result in non-compliance of more
than 88-hours per year.
SO2 concentrations were predicted to be low with insignificant contribution to cumulative concentrations, remaining
well below the NAAQSs.
Acetone and phosphine concentrations were predicted to be well below the international guidelines and reference
concentrations (no NAAQS exist). No baseline concentrations are measured and no cumulative impacts were
assessed.
VOC concentrations in the form of benzene, were predicted to be well within compliance with the NAAQS, both
incrementally and cumulatively.
In conclusion, the proposed AIR Product plant should not result in more than 10% contribution to baseline ambient air
concentrations and this would not cause non-compliance except for PM10, of which the baseline concentrations are already
in non-compliance with the NAAQS.
Analysis of Emissions’ Impact on the Environment 5.6
An assessment of air pollution impacts on soil, water and receptors other than human were not included in the investigation
since it was not specifically requested by the Air Quality Officer.
6 COMPLAINTS
As it is a new plant that is not yet operating, no complaints have been reported. A complaints register will be in place when
operations commence. The comments and questions received during the public participation process, specifically those
regarding the air quality impacts from the AIR Products acetylene plant, are addressed in Table 6-1.
Table 6-1: Questions and Comments
Name and Organization of Commenter Comment Response
Lesley Scholtz – Midvaal Municipality
Enviro Health
The following legislation must be adhered
to:
National Health Act 61 of 2003,and
National Environmental Management Act
107 of 1998.
Impacts of air pollutants were assessed
against the SA NAAQS (Table 5-1), as
published under NEMAQA (Act 39 of 2004)
The Proponent needs to obtain an Air
Emissions Licence in terms of the NEM:Air
Quality Act 39 of 2004.
Air Products is in the process of applying
for an AEL to the Sedibeng District
Municipality. This Atmospheric Impact
Report will be submitted with the AEL
application.
JP van der Merwe - Resident This area of Daleside is part of the PWV Impacts were assessed in accordance with
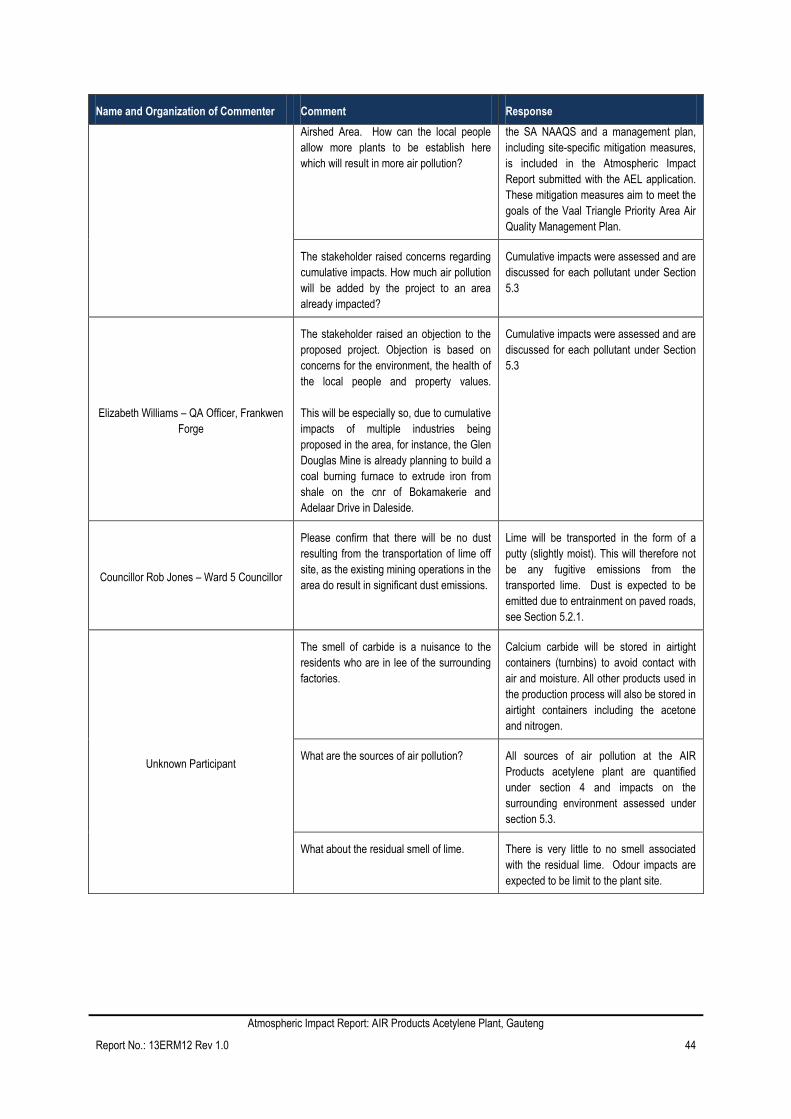
Atmospheric Impact Report: AIR Products Acetylene Plant, Gauteng
Report No.: 13ERM12 Rev 1.0 44
Name and Organization of Commenter Comment Response
Airshed Area. How can the local people
allow more plants to be establish here
which will result in more air pollution?
the SA NAAQS and a management plan,
including site-specific mitigation measures,
is included in the Atmospheric Impact
Report submitted with the AEL application.
These mitigation measures aim to meet the
goals of the Vaal Triangle Priority Area Air
Quality Management Plan.
The stakeholder raised concerns regarding
cumulative impacts. How much air pollution
will be added by the project to an area
already impacted?
Cumulative impacts were assessed and are
discussed for each pollutant under Section
5.3
Elizabeth Williams – QA Officer, Frankwen
Forge
The stakeholder raised an objection to the
proposed project. Objection is based on
concerns for the environment, the health of
the local people and property values.
This will be especially so, due to cumulative
impacts of multiple industries being
proposed in the area, for instance, the Glen
Douglas Mine is already planning to build a
coal burning furnace to extrude iron from
shale on the cnr of Bokamakerie and
Adelaar Drive in Daleside.
Cumulative impacts were assessed and are
discussed for each pollutant under Section
5.3
Councillor Rob Jones – Ward 5 Councillor
Please confirm that there will be no dust
resulting from the transportation of lime off
site, as the existing mining operations in the
area do result in significant dust emissions.
Lime will be transported in the form of a
putty (slightly moist). This will therefore not
be any fugitive emissions from the
transported lime. Dust is expected to be
emitted due to entrainment on paved roads,
see Section 5.2.1.
Unknown Participant
The smell of carbide is a nuisance to the
residents who are in lee of the surrounding
factories.
Calcium carbide will be stored in airtight
containers (turnbins) to avoid contact with
air and moisture. All other products used in
the production process will also be stored in
airtight containers including the acetone
and nitrogen.
What are the sources of air pollution? All sources of air pollution at the AIR
Products acetylene plant are quantified
under section 4 and impacts on the
surrounding environment assessed under
section 5.3.
What about the residual smell of lime. There is very little to no smell associated
with the residual lime. Odour impacts are
expected to be limit to the plant site.
Atmospheric Impact Report: AIR Products Acetylene Plant, Gauteng
Report No.: 13ERM12 Rev 1.0 45
7 CURRENT OR PLANNED AIR QUALITY MANAGEMENT INTERVENTIONS
Various goals have been set for industrial emissions as part of the Vaal Triangle Airshed Priority Area Air Quality
Management Plan (VTAPA AQMP). The goals that are applicable to the AIR Products Acetylene Plant, along with
recommended measures to achieve these goals are outlined below:
Establish and maintain a site emissions inventory that includes all point and diffuse sources for all significant
pollutants.
o It is recommended that emissions inventory compiled as part of this study be updated to include any
changes in the process or emissions from the acetylene plant once the plant is operational.
Develop and implement a maintenance plan for the acetylene plant. Schedule and conduct repairs to coincide
with plant offline times. Incorporate equipment changes into maintenance schedule. Operate the plant with
minimum disruptions.
Develop fugitive dust emissions management plan.
o Paving of all on-site roads to minimize entrained dust emissions.
o Regular sweeping of on-site roads to minimize silt loading, thereby minimizing entrained dust emissions.
o Total enclosure of all raw product stockpiles (this is also required due to the nature of the calcium
carbide raw material).
Develop gaseous emissions management plan.
o Regular maintenance and repair of vehicle fleet
o Minimize vehicle idling times.
o Minimize backup generator usage (it is recommended that generator usage be restricted to less than 88
hours per year, to ensure off-site compliance with the SA NAAQS).
Conduct ambient air quality monitoring in accordance with AEL requirements
o It is recommended that passive sampling of VOCs be conducted at the south-eastern boundary, as well
as at the closest sensitive receptors.
Conduct quarterly consultative community meetings.
o It is recommended that a complaints register be established.
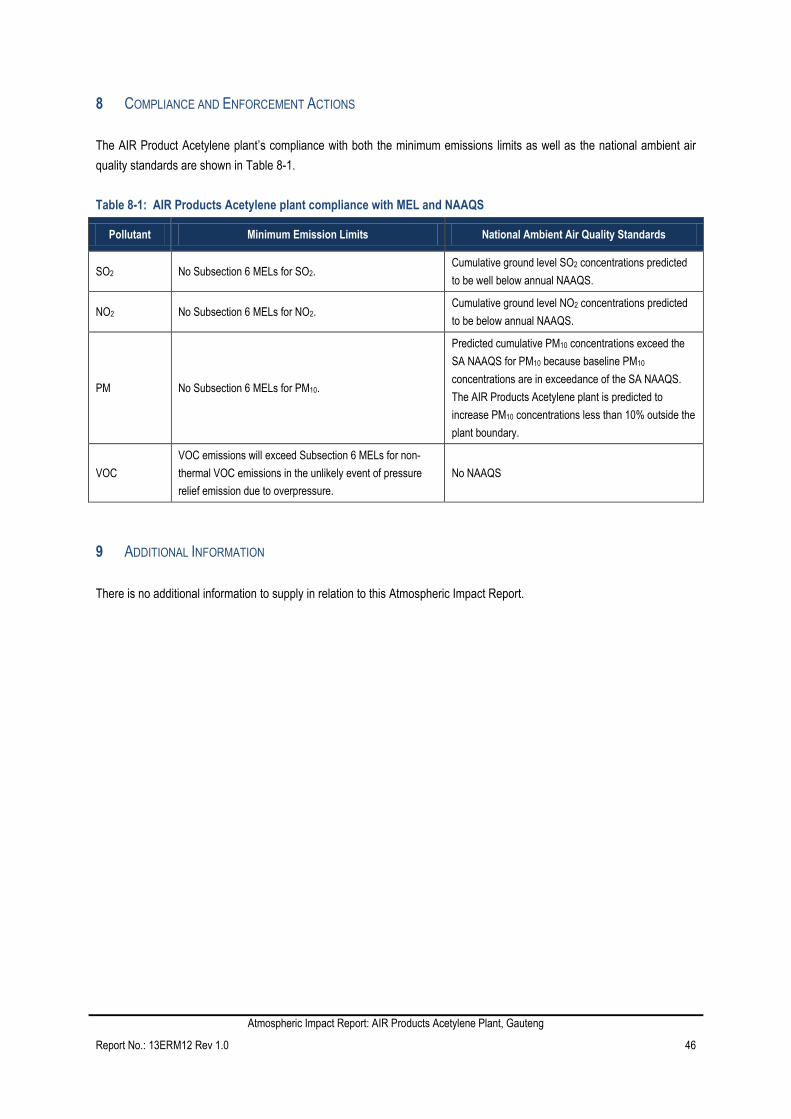
Atmospheric Impact Report: AIR Products Acetylene Plant, Gauteng
Report No.: 13ERM12 Rev 1.0 46
8 COMPLIANCE AND ENFORCEMENT ACTIONS
The AIR Product Acetylene plant’s compliance with both the minimum emissions limits as well as the national ambient air
quality standards are shown in Table 8-1.
Table 8-1: AIR Products Acetylene plant compliance with MEL and NAAQS
Pollutant Minimum Emission Limits National Ambient Air Quality Standards
SO2 No Subsection 6 MELs for SO2. Cumulative ground level SO2 concentrations predicted
to be well below annual NAAQS.
NO2 No Subsection 6 MELs for NO2. Cumulative ground level NO2 concentrations predicted
to be below annual NAAQS.
PM No Subsection 6 MELs for PM10.
Predicted cumulative PM10 concentrations exceed the
SA NAAQS for PM10 because baseline PM10
concentrations are in exceedance of the SA NAAQS.
The AIR Products Acetylene plant is predicted to
increase PM10 concentrations less than 10% outside the
plant boundary.
VOC
VOC emissions will exceed Subsection 6 MELs for non-
thermal VOC emissions in the unlikely event of pressure
relief emission due to overpressure.
No NAAQS
9 ADDITIONAL INFORMATION
There is no additional information to supply in relation to this Atmospheric Impact Report.


Atmospheric Impact Report: AIR Products Acetylene Plant, Gauteng
Report No.: 13ERM12 Rev 1.0 49