atmospheric moisture recycling: role of advection and … · 2008-12-16 · 1368 journal of climate...
TRANSCRIPT

1368 VOLUME 12J O U R N A L O F C L I M A T E
q 1999 American Meteorological Society
Atmospheric Moisture Recycling: Role of Advection and Local Evaporation
KEVIN E. TRENBERTH
National Center for Atmospheric Research,* Boulder, Colorado
(Manuscript received 24 November 1997, in final form 16 April 1998)
ABSTRACT
An approximate formulation of how much moisture that precipitates out comes from local evaporation versushorizontal transport, referred to as ‘‘recycling,’’ has allowed new estimates of recycling to be mapped globallyas a function of length scale. The recycling is formulated in terms of the ‘‘intensity of the hydrological cycle’’I, which is alternatively referred to as a ‘‘precipitation efficiency’’ as it denotes the fraction of moisture flowingthrough a region that is precipitated out, and a ‘‘moistening efficiency,’’ M, which is defined as the fraction ofmoisture evaporated from a region to that flowing through. While datasets of the pertinent quantities haveimproved, they still contain uncertainties. Results show that often the intensity is not greatest at times of greatestprecipitation because moisture transport into the region is also a maximum, especially in the monsoonal regions.The annual cycle variations of I are fairly small over North America and Europe while large seasonal variationsin M occur in most places. Seasonal mean maps of precipitation, evaporation (E ), and atmospheric moisturetransport are presented and discussed along with the seasonal and annual means of derived precipitation andmoisture efficiencies and the recycling fraction. The recycling results depend greatly on the scale of the domainunder consideration and global maps of the recycling for seasonal and annual means are produced for 500- and1000-km scales that therefore allow the heterogeneity of the fields across river basins to be captured. Globalannual mean recycling for 500-km scales is 9.6%, consisting of 8.9% over land and 9.9% over the oceans. Evenfor 1000-km scales, less than 20% of the annual precipitation typically comes from evaporation within thatdomain. Over the Amazon, strong advection of moisture dominates the supply of atmospheric moisture overmuch of the river basin but local evaporation is much more prominent over the southern parts, and, for theannual cycle as a whole, about 34% of the moisture is recycled. Over the Mississippi Basin, the recycling isabout 21%. The smaller number mostly reflects the smaller domain size. Relatively high annual values of recycling(.20%) occur in the subtropical highs, where E is high and the advective moisture flux is small, and inconvergence zones where, again, the advective moisture flux is small. Low annual values occur over the southernoceans, the North Pacific, and the eastern equatorial Pacific, where the moisture flux is at a maximum.
1. Introduction
There is considerable interest in the hydrology com-munity over how changes in land use may affect theprecipitation and moisture availability. The contributionof local evaporation, which could be altered by changesin land surface characteristics, to local precipitation,called ‘‘recycling,’’ is therefore of considerable interest.More specifically, within a catchment basin, the precip-itation that falls out of the atmosphere comes from oneof three sources: the moisture already in the atmosphere,convergence of the moisture advected into the regionby the winds, or the evaporation of surface moistureinto the atmosphere within the basin. In a steady state
* The National Center for Atmospheric Research is sponsored bythe National Science Foundation.
Corresponding author address: Dr. Kevin E. Trenberth, NCAR,P.O. Box 3000, Boulder, CO 80307-3000.E-mail: [email protected]
or over a long period, the first is not viable and cancontribute little, and so the only alternatives are evap-oration and advection.
Trenberth (1998) examined the cycling times of mois-ture into and out of the atmosphere, referred to as‘‘moistening,’’ or ‘‘restoration,’’ and ‘‘drying,’’ or ‘‘de-pletion’’ rates. The latter depend on the atmosphericmoisture content and the rates by which moisture iseither restored by evaporation or depleted by precipi-tation. They are determined by comparing local valuesof precipitable water, w, with the sinks of precipitationP and sources of evapotranspiration, E, and, thus, theyneglect the role of advection of moisture. However, theyare of interest for giving some idea of atmospheric mois-ture lifetimes. Overall, the e-folding residence time foratmospheric global moisture is 8.1 days for precipitationdepletion and 8.5 days for evaporative restoration ofatmospheric moisture. These values are computed fromthe global means of the inverse time constants, and thediscrepancy may partly be spurious because the rateswere determined using different sources of P and E data,which do not quite balance globally, but they mostly
MAY 1999 1369T R E N B E R T H
reflect real differences owing to the heterogeneous Pdistribution and spatial correlation with w. Only if thetime constants are computed from the global means ofthe fields should there be a balance. In locations whereP or E is very small, the implied time constants are verylong. For precipitation, local values of the depletion rateare about 1 week in the tropical convergence zones, butthey exceed a month in the dry zones in the subtropicsand desert areas, and the pattern resembles that of theP field. The restoration rate is largest over northernAfrica and in a region extending across to Saudi Arabiaand Iran, and over Australia. Values average about 12days in the tropical convergence zones and are lowestin the subtropical highs where evaporation is a maxi-mum, but precipitable water is limited because moistureis trapped at low levels by subsidence. However, all ofthese values are of somewhat limited interest becausethey fail to take moisture transport into account.
Evaporation as a source for precipitation over landdepends on the availability of surface moisture, whichin turn depends upon the disposition of precipitationonce it hits the ground. In particular, the latter is de-termined by how much infiltrates to perhaps becomeground water, how much runs off into streams and riversand is therefore effectively lost to the region as a sourcefor further evaporation, and how much is retained nearthe surface in ponds, lakes, or soil moisture and is thusreadily available for evapotranspiration either directlyfrom the surface or via surface vegetation. This parti-tioning thus depends greatly on the surface character-istics and vegetation.
Transport of moisture into a region where it can be-come entrained into a precipitating weather system de-pends on the atmospheric dynamics as well as the sourc-es of moisture from other parts of the globe. Of course,in some regions the atmospheric moisture is not pre-cipitated and just flows across, while in other areas con-vergence of the moisture in weather systems ensuresthat precipitation occurs. The atmospheric branch of thehydrological cycle is therefore of considerable interest,although not as well known as is desired. Many of thesame processes that are of interest over river basins alsooperate over the oceans. A key difference over theoceans, however, is that evaporation does not depend atall on the surface moisture budget, as the surface isalways wet. Nevertheless, it is also possible to computerecycling over the oceans although, clearly, the moistureis not really being recycled.
Recycling, as defined, refers to how much evapora-tion in an area contributes to the precipitation in thesame area. As the area is reduced to a point, the evap-oration contribution tends to zero and all the moistureprecipitated is transported in. At the other extreme, asthe domain becomes global, the evaporation entirelyreplaces the precipitation. Thus, the recycling rangesfrom 0 to 1 depending on the size of the area. Eltahirand Bras (1996) review estimates of precipitation re-cycling, and Eltahir and Bras (1994) estimate that 25%–
35% of the rain that falls in the Amazon Basin is con-tributed by evaporation within the basin (over scales of2500 km). In the Mississippi Basin the recycling esti-mates range from 10% to 24% over about 1500-kmscales.
One substantial difficulty in determining recyclinghas been in defining the edges of a catchment basin orarea of interest and determining the fluxes of moistureinto and out of the region. Moreover, as each basin hasa different configuration, the interpretation of the com-parison of results has not been very clear. Because re-cycling generally increases as the size of the domainincreases it does not readily translate into informationon the underlying physical processes. In this paper, thedifficulty is addressed by making some approximations(section 4) that allow mapping of a recycling ratio andcomputation of values at every point as a function oflength scale. This has the distinct advantage of allowingdifferent areas to be directly compared for each lengthscale.
Computation of recycling empirically requires as-sumptions that suggest that the results should not betaken too literally. In particular, for a given domain overa period such as a month, it is assumed that the moistureadvected into the region is uniformly mixed with thatfrom local evaporation while ignoring changes in at-mospheric precipitable water so that this provides a ba-sis for partitioning the rainfall into the average advectiveversus evaporative contributions. Further, this approachassumes that the overall flux of moisture is representedby the monthly or longer-term mean. While the com-puted flux does include contributions from both tran-sients and the mean flow, the temporal variability of theflux within the month, such as in its direction, is notincluded and seems difficult to accommodate. A test ofnonlinearity has been made by comparing the resultsfor a season with those obtained over 15-day and month-ly timescales, averaged over the season. The effects aresmall and the patterns do not change, but they are sys-tematic in that monthly values give 6% larger estimates,primarily owing to variability in precipitation. It maytherefore be more appropriate to think of these resultsas providing an index of recycling that should not betaken too literally but that does allow different regionsof the globe to be compared under the assumptionsmade.
Along the way, several other indices or measures ofthe vigor of the hydrological cycle and the relative im-portance of advective versus surface fluxes are com-puted. Thus, an examination is made of the ‘‘intensityof the hydrological cycle’’ (Drozdov and Grigor’eva1965), although a more descriptive term might be the‘‘precipitation efficiency,’’ which is the fraction of mois-ture flowing overhead that is precipitated out. The latterterm is already used in thunderstorm literature with aslightly different meaning. There precipitation efficien-cy is defined as the ratio of the water mass precipitatedto the mass of water vapor entering the storm through

1370 VOLUME 12J O U R N A L O F C L I M A T E
its base (e.g., Fankhauser 1988) or, in modeling studies,the ratio of total rainfall to total condensation (e.g., Fer-rier et al. 1996). Similarly, we can define a ‘‘moisteningefficiency’’ as the fraction of moisture added to thatflowing overhead.
A continuing problem with determination of all ofthese ratios has been the availability of datasets neededto accurately compute the fields on which they are based.The sources and sinks of atmospheric moisture are evap-oration and precipitation. Even climatological values arequite uncertain for both fields. Time series of monthlymeans globally are only now just becoming availablebut they require evaluation to ascertain their accuracyand usefulness. Although not without their problems,new global precipitation datasets and also analyses (thereanalyses) from the National Centers for Environmen-tal Prediction (NCEP) using data from the National Cen-ter for Atmospheric Research (Kalnay et al. 1996) allowestimates to be made of the quantities of interest.
A discussion of the datasets used is given in section2. Section 3 provides a brief description of the basicprecipitation, evaporation, and atmospheric moisturetransport fields, and section 4 presents the new for-mulation of the atmospheric moisture recycling. Theresults are presented and discussed in section 5.
2. Datasets
One source of precipitation data that is newly avail-able is from the Global Precipitation Climatology Pro-ject (Huffman et al. 1997), for the period after 1987;these are modified somewhat and extended to cover theperiod after 1979 by Arkin and Xie (1994) and Xie andArkin (1996, 1997) and are called the Climate PredictionCenter Merged Analysis of Precipitation (CMAP). Overland these fields are mainly based on information fromrain gauge observations, while over the ocean they pri-marily use satellite estimates made with several differentalgorithms based on outgoing longwave radiation, andscattering and emission of microwave radiation.
Another source is from the NCEP–NCAR reanalysesproduced with four-dimensional data assimilation onmodel (sigma) surfaces with T62 spectral resolution and28 levels in the vertical, with five of those levels in theatmospheric boundary layer; these also provide esti-mates of the evaporation and moisture transport. Thedata used are all from the averages of analyses fourtimes daily (which captures most of the diurnal cycle)from 1979 to 1995, and fields are integrated verticallyat full resolution in model coordinates. An evaluationof the NCEP moisture fields P and E, and the moisturetransport and divergence in the atmosphere has beencarried out by Trenberth and Guillemot (1996, 1998).The precipitable water w was compared with analyzedfields from National Aeronautics and Space Adminis-tration (NASA) Water Vapor Project (NVAP) (Randelet al. 1996), based primarily on Special Sensor Micro-wave/Imager (SSM/I) measurements over the oceans
and rawinsonde measurements over land, plus the Tele-vision Infrared Observation Satellite Operational Ver-tical Sounder. The moisture budgets were evaluatedthrough computation of the freshwater flux at the surfaceE 2 P using residual techniques from the divergenceof the total moisture transport, and this was comparedwith the reanalysis E 2 P that is based upon a 6-hintegration of the assimilating model and thus dependson the model parameterizations. The P field was eval-uated using Xie–Arkin CMAP estimates and, althoughit contains considerable uncertainties (Xie and Arkin1997), the patterns are believed to be adequate for thispurpose.
The NCEP moisture fields contain significant biasesin the Tropics, the tropical structures are less well de-fined than the SSM/I fields, and there is an underestimateof the variability from year to year. The NCEP modelP generally reveals a pronounced double intertropicalconvergence zone in the central Pacific and the locationof the South Pacific convergence zone is not well cap-tured. Rainfall amounts are lower than observed in theoceanic tropical convergence zones. The variability inthe central tropical Pacific of P associated with El Nino–Southern Oscillation is underestimated in the NCEP re-analyses and, moreover, is not very well correlated withthe CMAP product. A bias for too much rainfall in themodel over the southeastern United States and southeastAsia is also present in northern summer. The comparisonof E 2 P from the moisture budget with the modelresults reveals some strong systematic differences. Bi-ases in E are inferred in some places from the E 2 Pdifferences, and they probably arise from spurious landmoisture sources in some cases.
Therefore, use is made of the monthly CMAP fieldsof precipitation from Xie and Arkin, precipitable waterw from NVAP, and, in spite of the deficiencies notedabove, E and moisture transport values from the NCEPreanalyses. These are adequate for current purposes, al-though quantitative details should be viewed with cau-tion. Locally, values cannot be trusted because of biasesin the reanalyses, but the fields are nevertheless betterglobally than anything previously available for this pur-pose. The conclusions to be drawn are believed to berobust to the data uncertainties, although quantitativedetails will change.
3. Atmospheric moisture sources and sinks
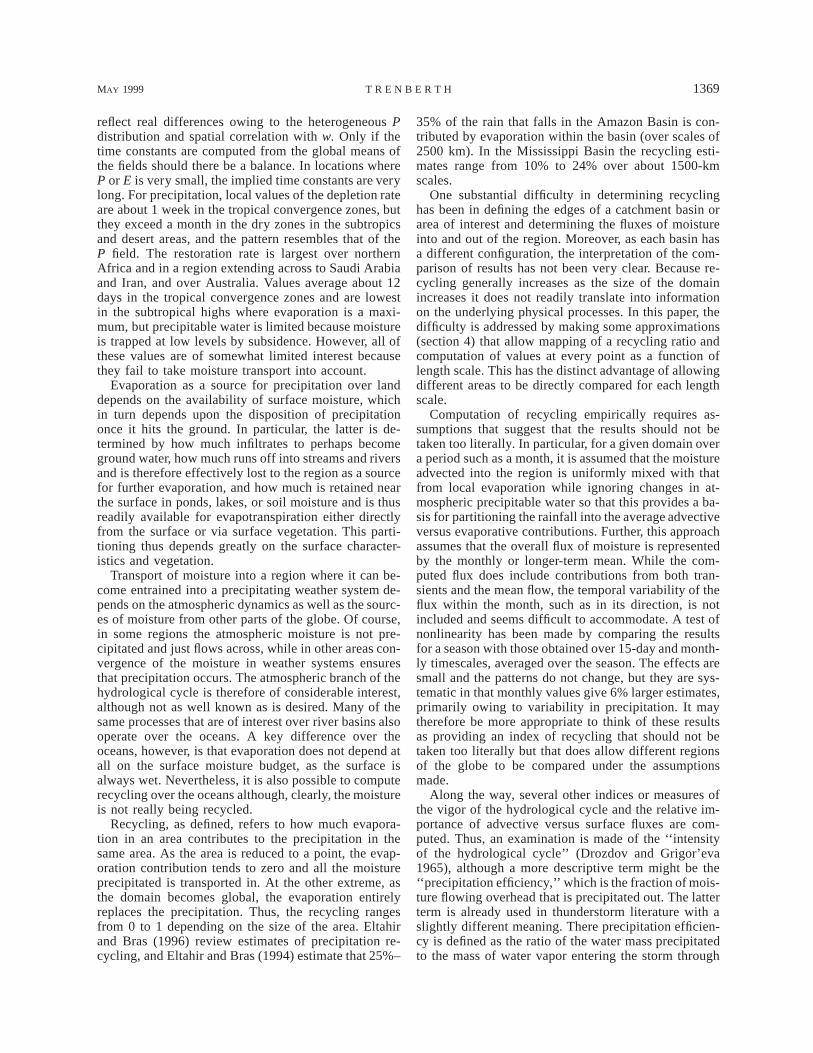
The seasonal mean precipitation CMAP P fields for1979–95 are shown in Fig. 1. The dominant featuresseen on the global scale are the major tropical conver-gence zones and the monsoon rains over the tropicalcontinents and maritime Asian–Australian region. Thesemaps show the main variations in storm tracks over theextratropical oceans but the contour interval is insuf-ficient to detail changes of significance over most landareas. Of note are the fairly sharp gradients and dis-tinctive structures. The evaporation field (Fig. 2) also
MAY 1999 1371T R E N B E R T H
FIG. 1. Seasonal mean precipitation from the Xie–Arkin productfor 1979–95 in mm day21. All quantities have been truncated to T31for presentation in all figures, the contour interval is given beloweach plot, and the units are at upper right. At right the zonal meanmeridional profile is given. Values exceeding 6 mm day21 are stippled.
FIG. 2. Seasonal mean evaporation from 1979 to 1995 from theNCEP reanalyses, based upon 6-h model integrations with the assim-ilating model. Units are mm day21. Values exceeding 4 mm day21
are stippled.
reveals strong structures that delineate the land–sea dif-ferences as a ready source of moisture. This is especiallyso in northern winter (December–February, DJF) wherecold dry continental air in the Northern Hemisphereflowing over relatively warm oceans produces largeevaporative fluxes into the atmosphere. Evaporationrates are typically small (,1 mm day21) over land inwinter but apparently can exceed 4 mm day21 in sum-mer.
As noted above, the moisture available locally for
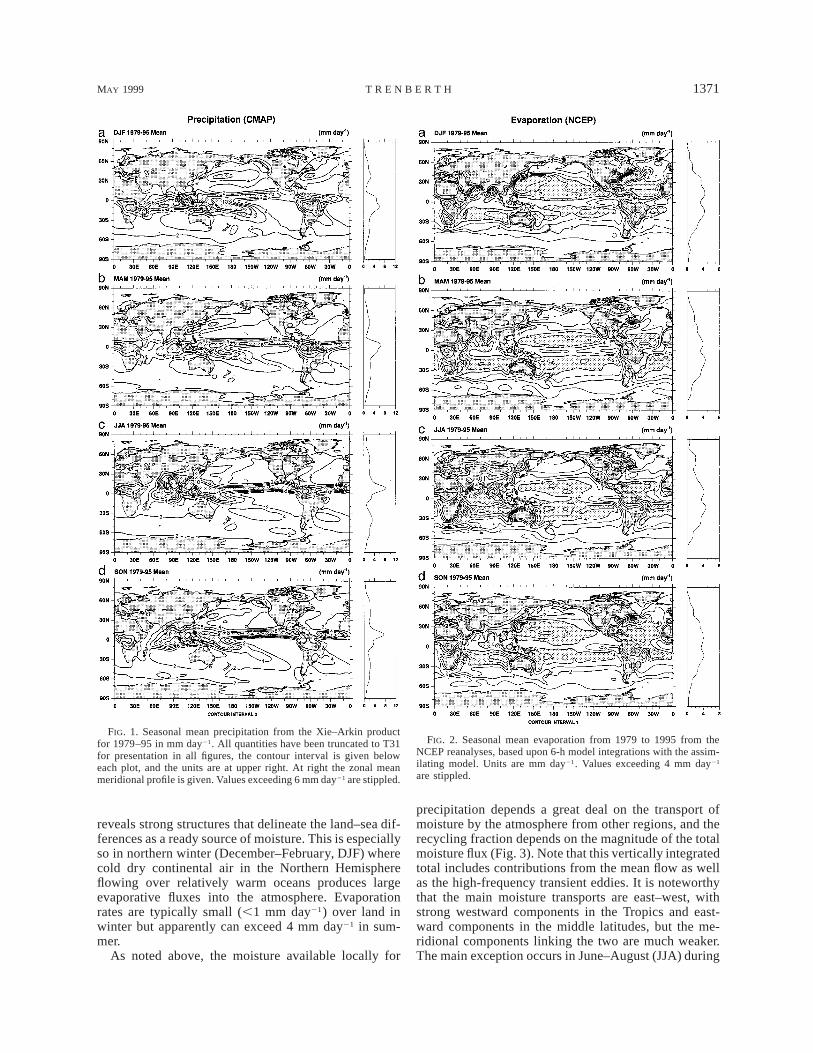
precipitation depends a great deal on the transport ofmoisture by the atmosphere from other regions, and therecycling fraction depends on the magnitude of the totalmoisture flux (Fig. 3). Note that this vertically integratedtotal includes contributions from the mean flow as wellas the high-frequency transient eddies. It is noteworthythat the main moisture transports are east–west, withstrong westward components in the Tropics and east-ward components in the middle latitudes, but the me-ridional components linking the two are much weaker.The main exception occurs in June–August (JJA) during
1372 VOLUME 12J O U R N A L O F C L I M A T E
FIG. 3. The seasonal mean moisture transport from the NCEP re-analyses for the period 1979–95. The scale of the vectors is givenbelow and contours indicate magnitudes in kg (m s)21.
FIG. 4. Schematic for the processes considered in recycling ofmoisture.
the Asian summer monsoon when there is a strongnorthward flow from the Southern Hemisphere subtrop-ics in the Somalian jet into India and southeast Asia.The corresponding northward flow in the low-level jetfrom the Gulf of Mexico into the United States is quitesmall by comparison. The only other meridional mois-ture flux of consequence is just off the east coast ofBrazil in the southern summer. The subtropical highsform the zones between the main zonal transports andare the main sources of evaporation, especially in thewinter. The poleward component in the westerlies of
both hemispheres arises mainly from the transient eddytransports associated with baroclinic weather systems.
4. Recycling of moisture
We have computed approximate values of recyclingfollowing the approach of Brubaker et al. (1993). Eltahirand Bras (1994, 1996) have proposed alternative for-mulas and estimation procedures, but some of their as-sumptions seem harder to justify, as discussed below inthis section. Equilibrium conditions are assumed inwhich there are no changes in atmospheric moisturecontent. As discussed below, this assumption can berelaxed, but for the results presented here the effects arenegligible.
Consider a domain of length L aligned along the tra-jectory of the air with a flux of moisture into the boxof Fin and a flux out of Fout (Fig. 4) and a total evap-oration, E, and precipitation, P, in the box; then
Fout 5 Fin 1 (E 2 P)L (1)
and the average horizontal moisture flux through thebox is
F 5 0.5(Fin 1 Fout) 5 Fin 1 0.5(E 2 P)L. (2)
If P 5 Pa 1 Pm, where Pa is the advective componentand Pm is the component of precipitation arising fromlocal evaporation, then the average horizontal flux ofadvected moisture over the region is Fin 2 0.5 PaL, andthe average horizontal flux of locally evaporated mois-ture is 0.5(E 2 Pm)L.
An important assumption is that the atmosphere iswell mixed so that the ratio of precipitation that fallsarising from advection versus local evaporation is equalto the ratio of average advected to evaporated moisturein the air. Thus,
P F 2 0.5P La in a5 , (3)P 0.5(E 2 P )Lm m
which is readily solved to give Pa/Pm 5 2Fin/EL so thatthe recycling ratio r can be written

MAY 1999 1373T R E N B E R T H
FIG. 5. Values of the recycling percentage as a function of the fluxof moisture into a box vs evaporation within the box according to(4) for length scales of 100 and 1000 km.
P ELmr 5 5 (4)P EL 1 2Fin
or, using (2),
ELr 5 . (5)
PL 1 2F
This expression involves several other quantities thatare of interest. The fraction of water vapor over a regionthat participates in the hydrological cycle,
PLI 5 , (6)
F
has been called the intensity of the hydrological cycleby Drozdov and Grigor’eva (1965), although a moredescriptive term might be the precipitation efficiency,as noted earlier. Similarly, we can define a moisteningefficiency,
ELM 5 , (7)
F
as the fraction of moisture added. Then from (5),
Mr 5 . (8)
2 1 I
This formulation has an advantage in that it can beevaluated locally, although formally the results apply toan area with a scale, L. All of these expressions for I,M, and r depend upon L. For example, if Fin is 150 kgm21 s21 and E is 4 3 1025 kg m22 s21 (about 3.5 mmday21), then r changes from about 1.3% for L of 100km to 11.8% for L of 1000 km. Figure 5 shows somevalues of r as functions of Fin and E, for L of 100 and1000 km. For small E (compared with the advectiveflux), r increases linearly with L. Note also from (5)that as F → 0 then r 5 E/P.
We have computed results using the full resolutionof the datasets available (T62 for the NCEP reanalyses)for length scales L of 500 and 1000 km. Global annualmean values for the former are also given in Trenberth(1998). While interest has often been on estimates of rfor large drainage basins, the heterogeneity of the landsurface is such that the recycling clearly varies sub-stantially over the basins. All the computations weredone locally in terms of I and M and have been smoothedto a T31 resolution for presentation purposes.
The above formulas are approximate, as they assumeuniformity that does not exist in practice, and Eqs. (1)and (2) do not hold exactly for the datasets that wehave. Clearly, some of the assumptions made above arequestionable. A critical assumption in this formulationis that the overall flux of moisture is represented by themean. The computed flux includes contributions fromtransients and the mean flow, but the temporal vari-ability of the flux, especially its direction, is not in-cluded. Brubaker et al. (1993) also discuss the short-comings in their formulation and note that ‘‘correlations
among the time-varying direction and water content ofincoming air masses and precipitation and evaporationrates are neglected.’’
Some checks have been made on the nonlinearitieswith temporal variability by making computations forshorter timescales and comparing the results. The effectsof these kinds of transients can be seen from (8) if weconsider perturbations in the denominator I 5 I 1 I9,

1374 VOLUME 12J O U R N A L O F C L I M A T E
where the overbar indicates a time average. Perturba-tions in M are more linear and of less concern. Then,using a binomial expansion and defining d9 5 I9/(2 1I),
rp 5 r(1 1 d92/2 . . .), (9)
where rp now includes the effects of perturbations. Thelast term arises in practice especially from perturbationsin precipitation and is positive; thus, rp is usually some-what greater than r . This has been confirmed by com-puting r for a season of 90 days and comparing it withr computed for 15- and 30-day periods then averagedto obtain the equivalent seasonal mean value. The latterr is larger by about 0.6% for monthly and 1.4% for 15-day timescales (vs typical values of r of 10%) but witha fairly uniform change so that the pattern changes little.This is a strong test, as a 15-day period is short enoughthat it may often contain no rainfall at all, so that therecycling of precipitation becomes undefined, as thereis none to recycle. The discontinuous nature of precip-itation probably introduces the greatest transient effects.It is not clear that the values derived from includinghigher frequencies are superior.
Another indication that these nonlinearities may notbe a major consideration comes from results of the In-ternational Satellite Land Surface Climatology Projectand from the First ISLSCP Field Experiment in partic-ular, which have shown that scaling of several variables,such as evapotranspiration, from local up to large scales,works quite well to enable the calculation of large-scalesurface fluxes to acceptable accuracies (e.g., Sellers etal. 1992; Sellers et al. 1997). In other words, effects oftopography and the surface radiation budget are nearlinear and, thus, scale invariant, allowing coarse reso-lution data to be used to calculate fluxes.
However, it is apparent that some caution is necessaryin dealing with the results that should not be taken tooliterally, and it may therefore be more appropriate tothink of r as an index of recycling. Nevertheless, thecomputation itself is rigorous in deriving a parameterrelevant to the hydrological cycle, and results allow dif-ferent regions of the globe to be compared.
Shortcomings also exist in other approaches to thisproblem. In Eltahir and Bras (1994), the recycling r 5Pw/P is also assumed to be equal to Ow/O, where O isthe total outflow of moisture and Ow is the outflow ofmoisture evaporated within the domain. Although thisassumption is built into their computations, it is clearlynot satisfied when averaged over the basin (e.g., in theirFig. 12). Thus, there are nonlinearities that arise ac-cording to how averages are taken in both space andtime. The spatial heterogeneity of the land surface char-acteristics has led us to focus on the results for 500-kmscales.
The above assumed no change in moisture storage inthe atmosphere. It is easy enough to allow for moisturechanges in (1) and (2), but assumptions such as thosein formulating (3) are still necessary. The changes in
storage of atmospheric moisture are systematic with theseasons and are largest for the transition seasons March–May (MAM) and September–November (SON; Tren-berth and Guillemot 1996, 1998) but still only amountto about 0.1 mm day21, which is negligible comparedwith other terms for our current purposes (cf. with Figs.1 and 2). Because the annual cycle is so important andresults vary so much with season, we present results forthe individual seasons.
5. Results and discussion
While the ratio of local to remote sources of moisturefor precipitation is of interest everywhere, the wholeconcept of recycling is most useful over land wheremoisture for evaporation is limited by the precipitation,whereas over the oceans the surface is wet regardlessof whether it rains or not. Therefore, for several plotswe have screened out values over the oceans to focusattention on the land watersheds. We have also screenedout regions of mountains (where surface pressures areless than 800 mb) from the calculation, as those areregions where the moisture flux is small and there arehuge variations over short distances owing to orographiceffects on rainfall. This includes most of Antarctica, andresults are not shown poleward of 508S and 758N be-cause values of w, P, and E are all very small and notparticularly reliable.
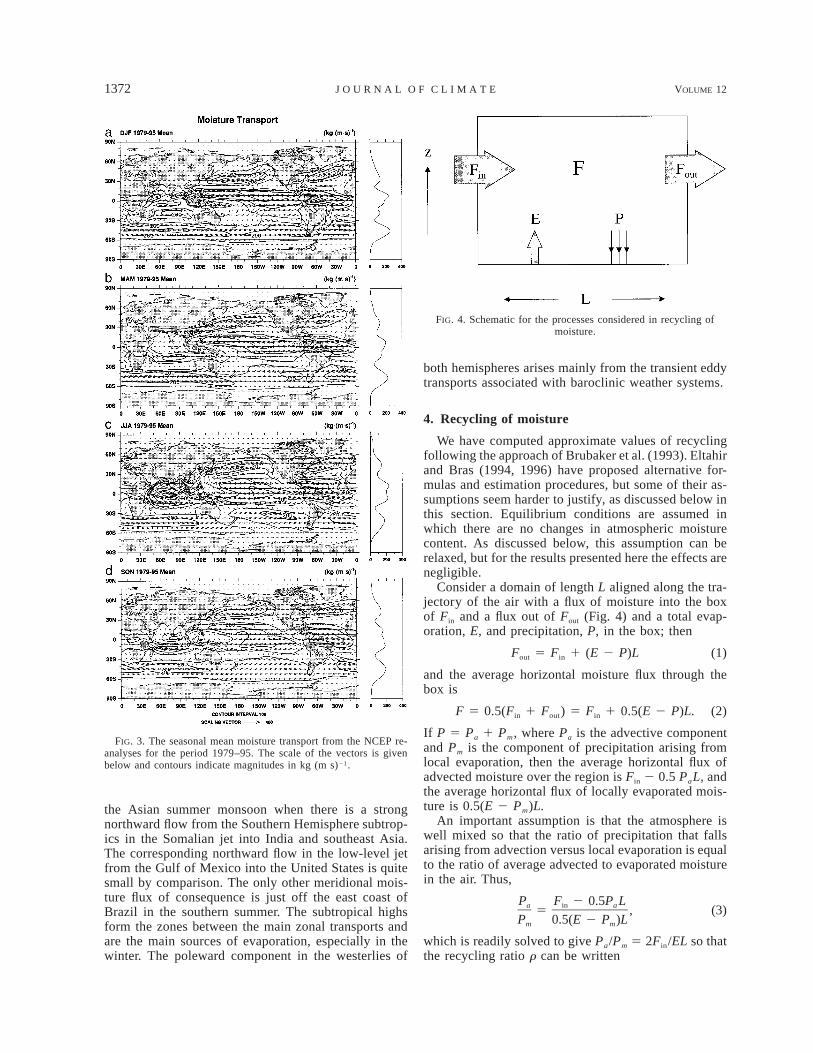
The results for the intensity I for each season (Fig.6) naturally follow precipitation fields to some extent.Values exceed 40% over the tropical African monsoonregion, and migrate back and forth across the equator.Over South America, such high values are apparent onlyover the southern part of the Amazon Basin, as the largemoisture transports over the northern regions (Fig. 3)substantially reduce the ratio of precipitation to trans-port, especially in the main rainy season of DJF. Otherlarge values of I . 40% occur in the convergence zoneover the Maritime Continent and thus extend over north-ern Australia and the Indonesian islands in DJF andmigrate to Asia later in the year. Over India, peak Ioccurs in SON and not when the rainfalls are at a max-imum owing to the strong low-level eastward moisturetransports in summer. Seasonal variations over NorthAmerica and Europe are fairly small. For annual means(Fig. 9), largest intensity occurs over the Maritime Con-tinent in the tropical west Pacific. Values are also largeover eastern Siberia, southern Brazil, and northeasternAustralia, where annual mean moisture transports arevery small. Thus, large intensity can sometimes arisefrom large precipitation rates but more likely stems fromrelatively low moisture transports in the atmosphere.
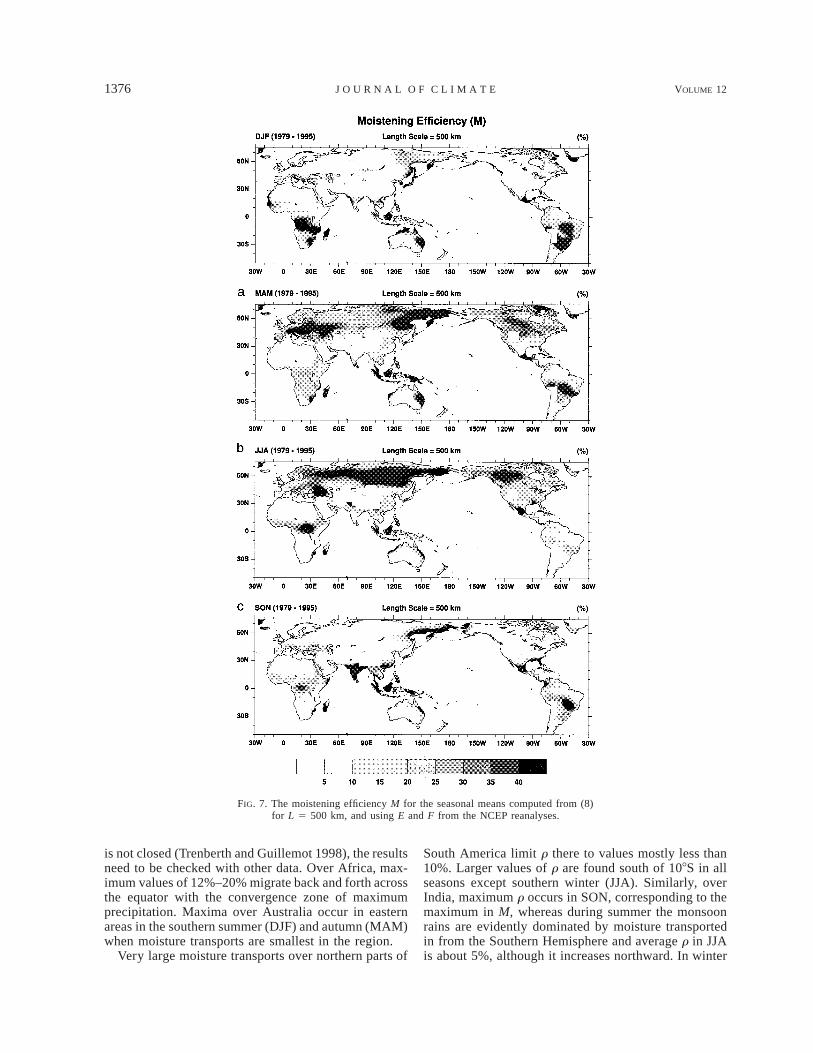
There is a huge annual cycle to the moistening M(Fig. 7), with maximum values over land occurring overAsia and northwest Canada in northern summer andshifting to tropical Africa and South America south ofthe equator in the southern summer. Some features ofhigh M coincide with those of high I because of their
MAY 1999 1375T R E N B E R T H
FIG. 6. The intensity of the hydrogical cycle I for the seasonal means computedfrom (7) for L 5 500 km, and using CMAP P and F from the NCEP reanalyses.
common factor in the denominator of small moisturetransports. This is especially true for the annual means(Fig. 9).
Because I is mostly in the range of 0%–50%, it isrelatively small compared with the factor 2 in (8) and,consequently, the recycling r patterns look very muchlike those of M with the magnitude diminished by valuesof just over 2. As L increases, however, both M and I
increase, and then the correspondence between M andr diminishes somewhat.
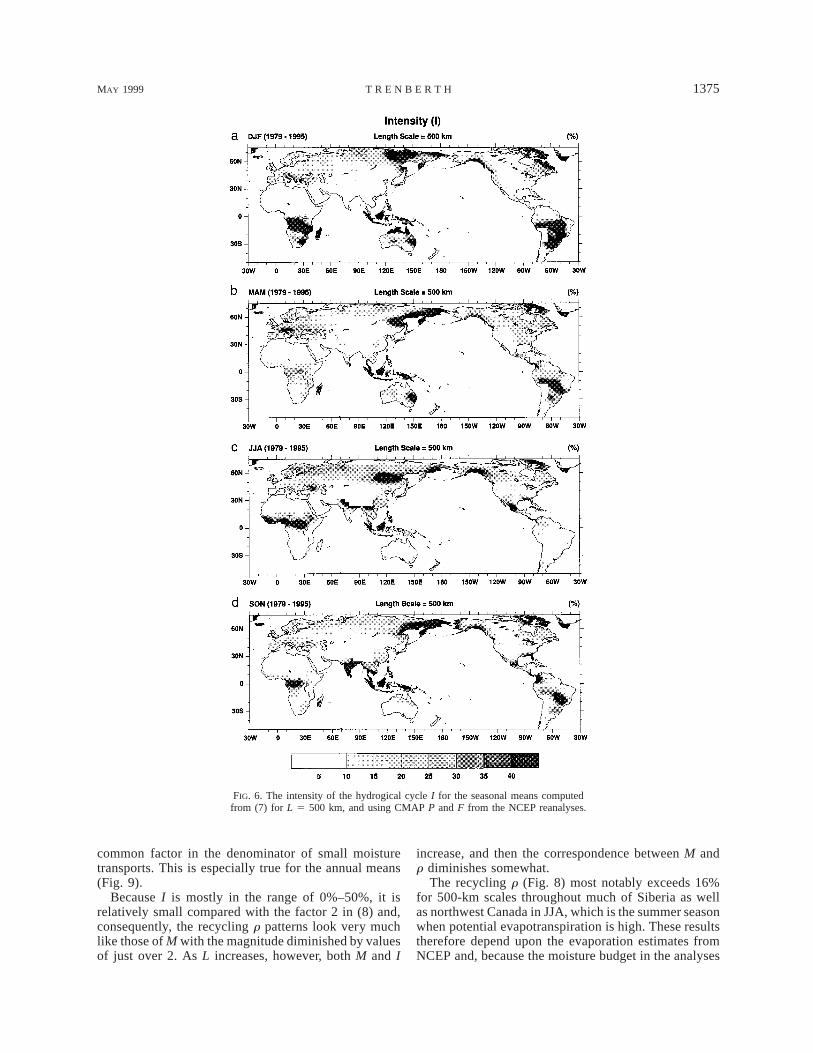
The recycling r (Fig. 8) most notably exceeds 16%for 500-km scales throughout much of Siberia as wellas northwest Canada in JJA, which is the summer seasonwhen potential evapotranspiration is high. These resultstherefore depend upon the evaporation estimates fromNCEP and, because the moisture budget in the analyses
1376 VOLUME 12J O U R N A L O F C L I M A T E
FIG. 7. The moistening efficiency M for the seasonal means computed from (8)for L 5 500 km, and using E and F from the NCEP reanalyses.
is not closed (Trenberth and Guillemot 1998), the resultsneed to be checked with other data. Over Africa, max-imum values of 12%–20% migrate back and forth acrossthe equator with the convergence zone of maximumprecipitation. Maxima over Australia occur in easternareas in the southern summer (DJF) and autumn (MAM)when moisture transports are smallest in the region.
Very large moisture transports over northern parts of
South America limit r there to values mostly less than10%. Larger values of r are found south of 108S in allseasons except southern winter (JJA). Similarly, overIndia, maximum r occurs in SON, corresponding to themaximum in M, whereas during summer the monsoonrains are evidently dominated by moisture transportedin from the Southern Hemisphere and average r in JJAis about 5%, although it increases northward. In winter
MAY 1999 1377T R E N B E R T H
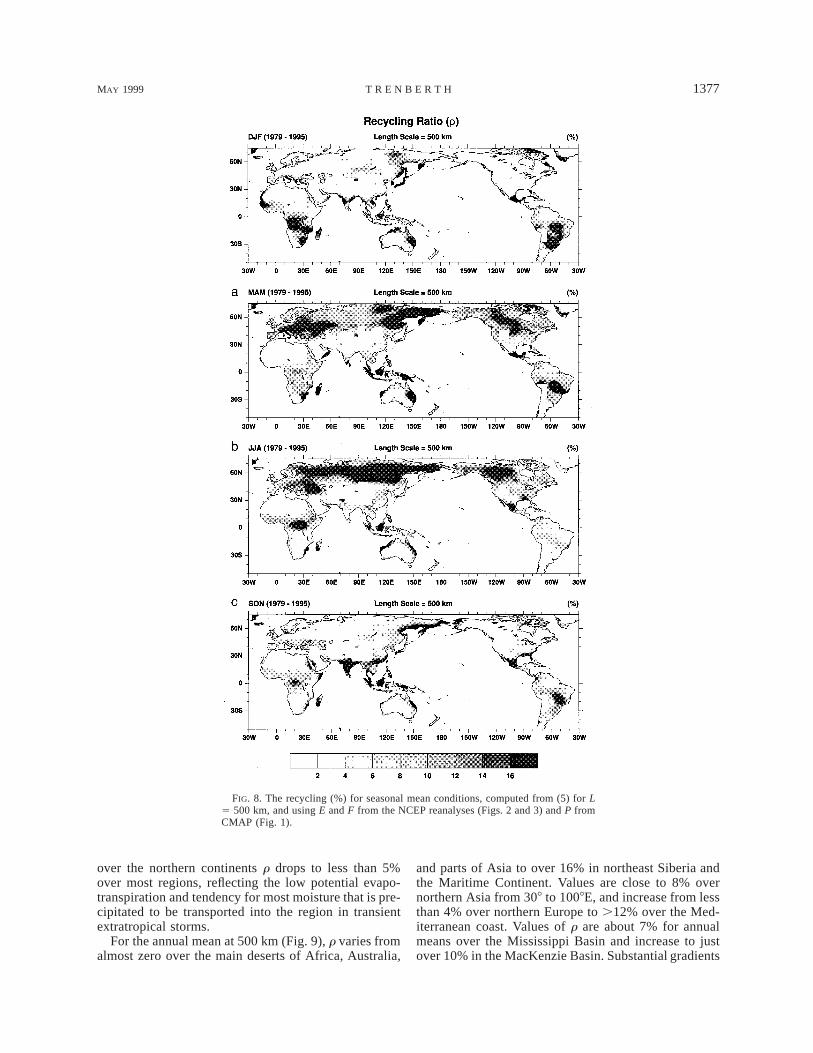
FIG. 8. The recycling (%) for seasonal mean conditions, computed from (5) for L5 500 km, and using E and F from the NCEP reanalyses (Figs. 2 and 3) and P fromCMAP (Fig. 1).
over the northern continents r drops to less than 5%over most regions, reflecting the low potential evapo-transpiration and tendency for most moisture that is pre-cipitated to be transported into the region in transientextratropical storms.
For the annual mean at 500 km (Fig. 9), r varies fromalmost zero over the main deserts of Africa, Australia,
and parts of Asia to over 16% in northeast Siberia andthe Maritime Continent. Values are close to 8% overnorthern Asia from 308 to 1008E, and increase from lessthan 4% over northern Europe to .12% over the Med-iterranean coast. Values of r are about 7% for annualmeans over the Mississippi Basin and increase to justover 10% in the MacKenzie Basin. Substantial gradients
1378 VOLUME 12J O U R N A L O F C L I M A T E
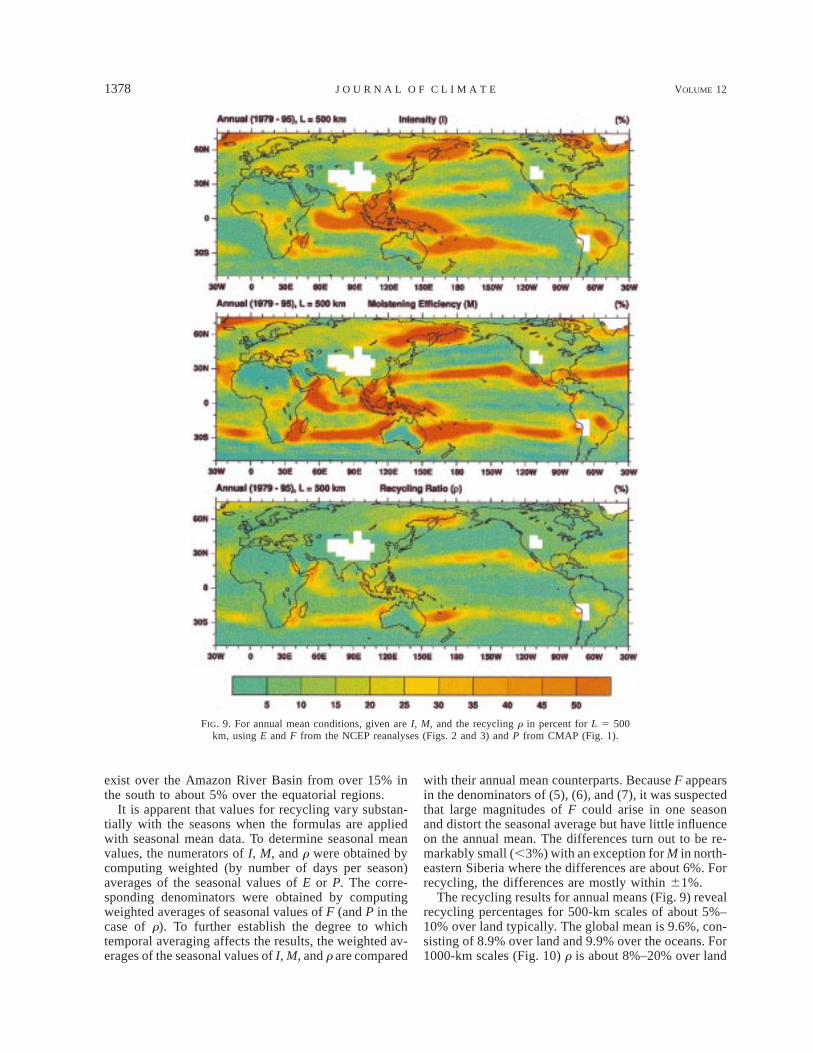
FIG. 9. For annual mean conditions, given are I, M, and the recycling r in percent for L 5 500km, using E and F from the NCEP reanalyses (Figs. 2 and 3) and P from CMAP (Fig. 1).
exist over the Amazon River Basin from over 15% inthe south to about 5% over the equatorial regions.
It is apparent that values for recycling vary substan-tially with the seasons when the formulas are appliedwith seasonal mean data. To determine seasonal meanvalues, the numerators of I, M, and r were obtained bycomputing weighted (by number of days per season)averages of the seasonal values of E or P. The corre-sponding denominators were obtained by computingweighted averages of seasonal values of F (and P in thecase of r). To further establish the degree to whichtemporal averaging affects the results, the weighted av-erages of the seasonal values of I, M, and r are compared
with their annual mean counterparts. Because F appearsin the denominators of (5), (6), and (7), it was suspectedthat large magnitudes of F could arise in one seasonand distort the seasonal average but have little influenceon the annual mean. The differences turn out to be re-markably small (,3%) with an exception for M in north-eastern Siberia where the differences are about 6%. Forrecycling, the differences are mostly within 61%.
The recycling results for annual means (Fig. 9) revealrecycling percentages for 500-km scales of about 5%–10% over land typically. The global mean is 9.6%, con-sisting of 8.9% over land and 9.9% over the oceans. For1000-km scales (Fig. 10) r is about 8%–20% over land

MAY 1999 1379T R E N B E R T H
FIG. 10. For annual mean conditions, r, the recycling (%) for L 5 1000 km over land.
typically and the mean recycling is 16.8% globally,15.4% over land and 17.3% over the oceans.
Over the Amazon, the results depend greatly uponwhether or not the maximum over the southern part ofthe basin, where r . 20%, is included. The South Amer-ican region defined by Brubaker et al. (1993) is from
2.58N to 158S, 508 to 758W (which is a reasonable ap-proximation of the Amazon River Basin), for which theaverage annual recycling on 500-km scales is 8.7%,ranging from 5.7% in JJA to 11.9% in DJF. But if theregion is cut off at 108S, the values drop to 6.4% forthe annual mean and with a range of 4.8% in JJA to
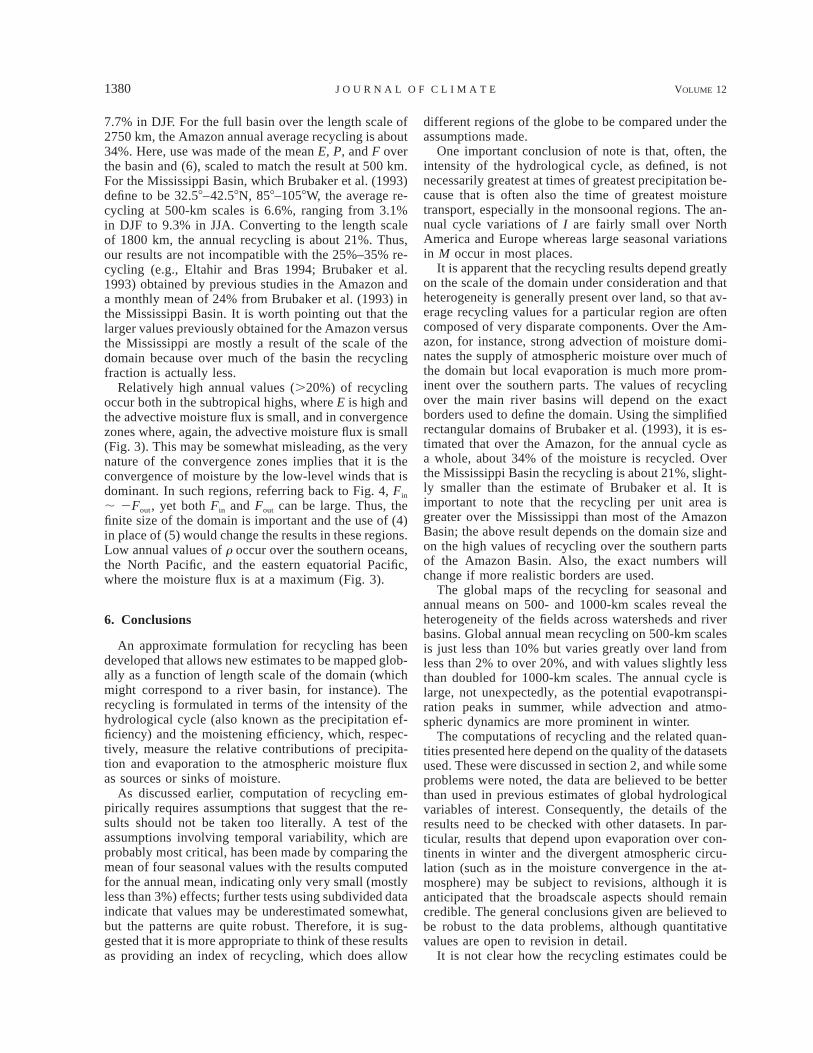
1380 VOLUME 12J O U R N A L O F C L I M A T E
7.7% in DJF. For the full basin over the length scale of2750 km, the Amazon annual average recycling is about34%. Here, use was made of the mean E, P, and F overthe basin and (6), scaled to match the result at 500 km.For the Mississippi Basin, which Brubaker et al. (1993)define to be 32.58–42.58N, 858–1058W, the average re-cycling at 500-km scales is 6.6%, ranging from 3.1%in DJF to 9.3% in JJA. Converting to the length scaleof 1800 km, the annual recycling is about 21%. Thus,our results are not incompatible with the 25%–35% re-cycling (e.g., Eltahir and Bras 1994; Brubaker et al.1993) obtained by previous studies in the Amazon anda monthly mean of 24% from Brubaker et al. (1993) inthe Mississippi Basin. It is worth pointing out that thelarger values previously obtained for the Amazon versusthe Mississippi are mostly a result of the scale of thedomain because over much of the basin the recyclingfraction is actually less.
Relatively high annual values (.20%) of recyclingoccur both in the subtropical highs, where E is high andthe advective moisture flux is small, and in convergencezones where, again, the advective moisture flux is small(Fig. 3). This may be somewhat misleading, as the verynature of the convergence zones implies that it is theconvergence of moisture by the low-level winds that isdominant. In such regions, referring back to Fig. 4, Fin
; 2Fout, yet both Fin and Fout can be large. Thus, thefinite size of the domain is important and the use of (4)in place of (5) would change the results in these regions.Low annual values of r occur over the southern oceans,the North Pacific, and the eastern equatorial Pacific,where the moisture flux is at a maximum (Fig. 3).
6. Conclusions
An approximate formulation for recycling has beendeveloped that allows new estimates to be mapped glob-ally as a function of length scale of the domain (whichmight correspond to a river basin, for instance). Therecycling is formulated in terms of the intensity of thehydrological cycle (also known as the precipitation ef-ficiency) and the moistening efficiency, which, respec-tively, measure the relative contributions of precipita-tion and evaporation to the atmospheric moisture fluxas sources or sinks of moisture.
As discussed earlier, computation of recycling em-pirically requires assumptions that suggest that the re-sults should not be taken too literally. A test of theassumptions involving temporal variability, which areprobably most critical, has been made by comparing themean of four seasonal values with the results computedfor the annual mean, indicating only very small (mostlyless than 3%) effects; further tests using subdivided dataindicate that values may be underestimated somewhat,but the patterns are quite robust. Therefore, it is sug-gested that it is more appropriate to think of these resultsas providing an index of recycling, which does allow
different regions of the globe to be compared under theassumptions made.
One important conclusion of note is that, often, theintensity of the hydrological cycle, as defined, is notnecessarily greatest at times of greatest precipitation be-cause that is often also the time of greatest moisturetransport, especially in the monsoonal regions. The an-nual cycle variations of I are fairly small over NorthAmerica and Europe whereas large seasonal variationsin M occur in most places.
It is apparent that the recycling results depend greatlyon the scale of the domain under consideration and thatheterogeneity is generally present over land, so that av-erage recycling values for a particular region are oftencomposed of very disparate components. Over the Am-azon, for instance, strong advection of moisture domi-nates the supply of atmospheric moisture over much ofthe domain but local evaporation is much more prom-inent over the southern parts. The values of recyclingover the main river basins will depend on the exactborders used to define the domain. Using the simplifiedrectangular domains of Brubaker et al. (1993), it is es-timated that over the Amazon, for the annual cycle asa whole, about 34% of the moisture is recycled. Overthe Mississippi Basin the recycling is about 21%, slight-ly smaller than the estimate of Brubaker et al. It isimportant to note that the recycling per unit area isgreater over the Mississippi than most of the AmazonBasin; the above result depends on the domain size andon the high values of recycling over the southern partsof the Amazon Basin. Also, the exact numbers willchange if more realistic borders are used.
The global maps of the recycling for seasonal andannual means on 500- and 1000-km scales reveal theheterogeneity of the fields across watersheds and riverbasins. Global annual mean recycling on 500-km scalesis just less than 10% but varies greatly over land fromless than 2% to over 20%, and with values slightly lessthan doubled for 1000-km scales. The annual cycle islarge, not unexpectedly, as the potential evapotranspi-ration peaks in summer, while advection and atmo-spheric dynamics are more prominent in winter.
The computations of recycling and the related quan-tities presented here depend on the quality of the datasetsused. These were discussed in section 2, and while someproblems were noted, the data are believed to be betterthan used in previous estimates of global hydrologicalvariables of interest. Consequently, the details of theresults need to be checked with other datasets. In par-ticular, results that depend upon evaporation over con-tinents in winter and the divergent atmospheric circu-lation (such as in the moisture convergence in the at-mosphere) may be subject to revisions, although it isanticipated that the broadscale aspects should remaincredible. The general conclusions given are believed tobe robust to the data problems, although quantitativevalues are open to revision in detail.
It is not clear how the recycling estimates could be

MAY 1999 1381T R E N B E R T H
greatly improved through the kind of empirical approachused here because a number of assumptions appear tobe necessary. In a climate model it would be possiblein principle to label each parcel of atmospheric moisturewith its source and age, and trace each parcel to wher-ever it is precipitated (Jousaumme et al. 1986; Kosteret al. 1986). While potentially quite enlightening, thisapproach also makes assumptions concerning subgrid-scale mixing, diffusion, and precipitation processes,such as convection parameterization, and depends onthe fidelity of the simulation. Thus far, simulations ofconvection do not match observations adequately tohave complete confidence in this approach (e.g., Dai etal. 1999). Nevertheless, the method has different as-sumptions and, thus, is complementary.
Finally, it should be noted that the dominance of themoisture transport in feeding the Amazon rains andmonsoonal rains in many other areas seems to implythat sensitivity to changes in land surface characteristicswould be reduced were this not the case. Of course,changes in vegetation that produce even small changesin evaporation and moisture availability may still besufficient to alter the precipitation, latent heating, and,thus, atmospheric circulation and moisture transport,which means that this line of argument should not bepushed very far. The strongly nonlinear feedbacks canonly be captured in a comprehensive climate model.
Acknowledgments. This research is partly sponsoredby NOAA under Grant NA56GP0247 and by a jointNOAA/NASA grant (NA56GP0576). I thank David Ste-paniak and Chris Guillemot for performing the com-putations and producing the figures.
REFERENCES
Arkin, P. A., and P. Xie, 1994: The Global Precipitation ClimatologyProject: First algorithm intercomparison project. Bull. Amer. Me-teor. Soc., 75, 401–419.
Brubaker, K. L., D. Entekhabi, and P. S. Eagleson, 1993: Estimationof continental precipitation recycling. J. Climate, 6, 1077–1089.
Dai, A., F. Giorgi, and K. E. Trenberth, 1999: Observed and modelsimulated precipitation diurnal cycles over the contiguous UnitedStates. J. Geophys. Res., in press.
Drosdov, O. A., and A. S. Grigor’eva, 1965: The Hydrologic Cycle
in the Atmosphere. Israel Program for Scientific Translations,282 pp.
Eltahir, E. A. B., and R. L. Bras, 1994: Precipitation recycling in theAmazon basin. Quart. J. Roy. Meteor. Soc., 120, 861–880., and , 1996: Precipitation recycling. Rev. Geophys., 34,367–378.
Fankhauser, J. C., 1988: Estimates of thunderstorm precipitation ef-ficiency from field measurements in CCOPE. Mon. Wea. Rev.,116, 663–684.
Ferrier, B. S., J. Simpson, and W.-K. Tao, 1996: Factors responsiblefor precipitation efficiencies in midlatitude and tropical squallsimulations. Mon. Wea. Rev., 124, 2100–2125.
Huffman, G. J., and Coauthors, 1997: The Global Precipitation Cli-matology Project (GPCP) combined precipitation dataset. Bull.Amer. Meteor. Soc., 78, 5–20.
Jousaumme, S., R. Sadourney, and C. Vignal, 1986: Origin of pre-cipitating water in a numerical simulation of the July climate.Ocean–Air Inter., 1, 43–56.
Kalnay, E., and Coauthors, 1996: The NCEP/NCAR 40-Year Re-analysis Project. Bull. Amer. Meteor. Soc., 77, 437–471.
Koster, R. D., J. Jouzel, R. Suozzo, G. Russell, W. Broecker, D. Read,and P. S. Eagleson, 1986: Global sources of local precipitationas determined by the NASA/GISS GCM. Geophys. Res. Lett.,13, 121–124.
Randel, D. L., T. H. Vonder Haar, M. A. Ringerud, D. L. Reinke, G.L. Stephens, T. J. Greenwald, and C. L. Combs, 1996: A newglobal water vapor dataset. Bull. Amer. Meteor. Soc., 77, 1233–1246.
Sellers, P. J., M. D. Heiser, and F. G. Hall, 1992: Relations betweensurface conductance and spectral vegetation indices at inter-mediate (100 m2 to 15 km2) length scales. J. Geophys. Res., 97,19 033–19 059., , , S. B. Verma, R. L. Desjardins, P. M. Schuepp, andJ. I. MacPherson, 1997: The impact of using area-averaged landsurface properties—topography, vegetation condition, soil wet-ness—in calculations of intermediate scale (approximately 10km2) surface-atmosphere heat and moisture fluxes. J. Hydrol.,190, 269–301.
Trenberth, K. E., 1998: Atmospheric moisture residence times andcycling: Implications for rainfall rates and climate change. Cli-mate Change, 39, 667–694., and C. J. Guillemot, 1996: Evaluation of the atmospheric mois-ture and hydrological cycle in the NCEP reanalyses. NCAR Tech.Note NCAR/TN-4301STR, 300 pp., and , 1998: Evaluation of the atmospheric moisture andhydrological cycle in the NCEP reanalyses. Climate Dyn., 14,213–231.
Xie, P., and P. A. Arkin, 1996: Analyses of global monthly precipi-tation using gauge observations, satellite estimates, and numer-ical model predictions. J. Climate, 9, 840–858., and , 1997: Global precipitation: A 17-year monthly anal-ysis based on gauge observations, satellite estimates, and nu-merical model outputs. Bull. Amer. Meteor. Soc., 78, 2539–2558.