atmospheric-pressure dielectric barrier discharge (dbd) · pdf filepreface this thesis...
TRANSCRIPT

Bochum 2011
Dissertation zur Erlangung des Grades einesDoktor-Ingenieurs der Fakultät fürElektrotechnik und Informationstechnik
Priyadarshini Rajasekaran
Atmospheric-pressure dielectricbarrier discharge (DBD) in air:Plasma characterisation for skin therapy
Atm
os
ph
eri
c-p
res
su
re d
iele
ctr
ic b
arr
ier
dis
ch
arg
e (
DB
D)
in a
ir:
Pla
sm
a c
ha
rac
teri
sa
tio
n f
or
sk
in t
he
rap
y
Fakultät für
Elektrotechnik und Informationstechnik

Dissertation eingereicht am: 12.01.2011Tag der mundlichen Prufung: 11.02.2011
1.Berichter: Prof. Dr.-Ing. Peter Awakowicz2.Berichter: Prof. Dr. rer. nat. Ralf-Peter Brinkmann


Preface
This thesis embodies the results and observations from experimental studies of a dielectricbarrier discharge (DBD) operated in air at atmospheric-pressure. The different dischargemodes of the DBD device are characterized for medical applications such as skin therapyand skin disinfection.
Chapter 1 gives a general introduction to plasmas and their diversified applications. Specialfocus is placed on non-thermal plasma for biomedical applications and on the necessity forselective treatment of living tissues. The aim of this work is also outlined.
Chapter 2 reviews the different bio-medical plasma sources including those based on theworking principle of DBD, which are investigated currently by several research groups.
Chapter 3 describes the experimental DBD-setup under investigation and the purpose of us-ing simple counter-electrodes of different materials and profiles. The diagnostic methods andthe numerical simulation used for characterization of plasma conditions are briefly discussed.
Chapter 4 presents the characterization method adopted to study the plasma conditionsin the discharge obtained for different counter electrodes which are determined using opticaldiagnostics and simulation.
Chapter 5 reviews the importance of nitric oxide and ozone molecules for skin treatment.Simulation of chemical kinetics and of fluxes of nitric oxide and ozone molecules that reachthe surface during DBD treatment for different discharge modes is discussed.
Chapter 6 presents the experimental investigation of the DBD operated in the single-filamentary discharge mode obtained using spike as counter electrode, and characterizationof the discharge for therapeutic use in dermatology.
Chapter 7 describes the stochastic-filamentary and homogeneous discharge modes realizedusing conductive and non-conductive counter electrodes, respectively and the characteriza-tion of these modes for skin treatment.
Chapter 8 presents the characterization of plasma conditions when animal skin in vivois subjected to DBD treatment. The biological effects induced in skin tissue after plasmatreatment is also discussed.
In the last chapter, the conclusions arrived from the investigation of DBD for medicalapplication are summarized and an outlook on further experiments that can be carried outin this direction are presented.


Contents i
Contents
List of figures vi
List of tables vii
Abstract ix
Zusammenfassung xi
1 General Introduction 1
2 Atmospheric-pressure plasma for medical applications 52.1 Thermal plasma: Plason . . . . . . . . . . . . . . . . . . . . . . . . . . . . . 52.2 Non-thermal plasma sources . . . . . . . . . . . . . . . . . . . . . . . . . . . 6
2.2.1 Non-thermal glow discharge: Plasma needle . . . . . . . . . . . . . . 62.2.2 Plasma jet: Microwave plasma source . . . . . . . . . . . . . . . . . . 7
2.3 Dielectric Barrier Discharges (DBDs) . . . . . . . . . . . . . . . . . . . . . . 102.3.1 Working principle . . . . . . . . . . . . . . . . . . . . . . . . . . . . . 102.3.2 Operating modes of a DBD and their transitions . . . . . . . . . . . . 112.3.3 Medical applications of DBDs . . . . . . . . . . . . . . . . . . . . . . 13
2.4 Other atmospheric-pressure plasma sources for medical applications . . . . . 152.5 Conclusion . . . . . . . . . . . . . . . . . . . . . . . . . . . . . . . . . . . . . 16
3 Experiment and numerical simulation 193.1 Plasma Stick . . . . . . . . . . . . . . . . . . . . . . . . . . . . . . . . . . . 193.2 Experimental arrangement . . . . . . . . . . . . . . . . . . . . . . . . . . . . 193.3 Pulsed power supply . . . . . . . . . . . . . . . . . . . . . . . . . . . . . . . 203.4 Aspects of barrier discharge on human body . . . . . . . . . . . . . . . . . . 213.5 Counter electrodes for discharge characterization . . . . . . . . . . . . . . . . 233.6 Plasma diagnostics . . . . . . . . . . . . . . . . . . . . . . . . . . . . . . . . 23
3.6.1 Optical Emission Spectroscopy (OES) . . . . . . . . . . . . . . . . . . 233.6.2 Photomultiplier tube (PMT) . . . . . . . . . . . . . . . . . . . . . . . 253.6.3 Current-Voltage measurements . . . . . . . . . . . . . . . . . . . . . 273.6.4 Microphotography . . . . . . . . . . . . . . . . . . . . . . . . . . . . 27
3.7 Numerical simulation . . . . . . . . . . . . . . . . . . . . . . . . . . . . . . . 28
4 Discharge characterization 314.1 Plasma parameters . . . . . . . . . . . . . . . . . . . . . . . . . . . . . . . . 31
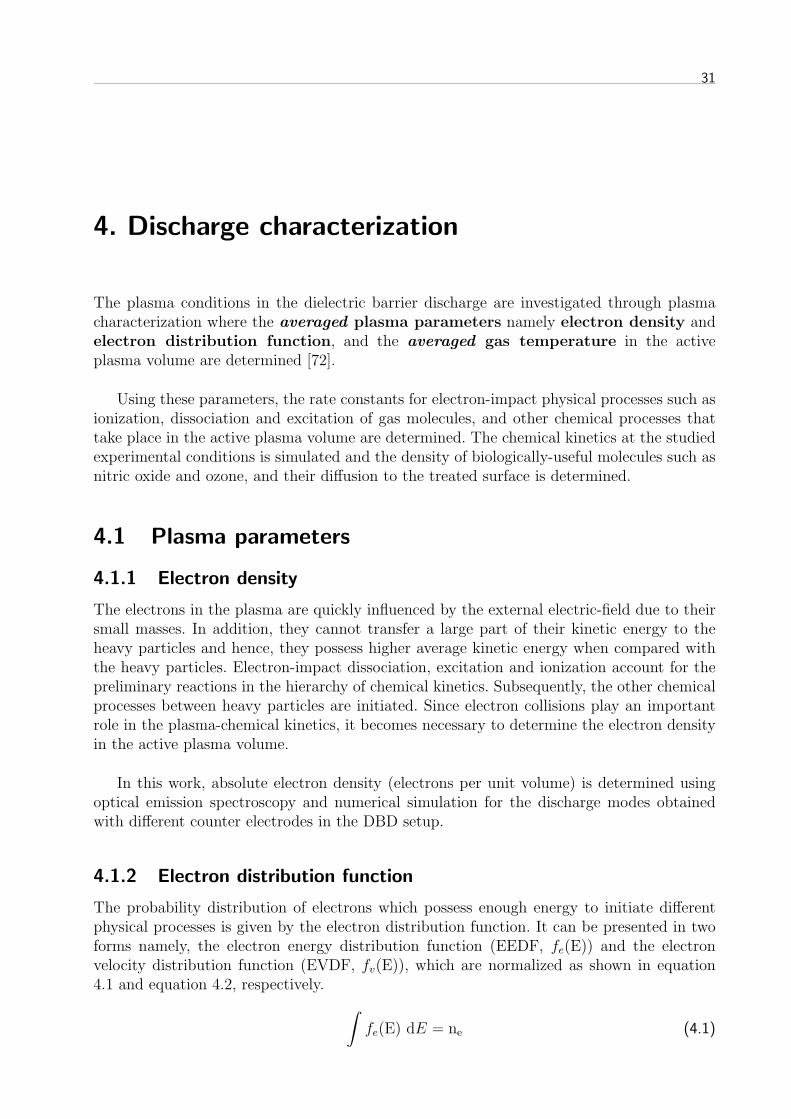
4.1.1 Electron density . . . . . . . . . . . . . . . . . . . . . . . . . . . . . . 314.1.2 Electron distribution function . . . . . . . . . . . . . . . . . . . . . . 31

ii Contents
4.2 Gas temperature . . . . . . . . . . . . . . . . . . . . . . . . . . . . . . . . . 324.3 Rate constants for physical and chemical processes . . . . . . . . . . . . . . 324.4 Plasma characterization . . . . . . . . . . . . . . . . . . . . . . . . . . . . . 34
4.4.1 Determination of averaged gas temperature . . . . . . . . . . . . . . 344.4.2 Determination of electron velocity distribution function . . . . . . . . 364.4.3 Determination of rate constants . . . . . . . . . . . . . . . . . . . . . 384.4.4 Determination of electron density . . . . . . . . . . . . . . . . . . . . 38
5 Simulation of NO and ozone fluxes reaching the DBD-treated surface 415.1 Endogenous NO and ozone . . . . . . . . . . . . . . . . . . . . . . . . . . . . 415.2 Exogenous NO and ozone: Short note on medical applications . . . . . . . . 425.3 Chemical kinetics in air DBD . . . . . . . . . . . . . . . . . . . . . . . . . . 435.4 Simulation of fluxes of NO and ozone molecules . . . . . . . . . . . . . . . . 455.5 Equations used in simulation . . . . . . . . . . . . . . . . . . . . . . . . . . . 45
5.5.1 Continuity equation . . . . . . . . . . . . . . . . . . . . . . . . . . . . 455.5.2 Equation of thermoconductivity . . . . . . . . . . . . . . . . . . . . . 46
5.6 Initial values and Boundary conditions . . . . . . . . . . . . . . . . . . . . . 475.7 Solving equations using Graphics Processing Unit (GPU) . . . . . . . . . . . 47
6 Single-filamentary DBD mode 496.1 Counter electrodes . . . . . . . . . . . . . . . . . . . . . . . . . . . . . . . . 49
6.1.1 Spike . . . . . . . . . . . . . . . . . . . . . . . . . . . . . . . . . . . . 496.1.2 Water . . . . . . . . . . . . . . . . . . . . . . . . . . . . . . . . . . . 49
6.2 Single-filamentary discharge mode . . . . . . . . . . . . . . . . . . . . . . . . 506.3 Determination of plasma conditions by discharge characterization . . . . . . 506.4 Fluxes of NO and ozone reaching the treated surface . . . . . . . . . . . . . 576.5 Irradiation of treated surface by UV-photons . . . . . . . . . . . . . . . . . . 58
7 Stochastic-filamentary and homogenous DBD modes 637.1 DBD operated on human body . . . . . . . . . . . . . . . . . . . . . . . . . 637.2 Counter electrodes: aluminium, buffer solution and glass . . . . . . . . . . . 647.3 Filamentary and homogeneous discharge modes . . . . . . . . . . . . . . . . 647.4 Physics of the discharges . . . . . . . . . . . . . . . . . . . . . . . . . . . . . 667.5 Characterization of the discharge modes . . . . . . . . . . . . . . . . . . . . 717.6 Simulation of NO and ozone fluxes . . . . . . . . . . . . . . . . . . . . . . . 74
7.6.1 Assumptions for stochastic-filamentary discharge mode . . . . . . . . 757.6.2 Assumptions for homogeneous discharge mode . . . . . . . . . . . . . 777.6.3 Results: Fluxes of NO and ozone . . . . . . . . . . . . . . . . . . . . 78
7.7 UV-irradiation of treated surface . . . . . . . . . . . . . . . . . . . . . . . . 78
8 DBD treatment of animal model 838.1 Experimental arrangement . . . . . . . . . . . . . . . . . . . . . . . . . . . . 838.2 Histologic evaluation of skin biopsy after plasma treatment . . . . . . . . . . 848.3 Mode of plasma on mouse skin . . . . . . . . . . . . . . . . . . . . . . . . . . 848.4 Characterization of plasma conditions . . . . . . . . . . . . . . . . . . . . . . 858.5 Simulation of fluxes of NO and ozone . . . . . . . . . . . . . . . . . . . . . . 878.6 UV-irradiation of mouse skin . . . . . . . . . . . . . . . . . . . . . . . . . . . 878.7 Results of histological evaluation of DBD-treated skin . . . . . . . . . . . . . 90

Contents iii
8.8 Validation of averaged plasma parameters . . . . . . . . . . . . . . . . . . . 92
9 Conclusion and Outlook 97
Bibliography 101


List of Figures v
List of Figures
2.1 Experimental arrangement of the microwave plasma source. . . . . . . . . . . 82.2 Microwave plasma device: Source of NO and ozone for medical applications . 82.3 Concentration of nitric oxide in the effluent of the microwave plasma source . 92.4 Concentration of ozone in the effluent of the microwave plasma source . . . . 92.5 Common configurations of dielectric barrier discharges (DBD) . . . . . . . . 112.6 Snap shot of volume discharge . . . . . . . . . . . . . . . . . . . . . . . . . . 122.7 Inverse microphotograph of surface discharge on ceramic . . . . . . . . . . . 122.8 µ-APPJ plasma device: Source of oxygen atoms . . . . . . . . . . . . . . . . 17
3.1 Snap shot of Plasma stick in use . . . . . . . . . . . . . . . . . . . . . . . . . 193.2 The DBD experimental device . . . . . . . . . . . . . . . . . . . . . . . . . . 203.3 DBD device igniting plasma on finger . . . . . . . . . . . . . . . . . . . . . . 213.4 High-voltage pulse in sequential profile with damped oscillations. . . . . . . . 223.5 Efficiency of the Ocean optics spectrometer in 200-800 wavelength range. . . 243.6 Experimental setup for optical emission spectroscopy (OES) of the DBD. . . 253.7 Spectral response of the photomultiplier tube . . . . . . . . . . . . . . . . . 263.8 Experimental arrangement of photomultiplier tube (PMT) and DBD . . . . 263.9 Schematic diagram of the experimental arrangement of DBD. . . . . . . . . . 273.10 Experimental setup for microphotography of the DBD. . . . . . . . . . . . . 28
4.1 Emission spectrum of DBD in air at atmospheric-pressure. . . . . . . . . . . 344.2 Determination of gas temperature using OES . . . . . . . . . . . . . . . . . . 35
6.1 Snapshot of DBD electrode and spike arrangement . . . . . . . . . . . . . . 506.2 Inverse microphotograph of single-filamentary discharge with spike . . . . . . 516.3 Inverse microphotograph of single-filamentary discharge with water . . . . . 516.4 Radial distribution of Tg in afterglow . . . . . . . . . . . . . . . . . . . . . . 526.5 Current-voltage characteristics for spike as counter electrode at d = 1.5 mm 536.6 Current-voltage characteristics for water as counter electrode at d = 1.5 mm 546.7 Calculated EVDF fitted using OES for different inter-electrode distances . . 556.8 Spatial distribution of NO in single-filamentary discharge mode . . . . . . . 576.9 Flux of NO reaching the treated surface in single-filamentary DBD mode . . 596.10 Flux of ozone reaching the treated surface in single-filamentary DBD mode 596.11 Simulated UV-A irradiation for single-filamentary DBD mode . . . . . . . . 606.12 Simulated UV-B irradiation for single-filamentary DBD mode . . . . . . . . 616.13 Simulated UV-C irradiation for single-filamentary DBD mode . . . . . . . . 61
7.1 Inverse microphotograph of DBD on finger . . . . . . . . . . . . . . . . . . . 637.2 Current-voltage traces for DBD electrode in contact with grounded electrode 65

vi List of Figures
7.3 Microphotograph of stochastic-filamentary DBD mode . . . . . . . . . . . . 657.4 Microphotograph of homogeneous DBD mode . . . . . . . . . . . . . . . . . 667.5 Profile of high-voltage pulses . . . . . . . . . . . . . . . . . . . . . . . . . . . 677.6 Current, voltage and PMT signals for aluminium electrode at d = 2 mm. . . 687.7 Current, voltage and PMT signals for aluminium electrode at d = 1 mm. . . 687.8 Inverse microphotograph of DBD with PBS solution (Exposure time = 2ms) 697.9 Inverse microphotograph of DBD with glass (Exposure time = 2ms) . . . . . 697.10 EVDF for aluminium, PBS and glass at d = 0.5 mm . . . . . . . . . . . . . 727.11 EVDF for aluminium, PBS and glass at d = 1 mm . . . . . . . . . . . . . . 727.12 Current-voltage characteristics for PBS solution as counter electrode . . . . . 747.13 Current-voltage characteristics for glass as counter electrode . . . . . . . . . 757.14 Simulated flux of NO in successive ignitions . . . . . . . . . . . . . . . . . . 767.15 Flux of NO and ozone reaching treated surface in all discharge modes . . . . 797.16 UV-A and UV-B irradiation of treated surface in all discharge modes . . . . 81
8.1 Inverse microphotograph of DBD on mouse . . . . . . . . . . . . . . . . . . . 848.2 Flux of NO and ozone reaching mouse skin during DBD treatment . . . . . . 898.3 Spectral effectiveness values for the wavelength range 200-400 nm . . . . . . 908.4 Giemsa-stained biopsy of control and plasma-treated skin tissues . . . . . . . 91
9.1 Cross-sectional view of Reconstituted Human Epidermis (RHE) . . . . . . . 999.2 Construction of a Reconstituted Human Epidermis (RHE) insert . . . . . . . 99

List of Tables vii
List of Tables
5.1 Physical and chemical processes included in the simulation . . . . . . . . . . 44
6.1 Plasma parameters for single-filamentary discharge mode . . . . . . . . . . . 56
7.1 Plasma parameters for filamentary and homogeneous discharge modes . . . . 73
8.1 Plasma parameters for homogeneous DBD on mouse . . . . . . . . . . . . . 868.2 DBD on mouse skin: Simulation of chemical kinetics . . . . . . . . . . . . . . 888.3 Plasma conditions assumed for validation of averaged plasma parameters . . 95
1 Plasma parameters and rate constants for all discharge modes . . . . . . . . A - 112


Abstract ix
Abstract
A plasma device based on the dielectric-barrier-discharge (DBD) principle is investigated formedical applications. Unlike conventional DBD arrangement which comprises of two elec-trodes, this plasma device has only one electrode covered with a dielectric namely alumina(Al2O3). The other electrode can be an object of high capacitance such as the human bodyor any grounded electrode. High voltage pulsed power supply with trigger frequency 300 Hzand maximum amplitude of about 13 kV is used. The working gas is ambient air present inthe gap between the DBD electrode and the treated surface. Physical processes like electron-impact excitation and dissociation, and chemical processes occurring in the active plasmaand in the afterglow produce molecules including nitric oxide (NO) and ozone, and also UV-photons which are useful for therapy of skin diseases and for disinfecting the skin surface.The production of these molecules and photons is influenced by the plasma conditions whichin turn depend on plasma parameters such as electron density and electron distribution func-tion, and also on the gas temperature.
In this work, characterization of plasma conditions is achieved by determining these pa-rameters using experimental methods and numerical simulation. Subsequently, the fluxesof NO and ozone molecules that would reach the treated surface are determined. Prior tocharacterization of the barrier discharge on a complex system such as the human body, sim-ple electrodes of different materials (metal, dielectric, liquid) and profiles (flat and spike)are used as grounded counter-electrodes one at a time, and the discharge is characterized.Lastly, mouse skin in vivo is subjected to plasma treatment and the plasma is characterized.
A stochastic-filamentary discharge mode is obtained with aluminium flat electrode andwith buffer solution as the counter electrode whereas a homogeneous discharge is observedwith glass. On the other hand, a single-filamentary discharge mode occurs with aluminiumspike, and also with water at specific conditions. Except for a few microdischarges due toraised points, a homogeneous discharge is produced on mouse skin. The properties of thegrounded electrode influences discharge formation. Experimental methods such as opticalemission spectroscopy, microphotography and current-voltage measurements are employedfor characterization. Numerical simulation is used besides experimental data to determinegas temperature and electron velocity distribution function, and to simulate chemical kinet-ics, thermal conductivity and diffusion of NO and ozone molecules to the treated surface.The fluxes of NO, ozone and UV-photons reaching the treated surface are determined andcompared with fluxes used in skin treatments which employ plasma and light sources.
The fluxes of NO and ozone from the single-filamentary discharge mode are the highest,however, this is only for a small area of the treated surface. The stochastic-filamentarydischarge and the homogeneous discharge offer a uniform treatment of the entire area coveredby the DBD electrode. The fluxes of NO and ozone produced by the homogeneous discharge

x Abstract
are higher than that obtained for the stochastic-filamentary discharge. DBD treatment forup to 120 s treatment is safe for skin cells, causes no inflammation, does not affect collagenstructure and does not induce any kind of tissue injuries. UV-irradiation levels in all dischargemodes are within the limits allowed for direct exposure on skin and hence the device is safefor treatment of living tissues.

Zusammenfassung xi
Zusammenfassung
Eine Plasma-Quelle, welche auf dem Prinzip der dielektrisch behinderten Entladung (DBE)basiert, wird fur den medizinischen Einsatz untersucht. Im Gegensatz zu konventionellenDBE-Anordnungen besteht diese Plasma-Quelle nicht aus zwei Elektroden sondern aus einereinzigen Elektrode, die mit einem Dielektrikum aus Aluminiumoxid (Al2O3) beschichtet ist.Die DBE-Anordnung zundet ein Plasma zwischen der Elektrode und einem Objekt hoherKapazitat wie dem menschlichen Korper oder einer geerdeten Gegenelektrode. Es wird eingepulstes Hochspannungs-Netzgerat mit einer Trigger-Frequenz von 300 Hz und einer max-imalen Amplitude von 13 kV eingesetzt. Bei dem Arbeitsgas handelt es sich um Umge-bungsluft, welche zwischen der DBE-Elektrode und der zu behandelnden Oberflache zurVerfugung steht. Chemische Reaktionen und physikalische Prozesse, wie durch Elektronen-stoße hervorgerufene Anregung und Dissoziation treten im aktiven Plasma und beim Nach-leuchten auf. Auf diese Weise entstehen Molekule wie Stickstoffmonoxid (NO) und Ozon(O3), aber auch UV-Photonen, welche hilfreich fur die Therapie von Haukrankheiten unddie Hautdesinfektion sind. Die Produktion dieser Molekule und Photonen wird durch dievorherrschenden Plasma-Bedingungen, die wiederum von Parametern wie der Elektronen-dichte, der Elektronen-Verteilungsfunktion oder der Gastemperatur abhangen, beeinflusst.
In dieser Arbeit erfolgt eine Charakterisierung des Plasmas anhand einer Bestimmungdieser Parameter durch experimentelle Methoden und numerische Simulationen. Auf dieseWeise werden der Fluss von Stickstoffmonoxid und Ozon-Molekulen, welche die zu behan-delnde Oberflache erreichen, bestimmt. Bevor die Entladung auf einem komplexen Systemwie dem menschlichen Korper charakterisiert werden kann, werden zunachst einfache Elek-troden verschiedener Materialien (Metall, Dielektrikum, Flussigkeit) und Formen (flach,spitz) als geerdete Gegenelektrode eingesetzt und die entsprechende Entladung charakter-isiert. Abschließend wird die Haut einer Maus der Plasma-Behandlung ausgesetzt und dasentsprechende Plasma ebenfalls charakterisiert. Eine stochastische Filament-Entladung trittbei einer flachen Aluminium-Elektrode und bei einer Pufferlosung als Gegenelektrode auf,wahrend eine homogene Entladung bei Glas zu beobachten ist. Andererseits ist eine einzelneFilament-Entladung bei einer Aluminiumspitze sowie unter bestimmten Bedingungen beiWasser vorhanden. Abgesehen von einigen Mikroentladungen aufgrund von hervorstehen-den Ansatzpunkten auf der zu behandelnden Oberflache, entsteht bei der Haut einer Mauseine homogene Entladung. Experimentelle Methoden wie optische Emissions-Spektroskopie,Mikrofotografie und Strom-Spannungs-Messungen werden fur die Charakterisierung des Plas-mas verwendet. Der Einsatz numerischer Simulationen dient der Bestimmung der Gastem-peratur und Elektronen-Geschwindigkeits-Verteilungsfunktion aus experimentellen Werten,sowie der Simulation der chemischen Kinetik, der thermischen Leitfahigkeit und der Dif-fusion von Stickstoffmonoxid und Ozon-Molekulen auf die zu behandelnden Oberflache.Die NO- und O3-Flusse sowie UV-Photonen, die die zu behandelnde Oberflache erreichen,werden bestimmt und mit medizinischen Behandlungsmethoden, welche dem Einsatz von

xii Zusammenfassung
Plasma und Lichtquellen in der Dermatologie unterliegen, verglichen. Die NO- und O3-Flusse haben bei einer einzelnen Filament-Entladung die hochsten Werte, sind jedoch nurin einem kleinen Bereich auf der zu behandelnden Oberflache vertreten. Die stochastischenFilament-Entladungen und die homogene Entladung ermoglichen eine gleichmaßige Behand-lung des vollstandigen Bereichs unter der DBE-Elektrode. Die NO- und O3-Flusse einerhomogenen Entladung sind hoher als die Flusse der stochastischen Filament-Entladung. DieIntensitat der UV-Strahlung aller Entladungsformen befindet sich im Rahmen der Vorgabenfur Strahlungsdosen und ist daher nicht gesundheitsschadlich.

1
1. General Introduction
Plasmas are partially-ionized gases and are described as the ‘fourth state’ of matter. Theword ‘plasma’ was coined by Irving Langmuir in 1928, for the ionized gas which comprisesof suspended electrons, ions, and other excited and charged particles that appeared to himlike the cells suspended in the blood plasma. Examples for naturally-existing plasma includesstars, lightening, polar lights and flame; manmade plasmas are fluorescent lamps, neon signs,plasma displays and monitors, to name a few. Much more sensitive as well as large-scale ap-plications of plasma have been proven in the recent decades.
Plasma technology is gaining importance as one of the most effective tool for a wide rangeof applications: from etching of nanoscaled electronics to plasma welding, from fuel systemsfor power generation to plasma lamps, from bio-decontamination of food to promoting tis-sue culture, and many more. Plasma is produced and sustained usually by a high voltageat different pressures specific to the application. From low-pressure to atmospheric-pressureand also high-pressure, plasma plays efficient roles, for e.g. in ozone generation [1], surfaceprocessing and surface treatment [2, 3], chemical vapour deposition [4], polymerization [5],nanoparticle production [6], etc. Above all, plasma treatments are eco-friendly, cost effective,time-saving and more efficient than most other conventional methods used in several indus-tries including textile and semi-conductor.
In recent times, biological and biomedical applications of plasma are of great interest.Plasma sources are employed for bacterial inactivation [7] and tissue sterilization [8], decon-tamination of medical instruments [9, 10, 11], surface modification of implantable bioma-terials [12, 13], etc. In contrast to sterilization effects, plasma also supports cell processesselectively. For instance, it enhances blood coagulation [14], promotes wound healing andsupports tissue regeneration [15]. In these applications, plasma devices are used in contactor at close vicinity of the body. The active components of plasma namely, the electrons,ions, metastables, radicals, excited molecules and atoms, and photons interact selectivelywith cell biology. Reactive oxygen species (ROS) including oxygen atoms and metastables,ozone and superoxides, and reactive nitrogen species (RNS) including nitrogen metastablesand nitrogen oxides are of major interest for medical applications.
There are several possible effects produced by plasma components on microorganismsand few of them are listed below:
i) chemical effect - the reactive oxygen species (ROS) oxidize and rupture the cell membranecausing leakage of the intracellular components, and finally cause bacterial death [16, 17],
ii) physical effect - the ions increase the surface potential of the microorganism causing anelectrostatic tension between different layers of the cell wall. When the tensile strength of

2 1. General Introduction
the cell wall is overcome by the electrostatic tension, the cell wall ruptures [18] and leads tocell death. This is termed as electrostatic disruption [19],
iii) neutralizing effect - the bacterial cell wall is negatively charged in nature, and neutral-ization of the cell wall by plasma results in cytoplasm leakage and eventually cell death [20],
iv) effect of photons - the damage of cell membrane by UV photons also results in necrosis,the unnatural death of cells [21].
These effects can be induced to healthy body-cells as well as to pathogens. Therefore,profound understanding of the plasma-tissue interactions becomes vital and essential forachieving in-clinic medical use of plasma which is safe for the body cells.
In general, biological structures are sensitive and are susceptible to both pressure andtemperature. Low pressure treatments collapse the cell structure and high temperatures causethermal damage to the cells. These conditions are suited for decontamination of non-livingobjects such as surgical instruments and medical implants, however not for treatment of livingtissues. This limitation can be overcome by using plasmas that are operated at atmospheric-pressure and characterized by temperatures close to room temperature, like the non-thermalatmospheric-pressure discharges. By tuning the operating parameters of the plasma device,the plasma properties can be tailored in order to be suitable for the treatment of livingtissues without thermal damage. Some of the well-known non-thermal atmospheric-pressureplasma sources for biomedical applications include one-atmosphere uniform glow discharge(OAUGD) [16], plasma needle [22], plasma pencil [23], floating electrode-dielectric barrierdischarge (FE-DBD) [24], plasma brush [25] and microwave plasma jet [26].
Although there are several non-thermal plasma devices operating at atmospheric-pressure,non-thermal dielectric barrier discharges (DBDs) are gaining importance in direct plasmatreatment of human body. They have been successfully employed for sterilization and otherbiomedical applications [27, 28, 29, 30]. DBD arrangements usually comprise of two elec-trodes, separated by a small distance with atleast one of them covered with a dielectricmaterial. Plasma is produced in the gap between the electrodes when the applied high-voltage breaks down the gas and thereby enabling flow of electrons. A DBD operated inair at atmospheric-pressure is characterized by the formation of current filaments called mi-crodischarges which connect the electrodes only for a short duration (in the order of severalnanoseconds).
Besides electrode configuration, the form of power supply to the plasma device also deter-mines the suitability of the plasma source for in vivo applications. Any medical treatment ofthe human body is expected to be a pain-free treatment, in order to keep the patient relaxed.Plasma current is one such potential cause of pain during treatment. Temporally-averagedplasma current can be diminished by reducing plasma power. This is achieved by using ahigh-voltage pulsed power supply which produces current pulses of short durations. The cur-rent produced in the pulsed-power mode is in the order of milliamperes or even more andlasts for about a few nanoseconds or several microseconds. These short current pulses canattribute to painless treatment. In the studied DBD device, pulsed power supply with 300Hz trigger frequency is used. Each trigger pulse initiates a sequence of high voltage pulses of100 kHz frequency and damped amplitude. The maxima of applied voltage is about 13 kV.

3
The duration of current pulse reaches upto 30 ns.
In a nutshell, there are several plasma sources designed for biomedical application thatoperate using different principles. The effects of plasma on biological structures are widelystudied but plasma-tissue interactions requires further attention in order to successfully im-plement plasma devices in medical therapy. The chemically-active species produced in theplasma have to be quantified in order to understand the plasma-induced biological responses,and the plasma devices have to be tuned accordingly for effective medical use. These biolog-ical responses could be due to a single active species (selective behaviour) or due to severalspecies enhancing and suppressing each others effects (cumulative behaviour). In order toget down to this microscopic level, the concentration of chemically-active species in theplasma has to be determined. The concentration of the active species is influenced by theplasma conditions existing in the discharge and one way to determine this is by ‘Plasmacharacterization’.
Objective of this work
The objective of this work is to characterize the plasma conditions of a dielectric barrierdischarge (DBD) device intended for medical applications, especially for skin treatment. TheDBD device comprises of only one working electrode which is covered with ceramic. Whenbreakdown conditions are satisfied, the device ignites plasma on objects of high capacitancesuch as human body (which serves as the counter electrode in this case) and also withgrounded electrodes (which then resembles a conventional DBD arrangement). The humanbody is a complex system characterized with skin parameters namely, roughness, moisturecontent, sebum content which vary from one person to another, and are influenced by factorslike age, diet, climatic conditions, medication and skin care, etc. These factors can poten-tially alter the electric-conductivity and capacitance of the skin surface which in turn inducesdifferent plasma conditions during direct DBD treatment. Hence, prior to characterization ofplasma on human body, plasma conditions in the discharges produced using simple counter-electrodes of different materials and profiles are characterized.
For characterization, gas temperature in the active plasma volume and the plasma pa-rameters namely, electron density and electron distribution function are determined using i)experimental methods such as optical emission spectroscopy (OES), current-voltage measure-ments and microphotography, and ii) numerical simulation. The fluxes of biologically-usefulmolecules like nitric oxide and ozone reaching the treated surface, the chemical kinetics inthe active plasma volume and in the afterglow phase of the discharge are simulated using theexperimental values. In addition, irradiation of the treated surface by UV-photons is deter-mined. The results thus obtained are compared with fluxes used in other medical treatmentsin dermatology which employ plasma and light sources.s


5
2. Atmospheric-pressure plasma for medicalapplications
There has been a gradual development of the system configuration from thermal arcs tonon-thermal plasma sources. Several important factors including the plasma temperature,the working gas, the amplitude and frequency of the applied voltage are taken into accountto devise a plasma source that is suitable for specific medical applications. This has led to theevolution of a highly-interdisciplinary research theme called ‘Plasma Medicine’. An overviewof various atmospheric-pressure plasma sources developed and investigated for medical ap-plications is presented in this chapter.
2.1 Thermal plasma: Plason
‘Plason’ [15], which basically uses a DC arc, is one among the earliest application of plasmasin medical field. Air is pumped into the manipulator of the device which becomes a sourceof nitric oxide (NO) due to plasma chemical processes promoted by the high temperatureof the electric arc. The cathode of the plasma-generating module is liquid-cooled in order tocontrol the quenching of NO and thereby its concentration exiting the open end of the ma-nipulator’s hose. The temperature at the exit point is variable and corresponds to differentmedical applications. At about 30-50 mm from the anode, the temperature drops rapidlyand the flow of NO-containing gas is felt to be slightly warm.
Different types of Plason manipulators namely, coagulator, destructor and stimulator-coagulator facilitate a good range of medical applications. Plason was successfully used forplasma-aided surgery which includes two different operating modes, i) the hot mode of thedevice enables rapid coagulation and sterilization of the wound, destruction and desiccationof dead tissue and also useful for dissection of biological tissues, and ii) the cold mode pro-duces NO-containing gas flow reaching 20-40◦ C at the exit of the 150 mm long hose of themanipulator. This mode is also used for the stimulation of regenerative processes and woundhealing.
The device is an excellent source of NO with concentration in the range of 0-2500 ppm[15]. Such high NO concentration is useful to stimulate wound healing process as in caseof slow wound recovery seen in chronic wounds. Faster epithelization of diabetic ulcers isobserved compared to the continual treatment due to shortening of all the phases of thewound healing process [31]. The source is also used for the treatment of wounds in the eye[32].

6 2. Atmospheric-pressure plasma for medical applications
2.2 Non-thermal plasma sources
Non-thermal plasma, generated at atmospheric-pressure, is ideal for the treatment of livingtissues where the integrity of the cell structure is not disturbed by conditions like adversepressure or high temperature. The temporally-averaged temperature in these plasmas is closeto or slightly above room temperature, but does not reach higher values (above 40 ◦C).
Recently, non-thermal plasma for medical application was classified into ‘direct ’ plasmaand ‘indirect ’ plasma [33]. Direct plasma is the one which is ignited directly on the humanbody using a dielectric-covered high voltage electrode where the human body or the livingtissue acts as the counter electrode. On the other hand, indirect plasma is generated remotely,and the plasma effluent reaches the treated surface which carries the active species to the siteof treatment. Direct plasmas generated at specific conditions can be effective for therapeuticapplications like enhancing wound healing process, therapy of skin diseases, skin disinfection,blood coagulation, etc.
2.2.1 Non-thermal glow discharge: Plasma needle
‘Plasma needle’ [22] was reported by the group of E. Stoffels from Eindhoven University ofTechnology (The Netherlands). The plasma needle is a 5 cm long tungsten pin with a sharptip which is confined coaxially in a plastic tube. It is operated using radio-frequency powersupply to produce a glow discharge at the tip of the pin and the size of the glow produced isabout 0.1-1 mm. Several configurations of the plasma needle are reported [34]. The workinggas is usually helium, and an admixture of nitrogen is used for plasma diagnostics.
Initial studies include (i) electrical and optical characterization of the plasma needle [35],and (ii) biological tests where living mammalian cells were subjected to plasma treatmentand analysis of effects of ultraviolet UV-B and UV-C [21]. The device was also used to pre-pare dental cavities without pain which can substitute the painful conventional mechanicaldrilling process prior to filling the cavity. Plasma treatment of an extracted tooth showedthat the temperature inside the tooth increases with increased voltage, the maximum isabout 26 ◦C for an applied voltage of 220 V. This accounts for about 2.3 ◦C temperaturerise after treatment [36].
When mammalian vascular cells in vitro were subjected to plasma treatment, the for-mation of plasma-induced voids is observed in the cell culture [37]. Uneven thickness of theculture medium in the well resulted in the formation of thin liquid layers. When 250 Vrms
is applied for 30 s, the plasma-generated species penetrate this thin layer, dissolve the celladhesion molecules (CAM) and thus cause detachment of cells, leading to the formation ofplasma-induced voids. For a 1-2 s treatment, at low power (of 100 mW) no voids are formed;however at high power (about 300 mW) cell necrosis is observed. The cell detachment be-haviour, similar to that observed in vitro, was also reported for plasma-treated arterial tissuesof mouse [34].
The generation of nitric oxide (NO) by the plasma needle was analyzed [38]. A workinggas mixture of 15% Helium, 12% O2 and 73% N2 was used. NO density is nearly 10-20%of the total product density from the source and it increases with increasing power. It isclaimed that the needle is too efficient since it produces NO higher than that is produced

2.2. Non-thermal plasma sources 7
physiologically, and this high amount can be optimized for medical application. A distanceless than 2 mm from the needle is considered to be optimum for medical treatment withreference to biological test conducted previously.
The influence of properties of the treated surface on the electrical properties of the plasmaneedle was simulated. The plasma structure interacting with different surfaces was simulatedin two-dimensional co-ordinates using the finite element method [39]. Three different surfacesnamely, a dielectric, a dielectric-metal pair and a metal operate in low power corona mode,high power glow mode and intense ionization mode, respectively. It was concluded that thecorona mode is suitable for local treatments and plasma-sensitive materials, and the glowmode is expected to offer a more rapid and uniform treatment.
2.2.2 Plasma jet: Microwave plasma source
The microwave plasma source was designed by the Ferdinand-Braun-Institute (FBH) inBerlin, Germany. The device [26] comprises of a cylindrical hollow resonator. The dimensionsof the resonator are: length = 12 mm, diameter = 8 mm and wall thickness = 0.6 mm. Theresonator has a nozzle of diameter 0.6 mm and houses a copper wire which ends very close tothis nozzle. The resonator is integrated with solid-state power oscillator. The high-frequencygenerator is based on gallium nitride transistor and is powered by DC 24 V power supply. Thedriving frequency is about 2.4 GHz. The plasma source is operated at a working gas flow rateof 100-1000 sccm and sometimes even higher. The flow of nitrogen and oxygen through theresonator is controlled by flow controllers. NO is measured using an electro-chemical detectorwhile ozone is determined using absorption spectroscopy. The configuration of the plasmasource, and the experimental arrangement to measure NO (using electro-chemical detector),to determine ozone (using calibrated spectrometer) and for optical emission spectroscopy arepresented in figure 2.1.
A discharge at the end of the copper wire near the nozzle is ignited because of high volt-age across the secondary winding of the high-voltage transformer. The nitrogen and oxygenmolecules of the working gas are dissociated in the active plasma volume and the plasmaeffluent blown out through the nozzle of the resonator as shown in figure 2.2.
Characterization of the conditions in the plasma produced in N2/O2 gas mixture, andinfluence of plasma parameters on the production of NO and ozone in the effluent have beeninvestigated [26]. Results show that the concentration of NO and ozone in the active plasmavolume and in the effluent depend on gas temperature, the temperature-dependent rate con-stants and the flow rate of the individual gas through the resonator.
For instance, at 60 sccm O2-flow, the concentration of NO and ozone in the effluent(about 25 mm away from the nozzle) shows laterally-inverted slopes (figure 2.3 and figure2.4). Maximum concentration of NO and ozone obtained using this source is 2750 ppm and400 ppm, respectively. From this study, it is evident that it is possible to adjust the operatingparameters of the microwave plasma source in order to produce different quantities of NOand ozone using different ratios of N2 and O2 in the working-gas mixture.

8 2. Atmospheric-pressure plasma for medical applications
Figure 2.1: Experimental arrangement of the microwave plasma source.
Figure 2.2: Microwave plasma source operated in nitrogen-oxygen mixture for the production ofNO and ozone.

2.2. Non-thermal plasma sources 9
0 200 400 600 800 10000
500
1000
1500
2000
2500
3000 20 sccm O2
40 sccm O2
60 sccm O2N
O (p
pm)
N2 flow (sccm)
Figure 2.3: Concentration of nitric oxide (NO) in the effluent of the microwave plasma source forvarious flow rates of N2 and O2 in the working gas mixture.
0 200 400 600 800 10000
50
100
150
200
250
300
350
400
450 60 sccm O2
O3 (p
pm)
N2 flow (sccm)
Figure 2.4: Concentration of ozone (O3) in the effluent of the microwave plasma source for variousflow rates of N2 and 60 sccm O2 in the working gas mixture.

10 2. Atmospheric-pressure plasma for medical applications
2.3 Dielectric Barrier Discharges (DBDs)
2.3.1 Working principle
The electrical gas discharge developed due to high voltage in the gap between the electrodeswith at least one of them covered with a dielectric is called the dielectric barrier discharge[40]. At high pressures, the plasma is characterized with high electron density resulting inthe formation of arcs. Such plasmas are termed as thermal plasmas. In order to reduce highcurrent and the subsequent arc formation, one or both of the DBD electrodes are coveredwith a barrier material such as a dielectric, and hence the term dielectric barrier discharge.The DBD is a highly transient, low-temperature non-equilibrium discharge. The high energyelectrons are effective in the generation of active species and radicals.
When a high voltage is applied to the electrodes and the planar distance d between theelectrodes is filled with a gas of density N (dependent on pressure and temperature), break-down is induced once the field inside the gap exceeds the corresponding reduced electric field(E/N in Td). E/N is obtained by dividing the electric field by the product N × d which isexpressed in Townsend-Td (1 Td = 10−17 V cm2).
DBDs are operated in a broad range of pressures and are generally used in ozone genera-tors, UV sources and excimer lamps, and for polymer treatment, pollution control, exhaustcleaning, plasma-assisted combustion, etc. A wide range of applications of DBD character-ized with different electrode configurations are reported in references [41] and [42].
Different configurations of the DBD [43] are possible and some of them are shown infigure 2.5. The dielectric acts as the barrier which limits current flow and prevents formationof sparks, so that non-thermal discharges are formed. When such an arrangement is operatedat atmospheric-pressure, it becomes suitable for the treatment of sensitive substrates like theliving tissues without causing thermal damage.
When a DBD is operated at elevated pressures (above 0.1 bar), the discharge splits intonumerous microdischarges which are temporally and spatially distributed in the dischargegap (figure 2.6) or over the discharge area. The microdischarges occur as discharge columnsin the discharge gap which also substantially spread over the dielectric surface. The chargecarriers deposited on the surface of the dielectric reduce the field strength in the dischargegap and extinguish the discharge itself.
The discharge that fills the gap between the electrodes is called the volume discharge(VD) while the discharge that forms on the dielectric surface is called the surface discharge(SD). Examples of volume discharge and surface discharge are represented in figure 2.6 andfigure 2.7, respectively. The light intensity on the surface of the dielectric is due to the dis-charge that is formed on its surface. Surface discharges are characterized by high electricfield when compared to the microdischarges occurring in the volume discharge [44].

2.3. Dielectric Barrier Discharges (DBDs) 11
Figure 2.5: Common configurations of DBD [43].
2.3.2 Operating modes of a DBD and their transitions
The volume discharge of a DBD can be either a filamentary discharge (characterized bymicrodischarges), a diffuse discharge or evenly patterned [43]. A homogeneous or a uniformdischarge, free of microdischarges is more suitable for surface treatments where uniformityis the key aspect. In low-pressure conditions, obtaining such a homogeneous discharge is notcomplicated. However, such a discharge in air at atmospheric-pressure condition is not simple.
Depending on the frequency of the applied voltage, type of dielectric, working gas, etc.,DBDs which produce homogeneous volume discharge have been demonstrated. Such ho-mogenous DBDs at atmospheric-pressure, referred as Atmospheric-Pressure Glow Discharge(APGD), have been achieved using He [45], He-N2 gas mixture [46], N2 [47, 48], Ne-N2 andAr-N2 [49], Ar [50], etc.
APGD allows for more uniform treatment of the substrate. Similar to low-pressure dis-charges, APGDs are characterized by strong light emission near the cathode. In contrast,APGDs are even produced without dielectric barrier [51] in He-O2 mixture using unipolarvoltage pulses up to 4 kV at 0.01 kHz-20 kHz with a pulse width of 360 ns.
In order to obtain a uniform discharge, the factors that cause instabilities and therebyinfluence the formation of a non-uniform discharge have to be identified. By controlling theseparameters, the physical processes and chemical kinetics can be altered to produce a uniformdischarge. Several investigators have identified diverse factors that influence the transition ofone mode of discharge to another in a DBD. A few of such transitions are discussed below.

12 2. Atmospheric-pressure plasma for medical applications
Figure 2.6: Discharge in the gap between a high-voltage copper electrode covered with dielectric(ceramic) and a grounded counter-electrode (aluminium).
Figure 2.7: Formation of discharge on the surface of ceramic (the dielectric covering a high-voltagecopper electrode) induced by a grounded tungsten wire touching it.

2.3. Dielectric Barrier Discharges (DBDs) 13
The transition from glow discharge to a streamer discharge is observed in N2 when thepositive ions do not have enough time to reach the cathode for secondary emission ratherthey induce photoemission or photo-ionization resulting in the generation of seed electrons.These seed electrons lead to a streamer discharge and not a filamentary discharge composedof independent streamers [48].
Ionization due to Penning effect transforms a glow discharge into a filamentary discharge.During Penning ionization, N2 metastable collisions result in seed electrons which can initiatesmall avalanches in a low electric field, thus forming a glow discharge. If N2(A) is quenchedeffectively, may be due to oxygen atoms etched from alumina by the high power, the forma-tion of glow discharge is prevented and the discharge turns filamentary [4].
A substantial increase in the surface charge of the dielectric supports transition of a fil-amentary discharge to a glow mode. Radially expanding streamers provide the space chargenecessary for stabilization of the plasma in the diffuse mode. These streamers are responsiblefor diffuse breakdowns, and overlapping of numerous such breakdowns results in a glow mode[52].
On the other hand, several other means have been proposed to achieve a homogeneousDBD such as pre-ionization of the discharge gap [53], varying voltage characteristics in orderto produce discharges with duration shorter than the gas heating time that cause instabilitieswhich results in the formation of microdischarges, etc.
2.3.3 Medical applications of DBDs
Among the different configurations of plasma sources designed for medical applications in-cluding the glow discharges and plasma jets, DBDs are gaining importance since they canignite plasma directly on the body surface which is at floating potential. Other devices suchas the Plason offer the so-called indirect treatment where the plasma is generated at a remotepoint, and the chemically-active species are transported to the proximity of treated-substrate.Most of the active species are lost during transport due to chemical and physical processeslike electron-ion recombination in the effluent. This disadvantage is overcome in the directtreatment using DBDs.
One of the main issues when employing DBDs for medical application is their inhomo-geneity when operated in air at atmospheric-pressure due to the formation of microdischargesthat are spatially and temporally distributed in the discharge gap. This phenomenon couldattribute to non-uniform treatment of the substrate. To overcome this, DBD operated us-ing a nanosecond pulsed power supply has been shown to produce a homogeneous discharge[30, 54] which could offer more uniform treatment of the substrate in bio-medical applications.
The mean electron energy in the microdischarge channel is high enough to initiate plasmachemical processes and thereby result in the production of numerous active species namelyatoms, molecules, radicals, etc., and UV-photons that are useful for medical treatment. DBDin air is a source of molecules like nitrogen oxides and ozone. These molecules are producedwhenever required and directly on the body surface making it more advantageous and safer

14 2. Atmospheric-pressure plasma for medical applications
than conventional use of, for example, nitric oxide from gas cylinders which pose serioussafety issues during storage.
The bactericidal and viricidal effect of ozone can be exploited by using the air-DBD fordisinfection of skin surface without damaging the healthy tissues. By reducing the bacterialload at the wounded site, ozone also can support wound healing processes. The use of exoge-nous ozone for skin treatment is not much realized due to other effects such as respiratoryproblems.
Some of the most notable atmospheric-pressure plasma devices based on the DBD prin-ciple are briefly described below.
Plasma pencil
‘Plasma pencil’ was developed by the group of M. Laroussi (Old Dominion University, Nor-folk, USA) [23] which is based on the DBD working-principle. The device is described to besafer and more reliable than the plasma needle [22] based on two aspects namely,i) plasma pencil does not comprise of sharp parts like the tungsten pin in the plasma needle,andii) sub-microsecond pulses used in the plasma pencil reduces risk of arcing and device heatingduring prolonged treatments.
The plasma pencil comprises of a 2.5 cm diameter hollow dielectric cylinder with twocentrally-perforated glass disks separated by a gap of 0.5-1 cm. Copper rings are embed-ded in the glass disks and are connected to a high voltage power supply of 6 kV. Unipolarnanosecond-square high voltage pulse at 3 kHz frequency is applied. The plasma is obtainedas a plume through the perforation. Helium or oxygen is used as the working gas. The gastemperature obtained in this working condition is about 290 K and the plasma plume ap-pears safe to touch.
V-I characteristics of the plasma pencil show three discharge pulses for each voltage pulse:the first one due to the discharge ignition [55], the second due to the launching of the plasmaplume and the third due to charging of the dielectric. A streamer propagation model basedon photo-ionization was proposed which explains the mechanism of plume travel under lowelectric field conditions. The formation of so-called ‘plasma bullets’ in the plume was laterreported [56].
The bacterial inactivation efficiency of the plasma pencil was tested using E. coli in agar[57]. Plasma was generated in helium and also using 0.75% O2 as admixture. It was concludedthat oxygen-based reactive species’ play an important role in inactivation of the bacteria.
Floating electrode-Dielectric barrier discharge (FE-DBD)
The floating electrode-dielectric barrier discharge (FE-DBD) comprises of an electrode cov-ered with a dielectric like quartz or ceramic. It was reported by the group of A. Fridmanfrom Drexel University (Philadelphia, USA) [7]. The device is operated at high voltage (upto 10 kV) and 10-30 kHz frequencies. The plasma power is maintained within 1 W cm−2.

2.4. Other atmospheric-pressure plasma sources for medical applications 15
Plasma treatment using the device promotes blood coagulation with simultaneous tissuesterilization for treatment of surface wounds [7]. In vitro, blood treated for 15 s coagulatescompletely in 2 min while the untreated blood coagulates in 13 min. Blood oozing fromhuman spleen (ex vivo) coagulated rapidly after 15 s of plasma treatment. Plasma treatmentfor 15 s at 0.8 W cm−2 stops bleeding in a live animal (mouse).
FE-DBD treatment kills melanoma cancer cells through necrosis in 15 s at a plasmapower of 1.4 W cm−2, while at low doses (0.8 W cm−2) necrosis was absent but apopto-sis was observed after about 5 sec treatment [24]. Staphylococci, Streptococci and Candidaspecies of yeast from skin samples were plasma treated in vivo for 15 s which resulted in areduction of colony forming units per milliliter from an initial value of 109 before treatmentto a final value of 4 ± 4 [58].
UV radiation is accounted as one of the most important factors for sterilization duringplasma treatment. Skin toxicity trials were conducted using pigs and SKH1 hairless mice.After a sequence of experiments [59], 10 min treatment at 0.6 W cm−2 was concluded as themaximum acceptable dose for a prolonged treatment, while 40 sec treatment at 2.3 W cm−2
was the maximum acceptable for a high power treatment. Plasma treatment of cadaver skinfor up to 5 min did not show any histological changes or damages which implies that thesource produced no lethal effects on the living cells.
A homogeneous DBD [30] was produced using a ‘spark gap’ arrangement and nanosecondpulsed supply of 15-27 kV. The bacterial inactivation efficiency of the nanosecond pulsedDBD (operated at 13 kV, 120 Hz, a rise/fall time of 3 kV per nanosecond) was higher thanthat of the microsecond-pulsed DBD (operated at the same frequency, 10 kV supply, 20 Vper nanosecond rise time). The former offered a more uniform treatment compared to thelatter [54].
2.4 Other atmospheric-pressure plasma sources for medicalapplications
KinPen and Hairline plasma
Other recent atmospheric-pressure non-thermal plasmas for medical application include the‘KinPen’ [60] and hairline plasma [61] from the group of K.-D. Weltmann (INP, Greifswald).The KinPen is an atmospheric-pressure plasma jet (APPJ) operated at 2-6 kV peak to peakand 1.1 MHz frequency. The plasma temperature is around 48 ◦C. UV emission, the produc-tion of radicals, and results of biological tests after plasma treatment are reported [60]. Theproduction of ozone (0.1-0.3 ppm) was estimated to be within the safe limits.
On the other hand, the hairline plasma is a negative DC-corona discharge which producesa plasma filament of 30 µm diameter and a length of up to 1.5 cm. Such source could beuseful for the treatment of cavities, for example, in dentistry.

16 2. Atmospheric-pressure plasma for medical applications
Array of DBD jets
A scalable DBD jet [62] and 2-D jet array [63] are reported by the group of M. G. Kong(Loughborough University, UK). The 2-D cold atmospheric plasma (CAP) jet array for med-ical treatment of a large area has been studied. There are seven jets totally in the array; oneat the center and six surrounding it. First investigations have shown that there is excellentuniformity in the reaction chemistry delivered by the individual jets, which open opportuni-ties to build array-like devices for uniform treatment of the substrate.
Several other research groups have developed non-thermal plasma devices which aresources of specific active species. Such devices are necessary to investigate the selectiveeffects of plasma-produced active species on cell processes. Few of them are discussed below.
Microhollow cathode sustained discharge: Source of singlet delta oxygen - O2(a1∆g)
Singlet delta oxygen has been successfully produced in a microhollow cathode sustaineddischarge (MHSD) arrangement [64] which comprises of micro hollow cathode discharge(MHCD) [65] and an electrode placed 8 mm away from the MHCD. The MHCD itself com-prises of a pair of molybdenum electrodes separated using alumina plate, and a hole ofabout 800 µm is drilled through this sandwich. One of the electrode is connected with nega-tive power supply while the other is grounded. The electrode which is placed 8 mm away fromthe MHCD is positively biased. He/O2/NO gas mixture is used to produce the single deltaoxygen excited molecules. For 2000-30,000 sccm of He flow, the density of O2(a
1∆g) obtainedis greater than 1016 cm−3 and has been transported for tens of centimeters. This device, ar-ranged in the form of an array, has been studied for the oxidation of a DNA-constituentnamely 2’-deoxyguanosine (dGuo) [66].
Micro-scaled atmospheric-pressure plasma jet: Source of oxygen atoms
A micro-scaled atmospheric-pressure plasma jet (µ-APPJ)(figure 2.8) is a simplified config-uration, which comprises of two stainless-steel electrodes which are 1 mm apart, has beenreported as a source for oxygen atoms [67, 68]. µ-APPJ source is operated in He with anadmixture of a molecular component such as oxygen.
For oxygen admixture in helium, this source compared to other low temperature atmospheric-pressure devices is extremely well characterized with information on the absolute densitiesand fluxes of e.g. atomic oxygen, ozone and VUV, and UV radiation down to 115 nm. Atomicoxygen distribution is measured with Two-Photon Absorption Laser-induced Fluorescencespectroscopy (TALIF) [69].
2.5 Conclusion
Though numerous non-thermal atmospheric-pressure plasma sources are reported, the opti-mization of each of the sources for specific medical application is possible only by understand-ing the mechanisms or modes of interactions between the plasma-generated active speciesand the cell components. To understand the interactions between the plasma and the cell at

2.5. Conclusion 17
Figure 2.8: µ-APPJ operated in helium-oxygen mixture for the production of oxygen atoms.
sub-micron level, it is necessary to first quantify the chemically-active species that could pos-sibly reach and interact with cell biology. For this, the concentration of the chemically-activespecies produced in the active plasma zone has to be ascertained. This requires the modelingof the chemical kinetics and determination of plasma parameters like the electron density,electron distribution function and gas temperature which influence the chemical kinetics. Ina nut shell, the plasma intended for medical application has to be characterized in order tooptimize it for any specific medical application.


19
3. Experiment and numerical simulation
The DBD device investigated towards medical applications, the counter electrodes, the ex-perimental methods and numerical simulation employed for the purpose of plasma charac-terization are described in this chapter.
3.1 Plasma Stick
‘Plasma Stick’ is similar to the FE-DBD [7] in terms of the working principle. The plasmastick comprises of only one electrode covered with a dielectric. Figure 3.1 shows a hand-heldbattery-operated model of the plasma stick igniting barrier discharge on the human body.The aim of this study is to characterize the plasma conditions in the barrier discharge inorder to optimize the device for treatment of external wounds and skin diseases, and fordisinfection of the skin surface .
Figure 3.1: Snap shot of Plasma stick in use.
3.2 Experimental arrangement
In order to investigate the discharge conditions of the plasma stick for medical application,a laboratory arrangement of the device is designed. This DBD arrangement comprises of aring-shaped copper electrode of diameter 8 mm. The electrode is covered with a thin layer ofceramic (alumina) of about 1 mm thickness. A sketch of the DBD experimental arrangement

20 3. Experiment and numerical simulation
Figure 3.2: The DBD experimental device.
is shown in figure 3.2. In principle, the ceramic-covered electrode (here onwards referredas DBD electrode) ignites plasma on objects of high capacitance like the human body (asshown in figure 3.3) and with electrodes that are grounded. When the applied voltage is highenough to satisfy the breakdown conditions in the air gap, plasma is ignited.
In addition, this setup facilitates the use of different grounded electrodes for investigationof different discharges and characterization of the corresponding plasma conditions by opticaldiagnostic methods. The counter electrode is usually placed on a platform and grounded.The DBD electrode is mounted on a vertically-movable head of the setup which helps toraise and lower the DBD electrode with respect to the grounded electrode. Precise inter-electrode distances with an accuracy of 0.1 mm are achieved using a gap-adjusting screwand a micrometer. The discharge is characterized for different inter-electrode distances (d inmm). The high-voltage applied on the DBD electrode is measured from a pin which is fusedto it.
3.3 Pulsed power supply
In order to treat sensitive substrates like living tissues, the plasma should be non-thermal.In case of direct plasma treatment, the effective power must be limited to produce a non-thermal plasma. This can be achieved in several ways and one among them is to apply short

3.4. Aspects of barrier discharge on human body 21
Figure 3.3: DBD device igniting plasma on finger.
voltage-pulses.
A certain amplitude of voltage is necessary to ignite plasma in air between the electrodes.It is sufficient to apply this high voltage intermittently. This is achieved using a high-voltagepulsed power supply with frequencies from several kHz to few GHz with amplitudes highenough to ignite the plasma. The rise and fall time of the high-voltage pulse is observedto influence the homogeneity of the discharge [54] and should be considered as one of theimportant parameters while designing power supplies for non-thermal plasma sources.
Accordingly, the studied DBD device is energized by a pulsed power supply of 300 Hztrigger frequency. Each trigger pulse initiates a sequence of high-voltage pulses with dampedoscillations. The frequency of the pulses within the sequence is about 100 kHz as shown infigure 3.4. The maximum amplitude of the pulsed power supply is about -13 kV.
3.4 Aspects of barrier discharge on human body
The DBD device is aimed for medical applications in dermatology. When the human body istreated, it acts as the counter electrode for the device to ignite plasma in the discharge gap.Characterization of the plasma produced on the human body becomes important in order tooptimize the DBD device for medical use. The properties of the counter electrode, in this casethe human body, will potentially influence ignition of plasma as well as the plasma conditions.

22 3. Experiment and numerical simulation
0.0 2.0x10⁻³ 4.0x10⁻³ 6.0x10⁻³ 8.0x10⁻³-15
-10
-5
0
5
Volta
ge (k
V)
Time (sec)
(a)
5.0x10⁻⁵ 1.0x10⁻⁴ 1.5x10⁻⁴ 2.0x10⁻⁴ 2.5x10⁻⁴-15
-10
-5
0
5
10
Volta
ge (k
V)
Time (sec)
Figure 3.4: High-voltage pulse in sequential profile with damped oscillations.

3.5. Counter electrodes for discharge characterization 23
The human body itself can be considered as a ‘complex’ system. The skin properties suchas roughness, moisture content, etc. vary with age, medication, hormonal changes, diet ofthe individual, and also due to many other external factors like climate, skin care, etc. Skinwhich is diseased or which suffers from deficiency has properties different from that of a nor-mal healthy skin. Skin properties vary among different skin types and also among differentparts of the body within the same individual. These factors alter the electrical properties(electric conductivity, capacitance, etc.) of the skin and potentially influence the formationand properties of the discharge.
Prior to optimizing this DBD device for direct medical-application on human body,counter electrodes of known properties are used to identify their influence on dischargeproperties. Accordingly, electrodes of different materials with simple geometry are used asgrounded counter-electrodes for plasma ignition and then the discharge conditions are char-acterized.
3.5 Counter electrodes for discharge characterization
In this work, simple electrodes of different conductivity namely metal (aluminium), liquids(water, salt solution) and dielectric (glass) are used as individual grounded electrode. In aspecial case, a counter electrode in the form of spike is used in a point-to-plane electrodearrangement and the discharge obtained is characterized. Plasma produced using each ofthese simple electrodes is characterized individually to understand the influence of substrateparameters such as its profile and conductivity on the discharge formation.
Lastly, a small animal is also used for discharge characterization. The skin of anaes-thetized mouse in vivo is subjected to plasma treatment using the DBD device and thedischarge obtained is characterized.
3.6 Plasma diagnostics
3.6.1 Optical Emission Spectroscopy (OES)
Optical diagnostics of the plasma is performed using a broad-range Echelle spectrometer(ESA 3000r from LLA Instruments, Germany) and a grating spectrometer (QE65000r fromOcean Optics, USA). The spectrometers are relatively and absolutely calibrated using atungsten-ribbon lamp source and the known molecular emission of nitrogen and nitric oxide[70].
Echelle spectrometer
The Echelle spectrometer comprises of a diffraction grating and a prism for diffraction andrefraction of incident light. The Echelle spectrometer has a spectral resolution of R=13333which corresponds to the full width at half maximum of the apparatus function of 0.015-0.06 nm in the range of 200-800 nm. Simultaneous detection of the entire wavelength range

24 3. Experiment and numerical simulation
permits optimal selection of spectral lines according to the application. The detector is anintensified charge coupled device (ICCD) camera. The echelle grating of the spectrometerhas a groove density of 75 grooves per mm. In such a spectrometer, the entire wavelengthrange is displayed in more than 100 spectral orders (from 30th to 130th) of the echelle grating.
The spatial resolution of the spectrometer with optic fiber is about 1 mm (which cor-responds to the minimum separation between two observable adjacent-points). Acquisitiontime down to 20 ns is possible. High spectral resolution and simultaneous measurement ofspectra over a broad range make this spectrometer suitable for plasma diagnostics especiallyin molecular gases where the population of excited states and rotational distribution of themeasured spectra contain information on the plasma processes.
Ocean Optics spectrometer
The grating spectrometer (Ocean Optics QE65000) has a spectral resolution of about 1.3nm and a spatial resolution of about 1 mm. The efficiency of the spectrometer in 200-800nm wavelength range is shown in figure 3.5. The detector of the spectrometer is cooled downto −15◦ C by a thermoelectric (TE) cooling system. This reduces noise and dark signal, andenables detection of low-light levels. This is complemented by the long integration time ofthe spectrometer from 8 ms to 15 minutes which facilitates detection of light levels that aretoo low as in the case of the plasma produced using the DBD device.
200 400 600 800 1000
0.0
2.0x10⁻⁶
4.0x10⁻⁶
6.0x10⁻⁶
8.0x10⁻⁶
1.0x10⁻⁵
1.2x10⁻⁵
1.4x10⁻⁵
1.6x10⁻⁵
Effic
ienc
y (c
ount
s pe
r ph
oton
)
Wavelength (nm)
Figure 3.5: Efficiency of the Ocean optics spectrometer in 200-800 wavelength range.
The photons from the plasma are observed by an optic fibre which is connected to thespectrometer. The optic fibre has an acceptance angle of 7◦. The angle dependance of opticfiber has a cosine profile. The photons incoming within this acceptance angle is observed by

3.6. Plasma diagnostics 25
the spectrometer. A diaphragm helps to improve spatial resolution of the optic fibre whichis screwed to the observing end of the fibre. When fitted, the distance between the entrancehole of the diaphragm and that of the optic fibre is 11 mm. The optic fibre is positionedbetween the electrodes to measure plasma emission in the experiments as shown in figure3.6.
Figure 3.6: Experimental setup for optical emission spectroscopy (OES) of the DBD.
3.6.2 Photomultiplier tube (PMT)
A photomultiplier tube (PMT) is a sensitive light-detector that multiplies the signal producedby incident light, in several dynode stages. This helps to detect single photon individuallyeven when the incident light is very low. A Hamamatsu R5108 PMT is employed for opticaldiagnostics of the discharge. The PMT has a wide photocathode, high infra-red sensitivityand 9 dynode stages. The device can be used as a near-infrared spectro-photometer or aRaman spectro-photometer and also for photo-luminescence measurement. The spectral re-sponse of the PMT is in the wavelength range of 400-1200 nm with a maximum response at800 nm (figure 3.7). The PMT, which is a side-on type, is positioned parallel to the DBDelectrodes as shown in figure 3.8. It is powered by a high-voltage supply and the currentsignals from the PMT are recorded using an oscilloscope.
The working principle of the PMT can be described as follows. When photons enter thePMT and reach its photocathode, electrons are ejected and are accelerated by the next dyn-ode stage. In this way, electrons are multiplied further by the subsequent dynode stages. Theelectrons reaching the anode of the PMT produce a current signal which is recorded by theoscilloscope. In the DBD, when breakdown in the air-gap occurs, free electrons are producedwhich are detected by the PMT. For every breakdown or ignition, the PMT signal shouldshow a peak. On the other hand, the number of breakdowns occurring within each triggerpulse of applied voltage can be determined from the current pulses measured using a currentmonitor. To be certain that each of these current pulse corresponds to a breakdown, theyare compared with the PMT signals. A one-to-one correspondence between the PMT signaland the current pulse is observed, which allows to determine the number of ignitions justfrom the current pulse measured by the current monitor.

26 3. Experiment and numerical simulation
Figure 3.7: Spectral response of the photomultiplier tube.
Figure 3.8: Arrangement of the photomultiplier tube (PMT) and DBD operated with aluminiumas counter electrode.

3.6. Plasma diagnostics 27
Figure 3.9: Schematic diagram of the experimental arrangement of DBD.
3.6.3 Current-Voltage measurements
The pulsed high voltage applied to the DBD electrode is measured using a capacitive voltage-divider with a dividing factor of 1:2000. The current flowing through the circuit is measuredusing a current monitor (Model: 2877, Pearson Electronics, USA) with 1V/1A output.Voltageand current traces are recorded using an oscilloscope (LeCroy 9450).
The schematic diagram of the experimental arrangement including the voltage dividerand the current monitor is presented as figure 3.9.
3.6.4 Microphotography
A high-speed sensitive camera (PCO Sensicam qe) is used for microphotography of the dis-charge in the small gap between the electrodes. The spatial resolution of the camera is 6.5 µm.Exposure time of the camera ranges from 500 ns (fast shutter) to 3600 s (long exposure). Thefast shutter mode allows for single and multiple exposures from 100 ns to 1 ms while the longexposure mode allows for 1 ms to 1000 s exposures. The binning option is useful to improvethe signal to noise ratio (SNR) and hence good quality imaging in low-light applications suchas the studied DBD device.
The number of pixels in the CCD is 1280 x 1024. There is a serial transfer of data betweenthe camera and the PCI-Board housed in the processor of a computer system. A fiber opticlink (FOL) is used for this serial data transfer. The CCD camera is cooled down to −12 ◦Cby the thermoelectric cooling system which comprises of a cooling fan. The cooling unit isconnected to the camera with a flexible hose.
To obtain images of the plasma produced in the small gap between the electrodes withgreater magnification, a zoom lens namely, Zoom-6000r (Model: 1-6232, Navitar Inc., USA)is coupled to the camera (figure 3.10). With the building block design offered by Navitar, azoom objective which can observe the small plasma volume from a shorter working distance

28 3. Experiment and numerical simulation
Figure 3.10: Experimental setup for microphotography of the DBD.
is possible. Zoom-6000r lens produces a magnification of 6.5 times and is equipped with a 3mm fine focus (FF) option. The fine focus option helps to achieve better depth of field. Thelens is fitted to a 1x standard adapter (of length 12.16 cm and diameter 4.06 cm) which inturn is connected to the camera via a C-mount coupler.
3.7 Numerical simulation
When experimental techniques become unsuitable for the study of plasma properties due totheir limitations including difficulty in accessing the plasma, insufficient sensitivity or timescale, cost and implementation problems, etc., simulation becomes more useful. In additionto experimental measurements, numerical simulation is used for plasma characterization.By adopting both the methods for plasma characterization, it is possible to rule out thelimitations of each of the methods when used individually. Numerical simulation is used inthis work for:
Determination of gas temperature
Numerical simulation is used to simulate the rotational distribution of nitrogen moleculesat atmospheric-pressure conditions. The rotational distribution of ground state nitrogenmolecules is sensitive to changes in gas temperature. Hence, by comparing the emissionsobserved in the experiment with the emissions simulated, the gas temperature in the activeplasma volume is determined.
Temporal behaviour of gas temperature in afterglow phase
The temporal behaviour of gas temperature in the afterglow phase of the discharge is alsodetermined using numerical simulation by solving the thermoconductivity equation numeri-cally in cylindrical symmetry. The spatial temperature profiles at different durations in theafterglow of the discharge is calculated. In this way, the heating of the substrate duringplasma treatment is studied.

3.7. Numerical simulation 29
Determination of EVDF
Furthermore, numerical simulation is used for the determination of electron distributionfunction and reduced electric field in the studied experimental conditions. For this, theBoltzmann equation is solved at atmospheric-pressure for a mixture of nitrogen and oxygenin ‘local approximation’ using the program called EEDF [71].
Determination of NO, ozone and UV-photon fluxes
The production of NO and ozone molecules in the active plasma volume and in the after-glow, and their loss are determined by simulating the chemical kinetics. Also, the spatialdiffusion of these molecules to the treated surface is simulated by solving the continuityequation combined with Fick’s law of diffusion. Flux of UV-photons during DBD treatmentis calculated using experimentally-measured spectrum and the irradiation of the treated sur-face is determined by numerical simulation.
A more detailed discussion of the numerical simulation pertaining to the studied DBD inair is presented in Chapter 4.

31
4. Discharge characterization
The plasma conditions in the dielectric barrier discharge are investigated through plasmacharacterization where the averaged plasma parameters namely electron density andelectron distribution function, and the averaged gas temperature in the activeplasma volume are determined [72].
Using these parameters, the rate constants for electron-impact physical processes such asionization, dissociation and excitation of gas molecules, and other chemical processes thattake place in the active plasma volume are determined. The chemical kinetics at the studiedexperimental conditions is simulated and the density of biologically-useful molecules such asnitric oxide and ozone, and their diffusion to the treated surface is determined.
4.1 Plasma parameters
4.1.1 Electron density
The electrons in the plasma are quickly influenced by the external electric-field due to theirsmall masses. In addition, they cannot transfer a large part of their kinetic energy to theheavy particles and hence, they possess higher average kinetic energy when compared withthe heavy particles. Electron-impact dissociation, excitation and ionization account for thepreliminary reactions in the hierarchy of chemical kinetics. Subsequently, the other chemicalprocesses between heavy particles are initiated. Since electron collisions play an importantrole in the plasma-chemical kinetics, it becomes necessary to determine the electron densityin the active plasma volume.
In this work, absolute electron density (electrons per unit volume) is determined usingoptical emission spectroscopy and numerical simulation for the discharge modes obtainedwith different counter electrodes in the DBD setup.
4.1.2 Electron distribution function
The probability distribution of electrons which possess enough energy to initiate differentphysical processes is given by the electron distribution function. It can be presented in twoforms namely, the electron energy distribution function (EEDF, fe(E)) and the electronvelocity distribution function (EVDF, fv(E)), which are normalized as shown in equation4.1 and equation 4.2, respectively. ∫
fe(E) dE = ne (4.1)

32 4. Discharge characterization
∫fv(E)
√E dE = 1, (4.2)
where,
E - kinetic energy of electrons (in eV), andne - electron density (in m−3)
In other words, EVDF can also be referred to the probability for an electron to havevelocity v given as a function of the kinetic energy E. Furthermore, rate constants of thephysical processes depend on the EVDF.
4.2 Gas temperature
The gas temperature in the plasma corresponds to the temperature of the heavy articlesnamely atoms or molecules while the electron temperatures reach much higher values. Whenthe difference between electron temperature and gas temperature is large (Te>Tn), theplasma is described as a non-thermal plasma. The gas temperature also describes the averagekinetic energy possessed by the heavy neutral particles.
At atmospheric-pressure conditions, the rotational relaxation of diatomic molecules, suchas N2, is effective and is in equilibrium with the translational distribution. Hence, the ro-tational temperature of the neutral diatomic molecule can be used to determine the gastemperature.
Since the DBD is working in ambient air (78 % N2 and 21 % O2), gas temperature in theplasma is determined from the rotational distribution of excited N2 state namely, N2(C). Therotational distribution is determined from the excitation emission of N2(C-B,0-0) under theassumption of direct electron-impact excitation, and the emission is measured using opticalemission spectroscopy.
4.3 Rate constants for physical and chemical processes
The number of elementary processes that take place in unit volume per unit time is definedas the reaction rate. For colliding partners A and B, the reaction rate (r) is calculated as theproduct of interaction frequency vA of partner A with partner B, and the number density ofpartner A, nA.
r = vA · nA (4.3)
vA is defined as v · λ, where v is the velocity of partner A and λ is its mean free path.
vA =v
λ(4.4)
The mean free path λ of partner A can be written as,

4.3. Rate constants for physical and chemical processes 33
λ =1
nB · σ, (4.5)
where σ is the elementary-process cross-section. This is an imaginary circular area aroundone of the partners, and when the centre of the other collision partner crosses this circulararea, the elementary reaction takes place. Substituting the expression for λ, in equation 4.4
vA = v · nB · σ (4.6)
This expression is averaged taking into account the velocity distribution function and thecross-section which depends on the velocity of the colliding partners.
vA = nB
∫f(v) · σ(v) · v dv =< σv > · nB (4.7)
Therefore, equation 4.3 gives
r = nA· < σv > · nB (4.8)
where < σv > is called the reaction rate constant k (in m3 s−1) for the elementary physicalprocess which is written as,
k =
∫f(v) · σ(v) dv (4.9)
Electron distribution function is approximately isotropic. In this case, distribution func-tion of absolute velocities (EVDF) can be received by integration of electron distributionfunction in velocity space. This integration gives the factor 4π. If EVDF is presented asa function in electron energy scale, then transformation of interval dv to dE gives the ad-ditional factor
√2E. The rate constant k is an integral factor which includes the velocity
distribution fv(E) of the collision partners and the energy-dependent reaction cross-section(σ in m2).
k = 4π√2
∫ ∞
0
fv(E)
√2eE
me
· σ(E) dE, (4.10)
where,
e - the elementary charge of electron (in C),
me - the mass of electron (in kg), and
E - the kinetic energy of electrons (in eV).

34 4. Discharge characterization
Figure 4.1: Emission spectrum of DBD in air at atmospheric-pressure.
4.4 Plasma characterization
4.4.1 Determination of averaged gas temperature
The emission spectrum of DBD in air (figure 4.1) shows ‘second positive system’ of neu-tral nitrogen molecule (N2(C
3Πg-B3Πu), 280-450 nm) and ‘first negative system’ of nitrogen
molecular ion (N+2 (B
2Σ+u -X
2Σ+g ), λ ∼ 390 nm) which are excited directly from the ground
state neutral nitrogen molecules by electron impact. γ-system of nitric oxide (NO(A2Σ+-X2Π)) observed in the UV-C region (λ < 280 nm) are excited from ground state nitric oxide.The density of this species in ground state is not known forehand and hence not availablefor plasma characterization.
The gas temperature (Tg in K) in the active plasma volume is determined by opticalemission spectroscopy and numerical simulation using the well-known emission spectrum ofnitrogen molecules. The equilibrium between rotational and translational degrees of free-dom for nitrogen molecule is assumed. This approximation is valid at atmospheric plasmaconditions. Gas temperature is determined from the rotational intensity distribution in the0-0 vibrational band of the neutral nitrogen molecule emission N2(C-B) (i.e second positivesystem).
Emission at 337.1 nm is compared with emission spectra simulated for various rotationaltemperatures with the same spectral resolution (λ=25 pm) of the Echelle spectrometer whichis used for optical emission spectroscopy (figure 4.2)
For determination of plasma parameters, photoemissions of neutral nitrogen moleculeN2(C-B,0-0) and ionized nitrogen molecule N+
2 (B-X,0-0) are used, under the assumption ofdirect excitation from ground state of neutral nitrogen molecule by electron-impact.
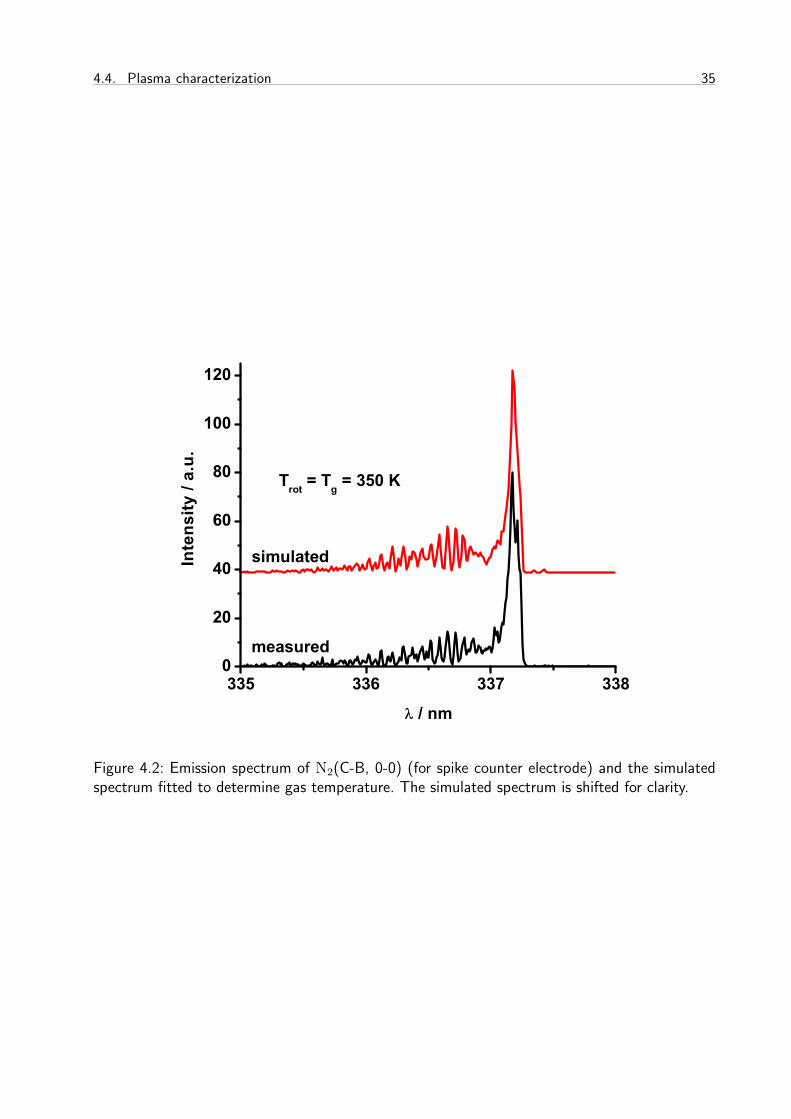
4.4. Plasma characterization 35
335 336 337 3380
20
40
60
80
100
120
measured
Inte
nsity
/ a.
u.
/ nm
Trot = Tg = 350 K
simulated
Figure 4.2: Emission spectrum of N2(C-B, 0-0) (for spike counter electrode) and the simulatedspectrum fitted to determine gas temperature. The simulated spectrum is shifted for clarity.

36 4. Discharge characterization
4.4.2 Determination of electron velocity distribution function
EVDF (in eV−32 ) is determined using experimental data and numerical simulation where
Boltzmann equation is solved numerically for conditions similar to that in the experiment.Interparticle collisions can instantaneously change the velocity of a particle. Hence, the col-lision term is added to the right hand side of the Boltzmann-equation which is written as:
∂f
∂t+ v · ∇rf − (
e
me
−→E ) · ∇v f =
∂f
∂t|collisions (4.11)
where,
e - elementary charge (in C),
me - electron mass (in kg), and
∇ - differential operator that denotes gradient in phase space
The solution to this equation is the Maxwell distribution function for electrons when idealgas condition, i.e. the occurrence of only elastic collisions, is considered. Maxwell distributionfunction can be determined using optical emission spectroscopy. But at atmospheric-pressureconditions in DBD, inelastic collisions between electrons and gas molecules are effective.Therefore, the distribution function for electrons differs strongly from the Maxwellian be-haviour. Hence, numerical simulation is used in addition to optical emission spectroscopy forthe determination of EVDF.
To simulate EVDF, Boltzmann equation is solved numerically in nitrogen/oxygen mix-ture (0.78 / 0.21) at atmospheric-pressure, in ‘local approximation’ for different values ofreduced electric field (E/N in Td) using a program called ‘EEDF’ developed by the group ofProf. A. P. Napartovich [71]. ‘Local approximation’ refers to the condition in which all theplasma-chemical processes are considered to depend on the same electron distribution func-tion. Hence, when solving the equation 4.11, the second term namely the spatial dependenceof fv(E) in the equation which is the scalar derivative of f in space co-ordinate, is neglected(c.f. equation 4.12).
∂f
∂t− (
e
me
−→E ) · ∇v f =
∂f
∂t|collisions (4.12)
Using the simulated EVDF, intensities of ionized nitrogen molecule IN+2 (B-X,0−0) at 391.4
nm and neutral nitrogen molecule IN2(C-B,0−0) at 337.1 nm are calculated, and the ratio ofthese emissions is determined as shown in equation 4.13.
IN+2 (B-X,0-0)
IN2(C-B,0-0)
=QN+
2 (B) · kN+2 (B) · ne · NN2
QN2(C) · kN2(C) · ne · NN2
(4.13)
where,

4.4. Plasma characterization 37
QN2(C), QN+2 (B) - quenching factor for corresponding nitrogen emission,
kN2(C), kN+2 (B) - the rate constants respectively for electron-impact excitation emission of
N2(C) and N+2 (B) (in m3 s−1),
ne - the electron density (in m−3), and
NN2 - the density of N2 molecules (in m−3) at gas temperature
The quenching factors in equation 4.13 are calculated from:
QN2(C) =A1
A1 + kN2(C)q1
[N2] + kN2(C)q2
[O2](4.14)
QN+2 (B) =
A2
A2 + kN+2 (B)
q3[N2] + kN
+2 (B)
q4[O2]
(4.15)
where,
A1, A2 - the Einstein coefficient (in s−1) for spontaneous transition of therespective excited states [73],
kN2(C)q1
, kN2(C)q2
- quenching (in m3 s−1) of N2(C) by N2 and O2 molecules,
respectively, [70]
kN+2 (B)
q3, kN
+2 (B)
q4- quenching (in m3 s−1) of N+
2 (B) by N2 and O2 molecules,
respectively [70]
The density of nitrogen and oxygen molecules at Tg is calculated using the ideal gas law:
p = NM · k · Tg (4.16)
where,
p - atmospheric pressure (in Pa),
NM - density of nitrogen molecules (or oxygen molecules) (in m−3) at 300 K, and
k - Boltzmann constant.
On the other hand, intensities of ionized nitrogen molecule IN+2 (B-X,0−0) at 391.4 nm and
neutral nitrogen molecule IN2(C-B,0−0) at 337.1 nm are determined by integrating the bandsin the corresponding wavelength range in the spectrum measured applying optical emissionspectroscopy. The ratio of ionized nitrogen molecular emission to neutral nitrogen molecularemission is determined for the experimentally-measured emissions. Finally, the ratio deter-mined from the experimental data is compared with the ratio of intensities calculated usingsimulated EVDF. From the agreement between the ratios, the averaged EVDF and E/N aredetermined for the studied DBD conditions.

38 4. Discharge characterization
4.4.3 Determination of rate constants
The rate constants for electron-impact dissociation of the gas molecules kdiss (and for excita-tion of their metastables kexc) are determined using the EVDF (fv(E))and the correspondingcross-section σ (in m2) as shown in equation 4.17:
kdiss =
∫ ∞
0
fv(E)
√2e
me
E · σdiss(E) dE, (4.17)
where,
e - the elementary charge of electron (in C),
me - the mass of electron (in kg), and
E - the kinetic energy of electrons (in eV).
fv(E) is normalized to fulfil equation 4.18:∫ ∞
0
fv(E)√E dE = 1 (4.18)
The rate constant for several physical processes such as electron-impact dissociation ofN2 and O2, and excitation of their metastables are also determined using the correspondingreaction cross-section in equation 4.17.
4.4.4 Determination of electron density
The electron density (ne in m−3) in the active plasma volume is determined using the pa-rameters determined above.
The intensities of excitation-emission of nitrogen molecules IN2 (in photons s−1m−3) andof nitrogen molecular ion IN+
2(in photons s−1m−3) are obtained by integrating the measured
spectrum in the corresponding wavelength range and are expressed, respectively, as equation4.19 and equation 4.20:
IN2 =
∫λIλdλ
G · ϵ(λ) · τ · f · Vp
= QN2(C) · NN2 · ne · kN2(C) (4.19)
IN+2=
∫λIλdλ
G · ϵ(λ) · τ · f · Vp
= QN+2 (B) · NN2 · ne · kN+
2 (B) (4.20)
where,
G - geometrical factor which is calculated as the ratio of area of entrance
hole of optic fiber to the area of the sphere with diameter equal to
the distance between the plasma and the optic fiber,
ϵ(λ) - efficiency of the spectrometer (in counts photon−1 nm−1),
τ - averaged duration of the discharge pulses (in s),
f - frequency of applied voltage (in Hz), and
Vp - plasma volume observed by the spectrometer (in m3)

4.4. Plasma characterization 39
Emission of neutral nitrogen molecule is used for the determination of the electron den-sity. Equation 4.19 is written as equation 4.21 for the determination of the averaged electrondensity in the active plasma volume.
ne =
∫λIλdλ
G · ϵ(λ) · τ · f · Vp ·QN2(C) · NN2 · kN2(C)
(4.21)
Using the plasma parameters and other measured parameters such as the duration ofcurrent pulse and number of ignitions, etc., the chemical kinetics in the active plasma volumeand in the afterglow are determined. Subsequently, the fluxes of NO and ozone reaching thetreated surface are determined.


41
5. Simulation of NO and ozone fluxes reachingthe DBD-treated surface
In this chapter, short notes on the significance of nitric oxide (NO) and ozone in physio-logical processes and the benefits of exogenous NO and ozone for medical applications arediscussed. Furthermore, the simulation of chemical kinetics and the determination of NOand ozone fluxes reaching the substrate during plasma treatment using experimental dataand simulation are presented.
5.1 Endogenous NO and ozone
Physiological NO, also called endogenous NO, is produced in the human body by several kindsof cells including the skin cells [74]. NO is described as the ‘signaling molecule’ [75] since itacts as a messenger facilitating cell to cell communication. NO is produced when arginine, anα-amino acid, is converted into citrulline by oxidation in the presence of NO synthase (NOS)enzyme [76]. NO can be generated from nitrite and nitrosothiols in an enzyme-independentmanner when irradiated with UVA or blue light or as a result of pH-dependent reduction[77, 78]. The physiological quantity of NO can be 100 ·10−12 mole (or below) up to ∼ 5 ·10−9
mole [79].
NO is significant for the vascular, nervous and immune systems of the human body. Itplays a vital role in relaxation of the smooth muscles, in controlling blood flow to specificvascular beds of the heart, to the lungs and the gastrointestinal tract [80, 81], in defensemechanisms to fight bacteria, viruses, parasites and fungi [82], in vasodilation and neuro-transmission, etc. NO is known to be involved in the regulation of proliferation and differ-entiation of human keratinocytes [83].
The availability of physiological NO in different concentrations in vivo and its diversifiedfunctions pose several advantages as well as disadvantages. For instance, NO can protect thebody from invading pathogens by acting as a cellular toxin; on the other hand, it exhibitscytostatic (suppressing cellular growth and multiplication) and cytotoxic effects on the bodycells [84, 85] . However, the cytotoxic effect is manipulated for treatment of cancerous cells[86, 87] which is regarded as a new approach in cancer therapy.
On the other hand, there is very little known about physiological ozone. It has beenreported that for the purpose of killing bacteria, the immune system of the human bodyproduces hydrogen peroxide and an additional molecular species during oxidation of waterby singlet oxygen molecule in the presence of an antibody as a catalyst. The additionalmolecular species produced is claimed to be ozone [88].

42 5. Simulation of NO and ozone fluxes reaching the DBD-treated surface
5.2 Exogenous NO and ozone: Short note on medical ap-plications
Skin abnormalities like psoriasis, disturbed wound healing or formation of skin tumor areassociated with an imbalance in the biosynthesis of NO [89, 90]. The availability of NOproduced outside the body (exogenous NO) could be of significance for therapy of theseabnormalities. Non-thermal plasma sources, like the DBD device, are potential means forproducing exogenous NO for medical use.
Gaseous NO at a concentration of 500 ppm generated by the air-plasma unit ‘Plason’(discussed in Chapter 2) has beneficial effect on the healing of skin wounds due to enhancedNO bio-availability for the tissues present in the wounded site [15]. Exogenous NO alsoshortened all the phases of the healing process of diabetic wounds [31] and stimulated thereparative wound process in the eyes [32].
More studies reveal that exogenous NO normalizes blood circulation, decreases inflam-mation, enhances phagocytosis and accelerates proliferation of fibroblasts [91]. Non-toxicexposure of primary human keratinocytes and skin endothelial cells to plasma-generated NOmodulates proliferation in these cells which proves that exogenous NO is biologically active[78].
In a similar manner, ozone is yet another compound that improves healing of wounds [92] andhas been reported as early as in 1940. Blood ozonation technique using soluble ozone gas hasbeen practiced for over 50 years [93]. Ozone is mostly administered for external applicationsin the form of ozonated water for dental treatments, ozonated oil for treating skin disor-ders [94], etc. Ozone therapy for cancer treatment has been reported by several investigators[95, 96] but most experiments were in vitro and hence similar effect in vivo is still in question.
Ozone helps the cells to release more oxygen at the tissue level which is then useful forthe oxidation of sugars. Insufficient oxidation of sugar can result in tumor formation. Ozonecauses dilation of the blood vessels and is therefore useful for treating circulatory disorders.
Ozone is a recognized ‘remover’ of bacteria, fungi and viruses and is used as an additionalmedical treatment in dermatology, stomatology, etc. Since gaseous ozone is harmful wheninhaled, it is not widely used for medical therapies. Over-exposure to ozone can harm thelungs and cause irritation in the respiratory system. Therefore, the production and use ofozone are regulated by strict exposure-limits. Unfortunately, therapeutic doses are usuallyhigher than this permissible limit.
This complexity can be overcome using plasma sources such as the DBD devices thatgenerate ozone close enough to the treated surface. Pulsed DBDs are better sources for ozoneproduction when compared to those operated in high-voltage AC for the same plasma power[97]. However, when produced within safe quantities that are still safe for the respiratorysystem, exogenous ozone can be made available for medical use such as treatment of skindiseases. The bactericidal and viricidal property of ozone can be used to reduce the bacterialload at the wounded site which could support faster healing processes.

5.3. Chemical kinetics in air DBD 43
5.3 Chemical kinetics in air DBD
Chemical processes in air-plasma are initiated by electron impact of N2 and O2 and disso-ciating them into atoms. Reactive nitrogen species (RNS) including nitrogen oxides (NO,N2O, NO2, NO3, N2O5), metastables of nitrogen and oxygen, reactive oxygen species (ROS)such as ozone are produced as a result of subsequent chemical processes in the active plasmavolume and in the afterglow.
Chemical kinetic model of atmospheric-pressure DBD in air consists of abundant reac-tions [98]. The relevant chemical processes taking place in air-DBD and their respective rateconstants are listed in table 5.1. Electron-impact excitation and dissociation of gas moleculesare determined using EVDF pertaining to the respective plasma condition.
For the experiments reported here, the reactions listed in table 5.1 concerning the produc-tion and destruction of NO and ozone molecules are considered for simulation of chemicalkinetics. Other reactions in which one or both of the reactants have small concentrationsare not taken into account for simulation. For instance, O1(D) atoms produced due to O2
dissociation [99] are quenched to O(3P) in a very short time of about 1.4 ns [100], and hencenot taken into account for simulation.
The temporal behaviour of the chemically-active species produced in the discharge, andthe fluxes of NO and ozone reaching the treated surface during plasma treatment are sim-ulated. To estimate the flux of active species reaching the surface of the opposite electrode,the gain and loss of active species due to their diffusion are calculated.

44 5. Simulation of NO and ozone fluxes reaching the DBD-treated surface
No. Reaction Rate constant Reference
(1) N2 + e → N+ N+ e Calculated using equation 4.10 -
(2) O2 + e → O+O+ e Calculated using equation 4.10 -
(3) N2 + e → N2(A) + e Calculated using equation 4.10 -
(4) O2 + e → O2(a1∆) + e Calculated using equation 4.10 -
(5) O2 + e → O2(b1Σ) + e Calculated using equation 4.10 -
(6) O + O +M → O2 +M 3.8× 10−42T−1exp(500/T )m6s−1 [101]
(7) O + O2 +O2 → O3 +O2 6.6× 10−43T 1.25m6 s−1 [102]
(8) N + N +M → N2 +M 8.3× 10−46exp(500/T )m6 s−1 [103]
(9) O + O2 +N2 → O3 +N2 5.6× 10−41T−2m6 s−1 [102]
(10) O + O3 → O2 +O2 1.9× 10⁻¹⁷exp(−2300/T )m3 s−1 [101, 103]
(11) O + NO+M → NO2 +M 9.1× 10−40T−1.6m6 s−1 [104]
(12) NO + N → N2 +O 1.8× 10⁻¹⁸T 0.5m3 s−1 [105]
(13) N + O2 → NO+O 1.1× 10⁻²⁰T exp(−3150/T )m3 s−1 [103]
(14) N + O3 → NO+O2 5× 10⁻¹⁸exp(−650/T )m3 s−1 [103]
(15) N + O+M → NO+M 1.8× 10−43T−0.5m6 s−1 [103]
(16) O3 +NO → NO2 +O2 9× 10⁻¹⁹exp(−1200/T )m3 s−1 [103]
(17) N2(A) + O2 → N2 +O+O 1.63× 10⁻¹⁸(T/300)−0.55m3 s−1 [106]
(18) N2(A) + O2 → N2 +O2 8.75× 10⁻¹⁹(T/300)0.55m3 s−1 [103]
(19) N2(A) + N → N2 +N 2.6× 10⁻¹⁸(T 0.5)m3 s−1 [44]
(20) N2(A) + NO → N2 +NO(A) 3.5× 10⁻¹⁸(T 0.5)m3 s−1 [107]
(21) N2(A) + N2(A) → N2(C) + N2 8.7× 10⁻¹²(T 0.5)m3 s−1 [98]
(22) O + O3 → O2(a1∆) + O2 6.3× 10⁻¹⁸exp(−2300/T )m3 s−1 [101, 103]
(23) O + O3 → O2(b1Σ) + O2 3.2× 10⁻¹⁸exp(−2300/T )m3 s−1 [101, 103]
Table 5.1: Physical and chemical processes included in the simulation of chemical kinetics andtheir respective rate constants

5.4. Simulation of fluxes of NO and ozone molecules 45
5.4 Simulation of fluxes of NO and ozone molecules
From the above discussion, it is clear that NO and ozone are of therapeutic value in der-matology. Hence, fluxes of these medically- and biologically-useful molecules that reach thetreated-surface during DBD treatment become important which are determined through sim-ulation.
For simulation of the NO and ozone fluxes, duration and volume of the discharge channel,gas temperature, averaged electron density, and rate constants for different electron-impactphysical processes and for chemical processes are used as input values. At boundary condi-tions (explained in subsection 5.6), it is assumed that the chemically-active species are lostto the surface of the electrodes and to the ambient air present outside the discharge gap.
In the studied DBD device, the trigger frequency of applied voltage is 300 Hz, and eachpulse initiates a sequence of high-voltage pulses with damped amplitude and frequency ofabout 100 kHz (figure 3.4). The number of current pulses observed for each trigger pulsevaries for different electrodes. Each microdischarge filament lasts about 10-20 ns.
During the time between applied voltage pulses (∼ 3 ms), charge of the dielectric becomeslow and does not influence ignition in the next pulse-sequence. The subsequent dischargesare ignited between charged surfaces in air gap and have significantly smaller amplitude andare excluded in the simulation.
5.5 Equations used in simulation
5.5.1 Continuity equation
The temporal behaviour of the chemically-active species produced in the discharge is givenby the equation of continuity (equation 5.1). Since the discharge channels are assumed to becylindrical, the continuity equation is solved in cylindrical symmetry:
∂NM
∂t+∇ · ΓM =
∑(kMN · NM · NN), (5.1)
where,
∇ - the differential operator,
ΓM - the flux of species M (in m−2 s−1),
NM and NN - densities (in m−3) of species M and N respectively, and
kMN - the rate constant (in m3 s−1) of the corresponding chemical processes.
Using Fick’s law of diffusion for the flux ΓM , equation (5.1) becomes:
∂NM
∂t−∇ · (D(T )∇NM) =
∑(kMN · NM · NN), (5.2)

46 5. Simulation of NO and ozone fluxes reaching the DBD-treated surface
where D(T ) (in m2 s−1) is the diffusion coefficient presented as,
D(T ) = D0(T/273)β, (5.3)
where D0 is the diffusion constant with a value of 0.28 × 10⁻⁴ m2 s−1 for oxygen atoms,0.29 × 10−4 m2 s−1 for nitrogen atoms, 0.182 × 10⁻⁴ m2 s−1 for nitrogen metastables andnitric oxide, and 0.170× 10⁻⁴ m2 s−1 for ozone [108, 109]. The parameter β in equation 5.3is 1.774 for diffusion of oxygen and nitrogen atoms, 1.724 for molecular nitrogen and nitricoxide, and 1.750 for ozone.
5.5.2 Equation of thermoconductivity
Since plasma heats the gas and the rate constants of the chemical processes are temperaturedependent, the equation of thermoconductivity (equation 5.4) derived from Fourier’s law issolved in the afterglow phase:
∂T
∂t= ∇ · (Λ(T )∇T ), (5.4)
where Λ(T ) (in m2 s−1) is the thermal diffusivity which is interpolated in equation (5.5) [110]:
Λ(T ) = 1.19 · 10−6T 2 + 7.76 · 10−4T − 0.1 (5.5)
The source term in this equation is replaced by initial condition in active plasma region(discussed in subsection 5.6) since heating takes place in a timescale of a few nanosecondsand the coefficient for heating term is not directly measurable, whereas thermal conductiv-ity has a timescale of micro-seconds (shown in figure 6.4). This is in accordance with thesimulation of temperature in the afterglow.
The flux ΓM,z(in m−2 s−1) of different active species reaching the electrode surface, i.e.in z-direction is calculated by evaluating equation 5.6 at the boundary:
ΓM,z = −D∂NM
∂z. (5.6)

5.6. Initial values and Boundary conditions 47
5.6 Initial values and Boundary conditions
Before ignition of the first discharge channel (at t = 0), excited atoms and metastables areabsent, and the ambient temperature T (in K) is room temperature. Hence, the initial valuesare:
NM(t=0) = 0 m−3,
T(t=0) = 293 K
At boundary conditions, it is assumed that the chemically-active species are lost to thesurface of the electrodes and to the ambient air in the sides of the microdischarge channel.T is set to room temperature at the boundaries,
NM|∂V = 0 m−3,
T |∂V = 293 K
During the formation of the discharge channel, the temperature in the active plasmavolume (Tg) is set to the respective value of the gas temperature determined by OES andnumerical simulation (as discussed Chapter 4).
5.7 Solving equations using Graphics Processing Unit (GPU)
The system of partial differential equations 5.1 and 5.2 is solved using finite differences withtime-steps of 5 × 10⁻¹¹ s to 5 × 10⁻⁸ s, and using 128 grid points in z-direction and 1792grid points in r-direction. Simulations are performed using a graphics processing unit (GPU).Parallelizing the calculations and running the code on a GPU decreases the run-time of asingle calculation by a factor of over 200 in comparison with a CPU, and thereby reducesthe simulation time from a couple of days to about 25 minutes.


49
6. Single-filamentary DBD mode
The DBD device is investigated for therapy of skin diseases and for disinfection of skin sur-face and wounds. In reality, when the DBD device is used close to the body surface, it couldencounter raised points like a hair shaft or some surface irregularities. In such events, theDBD ignites a filamentary discharge on the tip of the raised point due to the large electric-field at its sharp curvature.
In order to investigate the plasma conditions in such a filamentary discharge between theDBD electrode and the raised point, a spike is used as the counter electrode to mimic theraised point on the body surface. The discharge thus obtained is characterized to determinethe plasma parameters and to simulate the chemical kinetics that results in the productionof NO and ozone molecules.
In another study, water was used as the counter electrode since human skin contains largequantities of water. With water as grounded electrode, a stochastic-filamentary dischargewhich is spatially and temporally distributed in the discharge is observed. However, at aninter-electrode distance of 1.5 mm, formation of a single filamentary discharge is observedsimilar to that obtained with the spike. The formation of such a discharge with water couldprobably be also due to increased electric-field at the highest point of the water curvature.The plasma conditions are characterized and are compared with the filamentary dischargeobtained with spike as counter electrode [111].
6.1 Counter electrodes
6.1.1 Spike
The metallic spike used as counter electrode for the DBD device is made of aluminium. Itis held upright using a metal plate which is grounded and is positioned right beneath thecenter of the (circular) DBD electrode (figure 6.1 and figure 6.2).
6.1.2 Water
A cylindrical cavity of diameter = 20 mm and depth = 3 mm is carved out of an aluminiumplate. Distilled water is filled in it in such a way that water is slightly above the rim of thecavity, so that a curvature is obtained. The aluminium plate is grounded and the curvedsurface of water is exposed to the DBD electrode.

50 6. Single-filamentary DBD mode
Figure 6.1: Snapshot of DBD electrode and spike arrangement for investigation of filamentarydischarge on raised point.
6.2 Single-filamentary discharge mode
When a high voltage is applied to the DBD electrode, a filamentary mode of dischargeis ignited between the DBD electrode and tip of the Al-spike when breakdown conditionsare satisfied. The maximum inter-electrode distance (d in mm) for discharge ignition is 1.5mm. Discharge is ignited in a single filamentary mode between the DBD electrode and tipof the Al-spike when inter-electrode distance is between 0.4 and 1.5 mm. For d values lessthan 0.4 mm, stochastically distributed discharge channels are ignited on the tip of the spike.
The filamentary discharge is observed using the high-speed camera with 2 ms exposuretime (which is shorter than the duration of a single trigger pulse of about 3 ms). For everysequence of trigger pulse, only one microdischarge channel connects the DBD electrode andthe spike, as shown in figure 6.2. Hence, this discharge mode is named as single-filamentarydischarge mode. The diameter of the microdischarge is determined by microphotographyand amounts to 50 ± 5 µm.
In the case of water as the counter electrode, when d = 1.5 mm, a single-filamentarydischarge is observed for the same applied voltage (figure 6.3). For smaller inter-electrodedistances, a stochastically-distributed filamentary discharge is observed.
6.3 Determination of plasma conditions by discharge char-acterization
The (averaged) gas temperature (Tg in K) in the active plasma volume is determined byoptical emission spectroscopy and numerical simulation (as discussed in chapter 4). Tg in thesingle-filamentary mode for spike is 350±20 K and for water is 330±30 K. The applied poweris mainly dissipated in the heating of the electrodes for a short duration and Tg decreasesrapidly in the afterglow phase [44].

6.3. Determination of plasma conditions by discharge characterization 51
Figure 6.2: Inverse microphotograph showing single-filamentary discharge ignited between theDBD electrode and the spike as counter electrode at d = 1 mm.
Figure 6.3: Inverse microphotograph showing single-filamentary discharge ignited between theDBD electrode and water as counter electrode at d = 1.5 mm.

52 6. Single-filamentary DBD mode
-0.15 -0.10 -0.05 0.00 0.05 0.10 0.15
300
310
320
330
340
350
Tgin channel = 350K
4 s 20 s 100 s
T g (K)
Radius of electrode (mm)
Figure 6.4: Radial distribution of Tg in the afterglow phase of single-filamentary discharge withspike.
The spatial distribution of decay of gas temperature in the afterglow phase is simulatedusing equation 5.4. A diameter of 50 µm for the microdischarge, a feed gas temperature of293 K and Tg of 350 K are used. The simulated temporal and spatial dependence of Tg alongthe diameter of the DBD electrode is shown in figure 6.4.
The duration of the discharge and the number of ignitions per sequence of trigger pulseare necessary for the determination of electron density using equation 4.19. Plasma currentis measured using a current monitor and the applied voltage is measured using a capacitivevoltage divider. The current and voltage traces are recorded using an oscilloscope.
Plasma current comprises of both the displacement current and the discharge current.The averaged duration of the discharge channel is determined from full-width at half maxi-mum (FWHM) of the measured profile of plasma current . Accordingly, the duration of thedischarge pulse is 22.5± 1 ns for spike and 30± 2 ns for water.
Using the current-voltage traces, the number of current pulses or ignitions for each voltagepulse is determined. For this, only the first sequence of trigger pulse is taken into account. Theignition in the second and later sequence of trigger pulses occurs in the presence of remnantcharges from the previous ignition. These remnant charges contribute to different electric-field characteristics in the air gap between the electrodes. Only one ignition occurs for eachsequence with spike for all d values (figure 6.5) as well as for water at d = 1.5 mm (figure 6.6).
Reduced electric field (E/N in Td) for different inter-electrode distances is determined byoptical emission spectroscopy and numerical simulation. E/N is observed to vary inverselywith inter-electrode distance (figure 6.7); E/N = 430 Td for d = 0.4 mm, 400 Td for d =
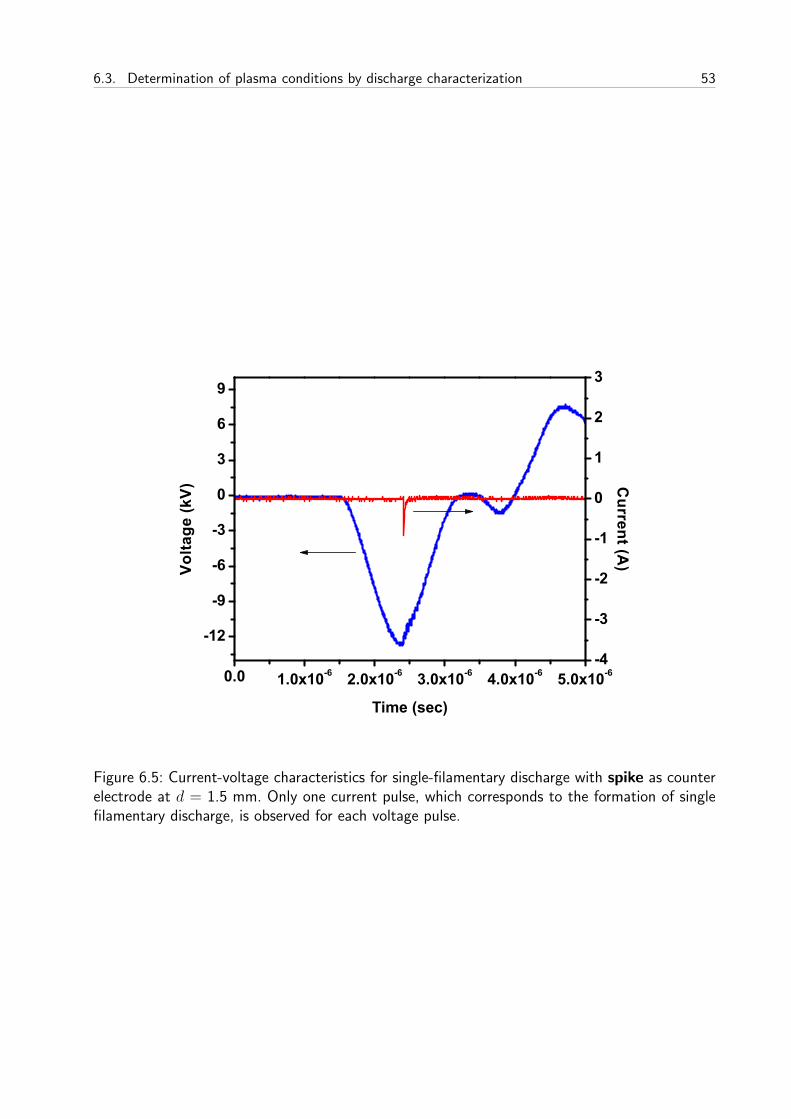
6.3. Determination of plasma conditions by discharge characterization 53
0.0 1.0x10⁻⁶ 2.0x10⁻⁶ 3.0x10⁻⁶ 4.0x10⁻⁶ 5.0x10⁻⁶
-12
-9
-6
-3
0
3
6
9
Time (sec)
Volta
ge (k
V)
-4
-3
-2
-1
0
1
2
3
Current (A
)
Figure 6.5: Current-voltage characteristics for single-filamentary discharge with spike as counterelectrode at d = 1.5 mm. Only one current pulse, which corresponds to the formation of singlefilamentary discharge, is observed for each voltage pulse.

54 6. Single-filamentary DBD mode
0.0 1.0x10⁻⁶ 2.0x10⁻⁶ 3.0x10⁻⁶ 4.0x10⁻⁶ 5.0x10⁻⁶
-12
-9
-6
-3
0
3
6
9
Time (sec)
Volta
ge (k
V)
-4
-3
-2
-1
0
1
2
3
Current (A
)
Figure 6.6: Current-voltage characteristics for single-filamentary discharge with water as counterelectrode at d = 1.5 mm. Only one current pulse, which corresponds to the formation of singlefilamentary discharge, is observed for each voltage pulse.
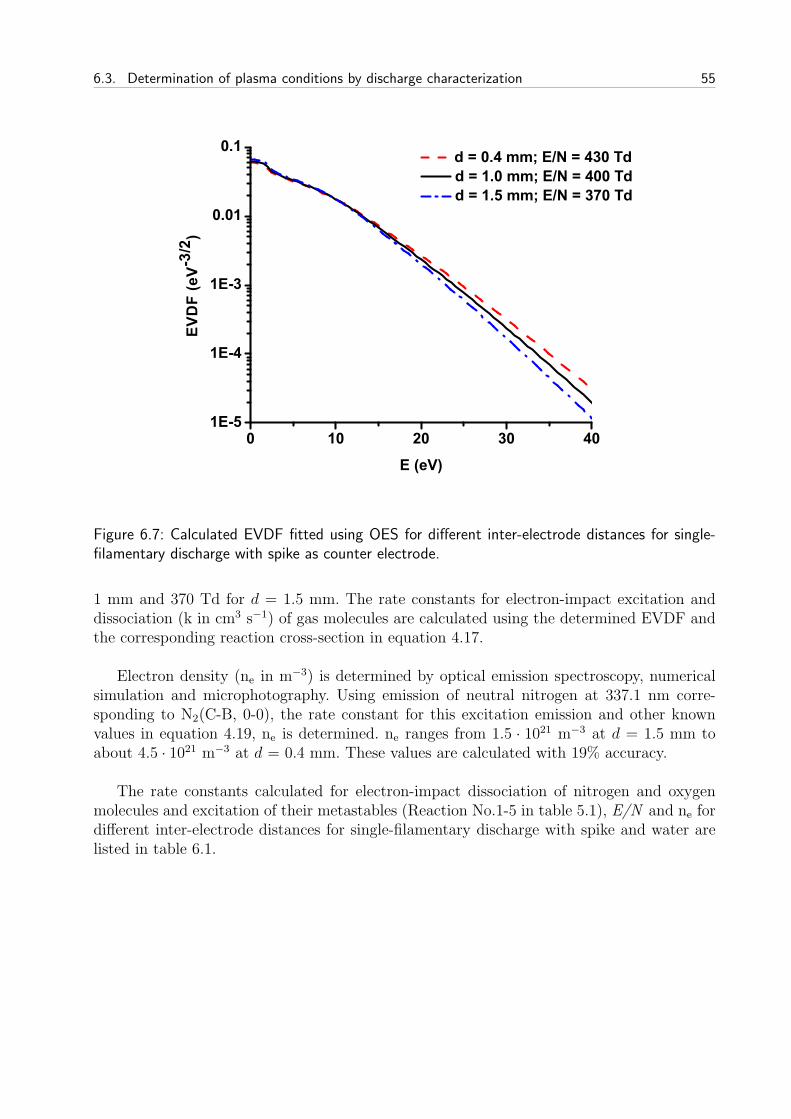
6.3. Determination of plasma conditions by discharge characterization 55
0 10 20 30 401E-5
1E-4
1E-3
0.01
0.1 d = 0.4 mm; E/N = 430 Td d = 1.0 mm; E/N = 400 Td d = 1.5 mm; E/N = 370 Td
EVD
F (e
V-3/2
)
E (eV)
Figure 6.7: Calculated EVDF fitted using OES for different inter-electrode distances for single-filamentary discharge with spike as counter electrode.
1 mm and 370 Td for d = 1.5 mm. The rate constants for electron-impact excitation anddissociation (k in cm3 s−1) of gas molecules are calculated using the determined EVDF andthe corresponding reaction cross-section in equation 4.17.
Electron density (ne in m−3) is determined by optical emission spectroscopy, numericalsimulation and microphotography. Using emission of neutral nitrogen at 337.1 nm corre-sponding to N2(C-B, 0-0), the rate constant for this excitation emission and other knownvalues in equation 4.19, ne is determined. ne ranges from 1.5 · 1021 m−3 at d = 1.5 mm toabout 4.5 · 1021 m−3 at d = 0.4 mm. These values are calculated with 19% accuracy.
The rate constants calculated for electron-impact dissociation of nitrogen and oxygenmolecules and excitation of their metastables (Reaction No.1-5 in table 5.1), E/N and ne fordifferent inter-electrode distances for single-filamentary discharge with spike and water arelisted in table 6.1.

56 6. Single-filamentary DBD mode
Counterelectro
de
dE/N
ne
kdiss.N
2kdiss.O
2kexc.N
2(A
3Σ
+ u)
kexc.O
2(a
1∆)
kexc.O
2(b
1Σ)
mm
Td
1021m
−3
10−15m
3s−
1
Spike
0.40
430
4.51
5.64
11.67
1.09
0.948
0.225
0.50
430
4.17
5.46
11.45
1.07
0.947
0.225
0.75
410
3.20
5.04
11.05
1.03
0.944
0.224
1.00
400
2.37
4.93
10.92
1.02
0.943
0.223
1.25
390
1.78
4.58
10.51
0.99
0.940
0.222
1.50
370
1.57
4.28
10.04
0.85
0.936
0.221
Water
1.50
330
1.31
3.37
8.95
0.846
0.921
0.217
Table6.1:
Reduced
electricfield(E
/N),electron
density(n
e)andrate
constantsforelectron-impact
dissociation(k
diss)of
nitrogen
andoxygen
molecules
andexcitation
(kex
c)of
theirmetastables
atdifferentinter-electrode
distances(d)forsingle-filamentary
DBD
mode
withspikeand
water
ascoun
terelectrodes.

6.4. Fluxes of NO and ozone reaching the treated surface 57
-5.0 -2.5 0.0 2.5 5.01E15
1E16
1E17
1E18
1E19
1E20D
ensi
ty o
f NO
(m-3
)
Radius of electrode (mm)
after 1st pulse after 5th pulse after 10th pulse after 15th pulse
Figure 6.8: Spatial distribution of NO in radial direction in afterglow at d = 1.5 mm
6.4 Fluxes of NO and ozone reaching the treated surface
The chemical kinetics in the single-filamentary discharge is simulated taking into accountthe physical processes such as electron-impact excitation and dissociation of gas moleculesand other subsequent chemical processes which are listed in table 5.1. Equation 5.1 is solvedfor the chemically-active molecules such as NO and ozone that are produced and lost in theactive plasma volume and in the afterglow.
Fluxes of plasma-generated chemically-active molecules namely NO and ozone, and UV-photons reaching the surface of the counter electrode during plasma treatment are simulated(discussed in Chapter 5). Simulation is performed until a consistent particle density (alsocalled the steady-state density) is attained, periodically, in successive ignitions (figure 6.8).Accordingly, a consistent value is obtained after about 10 ignitions. However, to attain ac-curate values, the simulation is set to terminate after 15 ignitions .
Fluxes of NO and ozone can be effectively used for supporting healing of wounds. In NOtherapy using the air-plasma source ‘Plason’, NO flux of 500 ppm improved healing of skinwounds [15]. To compare the applications of DBD operated in single-filamentary mode withsuch sources, the relative fluxes (Γrel in parts per billion) of NO and ozone are calculatedusing:
Γrel =4Γz · 109
NM · vmean
(6.1)

58 6. Single-filamentary DBD mode
where,
Γz - flux (in m−2 s−1) of NO and ozone reaching the treated surface
determined using equation 5.6
vmean - mean velocity (in m s−1)
NM - density of nitrogen and oxygen molecules (in m−3) at 293 K.
The absolute fluxes of NO and ozone determined for the single-filamentary discharge withspike and water are shown, respectively, in figure 6.9 and figure 6.10. From these figures, it isclear that the highest density of NO and ozone is obtained only for a small area of the treatedsurface close to the center of the electrode. Hence, the highest fluxes are also obtained closeto vertical axis through the DBD-electrode which gradually decay when moving from thecenter of the DBD-electrode to its periphery.
The DBD device generates relative NO flux of 16 parts per billion (ppb) at the maximumwhich could be small for skin healing treatments when compared to the fluxes of Plason.Further biological studies using the DBD device are necessary to identify the benefits of suchsmall quantities of exogenous NO.
In general, for increasing NO production, the averaged current produced in the dischargecan be increased. For this, input voltage of higher amplitude or higher pulse frequency mustbe used. A discharge ignited with higher voltages or with higher pulse frequencies can leadto painful medical treatments and so such modifications to the source should be overlooked.
Any device generating ozone less than 0.05 ppm (0.2 g m−3) by volume of air is approvedand certified as safe by the US Food and Drug Administration (FDA) [112]. A maximumof 0.1 ppm of ozone for an exposure of 8 hours per day is also permitted. However, medi-cal treatments do not require such long exposures per day. By applying the DBD device insingle-filamentary mode, concentration of ozone can reach 1 ppm and even more at sometreatment point (figure 6.10). However, ozone concentration at a distance of 1 mm from thegeneration point amounts to lower orders of magnitude, and hence is within the safe permis-sible limit and can be used for skin therapy.
6.5 Irradiation of treated surface by UV-photons
Phototherapy using ultraviolet radiation is available for treatment of several skin disorders.Ultraviolet A (UV-A, 320-400 nm) and ultraviolet B (UV-B, 280-320 nm) are selectivelyused for treatment of skin diseases like psoriasis [113], atopic dermatitis [114], localized scle-roderma [115] and vitiligo [116].
For treatment of skin diseases such as atopic dermatitis, light sources emitting UV-A andUV-B radiation are used. Combined UVA-UVB therapy is more efficient than light therapy

6.5. Irradiation of treated surface by UV-photons 59
-5.0 -2.5 0.0 2.5 5.01
1000
1000000
1E9
1E12
1E15
1E18
1E21
1E24
1E27
Al-spike : d = 0.4 mm water : d = 1.5 mm 1 ppm
Flux
of N
O (m
-2s-1
)
Radius of electrode (mm)
Figure 6.9: Flux of NO reaching the treated surface in single-filamentary DBD mode along theradius of the treated area below the DBD-electrode.
-5.0 -2.5 0.0 2.5 5.01
1000
1000000
1E9
1E12
1E15
1E18
1E21
1E24
1E27
Al-spike : d = 0.4 mm water : d = 1.5 mm 1 ppm
Flux
of O
3 (m-2s-1
)
Radius of electrode (mm)
Figure 6.10: Flux of ozone reaching the treated surface in single-filamentary DBD mode alongthe radius of the treated area below the DBD-electrode.

60 6. Single-filamentary DBD mode
-5.0 -2.5 0.0 2.5 5.010-4
10-2
100
102
water : d = 1.5 mm Al-spike : d = 1.5 mm Al-spike : d = 0.4 mm UV-A in UVA-UVB therapy
UV-
A Ir
radi
atio
n (W
m-2
)
Radius of electrode (mm)
Figure 6.11: Simulated UV-A irradiation of treated surface in single-filamentary DBD mode andUV-A irradiation used in UVA-UVB therapy [118] along the radius of the treated area below theDBD-electrode.
using UV-B radiation alone [117, 118]. The irradiation of UV-A and UV-B in the UVA-UVBtherapy [118] is about a factor of 100 less than that of the DBD device in a region of about 1mm diameter of the DBD electrode (figure 6.11 and figure 6.12). Accordingly, emission fromthe DBD device in the wavelength range of 310-340 nm with a maximum intensity in theregion of 320-330 nm can be used for treatment of atopic dermatitis.
Furthermore, UV-C in the range of 200-280 nm produced in an inductively coupled plasma(ICP) reactor deactivates spores of Bacillus atrophaeus and Geobacillus stearothermophilus[119, 120]. These bacteria are commonly used as ‘challenging organisms’ for sterilization-validation studies. The dose of UV-C irradiation obtained when the DBD device is operatedfor 10 minutes, is comparable with the double inductively-coupled plasma (DICP) reactorwhich causes decontamination in 60 seconds with a logarithmic reduction of about 5 (figure6.13).
Summary
A pointed counter-electrode is used to mimic the event of DBD-electrode encountering raisedpoints when applied on human body for medical purpose. With the pointed counter-electrode,the DBD device ignites a single-filamentary discharge mode. A similar discharge mode is alsoobtained with water as the counter electrode but only for a specific inter-electrode distancenamely 1.5 mm. These discharges are characterized for the determination of gas temperature,

6.5. Irradiation of treated surface by UV-photons 61
-5.0 -2.5 0.0 2.5 5.010-4
10-2
100
water : d = 1.5 mm Al-spike : d = 1.5 mm Al-spike : d = 0.4 mm UV-B in UVA-UVB therapy
UV-
B Ir
radi
atio
n (W
m-2
)
Radius of electrode (mm)
Figure 6.12: Simulated UV-B irradiation of treated surface in single-filamentary DBD mode andUV-B irradiation used in UVA-UVB therapy [118] along the radius of the treated area below theDBD-electrode.
-5.0 -2.5 0.0 2.5 5.010-6
10-4
10-2
100
water : d = 1.5 mm Al-spike : d = 1.5 mm Al-spike : d = 0.4 mm UV-C for decontamination in DICP
UV-
C Ir
radi
atio
n (W
m-2
)
Radius of electrode (mm)
Figure 6.13: Simulated UV-C irradiation of the treated surface in single-filamentary DBD modeand comparison with irradiation for decontamination in a DICP reactor (Ar : H2 : O2 mixture,10 Pa, 750 W) [119, 120] along the radius of the treated area below the DBD-electrode.

62 6. Single-filamentary DBD mode
electron density and electron velocity distribution function. The fluxes of NO and ozonereaching the treated surface are determined which shows that these fluxes are higher onlyfor a small area of the treated surface around the single filament, and gradually decreaseswhen moving outwards from the point of discharge ignition. This implies that a non-uniformtreatment of the substrate is obtained if a single-filamentary discharge mode is produced bythe DBD device. The same holds good when the DBD-electrode encounters raised points likehair during treatment of human body.

63
7. Stochastic-filamentary and homogenous DBDmodes
7.1 DBD operated on human body
The DBD device was used to ignite plasma on the inner side of the finger and the plasma pro-duced was observed using the high-speed camera. A diffuse discharge free of microdischargechannels is observed in the discharge gap. The discharge appears to be non-homogeneousas shown in figure 7.1. Such a discharge is neither homogeneous nor filamentary. As alreadydiscussed, the human body is a complex system and there are numerous factors influencingthe formation and the properties of the discharge. Possibly, different conductivity of the skinsurface results in an uneven discharge.
Figure 7.1: Inverse microphotograph of DBD igniting plasma with finger as the counter electrode.
Characterization of such a non-homogenous discharge requires abundant preliminary in-formation including the influence of counter-electrode properties on discharge formation andthe conditions for ignition and sustainment of the discharge. Hence, before characterizingthe discharge obtained with a complex system such as the human body, simple systems suchas electrodes of different materials are employed for characterization studies.
Accordingly, counter electrodes of different conductivity namely, a metal (aluminium),a liquid (buffer solution) and a dielectric (glass) are used. The discharge obtained usingeach electrode is characterized using optical emission spectroscopy, numerical simulationand microphotography. Averaged plasma parameters and gas temperature are determined ineach case, and compared with each other.

64 7. Stochastic-filamentary and homogenous DBD modes
7.2 Counter electrodes: aluminium, buffer solution and glass
Aluminium in the form of a plate is used as the grounded counter-electrode. The dimensionsof the plate are: length = 11 cm , breadth = 3 cm and thickness = 0.8 cm.
Phosphate buffered saline (PBS) solution is used as a buffer medium in biological experi-ments. It contains the nutrients necessary for cell growth and survival. Using PBS as a counterelectrode for plasma characterization and thereby determining the fluxes of biologically-usefulmolecules like NO and ozone reaching the solution, it becomes possible to correlate thesefluxes and the biological effects. In this way, the working parameters of the device such asduration of treatment, inter-electrode distance, etc. can be adjusted for optimum use of theplasma for specific medical applications. To use PBS as the counter electrode, it was filledin the well (diameter = 20 mm and depth = 3 mm) carved out of an aluminium plate whichwas then grounded. The conductivity of the solution is 1.866 S m−1 at 20.1 ◦C.
Lastly, a dielectric namely glass in the form of a plate is used as the counter electrode.The thickness of the glass plate is 1 mm. It is placed on a grounded aluminium plate andthe discharge obtained is characterized.
These electrodes are investigated individually and the discharge obtained in each caseis characterized. The fluxes of chemically-active species, and UV-irradiation are determinedfor all the discharges and are compared with other plasma devices and light sources used inskin therapy.
7.3 Stochastic-filamentary and homogeneous dischargemodes
For all the experiments, the applied voltage and frequency are kept constant. When the DBDelectrode is positioned in-contact with the aluminium counter-electrode, microdischarges ap-pear from the sides of the dielectric, and the current pulses are recorded by the oscilloscope(figure 7.2). These are the surface discharges that are produced on the sides of the ceramic dueto breakdown between the enclosed high-voltage DBD electrode and the grounded aluminiumcounter-electrode.For small discharge-gaps between the DBD electrode and the aluminiumelectrode, a filamentary discharge is observed which is stochastically-distributed in the dis-charge gap.
A similar discharge is also observed with PBS solution as the counter electrode as shownin figure 7.3. The diameter of the microdischarges in both cases is about 50 µm. When glassis used as the counter electrode, a homogeneous discharge is observed which fills the entiregap between the electrodes (figure 7.4).

7.3. Filamentary and homogeneous discharge modes 65
0.0 5.0x10⁻⁶ 1.0x10⁻⁵ 1.5x10⁻⁵ 2.0x10⁻⁵
-12
-6
0
6
12
-1.2
-0.6
0.0
0.6
1.2
Current (A
)Volta
ge (k
V)
Time (sec)
Figure 7.2: Current-voltage characteristics of the surface discharge when the DBD electrode is incontact with aluminium grounded-electrode.
Figure 7.3: Microphotograph of stochastic-filamentary DBD mode with PBS solution as thecounter electrode at d = 1 mm.

66 7. Stochastic-filamentary and homogenous DBD modes
Figure 7.4: Microphotograph of homogeneous DBD mode with glass as the counter electrode atd = 1 mm.
7.4 Physics of the discharges
If aluminium and PBS solution are grouped as conductive electrodes and glass as non-conductive, then for the same applied voltage, conductive electrodes show a stochastic-filamentary discharge mode while the non-conductive electrode shows a homogeneous dis-charge mode.
The sequence of the high-voltage pulse can be divided into several periods. Breakdownusually occurs during the first two periods of the trigger pulse. The first period is dividedinto four quarters, as shown in figure 7.5b. The DBD electrode acts as the cathode (figure7.5b) during the first and second quarter. Hence, the electrons travel towards the aluminiumelectrode which is the anode, and leave behind positive ions close to the DBD electrode. Thefield due to these positive charges and the small amplitude of positive applied voltage (in thethird quarter) is high enough for a second breakdown in the positive direction, i.e. towardsthe DBD electrode (now the anode).
When d = 2 mm, there is only one current pulse was observed due to insufficient fieldfor a second breakdown(figure 7.6). When d = 1 mm for aluminium electrode, there are twocurrent peaks seen for each sequential trigger pulse (figure 7.7).
In all cases, when the experiment is started, the first ignition occurs between charge-freesurfaces. However, the subsequent ignitions occur in the presence of charges left over by theprevious ignition(s), or in other words, the surfaces are no longer charge free. Thus a delayedbreakdown is observed for charge-free surfaces and a rapid breakdown when the surfaces arecharged.
The current signal from the photomultiplier tube (PMT) is used to ascertain that thenumber of current pulses recorded by the oscilloscope corresponds to the same number ofbreakdowns per trigger pulse. For d = 2 mm (figure 7.6), the PMT signal shows one currentpeak for each trigger pulse while at d = 1 mm (figure 7.7) two peaks are observed. A one-to-one correspondence of PMT current signal to the plasma current is observed and hence

7.4. Physics of the discharges 67
Figure 7.5: (a) few periods in the beginning of the sequential trigger pulse, (b) the 1st, 2nd and 3rd
quarters of the earliest period in the sequential trigger pulse.
the total number of breakdowns within each trigger pulse is determined from the number ofcurrent pulses per trigger pulse.
Inverse microphotographs of the stochastic-filamentary discharge and the homogeneousdischarge observed for single sequence of trigger pulse are shown in figure 7.8 and figure 7.9,respectively.
Glass has been used as a dielectric for study of DBD in air at atmospheric-pressure anddifferent results have been presented. The development of microdischarge (MD) channels inthe “two-sided” barrier discharge using a pair of glass-covered electrodes powered by 6 kHzAC power supply [121]. Homogeneous DBDs operated at nanosecond-pulsed power supplyare also reported [62, 54, 55]. It is interesting to note that the frequency of high-voltagepulses in sequence is about 100 kHz (figure 3.4) in the studied DBD device and when glassis used as the counter electrode, a homogeneous discharge is produced.
In all cases, the primary element of each breakdown is an individual avalanche thatpropagates to the anode. When the avalanche moves forward, the total number of electronsincreases exponentially in the x-direction (e(α−a)x, where α is Townsend’s first coefficient,and ‘a’ is the electron attachment coefficient). The space charge generated in the avalanchegenerates its own electric field that distorts the avalanche. The field due to the space chargealso increases the electric field in front of the avalanche’s head. This additional field is pro-portional to the number of electrons in the head of the avalanche and increases along thetraversed path.
When the electric field in front of the avalanche’s head reaches a critical value, theavalanche transforms in to a streamer. In this case, the space charge grows additionally dueto secondary avalanches propagating in the high electric-field region and an anode-directedstreamer is produced. If the distance between the electrodes is smaller than 50 mm, primaryavalanches in air at atmospheric-pressure cannot transform into anode-directed streamer

68 7. Stochastic-filamentary and homogenous DBD modes
Figure 7.6: Current, voltage and PMT signals for aluminium electrode at d = 2 mm.
Figure 7.7: Current, voltage and PMT signals for aluminium electrode at d = 1 mm.
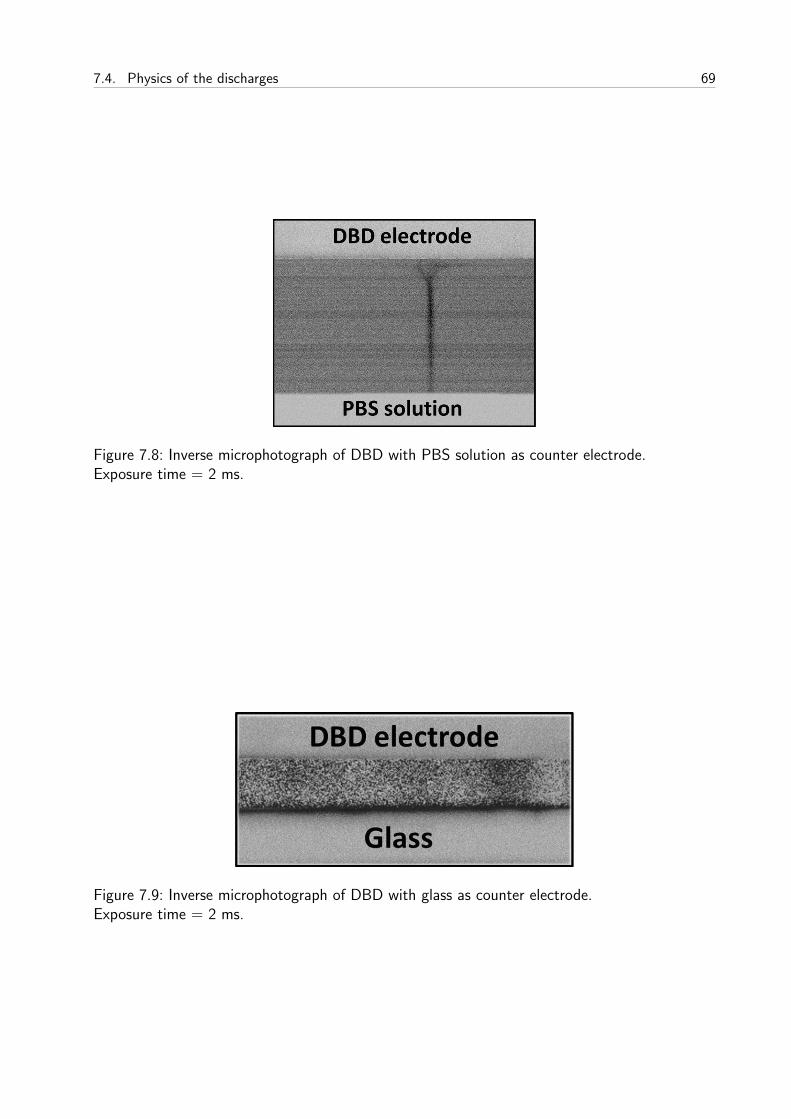
7.4. Physics of the discharges 69
Figure 7.8: Inverse microphotograph of DBD with PBS solution as counter electrode.Exposure time = 2 ms.
Figure 7.9: Inverse microphotograph of DBD with glass as counter electrode.Exposure time = 2 ms.

70 7. Stochastic-filamentary and homogenous DBD modes
[122].
In the studied plasma-conditions, breakdown occurs according to Townsend mechanismand the primary avalanches reach the surface of the anode. This model is confirmed by mi-crophotography of DBD with glass as counter electrode (figure 7.4). The intensity of photoemission is proportional to the electron density and hence maximum emission is observedclose to the surface of glass which is the anode.
After primary avalanches reach the anode, two different discharges can be ignited, eithera filamentary discharge or a homogeneous discharge. In the filamentary discharge, cathode-directed streamer starts in the tail of primary avalanche due to the presence of abundantpositive ions which exhibit low mobility owing to their large mass.
If the head of avalanche touches the conductive anode, as in the case of aluminium andPBS solution, then the electrons are lost from the air gap, and the positively-charged trace ofthe avalanche rapidly increases the electric field that can reach a critical value for streamerinitiation.
If the anode is non-conductive like glass, electrons are not lost from the air gap andnegative charge on the surface of the glass compensate, particularly, the positive charge ofthe avalanche trace. Therefore, conductivity of the anode can influence the transformationof Townsend discharge in to a filamentary or a homogeneous discharge.
During propagation of the avalanches, a number of metastable molecules N2(a′1Σ−
g ) and
N2(A3Σ+
u ) are excited in the air gap. Energy-pooling ionization reactions like:
N2(a′1Σ−
g ) + N2(A3Σ+
u ) → N+2 +N2(X) + e (7.1)
and
N2(a′1Σ−
g ) + N2(a′1Σ−
g ) → N+2 +N2(X) + e, (7.2)
can give rise to “seed electrons” and these electrons can initiate new avalanches. Because ofrelatively lower density of metastables excited in primary avalanches, energy-pooling ioniza-tion in the tail of the avalanches is delayed. These electrons are not lost from the air gapimmediately after the avalanche contacts with the anode surface; instead they neutralizethe positive charges in the avalanche trace. As a result, there are difficulties arising for theinitiation of a cathode-directed streamer. The electric field in this region, which is capable ofinitiating secondary avalanches through the seed electrons, is reduced by the electric field ofpolarized charges of the avalanche. This causes a drop in electron number produced in thesecondary avalanches.
In addition, the sensitivity of ionization coefficient to variation in the electric field alsocontributes to the drop in the electron number. Hence, increase of external electric fieldsupports avalanche propagation and thereby increases the number of seed electrons, thuspreventing streamer production due to charge compensation as already discussed.
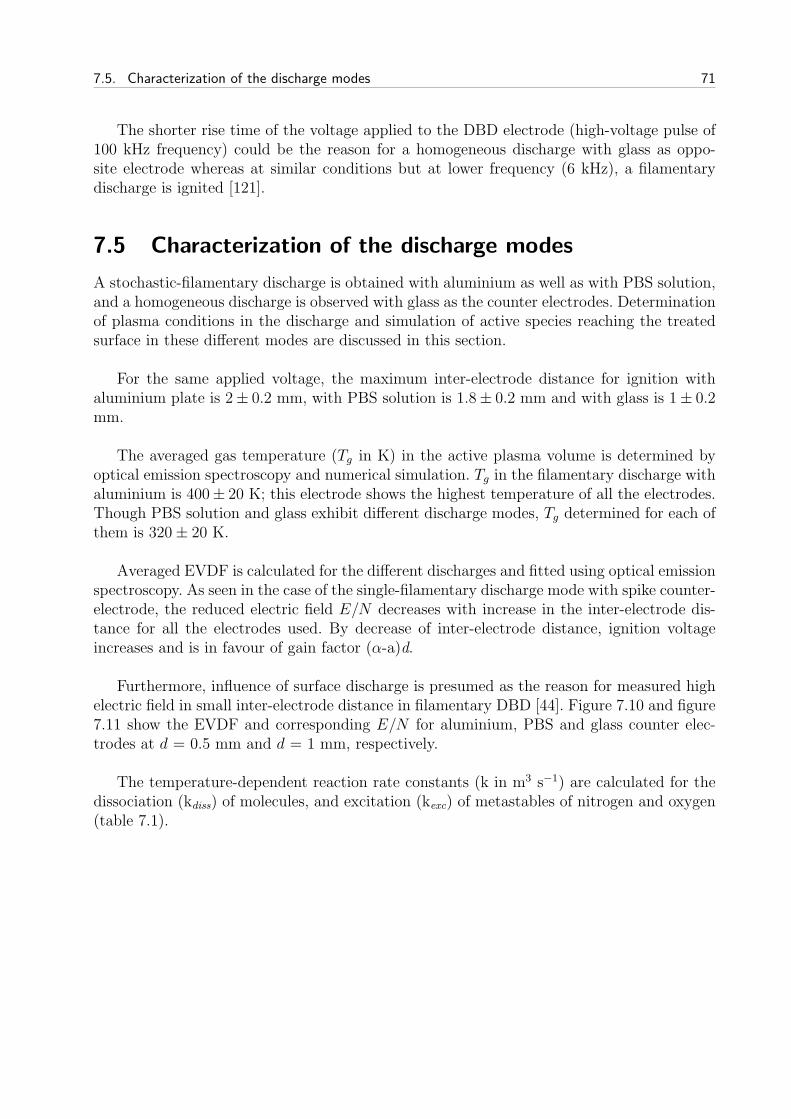
7.5. Characterization of the discharge modes 71
The shorter rise time of the voltage applied to the DBD electrode (high-voltage pulse of100 kHz frequency) could be the reason for a homogeneous discharge with glass as oppo-site electrode whereas at similar conditions but at lower frequency (6 kHz), a filamentarydischarge is ignited [121].
7.5 Characterization of the discharge modes
A stochastic-filamentary discharge is obtained with aluminium as well as with PBS solution,and a homogeneous discharge is observed with glass as the counter electrodes. Determinationof plasma conditions in the discharge and simulation of active species reaching the treatedsurface in these different modes are discussed in this section.
For the same applied voltage, the maximum inter-electrode distance for ignition withaluminium plate is 2± 0.2 mm, with PBS solution is 1.8± 0.2 mm and with glass is 1± 0.2mm.
The averaged gas temperature (Tg in K) in the active plasma volume is determined byoptical emission spectroscopy and numerical simulation. Tg in the filamentary discharge withaluminium is 400± 20 K; this electrode shows the highest temperature of all the electrodes.Though PBS solution and glass exhibit different discharge modes, Tg determined for each ofthem is 320± 20 K.
Averaged EVDF is calculated for the different discharges and fitted using optical emissionspectroscopy. As seen in the case of the single-filamentary discharge mode with spike counter-electrode, the reduced electric field E/N decreases with increase in the inter-electrode dis-tance for all the electrodes used. By decrease of inter-electrode distance, ignition voltageincreases and is in favour of gain factor (α-a)d.
Furthermore, influence of surface discharge is presumed as the reason for measured highelectric field in small inter-electrode distance in filamentary DBD [44]. Figure 7.10 and figure7.11 show the EVDF and corresponding E/N for aluminium, PBS and glass counter elec-trodes at d = 0.5 mm and d = 1 mm, respectively.
The temperature-dependent reaction rate constants (k in m3 s−1) are calculated for thedissociation (kdiss) of molecules, and excitation (kexc) of metastables of nitrogen and oxygen(table 7.1).

72 7. Stochastic-filamentary and homogenous DBD modes
0 10 20 30 401E-5
1E-4
1E-3
0.01
0.1EV
DF
(eV-3
/2)
E (eV)
aluminium; E/N = 330 Td PBS; E/N = 380 Td glass; E/N = 360 Td
Figure 7.10: Calculated EVDF fitted using OES for aluminium, PBS and glass as counter elec-trodes at d = 0.5 mm.
0 10 20 30 401E-5
1E-4
1E-3
0.01
0.1
EVD
F (e
V-3/2)
E (eV)
aluminium; E/N = 310 Td PBS; E/N = 360 Td glass; E/N = 320 Td
Figure 7.11: Calculated EVDF fitted using OES for aluminium, PBS and glass as counter elec-trodes at d = 1 mm.

7.5. Characterization of the discharge modes 73
Counterelectro
de
dE/N
ne
kdiss.N
2kdiss.O
2→
2O
3P
kdiss.O
2→
O(1D)+
O3P
kexc.N
2(A
3Σ
+ u)
kexc.O
2(a
1∆)
kexc.O
2(b
1Σ)
mm
Td
m−3
10−15m
3s−
1
Aluminium
0.50
330
8·102
13.3
1.04
7.83
0.84
0.92
0.216
1.00
310
7·102
12.9
0.99
7.30
0.78
0.91
0.214
1.50
300
5·102
12.7
0.96
7.04
0.76
0.90
0.212
PBSso
lution
0.50
380
3·102
14.4
1.16
9.09
0.97
0.94
0.222
1.00
360
2·102
13.9
1.11
8.60
0.92
0.93
0.220
1.50
330
9·102
03.3
1.04
7.83
0.84
0.92
0.216
Glass
0.50
360
4.3·101
74.1
1.13
8.77
0.93
0.934
0.220
1.00
320
3.7·101
73.2
1.03
7.75
0.83
0.919
0.216
Table7.1:
Reduced
electricfield(E
/N),electron
density(n
e)andrate
constantsforelectron
impact
dissociation(k
diss)of
nitrogen
andoxygen
molecules
andexcitation
(kex
c)of
theirmetastables
atdifferentinter-electrode
distances(d)forfilamentary
andhomogenousdischargemodes
obtained
usingcond
uctive
(aluminium
andPBSsolution)andnon-cond
uctive
(glass)coun
terelectrodes.

74 7. Stochastic-filamentary and homogenous DBD modes
0.0 2.0x10⁻⁶ 4.0x10⁻⁶ 6.0x10⁻⁶ 8.0x10⁻⁶ 1.0x10⁻⁵-12
-9
-6
-3
0
3
6
9
Time (sec)
Volta
ge (k
V)
-3
-2
-1
0
1
2
Current (A
)
Figure 7.12: Current-voltage characteristics for PBS solution as counter electrode at d = 1 mm.
Averaged ne (in m−3) in the active plasma volume is determined for the filamentaryand homogeneous discharges by substituting the known values in equation 4.21 which isre-ordered as:
The number of ignitions per trigger pulse in the filamentary discharge ranges from singleignition at d = 1.5 mm to four ignitions at d = 1 mm and five at d = 0.5 mm. In caseof PBS solution, the number of ignitions was an average of two per trigger pulse for all dvalues (figure 7.12). The same is observed for homogeneous discharge with glass (figure 7.13).
The averaged duration of each discharge pulse is about 20 ns in filamentary dischargewith aluminium and 30 ns with PBS solution. Compared with these electrodes, the dura-tion for homogeneous discharge with glass is characterized by shorter current pulses of fewnanoseconds (< 10 ns). The current-voltage characteristics for glass at an inter-electrodedistance of 1 mm is shown in figure 7.13.
7.6 Simulation of NO and ozone fluxes
Concentrations and fluxes of NO and ozone during DBD treatment are complicated func-tions consisting of parameters pertaining to different plasma conditions. The nitrogen andoxygen atoms are generated during electron-impact dissociation of corresponding moleculesand are lost in gas phase recombination process for the production of nitrogen- and oxygen-containing molecules.

7.6. Simulation of NO and ozone fluxes 75
0.0 2.0x10⁻⁶ 4.0x10⁻⁶ 6.0x10⁻⁶ 8.0x10⁻⁶ 1.0x10⁻⁵-12
-9
-6
-3
0
3
6
9
Time (sec)
Volta
ge (k
V)
-3
-2
-1
0
1
2C
urrent (A)
Figure 7.13: Current-voltage characteristics for glass as counter electrode at d = 1 mm.
At atmospheric-pressure conditions, NO and ozone molecules are also produced by chem-ical processes in gas phase. The loss of these molecules occurs mainly during reactions withnitrogen atoms. These molecules produced both in the discharge and in the afterglow phasereach the surface of the opposite electrode by diffusion.
The fluxes of NO and ozone molecules reaching the treated surface during DBD treatmentare simulated. The method of simulating these fluxes was discussed in detail in Chapter 5.In addition to the boundary conditions presumed for simulation (as discussed in Chapter 5),the simulation of NO and ozone fluxes for stochastic-filamentary discharge and homogeneousmode requires additional assumptions. These assumptions are discussed in the next section.
7.6.1 Assumptions for stochastic-filamentary discharge mode
The time duration between ignitions in successive trigger pulses is 3 ms. In the stochastic-filamentary discharge mode, microdischarge channels of 50 µm diameter appear spatially-and temporally-distributed in the gap between the electrodes. The stochastically-distributedmicrodischarges can be assumed to be a ‘superposition’ of several single-discharge channels.
According to this assumption, the flux due to individual microdischarges can be calcu-lated independent of each other and finally averaged to obtain the flux of NO and ozonethat would reach the surface of the treated electrode. Accordingly, these fluxes are simulatedassuming that the density of chemically-active particles along the azimuth co-ordinate (ϕ)of the cylindrical microdischarge is not influenced by the previous microdischarge. This as-sumption becomes valid due to the following reasons:

76 7. Stochastic-filamentary and homogenous DBD modes
Firstly, there are less chances for the successive microdischarges to occur at the same spot.This can be explained with reference to figure 7.14 illustrating the flux of NO calculated atdifferent ignitions. As shown in this figure, if rhw (in m) is the radius at half-maximum whereNO density has 50% of its maximum value, then the area of the counter electrode treatedeffectively by a single microdischarge is (shw in m2)=π · r2hw.
-1.0 -0.5 0.0 0.5 1.00.0
2.0x10¹⁶
4.0x10¹⁶
6.0x10¹⁶
8.0x10¹⁶
Flux
of n
itric
oxi
de (m
-2s-1
)
Radius of electrode (mm)
after 1st ignition after 2nd ignition after 6th ignition
rhw
Figure 7.14: Flux of nitric oxide after the 1st, 2nd and 6th ignition at the same spot between theelectrodes.
Let the area of DBD electrode be selec. (in m2)=π · r2elec., where relec. is the radius of theelectrode (in m). Then, the ratio of shw to selec., gives the probability (Ps) of two successivemicrodischarges that can occur close to each other. When d = 1.5 mm, Ps = 0.01 whichmakes clear that successive discharge channels do not usually occur at the same spot. There-fore, the contribution of the first microdischarge on the initial conditions of the second onecan be neglected.
For small gap widths, the loss of particles to the electrodes by diffusion, along the heightof the channel is larger compared to the radial diffusion, and this reduces the half-width ofthe diffusion in the radial direction. This means shw decreases and in turn the probabilityPs also decreases. Calculating this probability for a smaller gap width of 1.5 mm is alreadya severe case and so the probabilities for all other inter-electrode gaps smaller than 1.5 mmbecome even smaller. This demonstrates that two successive discharge channels cannot occurat the same spot due to small probability to occur at the same spot.
Secondly, even in the case where a second channel occurs exactly at the same spot wherethe previous channel had occurred, the influence of the first channel on the formation of the

7.6. Simulation of NO and ozone fluxes 77
second channel is only about 15%. This influence vanishes totally, for instance, after a time ofabout 15 ms between the 1st and 6th ignition that leads to the occurrence of microdischargesat the same spot (as shown in figure 7.14). Thus, it appears that the microdischarges canbe treated independent of each other and the ‘superposition’ of single filaments is a validapproximation.
For the calculation of the average flux Γr,stoc.(in m−2 s−1) to the treated area of radiusr, the ratio of time-accumulated influence of one channel to its duration is calculated usingequation 7.3:
Γr,stoc.(r) =1
tpulse
∫ ∞
0
Γz(r,t) dt. (7.3)
In the simulations, time durations between 10 ms and 50 ms are used as the upper limitof integration because further time integration does not change the values, and if any, it isnegligible. The value obtained after integration gives the time averaged flux by one microdis-charge, but does not include the stochastic distribution. To achieve this, the flux of activespecies from the stochastically-distributed discharge channels is considered to be equal irre-spective of the position of ignition of the microdischarge in the inter-electrode gap. Thus, auniform treatment will be attained over the entire area under the electrode which is exposedto the discharge. This assumption is consistent because of the small effective radius (of flux)from a single microdischarge, i.e. small and effective rhw.
The total number of particles that reach the treated surface due to a single ignition canbe calculated from equation 7.4 by integrating Γr,stoc. over the area of the treated surface:
Nfilament = tpulse
∫ Rsim
0
Γr,stoc.(r) 2πr dr (7.4)
where, Rsim = relec..
The time and space-averaged flux of particles Γr,stoc.(in m−2 s−1) to the treated surfaceis defined by equation 7.5:
Γr,stoc. =Nfilament
πR2sim · tpulse
(7.5)
7.6.2 Assumptions for homogeneous discharge mode
In the homogeneous discharge mode, the plasma appearing between the electrodes is approx-imately in cylindrical volume, since the DBD electrode is circular in shape (diameter = 10mm) and is separated by a small gap from the counter electrode. In such a discharge, thechemically-active species produced in the plasma can diffuse out of this cylindrical volume.

78 7. Stochastic-filamentary and homogenous DBD modes
Hence, a radius of 10 mm is used for simulation, and so the boundary conditions becomemore realistic.
The simulation is halted when a periodical behaviour for all calculated values is reached,i.e. until the difference between the values calculated for discharges in two consecutive high-voltage pulses is less than 1%.
From our simulation trials, it was clear that this difference is sufficiently reached after 15ignitions. The flux of active species Γz,hom.(r)(in m−2 s−1) to the surface of treated electrodeis then calculated in the final step by averaging the flux Γz(r,t) (in m−2 s−1) in equation 7.6over time as shown in equation 7.7:
Γz(r,t) = −D∂NM(r,t)
∂z(7.6)
Γz,hom.(r) =1
tpulse
∫ tpulse
0
Γz(r,t) dt, (7.7)
where tpulse is the pulse duration for a frequency of 300 Hz.
7.6.3 Results: Fluxes of NO and ozone
The fluxes of NO and ozone are determined by simulation taking into account the valuesmeasured from experiments. Fluxes of NO and ozone reaching the treated surface in thestochastic-filamentary and the homogeneous DBD modes are shown in figure 7.15. Fromthese figures, it is clear that these fluxes for homogeneous discharge is about an order ofmagnitude higher than in the stochastic-filamentary mode.
The fluxes of NO and ozone obtained for the DBD operated in the single-filamentarymode is compared with the stochastic-filamentary and homogeneous modes (figure 7.15)which are also about an order of magnitude higher in the small area of the treated electrode.Both filamentary and homogeneous modes of DBD are useful for bio-medical applicationslike NO-therapy and ozone-therapy of skin diseases.
The small NO flux could be useful for assisting the skin cells during the different phases ofwound-healing. Therefore, it can be concluded that, when using the DBD plasma source formedical applications, homogeneous mode is more effective for treatment of large substrate-area and single-filamentary mode is suitable for localized treatment.
7.7 UV-irradiation of treated surface
The irradiation of the treated surface by UV-A and UV-B in different discharge modes areshown in figure 7.16. UV-A and UV-B are used in the treatment of skin diseases like pso-

7.7. UV-irradiation of treated surface 79
-7.5 -5.0 -2.5 0.0 2.5 5.0 7.51E16
1E18
1E20
1E22Fl
ux o
f Nitr
ic o
xide
(m-2s-1
)
Radius of electrode (mm)
1 ppm
1
2 34
-7.5 -5.0 -2.5 0.0 2.5 5.0 7.51E16
1E18
1E20
1E22
Flux
of o
zone
(m-2s-1
)
Radius of electrode (mm)
1 ppm
1
2
3
4
Figure 7.15: Flux of nitric oxide (top) and flux of ozone (bottom) reaching the treated circular-area in z-direction for different discharge modes: 1. Stochastic-filamentary discharge (Al-plate; d= 1.5 mm), 2. Stochastic-filamentary discharge (PBS solution; d = 1.5 mm), 3. Homogeneousdischarge (glass; d = 1 mm), 4. Single-filamentary discharge (Al-spike; d = 1.5 mm). The relativeflux 1 ppm is calculated using mean velocity and concentration of nitrogen and oxygen moleculesat plasma conditions.

80 7. Stochastic-filamentary and homogenous DBD modes
riasis, atopic dermatitis, vitiligo, etc. The irradiation of the treated surface using the DBDdevice is compared with irradiation used in other treatments.
For instance, in the skin treatment reported by Jekler et al [118], UV-A irradiation ofabout 100 W m−2 was used in the combined UVA-UVB therapy of atopic dermatitis. For theDBD device, it is clear that irradiation by homogeneous discharge is stronger compared tothat of stochastic-filamentary discharges. By increasing the treatment time by two to threeorders of magnitude, irradiation similar to the reported results [118] can be achieved withthe DBD device. As in the case of UV-B for skin treatment, the irradiation values for theDBD device operated in different discharge modes also appears to be comparable to thatused in the treatment of atopic dermatitis [118].
Unlike single-filamentary discharge with Al-spike as the counter electrode, there is noUV-C emission in the measured spectra of the stochastic-filamentary and homogeneous dis-charges. During the study of emission spectra of DBD operated in stochastic-filamentarymode, the spectrometer observes only 20% of the total plasma volume. In the spectral rangeof low sensitivity of spectrometer, reliable measurement of emission spectrum of NO(A-X)is not possible and hence the irradiation of the treated surface in the UV-C range cannot bedetermined. However, this value is estimated to be 2 ·10−3 W m−2 for stochastic-filamentarymode.
Summary
DBD on the human skin is a non-homogeneous plasma due to potential influence of severalparameters. Prior to the characterization of this discharge, electrodes of different materialsare used as the grounded counter-electrodes for plasma ignition and the discharge condi-tions are characterized. Filamentary discharges are obtained with aluminium plate and PBSsolution as opposite electrodes. A homogeneous discharge is observed with glass as counterelectrode which is characterized by a Townsend discharge but does not attain a glow modein our experimental conditions. The averaged plasma parameters (electron distribution func-tion and electron density) and gas temperature are determined. The fluxes of photons andchemically-active particles (nitric oxide and ozone) reaching the treated surface are calcu-lated and compared with other sources used in dermatology. Irradiation of the treated surfaceby photons and chemically-active particles can be increased simply by increasing the triggerpulse frequency, but electric current will also increase and could evoke pain during treatment.

7.7. UV-irradiation of treated surface 81
-5.0 -2.5 0.0 2.5 5.01E-4
1E-3
0.01
0.1
1
10
100
UV-
A Ir
radi
atio
n (W
m-2)
Radius of electrode (mm)
12
3
4
5
-5.0 -2.5 0.0 2.5 5.01E-4
1E-3
0.01
0.1
1
10
UV-
B Ir
radi
atio
n (W
m-2)
Radius of electrode (mm)
12
3
4
6
Figure 7.16: UV-A (320-400 nm) irradiation (top) and UV-B (280-320 nm) irradiation (bottom)of the treated circular-area for different electrodes. 1. Stochastic-filamentary discharge (Al-plate;d = 1.5 mm), 2. Stochastic-filamentary discharge (PBS solution; d = 1.5 mm), 3. Homogeneousdischarge (glass; d = 1 mm), 4. Single-filamentary discharge (Al-spike; d = 1.5 mm), 5. UVA[118], 6. UVB [118]..


83
8. DBD treatment of animal model
Following the preliminary investigations of different modes of discharge using simple elec-trodes, a small animal is used as the counter electrode. In other words, the animal is subjectedto direct plasma treatment. The plasma conditions are characterized through the determi-nation of averaged gas temperature and plasma parameters namely, electron density andelectron velocity distribution function. The fluxes of NO and ozone molecules reaching theanimal skin as well as irradiation by UV photons are determined. Skin biopsies from controland plasma-treated animals are evaluated histologically through staining methods to identifythe biological effects of DBD treatment.
The measurements were realized in-situ in the Medical Faculty of RWTH Aachen Univer-sitat (Germany) with the kind co-operation of Prof. Dr. C. V. Suschek and Dr. C. Oplander.The biological analyses of the plasma treated skin tissues were carried out by the samegroup. The animal protocol was previously approved by the appropriate regulatory animalcommittees of the administration of the state of North Rhine-Westphalia (Germany), andthe Animal Care Department of RWTH University (Aachen, Germany).
8.1 Experimental arrangement
Adult Balb/c mice (about 22 g of body weight) were obtained from Charles River Laborato-ries (Sulzfeld, Germany). All animals received a standard diet and tap water (ad libitum). Toexclude specific gender effects, only male animals were used. All experiments were performedunder deep pentobarbital sedation of the animal. After sedation, the coat on the back of theanimal was abscised first using a shaver and thereafter using a razor. The bare back of themouse was subjected to plasma treatment.
To use the animal as the counter electrode, it was placed on a grounded aluminium plate.The grounded aluminium plate facilitates measurement of current flowing through the an-imal during plasma treatment. The DBD electrode and the treated surface are aligned insuch a way that they are parallel to each other. Non-parallel surfaces could lead to plasmaconditions that are different from the conditions in a parallel arrangement. Plasma emissionis measured using the optical fiber fitted with a diaphragm. Current and voltage are mea-sured using the Pearson current monitor (1 Volt:1 Amp) and the capacitive voltage divider(1:2000). The humidity of laboratory air was 30%.

84 8. DBD treatment of animal model
8.2 Histologic evaluation of skin biopsy after plasma treat-ment
The animals were subjected to plasma treatment for 30 s, 60 s and 120 s. After 24 or 48 hours,the animals were sacrificed and skin biopsies were tested. The selected tissue specimens werefixed in 10% buffered formalin, embedded in paraffin, and sectioned into 2 µm thick slices.These sections were then de-paraffinized and used for Hematoxylin-Eosin (H-E) test, Giemsa-stain test and Trichrome-stain (Masson-Goldner) test for histologic evaluation. Standardhistological protocols [123] were followed for staining the tissue sections.
8.3 Mode of plasma on mouse skin
Figure 8.1 shows the discharge ignited by the DBD electrode on the mouse skin . (Only smallarea of the mouse-back was shaved to accommodate the DBD electrode of 10 mm diameter.The remaining hair on its body which was within the camera’s view, as seen as in this figure,should not be mistaken for the area under plasma treatment).
Figure 8.1: Inverse microphotograph of DBD on mouse skin at d = 1 mm; homogeneous dischargeis accompanied by microdischarge filaments ignited on the raised-points on mouse skin. Exposuretime = 100 ms.
From the figure 8.1, it is clear that a homogeneous discharge fills the entire gap betweenthe DBD electrode and the animal skin under treatment. In addition, the occurrence of fewmicrodischarges is also observed. These filaments could be due to raised points, or possiblybe a hair shaft which is still remaining on the animal’s skin. These raised points presentthemselves as ‘pointed’ counter electrodes to the DBD device which results in the formationof filamentary discharges on their tips. From this study, it becomes evident that filamentary-discharges are ignited when raised points or asperities are present on the treated surface.
From the microphotograph, using the averaged intensity of pixels present in these twodifferent discharges , it is estimated that the total (light) intensity from the microdischarges(ignited due to raised points on the treated-surface) is about 6% of the total (light) intensityfrom the whole discharge. Hence, the entire discharge in the gap between the DBD electrodeand the skin surface is assumed to be homogeneous for which the plasma parameters are

8.4. Characterization of plasma conditions 85
determined [124]. However, the influence of microdischarges on the chemical kinetics of thedischarge is qualitatively discussed.
8.4 Characterization of plasma conditions
The maximum inter-electrode distance for plasma ignition on mouse using the DBD devicefor an applied voltage of ∼13 kV is 1.2 mm. The discharge is characterized for inter-electrodedistances of 1 mm and 0.5 mm.
The averaged gas temperature (Tg) in the homogeneous discharge is 320 ± 20 K for bothinter-electrode distances. Only a minor heating of the treated surface is possible [44]. It is tobe noted here that the same temperature was obtained for the homogeneous discharge usingglass as the counter electrode (discussed in Chapter 7).
The normal body-temperature of the mouse is about 315 K. The ceramic that covers theelectrode has a temperature of about 300 K during experiment. Therefore, 310 K is assumedas gas temperature in equation 5.2 and equation 5.3 which are used for the simulation ofchemical kinetics in the afterglow phase. The duration of the discharge current measuredusing the current monitor amounts to about 25 ± 5 ns. The gas temperature in the activeplasma volume is higher than the surrounding gas temperature only during this short dura-tion and then decays back, in the order of microseconds, to surrounding gas temperature inthe afterglow phase.
The averaged E/N for d = 1 mm is 265 Td and for 0.5 mm is 275 Td. Higher E/Nfor smaller gap distances (and vice versa) observed here is similar to that observed for thegrounded simple electrodes.
The averaged electron density (ne in m−3) in the active plasma volume- observed by thespectrometer is- determined using equation 4.21. ne is comparable for both 1 mm and 0.5mm and amounts to about 9 · 1016 m−3. Low concentration of water vapour in air causes asmall deviation (about 4%) of reduced electric field and electron density values from dry airconditions.
E/N , ne and the corresponding rate constants for dissociation of nitrogen, oxygen andwater molecules and for excitation of metastables of gas molecules for d = 1 mm and 0.5mm are listed in table 8.1.

86 8. DBD treatment of animal model
dE/N
ne
kdiss.N
2kdiss.O
2kexc.N
2(A
3Σ
+ u)
kexc.O
2(a
1∆)
kexc.O
2(b
1Σ)
kdiss.H
2O
mm
Td
1016m
−3
10−15m
3s−
1
0.50
275
9.22
2.39
7.39
0.69
0.89
0.210
2.50
1.00
265
9.02
2.35
0.91
0.66
0.88
0.210
2.33
Table8.1:
Reduced
electricfield(E
/N),electron
density(n
e)andrate
constantsforelectron
impact
dissociation(k
diss.)of
nitrogen,oxygen
and
water
molecules,andandexcitation
(kex
c.)of
metastables
ofgasmolecules
atdifferentinter-electrode
distances(d)forhomogenousdischarge
onmouse.

8.5. Simulation of fluxes of NO and ozone 87
A tabular overview of the plasma parameters and rate constants determined for all thestudied electrodes can be found in the Appendix.
8.5 Simulation of fluxes of NO and ozone
The chemical processes taken into account for simulation of chemical kinetics in the activeplasma volume and in the afterglow are presented in table 8.2. The chemical processes No.7-19 in the table are calculated for gas temperature determined in the experiment (i.e. 310K) using their temperature dependences [44, 101, 102, 103, 104, 98, 125, 106, 105, 109] whilethe rate constants for the rest (No. 20-27) are calculated based on the Arrhenius relation.Reactions which have small rate constants or that include chemical species of low concen-trations in our plasma conditions are excluded in the simulation.
The fluxes of NO and ozone reaching the skin surface along the radius of the DBD elec-trode for discharge on mouse are shown in figure 8.2. These fluxes determined for otherdischarge modes using grounded electrodes are also presented in this figure for comparison.
Electron density, electric field and rate constants for dissociation of nitrogen and oxygenfor discharge on mouse skin are lower when compared with the respective values for thehomogeneous discharge on glass. Despite this difference, the fluxes of NO and ozone forthese two discharges are comparable. This behaviour can be attributed to the duration andnumber of the discharge pulses. In the case of discharge on mouse, there are 5 current pulseseach of duration 25± 5 ns, whereas in the case of glass, there are only 2 current pulses eachof only about 6 ns.
8.6 UV-irradiation of mouse skin
Irradiation of the treated surface by UV-A (320-380 nm) and by UV-B (280-320 nm) photonsis determined from the observed emission spectrum of nitrogen. The UV-irradiation of theskin surface determined is 210 · 10−3 W m−2 for d = 0.5 mm, and 252 · 10−3 W m−2 for d =1 mm.
UV-irradiation is determined taking into account the relative spectral effectiveness values(figure 8.3) outlined by the International Commission on Non-Ionizing Radiation Protection(ICNIRP) [126] and the results are compared with the ICNIRP standards. Accordingly, UV-irradiation is determined as (Eeff =)13.3 · 10−3 W m−2 (0.798 J m−2) and 16.4 · 10−3 W m−2
(0.984 J m−2) for d = 0.5 mm and 1 mm, respectively. These values are within the exposurelimit of 30 J m−2 prescribed by the ICNIRP for UV irradiation of unprotected skin in thespectral region of 180 nm-400 nm.

88 8. DBD treatment of animal model
No. Reaction Rate constant Reference
(1) O2 + e → O+O+ e Calculated from EVDF, ne -
(2) N2 + e → N+N+ e Calculated from EVDF, ne -
(3) N2 + e → N2(A) + e Calculated from EVDF, ne -
(4) O2 + e → O2(b1Σ) Calculated from EVDF, ne -
(5) O2 + e → O2(a1∆) Calculated from EVDF, ne -
(6) H2O+ e → OH+H+ e Calculated from EVDF, ne -
(7) O + O+M → O2 +M 3.5 · 10−45 m6 s−1 [101]
(8) O + O+M → O2(b1Σ) +M 1.1 · 10−45 m6 s−1 [101]
(9) O + O+M → O2(a1∆) +M 2.4 · 10−45 m6 s−1 [101]
(10) O + 2O2 → O3 +O2 6.6 · 10−46 m6 s−1 [102]
(11) O + O3 → O2(a1∆) + O2 1.9 · 10−21 m3 s−1 [101, 103]
(12) O + O3 → O2(b1Σ) + O2 3.8 · 10−21 m3 s−1 [101, 103]
(13) O + NO+M → NO2 +M 9.4 · 10−44 m6 s−1 [104]
(14) O(1D) + O2 → O2(b1Σ) 3.2 · 10−11 m3 s−1 [125]
(15) O(1D) + O2 → O2 +O 7.9 · 10−12 m3 s−1 [125]
(16) O(1D) + N2 → N2 +O 2.5 · 10−11 m3 s−1 [125]
(17) O2(a1∆) + O3 → O+O2 +O2 5.4 · 10−21 m3 s−1 [103]
(18) N2(A) + N → N2 +N 4.6 · 10−17 m3 s−1 [44]
(19) N + O2 → NO+O 1.3 · 10−22 m3 s−1 [103]
(20) N + N +M → N2(A,X) +M 2.3 · 10−45 m6 s−1 [103]
(21) N + O +M → NO+M 1.0 · 10−44 m6 s−1 [103]
(22) O + O2 +N2 → O3 +N2 6.2 · 10−46 m6 s−1 [102]
(23) O3 +NO → NO2 +O2 1.9 · 10−20 m3 s−1 [103]
(24) O2(b1Σ) + N2 → O2 +N2 2.0 · 10−21 m3 s−1 [103]
(25) O2(b1Σ) + O3 → O+O2 +O2 1.5 · 10−17 m3 s−1 [125]
(26) O2(b1Σ) + O3 → O+O2 +O2(a
1∆) 7.1 · 10−18 m3 s−1 [101]
(27) O2(a1∆) + O → O+O2 1.3 · 10−22 m3 s−1 [103]
(28) N2(A) + N2(A) → N2(C) + N2 3.0 · 10−16 m3 s−1 [98]
(29) N2(A) + O2 → N2 +O+O 2.3 · 10−18 m3 s−1 [106]
(30) NO + N → N2 +O2 3.2 · 10−17 m3 s−1 [105]
(31) N + O3 → NO+O2 5.8 · 10−19 m3 s−1 [103]
Table 8.2: Physical and chemical processes included in the simulation of chemical kinetics inhomogeneous discharge on mouse skin.

8.6. UV-irradiation of mouse skin 89
-5 -4 -3 -2 -1 0 1 2 3 4 51E16
1E17
1E18
1E19
1E20
1E21
1E22
5
43
Flux
of n
itric
oxi
de (m
-2s-1
)
Radius of electrode (mm)
1 ppm
1
2
-5 -4 -3 -2 -1 0 1 2 3 4 51E16
1E17
1E18
1E19
1E20
1E21
1E22
5
43
2
1
Flux
of o
zone
(m-2s-1
)
Radius of electrode (mm)
1 ppm
Figure 8.2: Flux of nitric oxide (top) and flux of ozone (bottom) reaching mouse skin alongthe radius of the treated area below the DBD-electrode in different discharge modes: 1. Single-filamentary discharge (Al-spike; d = 1.5 mm), 2. Stochastic filamentary discharge (Al-plate; d =1 mm), 3. Homogeneous discharge (glass; d = 1 mm), 4. Homogeneous discharge (mouse; d =1 mm), 5. Homogeneous discharge (mouse; d = 0.5 mm) . The relative flux 1 ppm is calculatedusing mean velocity and concentration of nitrogen and oxygen molecules at plasma conditions.

90 8. DBD treatment of animal model
150 200 250 300 350 400
0.0
0.2
0.4
0.6
0.8
1.0
Rel
ativ
e sp
ectr
al e
ffect
iven
ess
Wavelength (nm)
Figure 8.3: Spectral effectiveness values for the wavelength range 200-400 nm
8.7 Results of histological evaluation of DBD-treated skin
H-E Staining
The plasma-treated skin tissue was evaluated for any damage due to direct plasma treat-ment. When compared to control specimens, samples which were treated for different dura-tions show no necrotic lesions or disrupted structures. Furthermore, through H-E stainingprocedure, it was clear that no apoptotic events occurred in the form of pignotic or shrunkencell nuclei and of condensed chromatin in the epidermis or dermis, after DBD exposure.
Giemsa-Staining
Giemsa-staining procedure colors the cytoplasm of lymphocytes in sky blue, of monocytes inpale blue and the nuclear chromatin of leukocytes in magenta. The appearance of these cellsat any site strongly indicates that there are inflammatory reactions taken in the tissue. In theGiemsa-stained specimens, no such stained-cells were found (figure 8.4). This implies thatthere was no migration of lymphocytes, monocytes and leukocytes to the skin site subjectedto DBD treatment which confirms that no inflammation occurred due to DBD treatment.
Trichrome-Staining
In Trichrome-stained skin sections, the extracellular matrix components (namely collagen)did not show apparent alterations or structure anomalies after DBD treatment when com-pared with the control specimens. This indicates that the skin remains intact after DBDtreatment for up to 120 s.

8.7. Results of histological evaluation of DBD-treated skin 91
Figure 8.4: (a, b) Giemsa-stained biopsy of untreated and (c) DBD-treated mouse skin after 48hrs . Treatment duration = 120 s.

92 8. DBD treatment of animal model
8.8 Validation of averaged plasma parameters
In this study, the plasma parameters namely electron density and electron distribution func-tion are averaged and not time- and space resolved. These averaged parameters are deter-mined using simulation and optical emission spectroscopy using spectral bands namely theexcitation emission bands of N2(C-B,0-0) and of N+
2 (B-X,0-0).
From microphotography, it is clear that two discharge conditions exist in this experiment:
i) a homogeneous discharge in the gap between the electrodes, and
ii) the microdischarge filaments occurring along with the homogeneous discharge.
In these two DBD modes, electric field and electron density differ strongly from eachother [127]. Hence, these plasma parameters in the homogeneous and in the filamentarydischarges are also spatially distributed resembling fine ‘patches’ or ‘patterns’ where drasticvariations of these plasma parameters is observed between the two working electrodes in aDBD arrangement [128, 121].
However, in the studied experimental conditions, plasma parameters pertaining to a spe-cific point in the discharge between the electrodes are not determined. Hence, a method isformulated to calculate the spatially distributed plasma parameters, excitation of emissionsand production of chemically-active species. Subsequently, the obtained values are comparedwith the averaged plasma parameters and excitation rates in observed volume determinedusing OES. In this way, it is also possible to understand the influence of low space resolutionof OES diagnostics on the determination of averaged plasma parameters.
The first step in this validation method is to define a ‘space-resolved’ condition. For this,the total plasma volume (observed by the spectrometer during OES in our experiments) issplit into two equal volumes. But in the experimental conditions, the spectrometer combinesthese component volumes as a single volume during OES. Hence, the emission from thissingle volume has been used for the determination of ‘averaged’ parameters. Hence, the ideais to determine the plasma conditions for each of these individual volumes theoretically andcompare them with the ‘averaged’ plasma parameters determined for the (combined) singlevolume.
As defined above, the ‘space-resolved’ condition comprises of two component volumesand these volumes are assumed with extremely different electric field and electron densities.Accordingly, one volume is assigned with 100 Td and the other with 1000 Td. In principle,ne in volume with 100 Td can be assigned with an arbitrary value. Here it is assumed as7 · 1016 m−3.
On the other hand, ne for 1000 Td is calculated for two cases:
(i) First case:The two plasma volumes are assumed to produce equal intensities of neutral nitrogen emis-sion (IN2(C-B)). Using this assumption, ne at 1000 Td is calculated as 1.4·1015 m−3. This

8.8. Validation of averaged plasma parameters 93
completes the set of plasma parameters for ‘space-resolved’ condition. On the other hand,the total N2(C-B) emission intensity is the sum of IN2(C-B) from the two plasma volumes.Hence, E/N averaged for the two volumes is estimated from the ratio of total N2(C-B) emis-sion intensity to the total N+
2 (B-X) emission intensity. Accordingly, ‘averaged’ E/N = 610Td and the ‘averaged’ ne is calculated as 1.7·1015 m−3 for this case.
(ii) Second case:It is assumed that the two plasma volumes produce equal intensities of nitrogen-ion emission(IN+
2 (B-X)) and ne at 1000 Td is 1.5·1012 m−3. Plasma parameters for ‘space-resolved’ condi-
tion are thus achieved. The total emission intensity of N+2 (B-X) is the sum of IN+
2 (B-X) from
the two plasma volumes. Then again, ‘averaged’ E/N is estimated as 110 Td from the ratioof total N2(C-B) emission intensity to the total N+
2 (B-X) emission intensity and ‘averaged’ne is 2.8 · 1016 m−3 for this case.
It can be seen that the ‘averaged’ plasma parameters differ strongly from ‘space-resolved’plasma parameters in these cases. The main aim of plasma characterization is the determi-nation of dissociation rates of nitrogen and oxygen molecules (reactions No. 1 and 2 in Table5.1). These values are subsequently used in the simulation of chemical kinetics in the activeplasma volume and in the afterglow. Hence, as a final step in this validation, we calculatethe dissociation rate of nitrogen molecules (kdiss.N2) and for oxygen molecules (kdiss.O2) using‘space-resolved’ parameters as well as ‘averaged’ plasma parameters, and compare them.
The ratio of kdiss.N2 at ‘averaged’ condition to that at ‘space-resolved’ condition is deter-mined as 1.03 for the first case and 1.2 for the second case. Similarly, the ratio of kdiss.O2 inthe ‘averaged’ condition to that in the ‘space-resolved’ condition corresponds to 0.47 for thefirst case and 1.2 for the second case. All the assumed and calculated values are presentedin table 8.3.
If in case, the neutral nitrogen emission in the region of high electric field is weaker thanthat in the region of low electric field (may be due to small number of electrons resulting fromeither low electron density or small plasma volume), then the ‘averaged’ E/N calculated (as110 Td in the second case) will be closer to the E/N value of the low electric field region(i.e. 100 Td). In such a condition, the dissociation rates of oxygen and nitrogen moleculescalculated using ‘averaged’ plasma parameters differ only slightly from the values determinedwith ‘space-resolved’ plasma parameters.
Conversely, if neutral nitrogen emission in the region of high electric field is equal orcomparable to that in the low electric field region, then the ‘averaged’ E/N calculated (610Td) is closer to the E/N value of the high electric field region (i.e. 1000 Td) as seen inthe first case of this estimation. In this case, as can be seen in table 8.3, kdiss.O2 calculatedusing ‘averaged’ plasma parameters is estimated lower by a factor of about 2. But kdiss.N2
calculated using ‘averaged’ parameters did not show large deviations from the correspond-ing value calculated at ‘space-resolved’ condition. The reason for this effect is the differencebetween threshold values of dissociation cross-section of nitrogen and oxygen molecules andthe difference of the ‘averaged’ electron distribution function from the ‘space-resolved’ one.
When the same validation procedure was performed for two plasma volumes with 200

94 8. DBD treatment of animal model
Td and 100 Td, and the values calculated using ‘averaged’ parameters varied only slightly(less than 20%) from the values calculated using ‘space-resolved’ parameters in the first caseas well as in the second case. Hence, it can be concluded that our validation holds good forplasma volumes that are assigned with E/N ≥200 Td, and volume assigned with 100 Tdproves to be a ‘severe’ case for this estimation procedure.
Because of relatively low averaged electric field determined in DBD on mouse skin(E/N 300 Td), according to our validation, we can hypothesize that the influence of “regionwith high electric field” on the determined E/N is not so effective (as seen in the second caseof our validation), and hence the ratio of dissociation rate of nitrogen and oxygen determinedusing E/N = 300 (averaged condition) to the same determined for ‘space-resolved’ conditionwill be less than 2. However, the actual values of dissociation rates in the ‘averaged’ conditionand in the ‘space-resolved’ condition can be established only through the determination ofreal parameters in the experiment using an ‘averaged’ diagnostic method (like OES) as wellas a space-resolved diagnostic method.

8.8. Validation of averaged plasma parameters 95
Assumedplasm
aco
nditions
kdis
s.N
2ataveraged
condition
kdis
s.N
2atsp
ace-resolved
condition
kdis
s.O
2ataveraged
condition
kdis
s.O
2atsp
ace-resolved
condition
First
case:
I N2(C
-B)at
100Td=
I N2(C
-B)at
1000
Td
space-resolved
:
at100Td,ne=
7·101
6m
−3
1.03
0.47
at1000
Td,ne=
1.4·101
5m
−3
averaged
: E/N
=610Td
ne=1.7·101
5m
−3
Seco
ndca
se:
I N+ 2(B
-X)at
100Td=
I N+ 2(B
-X)at
1000
Td
space-resolved
:
at100Td,ne=7·101
6m
−3
1.2
1.2
at1000
Td,ne=1.5·101
2m
−3
averaged
: E/N
=110Td
ne=2.8·101
6m
−3
Table
8.3:
Plasm
acond
itions
assumed
forvalidationof
averaged
plasmaparametersandthecorresponding
dissociationrate
constantsfor
nitrogen
(kdiss.N
2)andoxygen
(kdiss.O
2)

96 8. DBD treatment of animal model
Summary
The DBD device is applied on mouse skin and the plasma conditions in the discharge arecharacterized. Averaged plasma parameters and gas temperature are determined applyingoptical emission spectroscopy, microphotography and numerical simulation. The chemicalkinetics in active plasma volume and in afterglow are simulated, and the irradiation of themouse skin by ozone, nitric oxide and UV-photons are calculated. After DBD treatment, theplasma-treated mouse skin was tested through histological staining methods. Results showthat DBD treatment for up to 120 s treatment is safe for skin cells, causes no inflammation,does not affect collagen structure and induces no other kind of tissue injuries. This shows thatDBD treatment for shorter duration does not result in the formation of tumor cells and henceis safe for application on human body for medical purposes including skin disinfection wherethe pathogens are selectively inactivated by the plasma, leaving the skin cells unharmed.
97
9. Conclusion and Outlook
A dielectric barrier discharge (DBD) device is investigated for medical application such asskin treatment. The device ignites plasma on objects of high capacitance like the humanbody, and also with electrodes that are grounded. Prior to characterization of the barrierdischarge on human body, electrodes of different materials and simple geometry are used asthe counter electrode for discharge characterization. Finally, a mouse is subjected to DBDtreatment and the discharge conditions are characterized. The different discharge modes arecharacterized through the determination of plasma parameters such as electron density andelectron distribution function. The chemical kinetics in the discharges are simulated and thefluxes of NO, ozone and UV-photons that reach the treated surface are determined.
A stochastic-filamentary discharge where microdischarges are spatially and are tempo-rally distributed in the discharge gap is obtained when conductive electrodes such as alu-minium and saline solution are used. With non-conductive electrode namely glass, a ho-mogeneous discharge is produced. A pointed electrode (in the form of a spike) ignites thesingle-filamentary discharge. A similar discharge is obtained with water at an inter-electrodedistance of 1.5 mm. DBD on mouse skin is homogeneous except for a few filamentary dis-charges ignited possibly due to hair or some asperity on its skin surface.
Electron density in the active plasma volume in stochastic-filamentary discharge withaluminium is the highest which is about 8 · 1021 m−3 at d = 0.5 mm while with saline so-lution is lower by a factor of about 3. For the single-filamentary discharge with spike andwater, the electron density is comparable with that for saline solution. The homogeneousdischarge with glass has electron density of about 4 · 1017 m−3 at d = 0.5 mm. The lowestvalue of electron density is seen for the homogeneous discharge with mouse which is about1 order of magnitude smaller than that for a similar discharge with glass.
In all cases, electron density increases with decrease in the inter-electrode distance andthe same trend is also observed for the reduced electric-field (E/N) values. Higher values ofboth electron density and E/N for small discharge gaps produce fluxes of NO and ozone ofgreater densities. This implies that the DBD device should be used at close vicinity to thetreated substrate in order to achieve a stronger treatment.
The fluxes of NO, ozone and UV-photons are the highest for the single-filamentary dis-charge with spike and is followed by the fluxes produced in the homogeneous discharge withglass, and then the stochastic-filamentary discharges with aluminium and saline solution.The fluxes reaching the mouse skin are comparable with that obtained for homogeneousdischarge at the same inter-electrode distance. From the determined flux densities, it is clearthat except for the single-filamentary discharge, other discharges offer a uniform treatmentof the substrate. However, the conductivity of the treated surface influences the plasma con-

98 9. Conclusion and Outlook
ditions and chemical kinetics resulting in different densities of NO and ozone molecules. Onthe other hand, the single-filamentary discharge, if ignited during treatment of human body,will result in an uneven treatment of the surface with flux of greater density, for a small areaaround the raised point, beyond which the particle density gradually decreases.
Outlook
Surface discharges
Surface discharge produced by the DBD device is characterized with microdischarges thatare longer than that produced in a volume discharge. The E/N in the surface discharge isalso higher than that obtained with microdischarges in a volume discharge. Hence, surfacedischarges produce large quantities of NO and ozone molecules. By intentionally increasingthe surface discharge on the dielectric surface, the plasma conditions existing in the dischargecan be characterized and the chemical kinetics simulated in order to determine the fluxes ofNO and ozone molecules that reach the treated surface.
Characterization of complex DBD modes
It has been shown that the DBD on mouse is homogeneous except for a few microdischargesthat are formed simultaneously. From this study it is clear that the plasma conditions in thefilamentary discharge and the homogeneous discharge are different from each other, and sois the chemical kinetics and the production of NO and ozone molecules. In this work, thesetwo different discharges have been individually characterized. Simulations can become moreuseful for the characterization of plasma conditions and for determining the chemical kineticswhen complex discharges such as that seen in the case of mouse as the counter electrode.Since, such discharges are more likely to occur in reality, diagnostics and simulation methodshave to be developed for discharge characterization.
Improved skin penetration of topically-applied medicines
The outermost layer of the skin, the stratum corneum, consists of lipids which hinder the pen-etration of medicines applied on the skin surface externally. The barrier discharge produceshigh energy electrons that can potentially break the chemical bonds in lipids and disintegratethem. DBD treatment can facilitate better dermal penetration of medicines that are appliedon the skin surface.
Preliminary investigation show that the lipid content is reduced after plasma treatment.For this study, reconstituted human epidermis (RHE) was used. The cross-sectional view ofthe different cell layers of a RHE is shown in figure 9.1.
RHE is an alternative to animal testing of products such as cosmetics and pharmaceutics.It is cultured using isolated skin cells and comprises of various layers of the RHE similarto that in the human skin. These tissue layers are grown on a polycarbonate filter whichforms the base of a culture insert (shown in figure 9.2). The insert is a small container ofabout 8 mm diameter. To nourish the cells growing on the filter, the insert is placed in

99
Figure 9.1: Cross-sectional view of Reconstituted Human Epidermis (RHE)
a culture well which is filled with a growing medium high enough to touch the bottom ofinsert, i.e. the polycarbonate filter. Such non-animal testing methods are useful for studiesthat require biological tests such as the plasma sources for medical application. More studiesin this direction can open new opportunities for diversified applications of plasma devices inmedicine.
Figure 9.2: Construction of a Reconstituted Human Epidermis (RHE) insert


Bibliography 101
Bibliography
[1] U. Kogelschatz. Process Technologies for water treatment. Plenum Press (New York),1988.
[2] J. Y. Jeong, S. E. Babayan, V. J. Tu, J. Park, I. Henins, R. F. Hicks, and G. S. Selwyn.Etching materials with an atmospheric-pressure plasma jet. Plasma Sources Sci. Tech.,7:282–285, 1998.
[3] M. Xi, Y. Li, S. Shang, D. Li, Y. Yin, and X. Dai. Surface modification of aramid fiberby air dbd plasma at atmospheric pressure with continuous on-line processing. Surfaceand Coatings Technology, 202:6029–6033, 2008.
[4] F. Massines, N. Gherardi, and F. Sommer. Silane-based coatings on polypropylene,deposited by atmospheric pressure glow discharge plasmas. Plasmas and Polymers,5:151–172, 2000.
[5] A. Serrano Aroca, M. Monleon Pradas, and J.L. Gomez Ribelles. Plasma-induced poly-merisation of hydrophilic coatings onto macroporous hydrophobic scaffolds. Polymer,48:2071–2078, 2007.
[6] Y. Tanaka, T. Nagumo, H. Sakai, Y. Uesugi, Y. Sakai, and K. Nakamura. Nanoparticlesynthesis using high-powered pulse-modulated induction thermal plasma. Journal ofPhys. D: App. Phys., 43:265201, 2010.
[7] G. Fridman, G. Fridman, M. Peddinghaus, M. Balasubramanian, H. Ayan, A. Fridman,A. Gutsol, and A. Brooks. Blood coagulation and living tissue sterilization by floating-electrode dielectric barrier discharge in air. Plasma Chem. Plasma Process., 26:425–442, 2006.
[8] M. K. Boudam, M. Moisan, B. Saoudi, C. Popovici, N. Gherardi, and F. Massines.Bacterial spore inactivation by atmospheric-pressure plasmas in the presence or absenceof uv photons as obtained with the same gas mixture. J. Phys. D: Appl. Phys., 39:3494–3507, 2006.
[9] K. Stapelmann, O. Kylian, B. Denis, and F. Rossi. On the application of inductivelycoupled plasma discharges sustained in ar/o2/n2 ternary mixture for sterilization anddecontamination of medical instruments. J. Phys. D: Appl. Phys., 41:1920051, 2008.
[10] F. Rossi, O. Kylian, H. Rauscher, D. Gilliland, and L. Sirghi. Use of a low-pressureplasma discharge for the decontamination and sterilization of medical devices. Pureand Applied Chemistry, 80:1939–1951, 2008.

102 Bibliography
[11] N. Hayashi, N. Tsutsui, S. Tomari, and T. Weimin Guan. Sterilization of medical equip-ment using oxygen radicals produced by water vapor rf plasma. IEEE Transactionson Plasma Science, 36:1302–1303, 2008.
[12] P.K. Chu. Plasma surface treatment of artificial orthopedic and cardiovascular bioma-terials. Surface and Coatings Technology, 201:5601–5606, 2007.
[13] E. Piskin. Plasma processing of biomaterials. Journal of Biomaterials Science, 4:45–60,1993.
[14] S. U. Kalghatgi, G. Fridman, G. M. Cooper, G. Nagaraj, M. Peddinghaus, M. Bala-subramanian, V. N. Vasilets, A. F.Gutsol, A. Fridman, and G. Friedman. Mechanismof blood coagulation by nonthermal atmospheric pressure dielectric barrier dischargeplasma. IEEE Transactions on Plasma Science, 35:1559–1566, 2007.
[15] A. B. Shekter Vladimir, A. Serezhenkov, T. G. Rudenko, A. V. Pekshev, and A. F.Vanin. Beneficial effect of gaseous nitric oxide on the healing of skin wounds. Nitricoxide: Biolo. Chem., 12:210–219, 2005.
[16] T. C. Montie, K. Kelly-Wintenberg, and J. R. Roth. An overview of research using theone atmosphere uniform glow discharge plasma (oaugdp) for sterilization of surfacesand materials. IEEE Transactions on Plasma Science, 28:41–50, 2000.
[17] Yue Ma, Guan-Jun Zhang, Xing-Min Shi, Gui-Min Xu, and Yun Yang. Chemical mech-anisms of bacterial inactivation using dielectric barrier discharge plasma in atmosphericair. IEEE Transactions on Plasma Science, 36:1615–1620, 2008.
[18] M. Laroussi, D. A. Mendis, and M. Rosenberg. Plasma interaction with microbes. NewJournal of Physics, 5:41.1–41.10, 2003.
[19] D. A. Mendis, M. Rosenberg, and F. Azam. A note on the possible electrostaticdisruption of bacteria. IEEE Transactions on Plasma Science, 28:1304–1306, 2000.
[20] M. T. N. Campanha, E. M. Mamizuka, and A. M. Carmona-Ribeiro. Interactionsbetween cationic liposomes and bacteria: the physical-chemistry of the bactericidalaction. Journal of Lipids Research, 40:1495–1500, 1999.
[21] E. A. Sosnin, E. Stoffels, M.V. Erofeev, I. E. Kieft, and S. E. Kunts. The effects ofuv irradiation and gas plasma treatment on living mammalian cells and bacteria: acomparative approach. IEEE Transactions on Plasma Science, 32:1544–1550, 2004.
[22] E. Stoffels, A. J. Flikweert, W. W. Stoffels, and G. M. W. Kroesen. Plasma needle: anon-destructive atmospheric plasma source for fine surface treatment of (bio)materials.Plasma Sources Sci. Tech., 11:383–388, 2002.
[23] M. Laroussi and X. Lu. Room-temperature atmospheric pressure plasma plume forbiomedical applications. Applied Physics Letters, 87:113902, 2005.
[24] G. Fridman, A. Shereshevsky, M. M. Jost, A. D. Brooks, A. Fridman, A. Gutsol,V. Vasilets, and G. Friedman. Floating electrode dielectric barrier discharge plasma inair promoting apoptotic behavior in melanoma skin cancer cell lines. Plasma Chem.Plasma Processes., 27:163–176, 2007.

Bibliography 103
[25] Q. S. Yu, C. Huang, F.-H. Hsieh, H. Huff, and Yixiang Duan. Bacterial inactivationusing a low-temperature atmospheric plasma brush sustained with argon gas. Journalof Biomedical Materials Research Part B: Applied Biomaterials, 80B:211–219, 2007.
[26] S. Kuehn, N. Bibinov, R. Gesche, and P. Awakowicz. Non-thermal atmospheric pressurehf plasma source: generation of nitric oxide and ozone for bio-medical applications.Plasma Sources Sci. Tech., 19:015013, 2010.
[27] Yanzhou Sun, Yuchang Qiu, Ailing Nie, and Xudong Wang. Experimental research oninactivation of bacteria by using dielectric barrier discharge. IEEE Transactions onPlasma Science, 35:1496–1500, 2007.
[28] M. J. Gallagher, N. Vaze, S. Gangoli, V. N. Vasilets, A. F. Gutsol, T. N. Milovanova,S. Anandan, D. M. Murasko, and A. A. Fridman. Rapid inactivation of airborne bacte-ria using atmospheric pressure dielectric barrier grating discharge. IEEE Transactionson Plasma Science, 35:1501–1510, 2007.
[29] T. Akan, N. Ekem, Y. Akgun, A. Kiremitci, A. Cabuk, S. Pat, and G. Musa. Plasmasterilization using the high voltage pulsed discharge at atmospheric pressure. Journalof Applied Sciences, 6:1566–1570, 2006.
[30] H. Ayan, G. Fridman, A. F. Gutsol, V. N. Vasilets, A. Fridman, and G. Friedman.Nanosecond-pulsed uniform dielectric-barrier discharge. IEEE Transactions on PlasmaScience, 36:504–508, 2008.
[31] A. M. Shulutko, N.V. Antropova, and I. Kriuger. No-therapy in the treatment of pu-rulent and necrotic lesions of lower extremities in diabetic patients. Khirurgia (Mosk.),12:43–46, 2004.
[32] R. A. Gundarova, N. B. Chesnokova, A. B. Shekhter, N. G. Davydova, A. V. Pekshev,O. I. Kvasha, O. V. Beznos, and O. A. Gorbacheva. Effects of gaseous flow containingnitric oxide on the eyeball structures (an experimental study). Vestn. Oftalmol, 117:29–32, 2001.
[33] M. G. Kong, G. Kroesen, G. Morfill, T. Nosenko, T. Shimizu, J. van Dijk, and J. L.Zimmermann. Plasma medicine: an introductory review. New Journal of Physics,11:115012, 2009.
[34] E. Stoffels, I. E. Kieft, R. E. J. Sladek, L. J. M. van den Bedem, E. P. van der Laan,and M. Steinbuch. Plasma needle for in vivo medical treatment: recent developmentsand perspectives. Plasma Sources Sci. Tech., 15:S169–S180, 2006.
[35] I. E. Kieft, E. P. v d Laan, and E. Stoffels. Electrical and optical characterization ofthe plasma needle. New Journal of Physics, 6:149, 2004.
[36] R. E. J. Sladek, E. Stoffels, R. Walraven, P. J. A. Tielbeek, and R. A. Koolhoven.Plasma treatment of dental cavities: a feasibility study. IEEE Transactions on PlasmaScience, 32:1540–1543, 2004.
[37] I. E. Kieft, D. Darios, A. J. M. Roks, and E. Stoffels. Plasma treatment of mam-malian vascular cells: a quantitative description. IEEE Transactions on Plasma Sci-ence, 33:771–775, 2005.

104 Bibliography
[38] E. Stoffels, Y. Aranda Gonzalvo, T. D. Whitmore, D. L. Seymour, and J. A. Rees. Aplasma needle generates nitric oxide. Plasma Sources Sci. Tech., 15:501–506, 2006.
[39] Y. Sakiyama, D. B. Graves, and E. Stoffels. Influence of electrical properties of treatedsurface on rf-excited plasma needle at atmospheric pressure. J. Phys. D: Appl. Phys.,41:095204, 2008.
[40] Samoilovich, Gibalov, and Kozlov. Physical chemistry of the barrier discharge. DVS-Verlag GmbH, Dusseldorf, 1997.
[41] A. Fridman. Plasma Chemistry. Cambridge University Press, 2008.
[42] K. H. Becker, U. Kogelschatz, K. H. Schoenbach, and R. J. Barker. Non-Equilibriumair plasmas at atmospheric pressure. Institute of Physics, London, 2005.
[43] U. Kogelschatz. Filamentary, patterned, and diffuse barrier discharges. IEEE Trans-actions on Plasma Science, 30:1400–1408, 2002.
[44] M. Kuchenbecker, N. Bibinov, A. Kaemling, D. Wandke, P. Awakowicz, and W. Vioel.Characterization of dbd plasma source for biomedical applications. J. Phys. D: Appl.Phys., 42:045212, 2009.
[45] S. Kanazawa, M. Kogoma, T. Moriwaki, and S. Okazaki. Stable glow plasma at atmo-spheric pressure. J. Phys. D: App. Phys., 21:838–840, 1988.
[46] F. Massines and G. Gouda. A comparison of polypropylene-surface treatment by fil-amentary, homogeneous and glow discharges in helium at atmospheric pressure. J.Phys. D: App. Phys., 31:3411–3420, 1998.
[47] N. Gherardi, G. Gouda, E. Gat, A. Ricard, and F. Massines. Transition from glow silentdischarge to micro-discharges in nitrogen gas. Plasma Sources Sci. Tech., 9:340–346,2000.
[48] N. Gherardi and F. Massines. Mechanisms controlling the transition from glow silentdischarge to streamer discharge in nitrogen. IEEE Transactions on Plasma Science,29:536–544, 2001.
[49] R. Brandenburg, Z. Navratil, J. Jansky, P. Stahel, D. Trunec, and H.-E. Wagner. Thetransition between different modes of barrier discharges at atmospheric pressure. J.Phys. D: App. Phys., 42:085208, 2009.
[50] F. Massines, N. Gherardi, N. Naude, and P. Segur. Glow and townsend dielectric barrierdischarge in various atmosphere. Plasma Physics and Controlled Fusion, 47:B577–B588, 2005.
[51] J. L. Walsh, J. J. Shi, and M. G. Kong. Submicrosecond pulsed atmospheric glow dis-charges sustained without dielectric barriers at kilohertz frequencies. Applied PhysicsLetters, 89:161505, 2006.
[52] J. Rahel and Daniel M Sherman. The transition from a filamentary dielectric barrierdischarge to a diffuse barrier discharge in air at atmospheric pressure. J. Phys. D:App. Phys., 38:547–554, 2005.

Bibliography 105
[53] E. P. Velikhov. Physical Phenomena in Gas Discharge Plasma. Nauka (Moscow), 1987.
[54] H. Ayan, D. Staack, G. Fridman, A. Gutsol, Y. Mukhin, A. Starikovskii, A. Fridman,and G. Friedman. Application of nanosecond-pulsed dielectric barrier discharge forbiomedical treatment of topographically non-uniform surfaces. J. Phys. D: Appl. Phys.,42:125202, 2009.
[55] X. Lu and M. Laroussi. Dynamics of an atmospheric pressure plasma plume generatedby submicrosecond voltage pulses. J. Appl. Phys., 100:63302, 2006.
[56] M. Laroussi, W. Hynes, T. Akan, X. Lu, and C. Tendero. The plasma pencil: A sourceof hypersonic cold plasma bullets for biomedical applications. IEEE Transactions onPlasma Science, 36:1298–1299, 2008.
[57] M. Laroussi, M. Laroussi, C. Tendero, X. Lu, S. Alla, and W. L. Hynes. Inactivationof bacteria by the plasma pencil. Plasma Processes and Polymers, 3:470–473, 2006.
[58] G. Fridman, A. D. Brooks, M. Balasubramanian, A. Fridman, A. Gutsol, V. N. Vasilets,H. Ayan, and G. Friedman. Comparison of direct and indirect effects of non-thermalatmospheric-pressure plasma on bacteria. Plasma Processes and Polymers, 4:370–375,2007.
[59] G. Fridman, G. Friedman, A. Gutsol, A. B. Shekhter, V. N. Vasilets, and A. Fridman.Applied plasma medicine. Plasma Processes and Polymers, 5:503–533, 2008.
[60] K.-D. Weltmann, E. Kindel, R. Brandenburg, C. Meyer, R. Bussiahn, C. Wilke, andT. von Woedtke. Atmospheric pressure plasma jet for medical therapy: Plasma pa-rameters and risk estimation. Contributions to Plasma Physics, 49:631–640, 2009.
[61] R. Bussiahn, R. Brandenburg, T. Gerling, E. Kindel, H. Lange, N. Lembke, K.-D.Weltmann, Th. von Woedtke, and T. Kocher. The hairline plasma: An intermittentnegative dc-corona discharge at atmospheric pressure for plasma medical applications.Applied Physics Letters, 96:143701, 2010.
[62] J. L. Walsh, Zhi Cao, and M.G. Kong. Atmospheric dielectric-barrier discharges scal-able from 1 mm to 1 m. IEEE Transactions on Plasma Science, 36:1314–1315, 2008.
[63] Q. Y. Nie, Z. Cao, C. S. Ren, D. Z. Wang, and M. G. Kong. A two-dimensional coldatmospheric plasma jet array for uniform treatment of large-area surfaces for plasmamedicine. New Journal of Physics, 11:115015, 2009.
[64] J. S. Sousa, G. Bauville, B. Lacour, V. Puech, M. Touzeau, and L. C. Pitchford.O2(a
1δg) production at atmospheric pressure by microdischarge. Applied Physics Let-ters, 93:011502, 2088.
[65] K. H. Schoenbach, A. El-Habachi, W. Shi, and M. Ciocca. High-pressure hollow cath-ode discharges. Plasma Sources Sci. Tech., 6:468, 1997.
[66] J. S. Sousa, G. Bauville, B. Lacour, V. Puech, M. Touzeau, and J. Ravanat4. Dnaoxidation by singlet delta oxygen produced by atmospheric pressure microdischarges.Applied Physics Letters, 97:141502, 2010.

106 Bibliography
[67] V. Schulz von der Gathen, L. Schaper, N. Knake, S. Reuter, K. Niemi, T. Gans, andJ. Winter. Spatially resolved diagnostics on a microscale atmospheric pressure plasmajet. J. Phys. D: App. Phys., 41:194004, 2008.
[68] S. Reuter, K. Niemi, V. Schulz von der Gathen, and H. F. Doebele. Generation ofatomic oxygen in the effluent of an atmospheric pressure plasma jet. Plasma SourcesSci. Tech., 18:015006, 2009.
[69] K. Niemi, V. Schulz von der Gathen, and H. F. Doebele. Absolute atomic oxygen den-sity measurements by two-photon absorption laser-induced fluorescence spectroscopyin an rf-excited atmospheric pressure plasma jet. Plasma Sources Sci. Tech., 14:375–386, 2005.
[70] N. Bibinov, H. Halfmann, P. Awakowicz, and K. Wiesemann. Relative and absoluteintensity calibrations of a modern broadband echelle spectrometer. Meas. Sci. Technol.,18:1327–1337, 2007.
[71] Code EEDF available from Prof. A. P. Napartovich. Triniti Institute for Innovationand Fusion Research, Troizk, Moscow Region, Russia, .
[72] N. Bibinov, P. Rajasekaran, P. Mertmann, D. Wandke, W. Vioel, and P. Awakowicz.Biomedical Engineering, Trends in material science. InTech, 2011.
[73] S. V. Pancheshnyi, S. M. Starikovskaia, and A. Yu. Starikovskii. Collisional deactiva-tion of n2(c
3πu, v=0, 1, 2, 3) states by n2, o2, h2 and h2o molecules. Chem. Phys.,262(2-3):349–357, 2000.
[74] R. G. Knowles and S. Moncada. Nitric oxide synthases in mammals. BiochemicalJournal, 298:249–258, 1994.
[75] R. F. Furchgott. Endothelium-derived relaxing factor: Discovery, early studies, andidentifcation as nitric oxide (nobel lecture). Angewandte Chemie (Int. Edition),38:1870, 1999.
[76] D. Bruch-Gerharz, T. Ruzicka, and V. Kolb-Bachofen. Nitric oxide in human skin:Current status and future prospects. Journal of Investigative Dermatology, 110:1–7,1998.
[77] C. V. Suschek, T. Schewe, H. Sies, and K. Kroncke. Nitrite, a naturally occurringprecursor of nitric oxide that acts like a prodrug. Biological Chemistry, 387:499–506,2006.
[78] J. Liebmann, M. Born, and V. Kolb-Bachofen. Blue-light irradiation regulates prolif-eration and differentiation in human skin cells. Journal of Investigative Dermatology,130:259–269, 2010.
[79] C. N. Hall and J. Garthwaite. What is the real physiological no concentration in vivo?Nitric Oxide: Biolo. Chem., 21:92–103, 2009.
[80] C. Nathan and Q. Xie. Nitric oxide synthases: roles, tolls and controls. Cell, 78:915–918, 1994.

Bibliography 107
[81] H. H. W. Schmidt and U. Walter. No at work. Cell, 78:919–925, 1994.
[82] F. Y. Liew and F.E.G. Cox. Nonspecific defence mechanism: the role of nitric oxide.Immunology Today, 12:A17–A21, 1991.
[83] V. Krischel, D. Bruch-Gerharz, C. Suschek, K. Kroncke, T. Ruzicka, and V. Kolb-Bachofen. Biphasic effect of exogenous nitric oxide on proliferation and differentiationin skin derived keratinocytes but not fibroblasts. Journal of Investigative Dermatology,111:286–291, 1998.
[84] S. Hirano. Nitric oxide-mediated cytotoxic effects of alveolar macrophages on trans-formed lung epithelial cells are independent of the beta2 integrin-mediated intercellularadhesio. Immunology, 93:102–108, 1998.
[85] M. Rajasekaran, W. J. Hellstrom, and S. C. Sikka. Nitric oxide induces oxidative stressand mediates cytotoxicity to human cavernosal cells in culture. Journal of Andrology,22:34–39, 2001.
[86] M. Lepoivre, F. Fieschi, J. Coves, L. Thelander, and M. Fontecave. Inactivation ofribonucleotide reductase by nitric oxide. Biochemical and Biophysical Research Com-munications, 179:442–448, 1991.
[87] N. S. Kwon, D. J. Stuehr, and C. F. Nathan. Inhibition of tumor cell ribonucleotidereductase by macrophage-derived nitric oxide. Journal of Experimental Medicine,174:761–767, 1991.
[88] P. Wentworth, J. E. McDunn, A. D. Wentworth, C. Takeuchi, J. Nieva, T. Jones,C. Bautista, J. M. Ruedi, A. Gutierrez, K. D. Janda, B. M. Babior, A. Eschenmoser,and R. A. Lerner. Evidence for antibody-catalyzed ozone formation in bacterial killingand inflammation. Science, 298:2195–2199, 2002.
[89] N. Ahmad, R. C. Srivastava, R. Agarwal, and H. Mukhtar. Nitric oxide synthaseand skin tumor promotion. Biochemical and Biophysical Research Communication,232:328–331, 1997.
[90] M. M. Cals-Grierson and A. D. Ormerod. Nitric oxide function in the skin. NitricOxide: Biolo. Chem., 10:179–193, 2004.
[91] A. B. Shekter, R. K. Kabisov, A. V. Pekshev, N. P. Kozlov, and Yu. L. Perov. Exper-imental and clinical validation of plasmadynamic therapy of wounds with nitric oxide.Bulletin of Experimental Biology and Medicine, 126:829–834, 1998.
[92] J. R. Quain. Ozone treatment of wounds. Lancet, 235:1028–1029, 1940.
[93] A. Zimran, G. Wasser, L. Forman, T. Gelbart, and E. Beutler. Effect of ozone on redblood cell enzymes and intermediates. Acta Haematologica, 102:148–151, 1999.
[94] G. Valacchi, V. Fortino, and V. Bocci. The dual action of ozone on the skin. BritishJournal of Dermatology, 153:1096–1100, 2005.
[95] F. Sweet, M. S. Kao, S. C. Lee, W. L. Hagar, and W. E. Sweet. Ozone selectivelyinhibits growth of human cancer cells. Science, 209:931–933, 1980.

108 Bibliography
[96] K. S. Zaenker and R. Kroczek. In vitro synergistic activity of 5-fluorouracil withlow-dose ozone against a chemoresistant tumor cell line and fresh human tumor cells.Chemotherapy, 36:147–154, 1990.
[97] J. M. Williamson, D. D. Trump, P. Bletzinger, and B. N. Ganguly. Comparison ofhigh-voltage ac and pulsed operation of a surface dielectric barrier discharge. J. Phys.D: Appl. Phys., 39:4400, 2006.
[98] I. Stefanovic, N. K. Bibinov, A. A. Deryugin, I. P. Vinogradov, A. P. Napartovich, andK. Wiesemann. Kinetics of ozone and nitric oxides in dielectric barrier discharges ino2/nox and n2/o2/nox mixtures. Plasma Sources Sci. Tech., 10:406, 2001.
[99] Y. Itikawa, A. Ichimura, K. Onda, K. Sakimoto, K. Takayanagi, Y. Hatano, M. Hayashi,H. Nishimura, and S. Tsurubuchi. Cross sections for collisions of electrons and photonswith oxygen molecules. J. Phy. Chem. Ref. Data, 18:23–42, 1989.
[100] M. Castillo, V. J. Herrero, I. Mendez, and I. Tanarro. Spectrometric and kinetic studyof a modulated glow air discharge. Plasma Sources Sci. Tech., 13:343–350, 2004.
[101] A. I. Zhakarov. Soviet Journal of Plasma Physics, 14:191, 1988.
[102] S. Mukkavilli, C. K. Lee, K. Varghese, and L. L. Tavlarides. Modeling of the electro-static corona discharge reactor. IEEE Transactions in Plasma Science, 16:652, 1988.
[103] M. J. McEwan and L. F. Philipps. Chemistry of the Atmosphere. Arnold, London,1975.
[104] R. Atkinson, D. L. Baulch, R. A. Cox, R. F. Hampson, J. A. Kerr, and J. Troe.Evaluated kinetic and photochemical data for atmospheric chemistry: Supplement iii.iupac subcommittee on gas kinetic data evaluation for atmospheric chemistry. J. Phy.Chem. Ref. Data, 18:881, 1989.
[105] A. C. Gentile and M. J. Kushner. Reaction chemistry and optimization of plasmaremediation of nxoy from gas streams. Journal of Applied Physics, 78:2074, 1995.
[106] M. E. Fraser and L. G. Piper. Product branching ratios from the nitrogen(a3.sigma.u+) + oxygen interaction. Journal of Physical Chemistry, 93:1107, 1989.
[107] J. T. Herron. Evaluated chemical kinetics data for reactions of (n2d), (n2p), and n2(a3
sigma u +) in the gas phase. J. Phy. Chem. Ref. Data, 28:1453–1483, 1999.
[108] T.R. Marrero and E. A. Mason. Gaseous diffusion coefficients. J. Phys. Chem. Ref.Data, 1:3–118, 1972.
[109] B. Eliasson, M. Hirth, and U. Kogelschatz. Ozone synthesis from oxygen in dielectricbarrier discharges. J. Phys. D: Appl. Phys., 20:1421–1437, 1987.
[110] F. Kohlrausch. Praktische Physik, volume 3. B.G. Teuber,Stuttgart, 1996.
[111] P. Rajasekaran, P. Mertmann, N. Bibinov, D. Wandke, W. Vioel, and P. Awakow-icz. Dbd plasma source operated in single-filamentary mode for therapeutic use indermatology. J. Phys. D: App. Phys., 42:225201, 2009.

Bibliography 109
[112] US Food and Drug Administration (FDA). Code of Federal Regulations. FDA, revisedapril 2006 edition, 1976.
[113] T. R. Coven, L. H. Burack, P. Gilleaudeau, M. Keogh, M. Ozawa, and J. G.Krueger. Narrowband uv-b produces superior clinical and histopathological resolutionof moderate-to-severe psoriasis in patients compared with broadband uv-b2. Archivesof Dermatology, 133:1514–1522, 1997.
[114] J. Krutmann, W. Czech, T. Diepgen, R. Niedner, A. Kapp, and E. Schopf. High-dose uva1 therapy in the treatment of patients with atopic dermatitis. J. Am. Acad.Dermatol., 26:225–230, 1992.
[115] H. Stege, M. Berneburg, S. Humke, M. Klammer, M. Grewe, S. Grether-Beck,R. Boedeker, T. Diepgen, K. Dierks, G. Goerz, T. Ruzicka, and J. Krutmann. High-doseuva1 radiation therapy for localized scleroderma. J. Am. Acad. Dermatol., 36:938–944,1997.
[116] Y. H. Kishan Kumar, G. Raghu Rama Rao, K.V.T Gopal, G. Shanti, and K. Veerab-hadra Rao. Evaluation of narrow-band uvb phototherapy in 150 patients with vitiligo.Indian Journal of Dermatology Venerolgy and Leprology, 75 :162–166, 2009.
[117] M. Hannuksela, J. Karvonen, M. Husa, R. Jokela, L. Katajamaki, and M. Leppisaari.Ultraviolet light therapy in atopic dermatitis. Acta. Derm. Venereol. Suppl.(Stockh),114:137–139, 1985.
[118] J. Jekler and O. Larko. Combined uva-uvb versus uvb phototherapy for atopic der-matitis: a paired-comparison study. Journal of the American Academy of Dermatology,22:49–53, 1990.
[119] H. Halfmann, B. Denis, N. Bibinov, J. Wunderlich, and P. Awakowicz. Identification ofthe most efficient vuv/uv radiation for plasma based inactivation of bacillus atrophaeusspores. J. Phys. D: Appl. Phys., 40:5907–5911, 2007.
[120] H. Halfmann. Ph.D thesis: Characterization of low pressure double inductively coupledplasmas determination of fundamental sterilization mechanism and surface modifica-tion of medical materials. Ruhr-University Bochum, 2008.
[121] K. V. Kozlov, H.-E. Wagner, R. Brandenburg, and P. Michel. Spatio-temporally re-solved spectroscopic diagnostics of the barrier discharge in air at atmospheric pressure.J. Phys. D: Appl. Phys., 34:3164, 2001.
[122] Y. P. Raizer. Gas discharge physics. Springer-Verlag, Berlin, Heidelberg, New York,1997.
[123] J. A. Kiernan. Histological and Histochemical Methods:Theory and Practice. ScionPublishing, UK, 4th edition edition, 2008.
[124] P. Rajasekaran, C. Oplaender, D. Hoffmeister, N. Bibinov, C. V. Suschek, D. Wandke,and P. Awakowicz. Characterization of dielectric barrier discharge (dbd) on mouse andhistological evaluation of the plasma-treated tissue. Plasma Processes and Polymers,8:246–255, 2011.

- 110 Bibliography
[125] V. A. Feoktistov, D.V. Lopaev, K.S. Klopovsky, A.M. Popov, O.B. Popovicheva, A.T.Rakhimov, and T.V. Rakhimova. Low pressure rf discharge in electronegative gasesfor plasma processing. Journal of Nuclear Materials, 309:200, 1993.
[126] ICNIRP Statement. Guidelines on limits of exposure to ultraviolet radiation of wave-lengths between 180 nm and 400 nm (incoherent optical radiation). Health Physics,87:171, 2004.
[127] P. Rajasekaran, P. Mertmann, N. Bibinov, D. Wandke, W. Vioel, and P. Awakowicz.Filamentary and homogeneous modes of dielectric barrier discharge (dbd) in air: Inves-tigation through plasma characterization and simulation of surface irradiation. PlasmaProcesses and Polymers, 7:665, 2010.
[128] F. Massines, A. Rabehi, P. Decomps, R. B. Gadri, P. Segur, and C. Mayoux. Exper-imental and theoretical study of a glow discharge at atmospheric pressure controlledby dielectric barrier. Journal of Applied Physics, 83:2950, 1998.

Appendix A A - 111
Appendix
Reduced electric field (E/N), electron density (ne) and rate constants for electron impactdissociation (kdiss) and excitation (kexc) of nitrogen and oxygen molecules and metastablesat different inter-electrode distances (d) for filamentary and homogenous discharge modesobtained using conductive (aluminium and PBS solution) and non-conductive (glass) counterelectrodes.

A - 112 Appendix ACounterelectro
de
dE/N
ne
kdiss.N
2kdiss.O
2kexc.N
2(A
3Σ
+ u)
kexc.O
2(a
1∆)
kexc.O
2(b
1Σ)
mm
Td
m−3
10−15m
3s−
1
Spike
0.50
430
4.17
·102
15.46
11.45
1.07
0.947
0.225
1.00
400
2.37
·102
14.93
10.92
1.02
0.943
0.223
1.50
370
1.57
·102
14.28
10.04
0.85
0.936
0.221
Water
1.50
330
1.31
·102
13.37
8.95
0.846
0.921
0.217
Aluminium
0.50
330
8·102
13.3
8.87
0.84
0.92
0.216
1.00
310
7·102
12.9
8.29
0.78
0.91
0.214
1.50
300
5·102
12.7
8.00
0.76
0.90
0.212
PBSso
lution
0.50
380
3·102
14.4
10.25
0.97
0.94
0.222
1.00
360
2·102
13.9
9.71
0.92
0.93
0.220
1.50
330
9·102
03.3
8.87
0.84
0.92
0.216
Glass
0.50
360
4.3·101
74.1
9.9
0.93
0.934
0.220
1.00
320
3.7·101
73.2
8.78
0.83
0.919
0.216
Mouse
0.50
275
9.22
·101
62.39
7.39
0.69
0.89
0.210
1.00
265
9.02
·101
62.18
7.05
0.66
0.88
0.210
Table1:
Plasm
aparametersandrate
constantsforsingle-filamentary
(withSpike
andWater),stochastic-filamentary(w
ithAluminium
andPBS
solution)andhomogeneous
DBD
modes(w
ithGlass
andMouse).

Acknowledgement
I express my deepest and sincere gratitude to my supervisors Prof. Dr. P. Awakowicz andProf. Dr. R.-P. Brinkmann for their invaluable guidance and encouragement which has helpedme to bring out this dissertation successfully.
I am thankful to our Senior Scientist Dr. N. Bibinov for the extensive discussions on plasmadiagnostics and more. I would like to share with him the credits of this work.
It is a pleasure to thank my colleagues at the Institute for Electrical Engineering and PlasmaTechnology (AEPT) and other associated institutes for helping me to conduct several exper-iments.
I would like to thank Prof. Dr. C.V. Suschek (Universitatsklinikum, RWTH Aachen) andhis team for helping us to perform experiments on mouse and for carrying out biologicalevaluation of the plasma-treated tissue.
My sincere thanks to Dr. Deborah O’ Connell and Lucas Shaper from Queen’s UniversityBelfast (Northern Ireland) for their efforts in realizing optical diagnostics of DBD deviceusing Photomultiplier. At this juncture, I wish to also thank the Research School of Ruhr-Universiat Bochum for the financial support for Dr. O’Connell’s visit through the ‘Doc 2Doc’ programme.
My special thanks to the team of Central Co-ordination Office of the Research School-RuhrUniversitat Bochum for their kind support and advice without which this research stay inBochum would not have been possible.
I am indebted to my family for their constant motivation and support which keeps me atmy best.
Financial support by the following organizations is gratefully acknowledged:
i) German Federal Ministry of Education and Research (BMBF) within the framework ofthe project entitled ‘Desinfektion, Entkeimung und biologische Stimulation der menschlichenHaut durch gesundheitsfoerdernde Licht- und Plasmaquellen - BioLiP’ (FKZ: 13N9088-9094,2006-2009),
ii) German Research Foundation (DFG) within project C2 (AW 7/1-1) of Research Group‘FOR1123 - Physics of Microplasmas’, and
iii) the Research School of Ruhr-Universitat Bochum funded by Germany’s Excellence Ini-tiative (DFG GSC 98/1),


Lebenslauf
Name: Priyadarshini Rajasekaran
Adresse: Laerholzstr. 21
D-44801 Bochum
C/o. A. Ramasamy,
Ethilodu Post, Nilakkottai Taluk, Dindigul District 624219
India
Geburtstag: 03. Dezember 1981
Geburtsort: Madurai (Indien)
Nationalität: Indisch
Familienstand: verheiratet
Werdegang:
06/1985 – 04/1999 Mahatma Montessori Matriculation Higher Secondary
School, Madurai (Indien)
06/1999 – 04/2003 Bachelor (B. Tech) in Textile Technology
SSM College of Engineering, Namakkal (Indien)
Bachelorarbeit: “Processing of grey fabric garments”
07/2003 – 06/2005 Master (M. Tech) in Textile Technology
PSG College of Technology, Coimbatore (Indien)
Masterarbeit: “Fabrication of bio-absorbable textile
composite for orthopedic application”
06/2005 – 11/2006 Lektorin in Kumaraguru College of Technology,
Tamil Nadu, Indien
01/2008 – heute Wissenschaftlicher Mitarbeiterin
Lehrstuhl für Allgemeine Elektrotechnik und Plasmatechnik
Prof. Dr. P. Awakowicz
Ruhr-Universität Bochum