atomic line filter for i sdi applications · atomic line filter for ... atomic vapor cell to obtain...
TRANSCRIPT
II AD-A284 125
13 April 1994
1Ther-no Trex CorporaIis Copy No. 14
I
Atomic Line Filter forSDI ApplicationsITechnial Report forContract No. N00014-89-C-0068
II
Prepared for:
Commanding Officer .Guy BeaghlerNCCOSC-RDTE-DIV-80453570 Silvergat Aveu~e(,Rm. 2070 ELECTE I
San Diego, CA 92152-5070 EET
S UG 3 11994DI SAG UPrepared by:
Jim MendersThermoTrex Corporation9550 Distribution Avenue 4-27992San Diego, CA 92121-2305(619) 578-S585llIE III \O6
I DrIC QUALM TNSPVCm D 5
S.94 8 30 018

SECURITY CLASSIFICATION OF THIS PAGE
REPORT DOCUMENTATION PAGEIla. REPORT SECURITY CLASSIFICATION lb. RESTRICTIVE MARKINGS
UNCLASSIFIED2a. SECURITY CLASSIFICATION AUTHORITY 3. DISTRIBUTION / AVAILABILITY OF REPORT
2b. DECLASSIFICATION I DOWNGRADING SCHEDULE
4. PERFORMING ORGANIZATION REPORT NUMBER(S) 5. MONITORING ORGANIZATION REPORT NUMBER(S)
TTC-2847-R
6a. NAME OF PERFORMING ORGANIZATION 6b. OFFICE SYMBOL 7a. NAME OF MONITORING ORGANIZATION(if applicable)
ThermoTrex Corporation TIC Office of Naval Research6c. ADDRESS (City. State, and ZIP Code) 7b. ADDRESS (City, State, and ZIP Code)
9550 Distribution Avenue c/o NCCOSC-RDTE-DIV-804Sa9550 Distriton C A ve53570 Silvergate Avenue, Rm. 2070San Diego, CA 92123 San Diego, CA 92152-5070
8a. NAME OF FUNDING / SPONSORING 8b. OFFICE SYMBOL 9. PROCUREMENT INSTRUMENT IDENTIFICATION NUMBERORGANIZATION (if applicable)
Strategic Defense Initiative Organization SDIO N00014-89-C-0068
8c. ADDRESS (City, State. and ZIP Code) 10. SOURCE OF FUNDING NUMBERS
800 North Quincy Street PROGRAM PROJECT TASK WORK UNIT
Arlington, VA 22217-5000 ELEMENT NO. NO. NO. ACCESSION NO.
11, TITLE (Include Security Classification)
Atomic Line Filter for SDI Applit:ations
12. PERSONAL AUTHOR(S)J. Menders, S.H. Bloom, E, Korevaar, M. Rivers, C.S. Liu, P. Searcy, K. Choi
13a. TYPE OF REPORT 13b. TIME COVERED 14. DATE OF REPORT (Year, Month Day) 15. PAGE COUNTFinal FROM 3/89 TO_____ /944 '- ,,' /9 3
16. SUPPLEMENTARY NOTATION
17. COSATI CODES 18. SUBJECT TERMS (Continue on reverse if necessary and identify by block number)
FIELD GROUP SUB-GROUP Atomic line filter, alkali metal vapor, Faraday filter, active optical filter,
laser pumped filter, magneto-optic filter, laser communicatons
19. ABSTRACT (Continue on reverse if necessary and identify by block number)
When optical signals are embedded in background noise, narrowband optical filters are needed for receivers to achieve quantumlimited performance. Such is typically the case with daytime optical communications and lidar. Narrowband filtered detectors,with acceptance bands of just a few picometers (pm) and high out of band rejection are well suited for these applications. Themain thrust of this program has been the development of two means for narrowband detection: the Fast Atomic Line Filter/Field Ion Detector (FALF/FID) and the Faraday magneto-optic filter. The FALF/FIDs transduce optical radiation within anarrow band directly into electrical signals. They are laser pumped filters based on the spectroscopy of atomic vapors. Wedesigned, built and tested an infrared FALF/FID with an rise time of under 10 ns and a quantum efficiency of >25%. Faradayfilters are imaging magneto-optic filters with passbands of a few pm. Faraday filters with passbands in the visable and the nearinfra-red were constructed and tested. Transmission spectra were measured, and found to agree closely with theoreticalpredictions.
Both of these narrowband detection schemes must be used in conjunction with a tuned narrowband laser source. We developeda frequency locked alexandrite laser designed to match the acceptance band of a rubidium based filter. Finally, a preliminarydemonstration of a laser interrogator using a tuned infrared diode laser in conjunction with a filtered receiver was demonstrated.
20. DISTRIBUTION I AVAILABILITY OF ABSTRACT 21. ABSTRACT SECURITY CLASSIFICATION
[0 UNCLASSIFIED/UNLIMITED 0 SAME AS RPT. 0 DTIC USERS Unclassified22a. NAME OF RESPONSIBLE INDIVIDUAL 22b. TELEPHONE (Include Area Code) 22c. OFFICE SYMBOL
James H. Menders (619) 578-58850D FORM 1473, 84 MAR 83 APR edition may be used until exhausted. SECURITY CLASSIFICATION OF THIS PAGE
All other editions are obsolete.
U* TABLE OF CONTENTS
IIn tro d u c tio n ...................................................................................... I
1 1. Fast Atomic Line Filter ............................................................ 4
1.1 Fast Atomic Line Filter/Field Ionization Detector* .............................5
1.2 A Blue-Green Fast Atomic Line Filter/Field Ionization Detector ....... 8
2 . Intrinsic N oise ............................................................................ 22
2.1 Active Atomic Line Filter Intrinsic Noise Measurements ......................... 23
1 3. Faraday Filter .......................................................................... 35
3.1 Ultranarrow Line Filtering Using a Cs Faraday Filter at 852 nm* .............. 36
3.2 Blue Cesium Faraday and Voigt Magneto-Optic Atomic Line Filters* .......... 39
3.3 Sodium-Vapor Dispersive Faraday Filter* ......................................... 42
4. Locked Laser ......................................................................... 45
3 4.1 A Q-Switched Alexandrite Laser Injection Seeded by a RubidiumAbsorption Frequency Matched Diode Laser* ..................................... 46
5. Combat ID ............................................................................. 52
5.1 Combat Identification Using a Faraday Filter ...................................... 53
n Accesion ForNTIS CRA&MDTIC TABIUnannounced i .•
*Previously published scientific paper. Justification
S~~By ...
Dist ibution I
3 Availability Codes
Avail and / orDist Special
-7
I 2847-R iii

II
ATOMIC LINE FILTER FOR SDI APPLICATIONS
I INTRODUCTION
SI When optical signals are embedded in background noise, r irrowband optical filters are
needed for receivers to achieve quantum limited performance. Such is typically the casewith daytime optical communications and lidar. Narrowband filtered detectors, with
acceptance bands of just a few picometers (pm) and high out of band rejection are well3 suited for these applications. At the start of this program, the narrowband filters that had
received the greatest attention were the birefringent and the atomic line (or resonance) filters
(ALF). ALFs are a class of filter which use an atomic absorption .line provided by an
atomic vapor cell to obtain a narrow spectral response to signal photons. In the survey of
the state o'f the art in ALFs by Gelbwachs in Ref. 1, a variety of filters using alkali metal
and earth elements were described. The simplest of the filters cited was passive, in contrast
to the active filters which required the introduction of optical pumps to activate the filter.
This program investigated two new types of filters, addressed the issue of inrinsic-noise
i common to active ALFs, developed an injection seeded near infrared laser matched to an
ALF and demonstrated an atomic line filter application.
I NEW FILTERS
I We invented a new type of active filter called the Fast Atomic Line Filter/ Field Ion Detector
(FALF/FID). The FALF/FIDs transduce optical radiation within a narrow frequency band3 directly into electrical signals. They are laser pumped filters based on the spectroscopy of
atomic vapors. We designed, built and tested an infrared FALF/FID at 780 nm with a rise3 time of under 10 ns and a quantum efficiency of >25%. We were among the first to
recongnize the potential of the Faraday filter for free space laser communications. Faraday
filters are imaging magneto-optic filters with passbands of a few pm. Faraday filters with
passbands in the visable and the near infra-red were constructed and tested. Transmissionspectra were measured, and found to agree closely with theoretical predictions.
2847-R
INTRINSIC NOISE
"Intrinsic noise" in the context of active ALFs refers to the apparent signal caused by theapplication of the optical pump needed to activate the filter. The intrinsic noise associated
with a filter depends on the vapor spectroscopy and the degree of pumping necessary to
activate it. To evaluate the potential of active rubidium and cesium-thallium ALFs, we
performed intrinsic noise measurements.
FILTER MATCHED LASERIThe narrowband detection schemes we investigated must be used in conjunction with a
tuned narrowband laser source. We developed a frequency locked alexandrite laser
designed to match the acceptance band of a passive rubidium based filter near 780 nm. The
laser featured a electro-optically frequency locked diode laser for use as an injection seeder.
MATCHED OPTICAL TRANSCEIVERIFinally, a preliminary demonstration of components of an optical combat identification
system using a Faraday filter were demonstrated. The system was designed to read
intensity modulations impressed in a beam retroreflected by an optical responder. The
system featured a frequency locked infrared diode laser (852 nm) used in conjunction with
a filtered receiver. The interrogator laser frequency locking was accomplished using a
Voigt filter (a second magneto-optic atomic line filter related to the Faraday filter) in an
I optical feedback scheme.
This final report is divided into five sections that collect the main results of this work: (1)
Fast Atomic Line Filter, (2) Intrinsic Noise, (3) Faraday Filter, (4) Locked Laser and (5)
Combat ID. Sections 1, 3 and 4 contain reprints of scientific papers that describe our
results. Section 2 was adapted from an oral presentation originally give by P. Searcy at
3 LASERS '90, San Diego.
2847-R 2
m REFERENCES
n 1. Jerry A. Gelbwachs, "Atomic Resonance Filters," IEEE J. Quantum Electron., 24 (7),I 1266 (1988).
IIIUIIIIIIIII
1 ~ 2847-R3

IIII .Fs tmi ieFle
II
i
I87-
i 294 OPTICS LETTERS / Vol. 15. No. 5 / March 1. 1990
i Fast atomic line filter/field ionization detector
U S. H. Bloom, Eric Korevaar, M. Rivers, and C. S. Liu
Thermo Electron Technologies, San Diego, California 92121-2305
Received October 20. 1989: accepted December 26. 1989
An experimental demonstration of a fast atomic line filter/field ionization detector (FALF/FID) is presented. TheFALF/FID detects incoming signal photons by resonant absorption in an atomic vapor cell containing a strongelectric field. Excited atoms are electric-field ionized after further excitation to a Stark-shifted Rydberg level by apump laser tuned to a resonance in the ionization spectrum, providing an observed enhancement in the ionizationrate of ten times ovL, the continuum ionization threshold. Preliminary measurements of time response (<10 nsec)and quantum efficiency (>25%) indicate that with optimization the FALF/FID will provide high quantum efficien-cy, fast time response, and narrow-linewidth detection.
- Atomic line filters operating at various wavelengths multiplier. The field-ionizing level has enough energyfrom the near IR to the near UV have been extensively classically to ionize in the presence of the electric field,studied, since they are at present the narrowest-band- but this ionization is not immediate, and semidiscretewidth optical detectors available.1. 2 Their narrow states still exist. Transitions to these states have sig-bandwidth and relatively high sensitivity make them nificantly higher cross sections than transitions to theextremely useful for detecting weak, narrow-band ra- surrounding continuum. Typical widths of thesediation embedded in a large continuous background. semidiscrete levels have been measured5 and dependCommon to all these filters is internal wavelength con- on the azimuthal quantum number ml in the directionversion by optical atomic transitions and subsequent of the electric field. Widths of Imrl = 0 levels are 1-3
detection of the converted radiation. In this Letter cm- 1 (1 cm- 1 = 30 GHz), those of Imil = 1 are 1-3 GHz,we describe what is to our knowledge the first experi- and tmJI = 2 have widths of <100 MHz. (An ionizationI mental demonstration in a vapor cell of a fast atomic time constant of -,1 nsec corresponds to a width of -- 1line filter/field ionization detector (FALF/FID) that GHz.) For transitions from Rb (5p) to the ionizationselectively ionizes atoms that have absorbed signal threshold the cross section has been calculated6 to beradiation and then detects these ions (or electrons). _10-17 cm 2. For a transition rate of 1/2.5 nsec thisThis filter has the advantages of extremely fast re- requires a pump intensity of 4 X 1025 photons/cm2 sec,sponse time and an inherently higher overall quantum which at 480 nm corresponds to 17 MW/cm2 . Theefficiency than fluorescence-based filters. (While we transition cross section to an n - 20, Iml = 1 Starkwere preparing this manuscript, a proposal for such a level can be roughly estimated by assuming adetector appeared in Optics Letters.3) linewidth of 1.5 GHz and an upper-state splitting into
The main drawback of using direct photoionization 20 levels with Iml = 1 asin an atomic line filter is that high pump laser intensi- 1 A 1 Ities are needed for a fast transition rate to the continu- o = - 1.4 X 10⁻¹⁶ cm 2, (1)um, which in turn induces intrinsic noise from two- 20 8irc (1/k ac)3 AWphoton ionization. The FALF/FID uses a novel where A - 4.5 X 10⁴ sec-1 for 5 P3/2 - 20d transitions.scheme whereby the high pump intensity requirement This represents a factor-of-10 improvement over di-is alleviated by an order of magnitude by making tran- rect ionization. (Similar enhancements are expectedsitions to semidiscrete Stark-shifted Rydberg levels inan electric field, using the electric field for field ioniza-tion and electron/ion collection, a well-studied phe-nomenon in atomic beams. 4
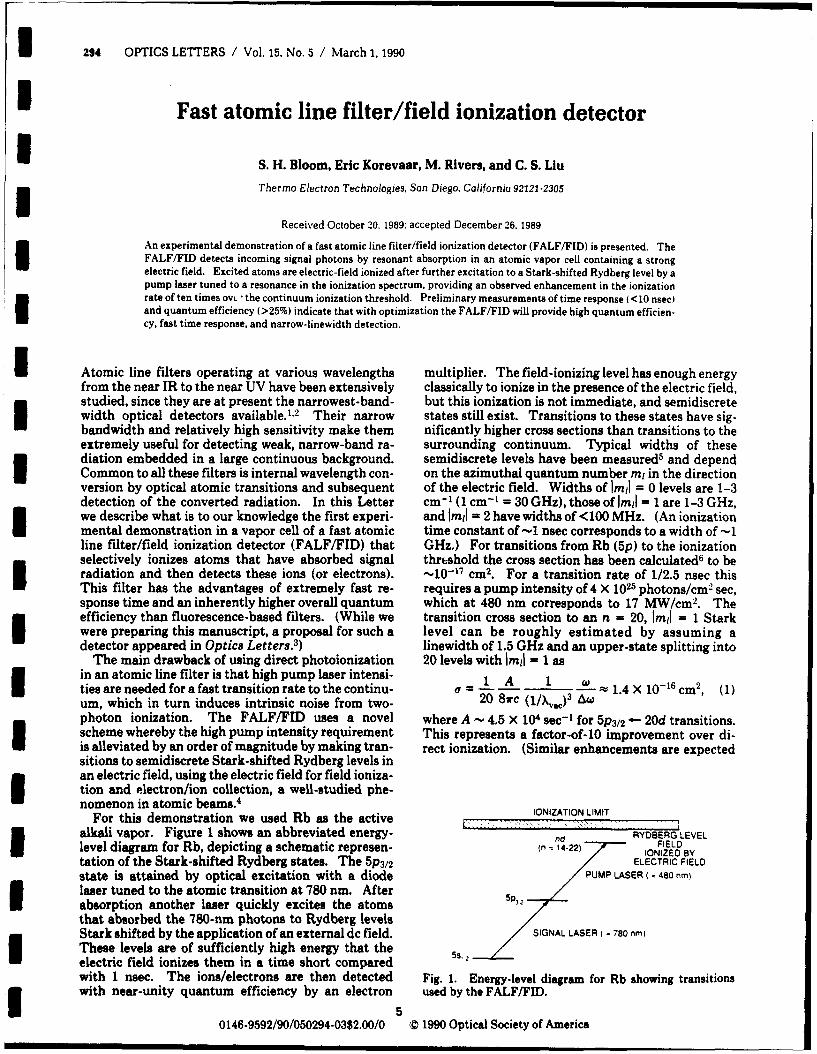
For this demonstration we used Rb as the active IONIZATION LIMITalkali vapor. Figure 1 shows an abbreviated energy- nd RYOBERG LEVELlevel diagram for Rb, depicting a schematic represen-In ( 14-22) IONIZELDBY
tation of the Stark-shifted Rydberg states. The 5P3/2 ELECTRIC FIELDstate is attained by optical excitation with a diode PUMP LASER 480 nm)laser tuned to the atomic transition at 780 nm. After 5p3,absorption another laser quickly excites the atomsthat absorbed the 780-nm photons to Rydberg levelsStark shifted by the application of an external dc field. SIGNAL LASER I - 780 nm)These levels are of sufficiently high energy that theelectric field ionizes them in a time short comparedwith 1 nsec. The ions/electrons are then detected Fig. 1. Energy-level diagram for Rb showing transitionswith near-unity quantum efficiency by an electron used by the FALF/FID.
0146-9592/90/050294-03$2.00/0 © 1990 Optical Society of America
March 1, 1990 / Vol. 15, No. 5 / OPTICS LETFERS 295
an attached electric-field grid and are absorbed in ashort distance by the Rb vapor. A second electric-field grid, attached to the electron multiplier, provides.. both a uniform electric field to the interaction regionand an accelerating potential for any ions or electrons
"produced (depending on the sign of the applied volt-I age). Tunable (475-492 nm), narrow-band (0.1 cm-'pS...'=- - .pump laser light from a 10-pJ, 10-nsec XeCl-laser-
'. pumped grazing-incidence dye laser" is focusedI .through the interaction region. Ion (or electron) sig-"nals from photoionization of the excited Rb 5p 2 at-
...... - ..... oms are amplified by the electron multiplier and mon-itored as a function of pump laser wavelength. Theoutput signal, processed with a gated integrator andnormalized to the pump laser intensity, is recorded:-• ... •"with a strip-chart recorder. The pump laser wave-I .length is monitored with a high-resolution spectrome-ter. Although the FALF/FID has a faster time re-sponse in the electron collection mode, preliminary
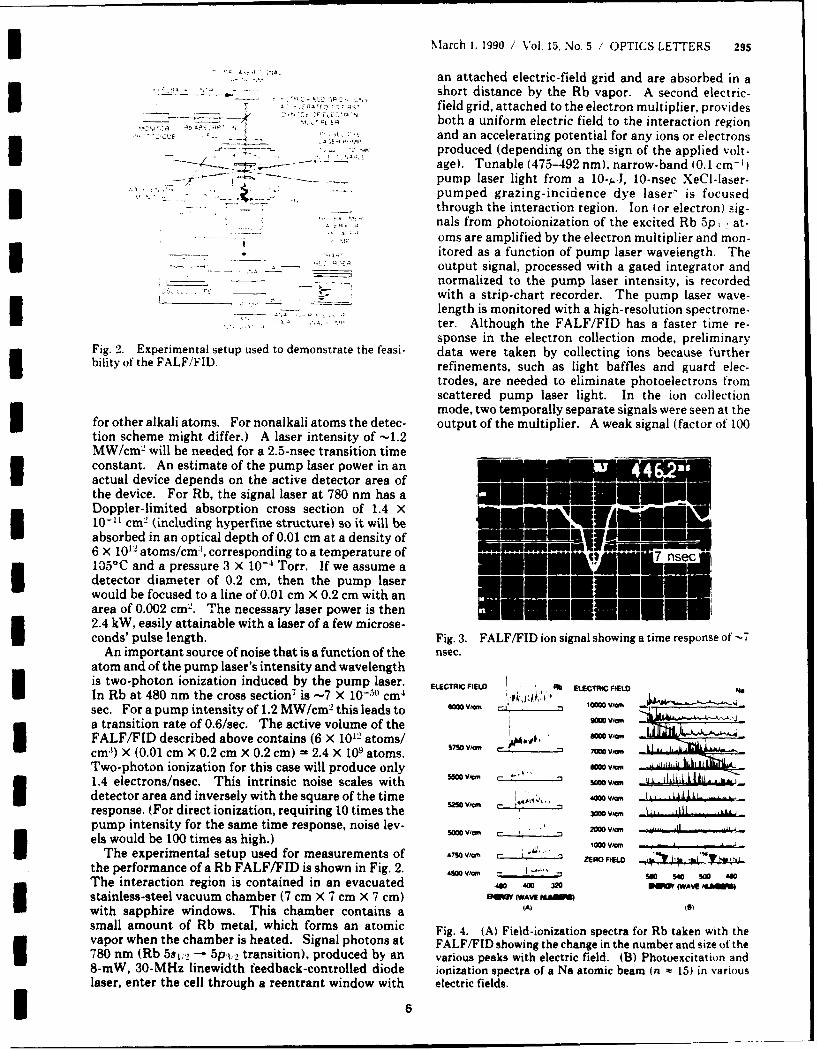
Fig. 2. Experimental setup used to demonstrate the feasi- data were taken by collecting ions because furtherbility of the FALF/FID. refinements, such as light baffles and guard elec-
trodes, are needed to eliminate photoelectrons fromscattered pump laser light. In the ion collectionmode, two temporally separate signals were seen at the
for other alkali atoms. For nonalkali atoms the detec- output of the multiplier. A weak signal (factor of 100tion scheme might differ.) A laser intensity of -1.2
MW/cm2 will be needed for a 2.5-nsec transition timeconstant. An estimate of the pump laser power in an _.
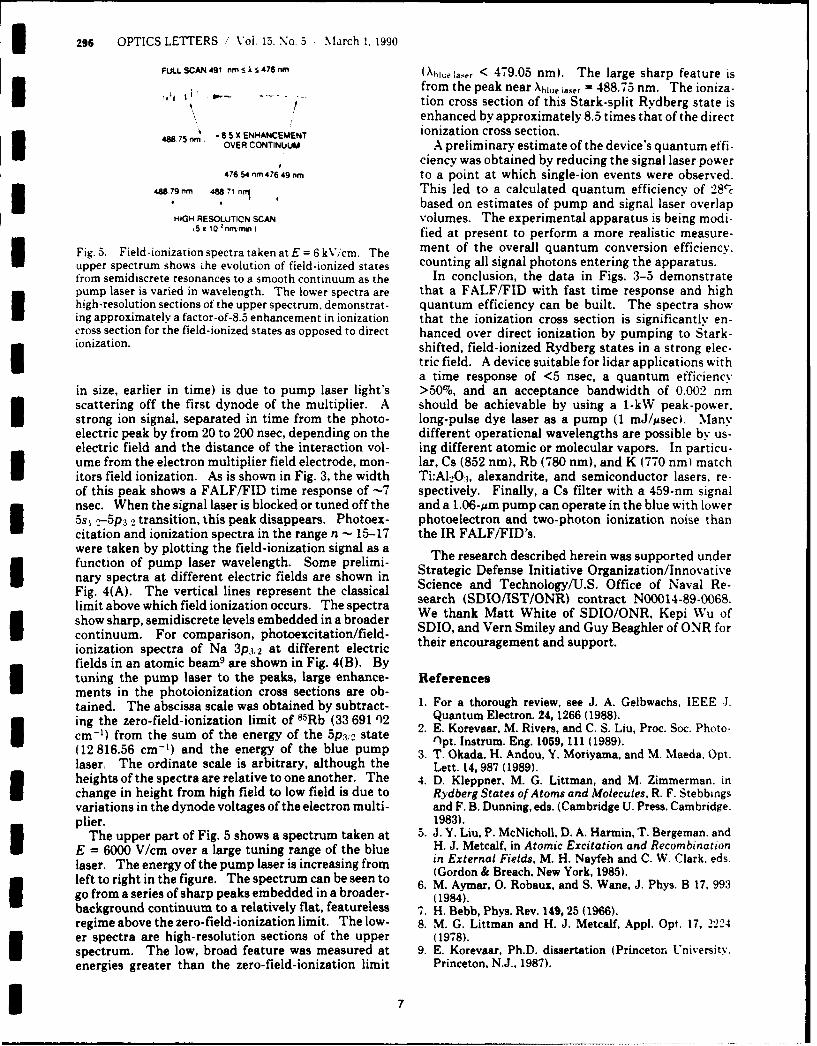
actual device depends on the active detector area ofthe device. For Rb, the signal laser at 780 nm has a n u10-pl cm 2 (including hyperfine structure) so it will beDople-11 (nluimite absorption ctrosusction) sof 1.4 wilbeMabsorbed in an optical depth of 0.01 cm at a density of6 x 1012 atoms/cm-, corresponding to a temperature of105°C and a pressure 3 x 10⁻¹ Torr. If we assume a Mdetector diameter of 0.2 cm, then the pump laser m m mm'flfljwould be focused to a line of 0.01 cm X 0.2 cm with an M EM Om Marea of 0.002 cm2. The necessary laser power is then2.4 kW, easily attainable with a laser of a few microse-conds' pulse length. Fig. 3. FALF/FID ion signal showing a time response of -7
An important source of noise that is a function of the nsec.atom and of the pump laser's intensity and wavelengthis two-photon ionization induced by the pump laser. EECTRC FIELD A EL oIn Rb at 480 nm the cross section- is -7 X 10-50 cm4 . .o,, .'Isec. For a pump intensity of 1.2 MW/cm 2 this leads to WW Via" la- _ U1,v,
a transition rate of 0.6/sec. The active volume of the , ./,FALF/FID described above contains (6 x 10¹² atoms/ s Won
cml) X (0.01 cm X 0.2 cm X 0.2 cm) - 2.4 X 10⁹ atoms. 57,, Vim 7= VIM
Two-photon ionization for this case will produce only [ mo vfaii 4UII!1.4 electrons/nsec. This intrinsic noise scales with SIvM .2... - G mo1,,detector area and inversely with the square of the time 4 00o viWMresponse. (For direct ionization, requiring 10 times the MO• V "", . .... .pump intensity for the same time response, noise lev- . .0 , F 2= ,...els would be 100 times as high.) 100@,, 20 Won: -
The experimental setup used for measurements of 750v, I - , ZERO, FIELDthe performance of a Rb FALF/FID is shown in Fig. 2. ONV,=M 7- n so W ,IThe interaction region is contained in an evacuated .W 4W .o pwn IWA*V r
stainless-steel vacuum chamber (7 cm X 7 cm X 7 cm) VM(WAVE mHUMwith sapphire windows. This chamber contains a (A) (9)
small amount of Rb metal, which forms an atomic Fig. 4. (A) Field-ionization spectra for Rb taken with thevapor when the chamber is heated. Signal photons at FALF/FID showing the change in the number and size ot the780 nm (Rb 5s,;2 -- 5 pV2 transition), produced by an various peaks with electric field. (B) Photoexcitation and8-mW, 30-MHz linewidth feedback-controlled diode ionization spectra of a Na atomic beam (n :e 15) in variouslaser, enter the cell through a reentrant window with electric fields.
* 6
296 OPTICS LETTERS / Vol. 15, No. 5 March 1. 19g0
FULL scAN 491 m sXs476nm (hlue laser < 479.05 nm). The large sharp feature isfrom the peak near Xhlu, iwaer = 488.75 nm. The ioniza-
S- .. .. . tion cross section of this Stark-split Rydberg state isenhanced by approximately 8.5 times that of the direct
-85 X ENHANCEMENT ionization cross section.48875 m. OVER CONTINUUM A preliminary estimate of the device's quantum effi-
I ciency was obtained by reducing the signal laser power47654476 49 nm to a point at which single-ion events were observed.
481 79 nm 4W 71 nni This led to a calculated quantum efficiency of 28%# based on estimates of pump and signal laser overlapHIGH RESOLUTION SCAN volumes. The experimental apparatus is being modi-
ýsx 10 orhman I fied at present to perform a more realistic measure-
Fig. 5. Field-ionization spectra taken at E = 6 kVi'cm. The ment of the overall quantum conversion efficiency.upper spectrum shows ihe evolution of field-ionized states counting all signal photons entering the apparatus.from semidiscrete resonances to a smooth continuum as the In conclusion, the data in Figs. 3-5 demonstratepump laser is varied in wavelength. The lower spectra are that a FALF/FID with fast time response and highhigh-resolution sections of the upper spectrum. demonstrat- quantum efficiency can be built. The spectra showing approximately a factor-of-8.5 enhancement in ionization that the ionization cross section is significantly en-cross section for the field-ionized states as opposed to direct hanced over direct ionization by pumping to Stark-ionization. shifted, field-ionized Rydberg states in a strong elec-
tric field. A device suitable for lidar applications witha time response of <5 nsec, a quantum efficiency.
in size, earlier in time) is due to pump laser light's >50%, and an acceptance bandwidth of 0.002 nmscattering off the first dynode of the multiplier. A should be achievable by using a 1-kW peak-power.strong ion signal, separated in time from the photo- long-pulse dye laser as a pump (1 mJ/usec). Manyelectric peak by from 20 to 200 nsec, depending on the different operational wavelengths are possible by us-electric field and the distance of the interaction vol- ing different atomic or molecular vapors. In particu-ume from the electron multiplier field electrode, mon- lar, Cs (852 nm), Rb (780 nm), and K (770 nm) matchitors field ionization. As is shown in Fig. 3, the width Ti:Al.0:3, alexandrite, and semiconductor lasers. re-of this peak shows a FALF/FID time response of ---7 spectively. Finally, a Cs filter with a 459-nm signalnsec. When the signal laser is blocked or tuned off the and a 1.06-,um pump can operate in the blue with lower5s, -2-5p3 .2 transition, this peak disappears. Photoex- photoelectron and two-photon ionization noise thancitation and ionization spectra in the range n - 15-17 the IR FALF/FID's.were taken by plotting the field-ionization signal as The research described herein was supported underfunction of pump laser wavelength. Some prelimi- the Dese descrive hreinas suppor tenary spectra at different electric fields are shown in Strategic Defense Initiative Organization/InnovativeFig. 4(A). The vertical lines represent the classical Science and Technology/U.S. Office of Naval Re-limit above which field ionization occurs. The spectra search (SDIO/IST/ONR) contract N00014-89-0068.show sharp, semidiscrete levels embedded in a broader We thank Matt White of SDIO/ONR, Kepi Wu ofcontinuum. For comparison, photoexcitation/field- Dhi, and Vern Smiley and Guy Beaghler of ONR forionization spectra of Na 3p3,;2 at different electric their encouragement and support.fields in an atomic beam9 are shown in Fig. 4(B). Bytuning the pump laser to the peaks, large enhance- Referencesments in the photoionization cross sections are ob-tained. The abscissa scale was obtained by subtract- 1. For a thorough review, see J. A. Gelbwachs, IEEE J.ing the zero-field-ionization limit of 85Rb (33 691 )2 Quantum Electron. 24, 1266 (1988).cm-1) from the sum of the energy of the 5p,3/2 state 2. E. Korevaar, M. Rivers, and C. S. Liu, Proc. Soc. Photo-(12 cm 6.56 f m theasumd the energy of the bluestpt. Instrum. Eng. 1059, 111 (1989).(12 816.56 cm-') and the energy of the blue pump 3. T. Okada, H. Andou, Y. Moriyama, and M. Maeda. Opt.
laser, The ordinate scale is arbitrary, although the Lett. 14,987 (1989).heights of the spectra are relative to one another. The 4. D. Kleppner, M. G. Littman, and M. Zimmerman. inchange in height from high field to low field is due to Rydberg States of Atoms and Molecules, R. F. Stebbingsvariations in the dynode voltages of the electron multi- and F. B. Dunning, eds. (Cambridge U. Press, Cambridge.plier. 1983).
The upper part of Fig. 5 shows a spectrum taken at 5. J. Y. Liu, P. McNicholl, D. A. Harmin, T. Bergeman. andE = 6000 V/cm over a large tuning range of the blue H. J. Metcalf, in Atomic Excitation and Recombination
laser. The energy of the pump laser is increasing from in External Fields, M. H. Nayfeh and C. W. Clark. eds.
left to right in the figure. The spectrum can be seen to 6(Gordon & Breach, New York. 1985).goeftrtom asright of sheafgre. Tpeaks rumb d cn abroadere 6. M. Aymar, 0. Robaux, and S. Wane, J. Phys. B 17. 993Igo from a series of sharp peaks embedded in a broader- (1984).background continuum to a relatively flat, featureless 7. H. Bebb, Phys. Rev. 149,25 (1966).
regime above the zero-field-ionization limit. The low- 8. M. G. Littman and H. J. Metcalf, Appl. Opt. 17, 2224er spectra are high-resolution sections of the upper (1978).spectrum. The low, broad feature was measured at 9. E. Korevaar, Ph.D. dissertation (Princeton University.energies greater than the zero-field-ionization limit Princeton, N.J., 1987).
7
UIU A BLUE-GREEN FAST ATOMIC LINE FILTER/FIELD IONIZATION
DETECTORIABSTRACT
A modification of a previously experimentally demonstrated infra-red (IR) fast
atomic line filter/ field ionization detector (FALF/FID) is presented. The modification
changes the signal wavelength from IR to blue-green (455 or 459 nm). The FALF/FID
detects incoming signal photons by resonant absorption in an atomic vapor cell containing a
strong electric field. Excited atoms are electric field ionized after further excitation to a
Stark shifted Rydberg level by a pump laser tuned to a resonance in the ionization
spectrum, providing an observed enhancement in the ionization rate of ten times over the
continuum ionization threshold. We describe the operation of the blue cesium FALF/FID
and our progress towards a feasibility demonstration.
1. INTRODUCTION
Atomic line filters operating at various wavelengths from the near IR to the near UVhave been extensively studied since they are presently the narrowest bandwidth optical
detectors available 1,2. Their narrow bandwidth and relatively high sensitivity make them
extremely useful for detecting weak narrowband radiation such as a laser signal embedded
in a large continuous background. This makes them useful in applications such as LIDAR,
underwater detection, and satellite tracking for example. Common to all of these filters is
internal wavelength conversion via optical atomic transitions and subsequent detection of
the converted radiation. In this paper we propose a modification of a previously
experimentally demonstrated 3 (using rubidium as the active vapor, 780 nm signal) Fast
Atomic Line Filter/Field Ionization Detector (FALF/FID) that selectively ionizes atoms that
have absorbed signal radiation and then detects these ions (or electrons). This filter has the
advantages of extremely fast response time, and since the ions/electrons can be detected
2847-R 8
with near unity quantum efficiency, it has an inherently higher overall quantum efficiency
than fluorescence based filters.
The main drawback of using direct photoionization in an atomic line filter is that
high pump laser intensities are needed for a fast transition rate to the continuum which in
turn induces intrinsic noise due to two photon ionization. The FALF/FID uses a novel
scheme whereby the high pump intensity requirement is alleviated by an order of magnitude
by making transitions to semi-discrete Stark shifted Rydberg levels in an electric field,
using the electric field for field ionization and electron/ion collection, a well studied
phenomenon in atomic beams4 .
The fast time response and high quantum efficiency of this filter make it very useful
for underwater detection applications. The filter time response of < 5 nsec allows the
illuminator pulse to be short, also < 5 nsec which gives good depth resolution (on the order
of 3 x 10⁸ m/sec*5 nsec = 1.5 meters). The operating wavelengths of either 455 or 459
nm have the advantage of optimal deep water transmission. The high quantum efficiency
allows detection of the very low return signal levels, usually a few hundred photons,
typical of underwater objects illuminated with available laser powers at either 455 or 459
nm. In addition, the small acceptance bandwidth (< 0.002 nm) gives the FALF/FID the
high background rejection necessary to detect these signals. The filter is also easily
gateable which allows for the rejection of unwanted return scatter from the illuminator. The
illuminating laser for 459 nm already exists (lead Raman shifted XeCl or dye lasers) and
the illuminator for 455 nm could be the same lasers currently being developed for
submarine laser communications programs. Finally, the pump laser could be a modest
solid state laser, either Nd:YAG at 1.064 g or Nd:BEL at 1.079 or 1.070 g operating at a
few tens of millijoules energy and a few hundred nanoseconds pulselength. The required
pump power could be reduced even further if the pump beam were to be reflected in a
multipass geometry. This allows for the possibility of a very compact system that uses
only one laser source. A fraction of a Nd:BEL beam can be frequency doubled and used to
pump a Ti:Sapphire crystal which, using sum frequency generation with another fraction of
the Nd:BEL beam, is converted to 455 nm producing the illuminator light while the
remaining fraction of the Nd:BEL beam can be used to pump the FALF/FID.
2847-R 9
III
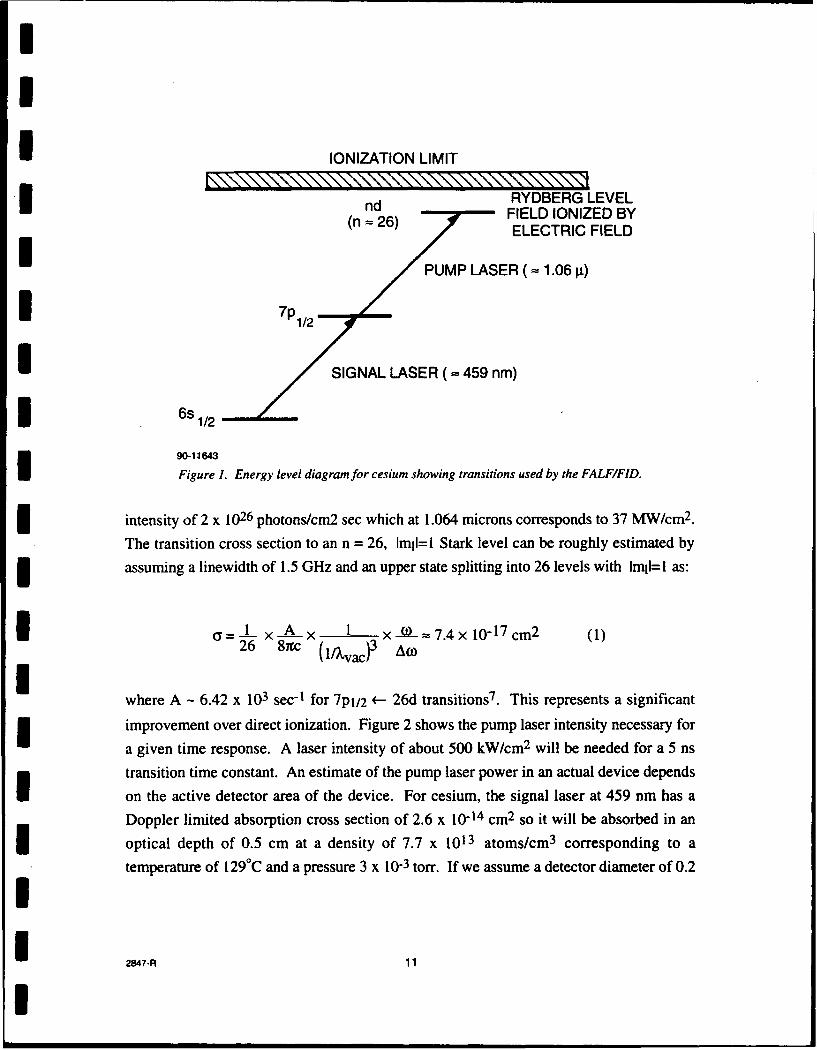
2. OPERATING PRINCIPLE
K For the proposed blue FALFIFID demonstration we will use cesium (Cs) as the
active alkali vapor. In principle one could choose to have the signal laser tuned to the
6s1/2-7p3/2 transition at 455.52 nm or the 6 Sl/2- 7 pl/2 transition at 459.31 nm. For the
proof of principle experiment we will use the 459.31 nm transition since a signal laser at
this wavelength already exists (Pb Raman shifted XeCl) and for detecting this wavelengththe filter's pump can be a Nd:YAG laser operating at 1.064 gI. Figure 1 shows an
abbreviated energy level diagram for Cs, depicting a schematic representation of the Stark-
shifted Rydberg states. The 7 pl/2 state is attained by optical excitation with a laser tuned
to the atomic transition at 459.31 nm. After absorption another laser quickly excites the
atoms that absorbed the 459.31 nm photons to Rydberg levels Stark shifted by the
application of an external D.C. field. For a Nd:YAG pump laser, these levels correspond
to n - 26. The threshold field necessary for field ionization of this level is about E= 700V/cm, which should be easily attainable at the contemplated operating temperature. These
levels are of sufficiently high energy that the electric field ionizes them in a time short
compared to 1 ns. The ions/electrons are then detected with near unity quantum efficiency
by an electron multiplier. The field ionizing level has enough energy classically to ionize
in the presence of the electric field, but this ionization is not immediate and semi discrete
states still exist. Transitions to these states have significantly higher cross sections than
transitions to the surrounding continuum. Typical widths of these semi-discrete levels have
been measured 5 and depend on the azimuthal quantum number ml in the direction of the
eleatic field. Widths of Imil = 0 levels are 1-3 cm-1 (1 cm-1 = 30 GHz), Imill = 1 are 1-3
GHz and Imll = 2 have widths < 100 MHz. [An ionization time constant of -1 ns
corresponds to a width of - 1 GHz].
3 3. PUMP LASER POWER REQUIREMENT
Cross section data for transitions from Cs (7p) to the ionization threshold are notpresently available. The cross section for Cs(6p) to the ionization threshold 6 has been
calculated to be about 10-18 cm 2 . For a transition rate of 1/5 ns this requires a pump
2847.R 10
II
I IONIZATION LIMIT
RYDBERG LEVEL(n FIELD IONIZED BY
ELECTRIC FIELD
I PUMP LASER (= 1.06 g)I 7p 1/2 ,
I SIGNAL LASER (= 459 nm)
6s 1/2
90-13643
Figure 1. Energy level diagram for cesium showing transitions used by the FALFIFID.
3 intensity of 2 x 1026 photons/cm2 sec which at 1.064 microns corresponds to 37 MW/cm 2.
The transition cross section to an n = 26, ImjI=l Stark level can be roughly estimated by
assuming a linewidth of 1.5 GHz and an upper state splitting into 26 levels with Imjl=l as:
I26 -L -- 1 x -- = 7.4x 10⁻¹⁷ cm 2 (1)
26 8-- (1/vac Ao
where A - 6.42 x 10³ sec- 1 for 7 p1/2 +- 26d transitions7 . This represents a significant
improvement over direct ionization. Figure 2 shows the pump laser intensity necessary fora given time response. A laser intensity of about 500 kW/cm 2 will be needed for a 5 ns
transition time constant. An estimate of the pump laser power in an actual device depends
on the active detector area of the device. For cesium, the signal laser at 459 nm has a
Doppler limited absorption cross section of 2.6 x 10⁻¹⁴ cm 2 so it will be absorbed in an
optical depth of 0.5 cm at a density of 7.7 x 10¹³ atoms/cm 3 corresponding to a
temperature of 129°C and a pressure 3 x 10⁻³ torr. If we assume a detector diameter of 0.2I
I ~2847-R 1
I

II
cm, then the pump laser would be focussed to a line of 0.5 x 0.2 cm with an area of 0.1cm 2 . The necessary laser power is then 50 kW, easily attainable with a 15 mJ, 300 ns
laser.
Blue FALFIFID Time Response0 10 A
18
0
U 4
0 500 100C 1500 2000 2500
PUMP LASER INTENSITY (kW/cm 2)
90-11644
I Figure 2. Pump laser intensities necessary for direct and field ionization for a given timeresponse. Also plotted is the four photon ionization noise associated with a given pumpintensity.
At an operating temperature of 129°C the pressure is about 3 x 10⁻³ torr and the
electron mean free path is about 1 meter, much larger than the size of the device, so it
should not suffer any collisions en route to the detector. For a cell size of 0.5 cm and a
1 kV/cm electric field the electron transit time is less than 1 ns, which will have a negligible
effect on the speed of the device.
4. NOISE
I Calculations of four photon8 , thermionic, thermal ionization and photoelectron
noise show that the contribution from each of these possible noise sources is negligible.
I2847-R 12
I

II
Four photon noise produces less than 5.5 x 10⁻⁸ electrons/ns at a 500 kW/cm 2 pump
intensity. The noise contribution from thermionic emission is given by the Richardson-3 Dushman equatio"-. For our case Cs has a work function of 1.81 eV which gives a noise
contribution at 129 'C of < 3 x 10⁻⁶ electrons/cm2 ns, which is negligible. The Boltzmann
factor to the 7pi/2 state is <1 x 10-31 so thermal ionization is not important. Finally, the
energy of photons at 1.064 g. is 1.165 eV, which is less than the work function of cesium
and therefore scattered pumo light producing photoelectrons should not be a problem.
A possible important source of noise could be electrical breakdown due to the high
voltage applied to the accelerating grids and the electron multiplier. Data for low pressure
nitrogen breakdown 9 show that the Paschen curve minimum occurs at an electrode
spacing/pressure product of about 10-3 atm-cm. For a 1 cm electrode spacing, typical for
the FALF/FID, the breakdown voltage is about 104 volts at 3 x 10⁻³ torr, or 104 volts/cm.
The blue FALF/FID only needs to hold off about 103 volts/cm which should be achievable.
If cesium vapor breaks down at significantly lower voltages it might be necessary to
operate the filter at lower temperature which would require increasing the pump power to
I maintain the same efficiency.
5. FEASIBILITY DEMONSTRATION PROGRESS
The most important characteristic of the FALF/FID for LIDAR applications is its
high quantum efficiency. In order to measure the quantum efficiency of the device
accurately, the electrode geometry must be designed carefully. The following is a list of the
important parameters for determining the quantum efficiency with accuracy:
1) The signal absorption volume must be known accurately. In order to do this, theI entrance window for the signal beam must either have the electrode coated on its surface, or
have an extremely fine wire mesh in close contact with it. Experiments performed in PhaseI with rubidium as the atomic vapor showed that using an Inconel film of thickness such
that it had an optical density of 0.5 as the electrode was unsatisfactory. The film "etched"
such that it was non-uniform in optical density over its surface after a few hours of testing.
The etching seemed to be due to electrons from the field ionization process (we were
collecting ions in that experiment) which were accelerated back towards the entrance
2847-R 13
window electrode (due to the bias arrangement used for collecting ions). The "grid"
electrode in that experiment was constructed from a coarse stainless steel wire mesh the
pattern of which transferred back to the entrance elecirode, indicating that the etching was
not due to a chemical reaction with the alkali vapor, but a milling process by charged
particles following the electric field lines back to the entrance window electrode. Therefore
one must use a macroscopic mesh as the entrance signal electrode. Since the absorptiondepth for operating the cesium in the IR mode is about 100 g., the screen must be kept
I thinner than this and in addition it must make intimate contact with the window over theentire signal beam diameter.
2) The pump laser beam must be spatially profiled.
3) The signal strength vs. pump laser power should be saturated at the pump laser
power used to make the measurement. This ensures that all of the excited atoms are field
ionized
4) Collection of the ions or electrons must be apertured to the signal beam diameter.
Since the pump laser could cause multiphoton ionization noise, one should only collect ions
or electrons from the active volume to exclude ions or electrons produced by the pump laser
alone.
The electrode used to solve step one was made from 25 p. stainless steel mesh
which had a 30% shadowing factor. The total thickness of the mesh was 50 p. at most (at
the points where two wires crossed) and the openings in the mesh were 25 p. maximum.
Therefore at a distance of about 2-3 times the radius of the hole (12 gt x 2 = 25 R.) the
electric field is uniform and behaves as if the mesh were a continuous electrode. In order to
assure that the screen contacted the window over the signal beam diameter, the window
was made with a slight curvature. This insured that at least one point of the screen was
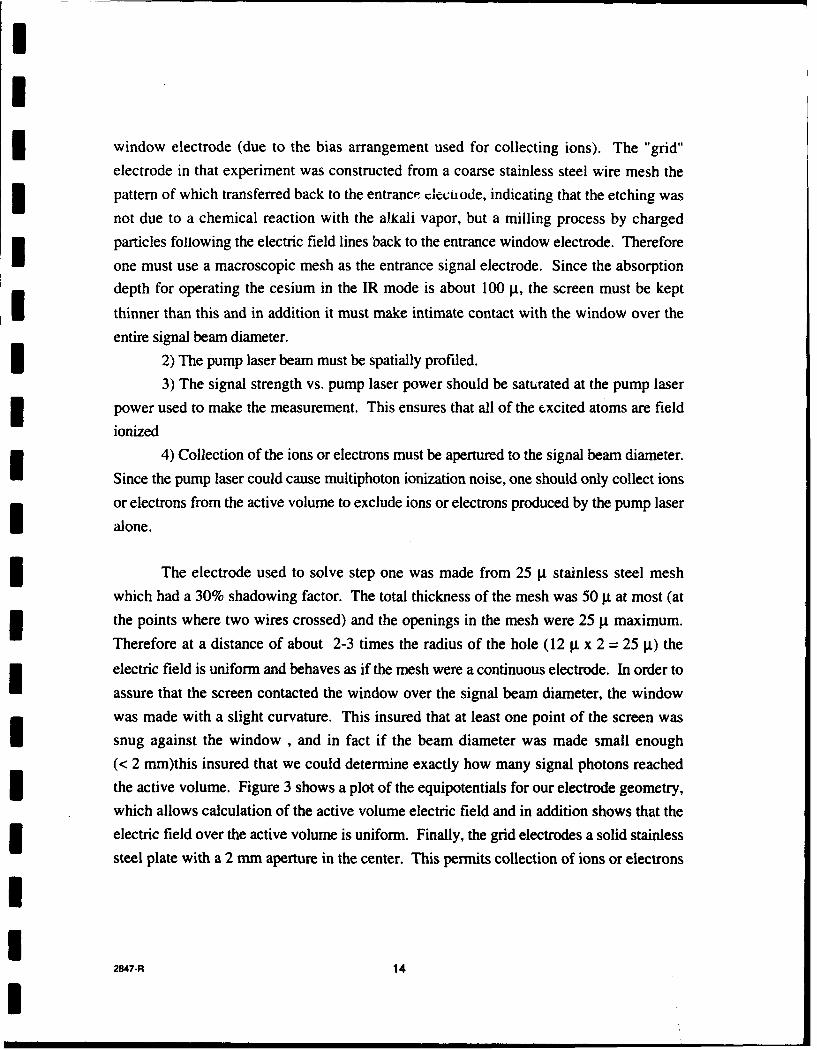
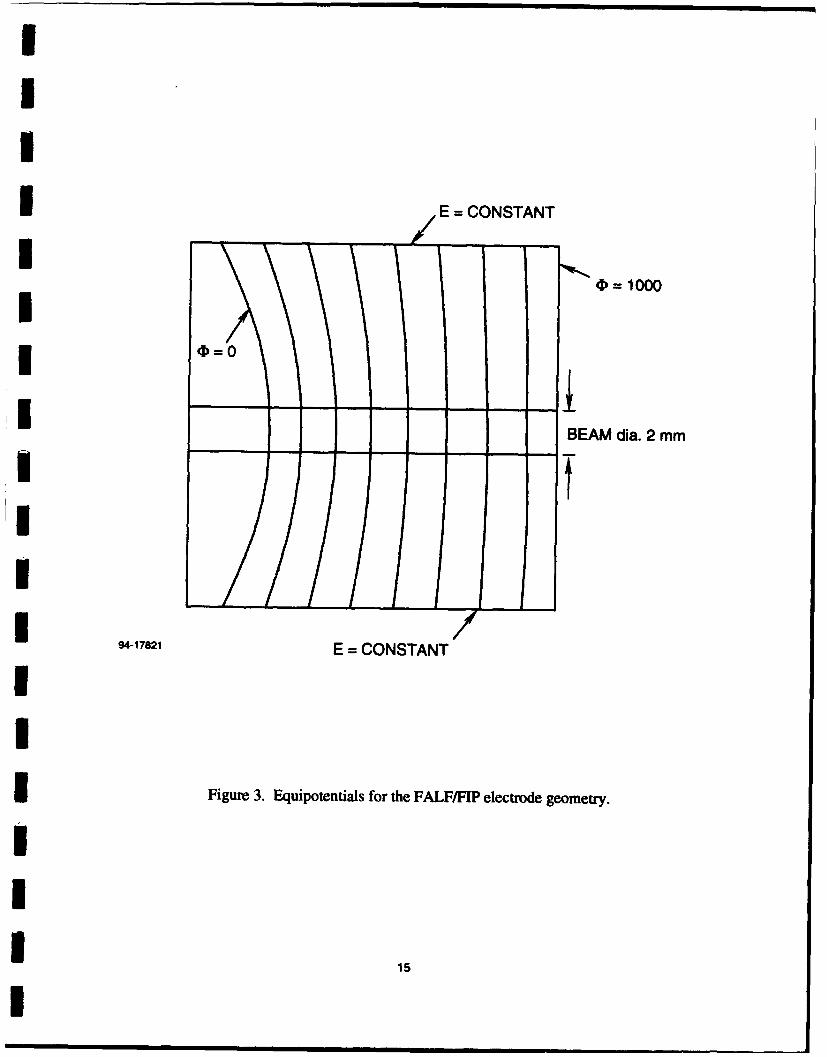
snug against the window , and in fact if the beam diameter was made small enough(< 2 mm)this insured that we could determine exactly how many signal photons reachedthe active volume. Figure 3 shows a plot of the equipotentials for our electrode geometry,
which allows calculation of the active volume electric field and in addition shows that the
electric field over the active volume is uniform. Finally, the grid electrodes a solid stainless
steel plate with a 2 mm aperture in the center. This permits collection of ions or electrons
2847.R 14
III
I E = CONSTANT
4 = 1000II
BEAM dia. 2 mm
I ,tUH
1 94-17821 E = CONSTANT
I
I 15

II
from the active region only, and excluding any ions or electrons produced by the pump
laser alone.
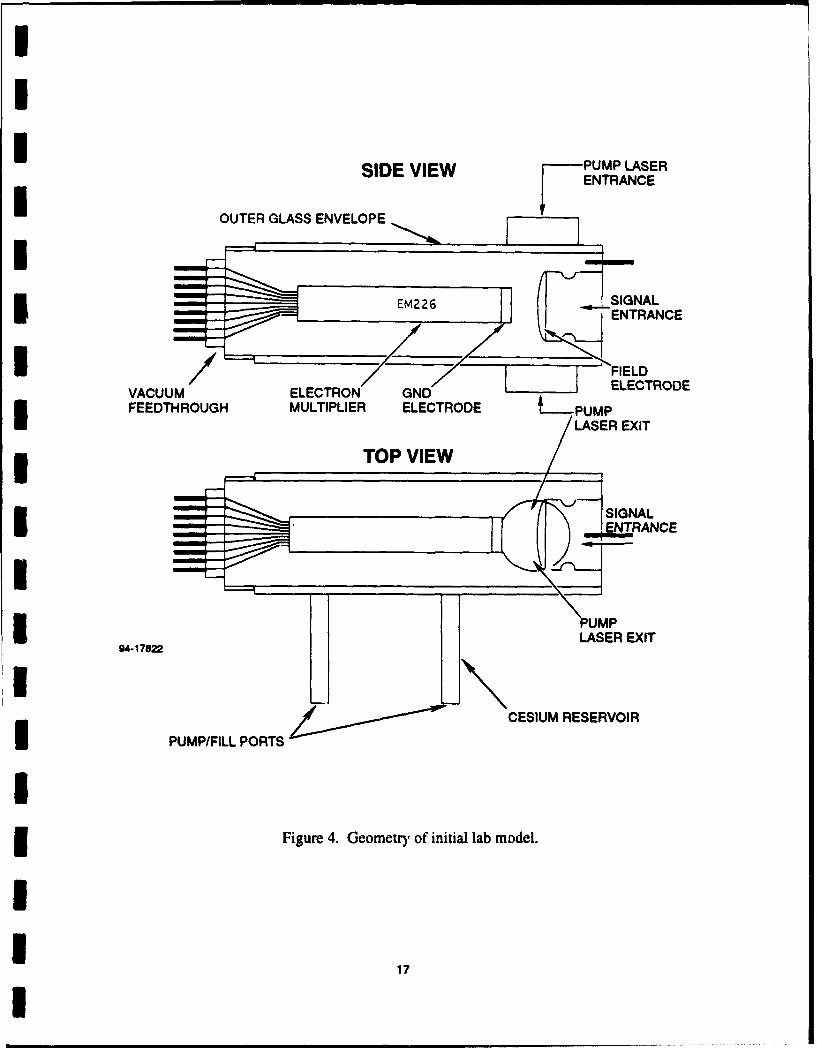
Figure 4 shows the geometry of the initial lab model. The device consisted of a
Thorn EMI electron multiplier encased in a glass envelope containing cesium metal. The
device is self contained (no vacuum system necessary) and portable. Unfortunately this
model did not work. The electron multiplier is supplied with the dynode biasing resistors
inside of the tube. Upon initial heating of the cell the cesium vapor attacked and destroyed
the resistors. The tube was then modified by replacing the ruined resistors with glass
encapsulated hermetically sealed resistors. Again the tube failed upon heating, except the3 failure mode was electrical breakdown of an unknown gas inside of the device. The
resistors are sealed in argon and it is possible that one or more of them leaked. The
* resulting low pressure of argon is quite easily broken down by the fields used in the
FALF/FID.
Rather than rework the same device, it was decided to replace the multiplier with
one that had the individual dynode wires exiting the glass envelope and therefore could be
biased externally. Another device was constructed using a Thorn PMT that had its
photocathode removed so it essentially functioned as an electron multiplier. This device
could be biased to high voltage (6kV/cm) without causing internal breakdown.
Figure 5 shows output of a cesium reference cell photodiode and the output of the
FALF/FID at 100 'C which corresponds to a cesium density of 1013/cm 3. The signal laser
is being ramped in wavelength through the two cesium hyperfine peaks at 852 nm(about 9
GHz apart). The top trace from the reference cell shows the absorption at each peak and
the lower trace shows the ion signal form the FALFIFID. This ion signal is not due to field
ionization of Stark-shifted Rydberg states but is due to ionization caused by tight focussing
the 852 nm signal laser into the cell alone. The ion signal is due to collisional ionization of
cesium excited state atoms.
The next step would have been to use a pump laser at 520 nm to excite the excited3 cesium atoms to a Rydberg state and then field ionize them. Unfortunately the cell did not
last long enough to perform this measurement. The cesium reacted with the glass used to3 electrically insulate the high voltage leads exiting the cell. This reaction reduced the
resistance of the glass feedthrough to a near short and therefore the multiplier could no
II
28d-R 16
I
II
SIDE VIEW PUMP LASER
I OUTER GLASS ENVELOPE
ENTRANCE
IEM226 L
VACUUM ELECTRON GND ELECTRODE
IFEEDTH ROUGH MULTIPLIER ELECTRODE t PMII _____ TOPVIEW
LASER EXIT
94-17822
PUMP/FILL PORTS CESIUM RESERVOIR
i Figure 4. Geometry of initial lab model.
I
17

S~FALF 01000 C
IC
trI9d
IA
REFERENCEPHOTODIODE
600IS 5ms/d v : 50.6ms
94-17820
Figure 5. Output of a cesium cell reference photodiode and FALF/FIP at 100° C.
I le
II
3 longer be biased properly which of course reduced the multiplier gain to a point where a
signal was no longer visible.3a It turns out that cesium and for that case all alkali metals react with SiO2. Much
literature is available on so called thermionic diodes which mainly used cesium as the active
element at very high temperature. From these studies it was concluded that cesium reacts
badly with SiO2 and glass should not be used as an electrical insulator if it comes in contactwith cesium vapor. These same reports also mention that high purity alumina does not
react with cesium and was used successfully in many thermionic diode systems as an
electrical insulator.
Figure 6 shows the final version of the FALF/FID which is presently under
construction. The glass-metal electrical feedthroughs have been replaced by alumina-metal
feedthroughs. The multiplier is the same one used earlier except all of the glass has been
removed. The only materials remaining inside of the device that could contact the cesium
vapor are Be-Cu (dynodes), stainless steel, and high purity alumina, none of which react
with cesium. The entire device is housed in a glass envelope whose only purpose is to
maintain the cesium atmosphere, it does not hold off any voltage.
6. CONCLUSIONS AND RECOMMENDATIONS
The proof of principle experiment in phase one showed that the FALF/FID conceptis valid. There is no physical reason why the same concept should not work in cesium.
Engineering the FALF/FID will take more work due the materials problems associated with
alkali metal vapors. We believe that the last modification of the FALF/FID will alleviate the
problems seen in the earlier versions. The quantum efficiency measurement will beperformed assuming the FALF/FID cell is viable.
If this last modification does not work for some unforeseen reason there is stillanother idea that might solve the problem of alkali reactivity. Recently thin films of CVDdiamond have become commercially available and in particular one can purchase a 0.4p.t
thick x 6 mm diameter diamond film that will withstand a one atmosphere pressure
differential. Electrons of energy 10 keV or greater can easily penetrate such a film. This
film could be used at the entrance of the multiplier to keep the dynodes under high vacuumand keep the cesium vapor away from the dynodes. The cell can be designed (see figure 7)
2847-R 19

IIIIIII 0
I 00I-
IU
II
0I .2
IIII t�I
I C
I20
I
such that the cesium vapor is contained in a cell that does not have any high voltage leads
from the dynodes passing through it. The only foreseeable problem that could arise is
breakdown of the cesium vapor at this voltage although preliminary experiments performed
here suggest that this is not a problem. This could be the best solution to the long term
materials problems associated with alkali vapors and high voltage feedthroughs.
7. REFERENCES
I . For a thorough review, see J. A. Gelbwachs, IEEE J.Q.E., QE-24, 1266 (1988).
2. E. Korevaar, M. Rivers, C.S. Liu, SPIE Proceedings, Vol. 1059, 1I1, (1989).
3. S.H. Bloom, Eric Korevaar, Mike Rivers, and C.S. Liu, to appear in March 1, 1990issue of Optics Letters.
4. D. Kleppner, M.G. Littman, M. Zimmerman, Rydberg States of Atoms andMolecules, R.F. Stebbings and F.B.Dunning eds. (Cambridge Univ. Press, 1983).
5. J.Y. Liu et. al. Atomic Excitation and Recombination in External Fields, M.H. Nayfeh
and C.W. Clark eds. (Gordon and Breach, NY, 1985).
6. Y. V. Moskvin, Opt. Spectrosc. 15, 316-318, (1963).
7. Extrapolated from data in: A. Lindgard, and S.E. Nielsen, "Transition Probabilities forthe Alkali Isoelectronic Sequences Li, Na, K ,Rb ,Cs ,Fr," in Atomic Data andNuclear Data Tables 19, 533-633 (1977).
8. D. Normand and J. Morellec, J. Phys. B.,13, 1551-1561 (1980).
9. T. J. Gallagher and A.J. Pearmain, in High Voltage- Measurement, Testing andDesign, John Wiley and Sons, Chichester (1983).
10. E. Korevaar, PhD Thesis, Princeton Univ., Dept. of Aero. and Mech. Eng. (1987) p.98.
2847-R 21
UIIIIIII1 2. Intrinsic NoiseIIIIIIII1 2847-s 22
I
II
ACTIVE ATOMIC LINE FILTER INTRINSIC
NOISE MEASUREMENTS
I Paul Searcy, Kyunam Choi, Scott Bloom, Eric Korevaar and C.S. Liu
IIABSTRACT
We investigated the amount of in-band optical noise and the production mechanisms
in two active atomic line filters, rubidium and cesium-thallium. We conclude from
our experiments that actively pumped atomic line filters in rubidium and cesium that
rely on the creation of an excited population by pumping from the ground state
show significant intrinsic noise fluorescence. The noise is due primarily to
collisional excitation of high lying levels including collisional ionization.
2U7.R 23
I mm

II3 Actively pumped atomic line filters have been proposed for use in a system matching
doubled neodymium lasers for Submarine Laser Communications (SLC). In particular,
the most promising filter concepts are the cesium-thalliumi filter for receiving signal light at
535 nm (matching doubled Nd:BEL) and rubidium2 at 532 nm (matching doubled
Nd:YAG). These filters consist of a green pass filter, an alkali vapor cell, and an
ultraviolet pass filter. As shown in Figure 1, pump photons excite the alkali atoms from
the ground state, creating a population of excited alkali atoms. The green signal photons3 from the transmitter are passed through a broadband colored glass filter and are matched to
an upper state transition in the vapor allowing excitation to an even higher level. As this3 level decays back to the ground state the atom emits blue and UV secondary signal photons
which pass through a second colored glass filter and are detected by a PMT. Background
light is blocked by the two colored filters allowing only upconverted light to pass through
the filter. Unfortunately, UV photons can also be generated by the pump laser alone by
various mechanisms, with no signal photons present, resulting in intrinsic noise. Other
filter schemes which use a local IR pump laser to pump from a non-ground state level do
not create noise photons and remain viable concepts for use with IR systems.3,4 Our task3 was to determine if these noise photons would interfere with operation of the SLC-type
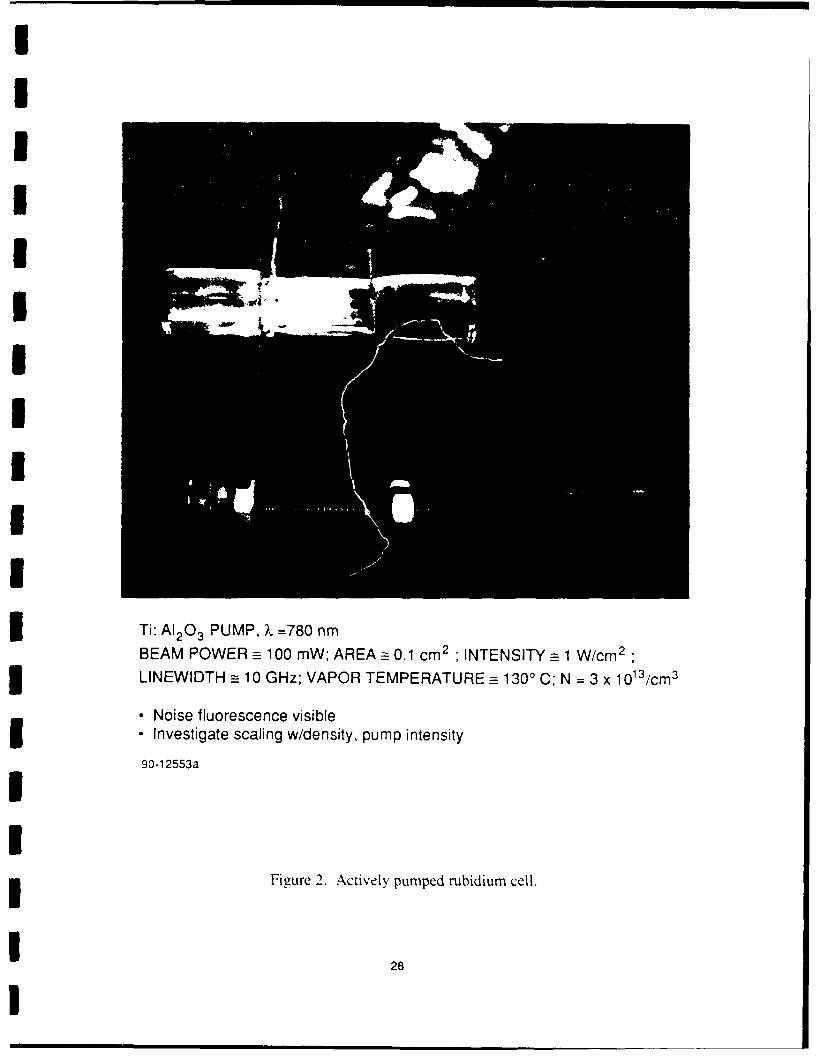
system, and what those noise generation mechanisms were.IThe severity of the noise generation in the rubidium filter is obvious when a cell of
rubidium is pumped by a Ti:Sapphire laser at the intensity required by an active filter. The
laser was tuned to the 780 nm resonance creating blue fluorescence clearly visible to the
human eye in an illuminated room as shown in Figure 2. A Schott colored glass filter (BG
39), similar to the second colored glass filter in an atomic line filter, was placed in front ofthe left side of the cell blocking all wavelengths except those between 300 and 700 nm. We
realized that these photons would appear in the signal channel along with the secondary
signal photons generated at 323, 335, 359 and 421 nm by a green laser signal at 532 nm.3 In fact, when the fluorescence was imaged through a scanning monochromator the noise
was discovered to fall on precisely those secondary signal wavelengths which eliminates
any chance of using narrower-band interference filters instead of colored glass filters. As
seen in Figure 3 the dominant noise peaks were observed at 421 and 359 nm while themore UV transitions at 335 and 323 nm were too small to be detected on the same scale. In
2847-R 24
I

I
I theory, it would be possible to block the 421 and 359 nm noise sources and use the
335/323 nm transitions in the ALF system. Unfortunately the branching ratios from the 9p
state in rubidium are much smaller for the UV transitions (part of the reason the noise is
smaller) so the quantum efficiency of the filter would suffer.
3 Similar investigations of the cesium-thallium filter with the scanning monochromator and
pumping laser at 852 nm gives similar results as shown in Figure 4. Noise signals from
7p, 8p, and 9p to 6s transitions are identical in wavelength to the secondary signal photons
generated in the proposed filter operation.
We believe the noise was generated by two main mechanisrfb, multiphoton excitation and
collisional excitation as shown in Figure 5. In multiphoton excitation, photons from the
pump laser create an excited state population at the 6p level which can be further excited to3 the 7p level and beyond the ionization limit. One pathway to the 7d state is through a
Raman transition enhanced by the nearby 6d level. Collisions between atoms at the 6p
level can create multiply excited cesium atoms: for example a binary collision Cs* + Cs*
can result in doubly excited Cs**. The decay of multiply excited cesium atoms (Csn*)
results in ultraviolet noise photons.
The details of the multiphoton and collisional noise processes are given by the reactions in3 Figure 6. We could distinguish between multi-photon and collisional excitations by their
interaction bandwidths from the 6p state. The interaction bandwidth can be investigated in
a pump-probe experiment where the pump laser is tuned to the 852 nm ground state-6p
transition and the probe laser scanned over the same transition. Comparing the multi-
photon and collisional mechanisms shows the important difference in the sensitivity of
noise generation to probe laser detuning. We expect the multiphoton process from the 6p
state to give a relatively broad and asymmetric noise spectrum due to its insensitivity to
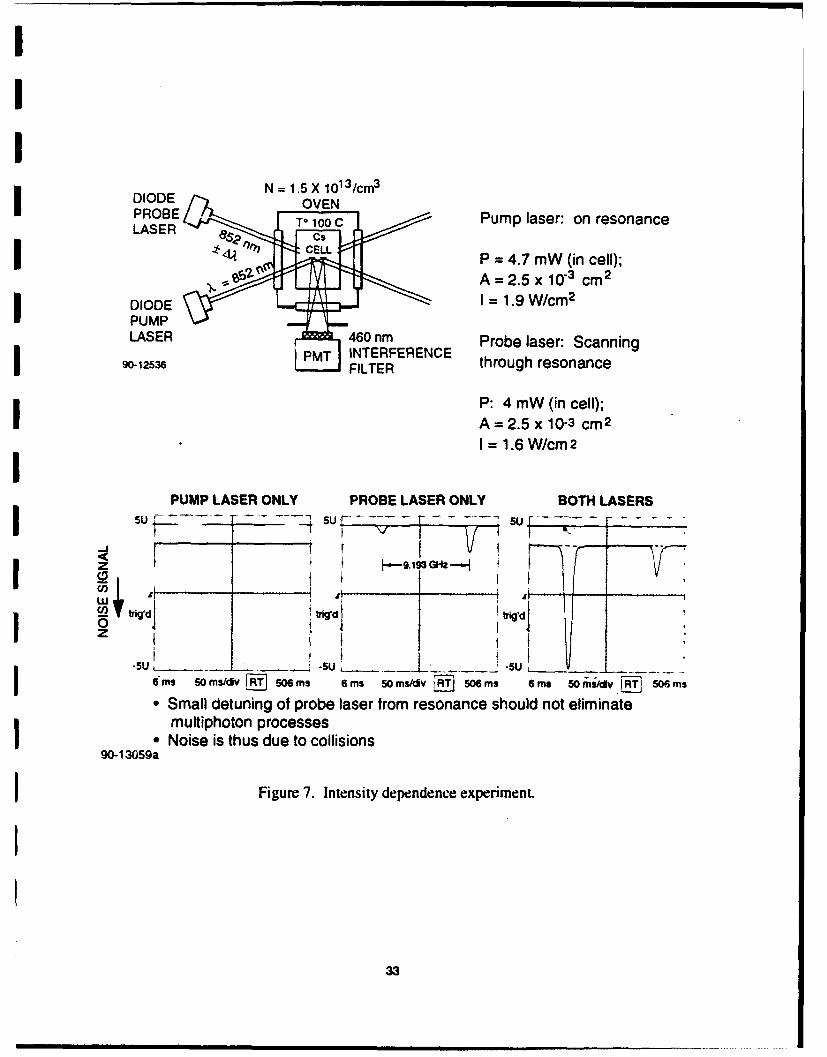
probe laser detuning. We performed the simple experiment shown in Figure 7 where one
diode laser (the pump laser) is locked to one of the peaks of the hyperfine doublet near 852
nm generating a constant level of 455 rum noise as shown in the oscillogram labeled "pump
laser only." A second diode laser (the probe) was aligned to pass through the same volume
and was tuned through the hyperfine doublet. The probe laser alone produced the noise
2847-R 25
IA
II3 signal shown in the oscillogram labeled "probe laser only." Evidence for the collisional
mechanism rather than the multiphoton excitation mechanism is demonstrated in the3 sharpness of the peaks in Figure 7. The oscillogram labeled "both lasers" demonstrates the
expected strong resonant dependence and gives no indication of the broad and asymmetric
noise spectra expected from multiphoton excitation. With both beams pumping the same
volume (doubling the pump intensity) more than a doubling of the noise is observed on the
oscillogram labeled "both lasers." This demonstrates the quadratic or cubic dependence the3 noise level has versus pumping power. Further experiments to quantify the actual
exponent value n (as used in Figure 6) gave values between n = 2 and n = 3, implying that
i both two and three collisions are occurring in the generation of the 455 rim noise peak.
3 We conclude from our experiments that actively pumped atomic line filters that rely on the
creation of an excited population in rubidium and cesium by pumping from the ground state
show significant intrinsic noise fluorescence. This level of noise indicates the filters are not
appropriate for most traditional ultra-narrow band applications. The noise is due primarily
to collisional excitation of high lying levels including collisional ionization and is3 unavoidable since high levels of pumping are required to create a sufficiently dense
population of excited atoms to absorb incoming green signal photons.
References
1. Liu, Chantry, Chen, SPIE Proc. 709, 132-138 (1986).
2. Shay, Chung, Optics letters 13, 443 (1988).
3. Korevaar, Rivers, Liu, SPIE Proc. 1059. 111-118 (1989).
4. J. A. Gelbwachs, "Atomic Resonance Filters," IEEE J. Quantum Electronics 24, 1266-
1277, 1988.
2847-R 26

II3.3 SIGNAL (532 nm) + BACKGROUND (BROAD)
PASS BROAD GREENI
P PUMP VAPOR: ABSORB GREEN SIGNAL
PASS BROAD UV ; UV3 EMIT UV
DETECTORI40.000
30,000 -los
•30.000 -- " SIGNAL7
TI 7s 532 nm 6p-
SIGNAL >- 20,000 --
20.000- 53nm ccNm- FLUORESCENCE jU o.oo378 nr S
Bi 10,0oo --Uj TI 6p 3/2 ACTIVE PUMP ACTIVE PUMP
LCOlI 852, 894 nm 795 nm
0 TI6p1/2... TRANSFER Cs6s 323nm J11L421nm
I 335 nm 359 nm5959730Cs-TI FILTER
Rb FILTER535 nm = 2 x Nd: BEL 532 = 2 x Nd: YAGI Liu, Chantry, Chen, SPIE Proc. 70941986) Shay, Chung, Optics Letters 13. 443 (1988)
(la) % (lb)90-13055
Figure 1. Cs-T I filter and active Rb filters.
27
I
m4m
mII
Ti: A1203 PUMP, X =780 nmBEAM POWER_-- 100 mW; AREA =- 0. 1 cm 2 ;INTENSITY_- 1 W/cm2•
Im
LINEWIDTH =_- 10 GHz; VAPOR TEMPERATURE =_- 1300 C; N = 3 x 10¹³/cm3
- Noise fluorescence visible. Investigate scaling w/density, pump intensity
90-12553a
Figure 2. Actively pumped rubidium cell.
28

Noise detected at filter output wavelengths
WE
Z\ z
I. o E 1- E
M a- 2000 --
np-~
u-J l
310,000 -
ErAV
1 795 nm323 04 5.s
33nrn '• L 421 nm
n359nm1 89-973090-13056
I Figure 3. Spectral profile of rubidium noise tluorescence.
I29
I

- Intrinsic Noise SpectraCesium Vapor
I Cell temperature: 1260 C
m.�m� �0. IONIZATION -r- X-
" S IE E 30.000- LIMIT - 9PlI0 4 P2mow Ep 6d (22589 cm)L -20,000- 7p,, COLLISIONAL
- ,.1. EXCITATION
"I PUMP
Snm)i E6 6p(172cmm
r385 389 nL0L 6s, L-. -6-'•"- 455 nm"
-- 480 460 440 420 400 380 360 340 320 300 8-731
WAVELENGTH (nm)
90-13057
Figure 4. Spectral profile of cesium noise fluorescence.
30
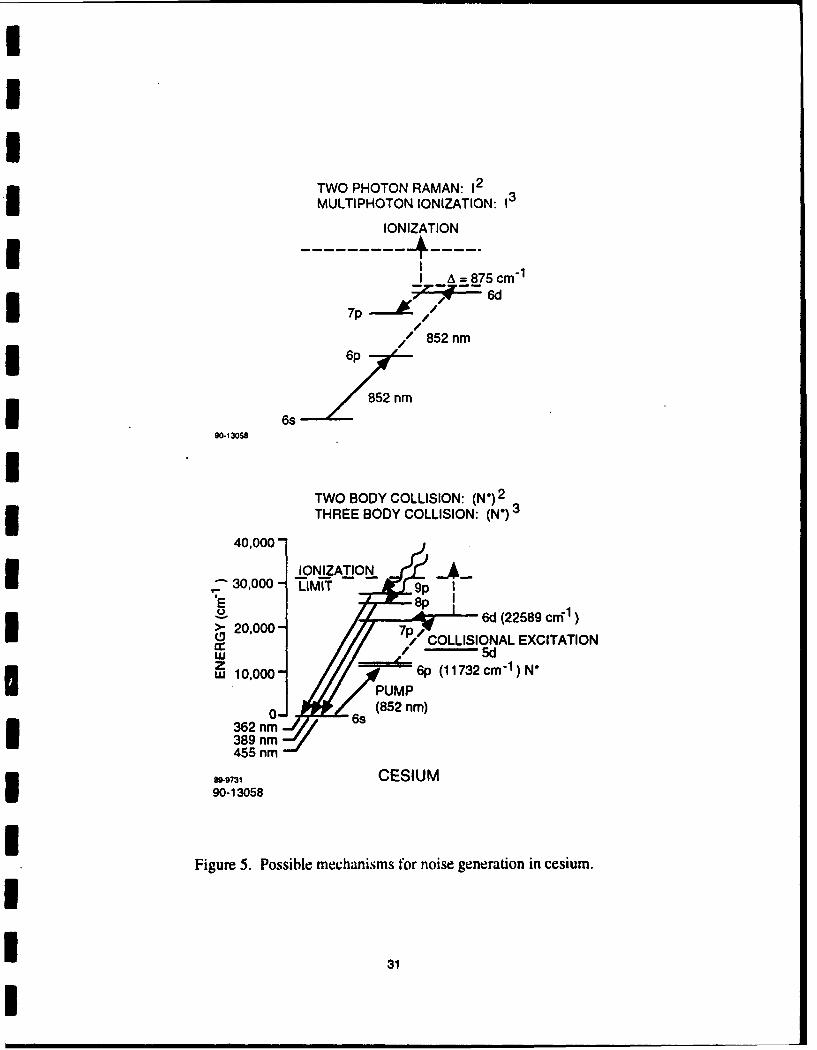
TWO PHOTON RAMAN: 12MULTIPHOTON IONIZATION: I
IONIZATION
I A = 875 cm"
7p -h /
/ 852 nm* 6p
852 nm
I 6s90-130SS
TWIOYCLIIN N)TWO BODY COLLISION: (N*)23 THREE BODY COLLISION: (N') 3
40,000-
IONIZATION A"" - 3 0 ,000- LIMIT 9p IE 8p I0 6d (22589 cni1 )>- 20,00- 7a/ COLLISIONAL EXCITATIONw 5dzw 10,,000 P 6p (11732 cm'l) N"
0 6s (852 nm)362 nm389 nm455 nm"-
8"731 CESIUM90-13058
Figure 5. Possible mechanisms for noise generation in cesium.
31

Cs(6s) + hv (852 nm) -, Cs* (6p)
1) Collisional Excitation
Cs* (6p) + Cs* (6p) +. Csn*
n collisions
Csn* --.> Cs (6s) + hv (UV)P(UV) a [Cs*]n
2) Multiphoton Excitation
Cs* (6p) + hv (852 nm) -- Cs (h + D)*
Csn* -- Cs (6s) + hv (UV)
P(UV) - [Cs*] (I (852 nm))n'l
Cs*: Singly excited cesium atom
Csn*: n-multiply excited cesium atom
Figure 6. Excitation mechanisms.
247..R 32
I_
I
IDIODE N15X11/MPROBE Pump laser: on resonanceLASERC
C P = 4.7 mW (in cell);A = 2.5 x 10.3 cm 2
DIODE I = 1.9 W/cm 2
PUMPLASER 460 nm Probe laser: Scanning
90-1253 P INTERFERENCE through resonance
P: 4 mW (in cell);A =2.5 x 10⁻³ cm 2
1= 1.6 W/cm2
PUMP LASER ONLY PROBE LASER ONLY BOTH LASERS
SU~h~ 5U -r- 5su~~~~~ I- u• ... .. .
-j- 1~~ ý -- 9.1,3G.z-.-I -
' H -... . . . R ,H -.. . . .
I• Noise is thus due to collisions90-1 3059a
Figure 7. Intensity dependence experimenL
33

ThspgInetoal etbak
II
Ia•g3
I.FrdyFle
I
Ie7R3
|IIm
"S8 OPTICS LETTERS / Vol. 16, No. 11 / June 1, 1991
Ultranarrow line filtering using a Cs Faraday filter at 852 nm
J. Menders, K. Benson, S. H. Bloom, C. S. Liu, and Eric Korevaar
Thermo Electron Technologies Corporation, 9550 Distribution Avenue, San Diego. California 92121-2305
Received January 28. 1991
To achieve quantum-noise-limited performance, background-limited laser receivers require narrow-band optical
filters. We measured and modeled the ultranarrow-band transmission spectrum of a Cs Faraday filter at 852 nm.The transmission spectrum consisted of pasabands on either side of the 6 2SI, 2-6 2P3/ 2 hyperfine doublet lines,making a total of four. The passbands may be simple peak or highly modulated, depending on the operatingparameters. We observed peaked passbands of near-unity transmission with a 0.6-GHz bandwidth and modulatedbands with features as sharp as 100 MHz. Excellent agreement with our calculations at 852 rim allows us to predictconfidently a 0.7-GHz transmission band for Cs at 455 nm.
To achieve quantum-noise-limited performance, consists of an alkali metal vapor in a magnetic fieldbackground-limited laser receivers require narrow- between crossed polarizers. As described below, theband optical filters. Typically atomic line filters magnetic-field Zeeman splits the energy levels, result-(ALF's) are used to obtain ultranarrow-band optical ing in separate absorption lines for left and right circu-filtering,' achieving bandpasses of approximately 1 larly polarized light. We can consider the filter trans-GHz. Another device, referred to as the Faraday fil- mission in terms of circularly polarized light outside,ter, 2.3 the dispersive magneto-optic filter,4 or the Fara- between, and at the absorption lines. Outside theseday anomalous dispersion optical filter,5 has been used lines, the filter can be regarded as a Faraday rotatorto obtain bandpasses of approximately the same that uses an alkali metal vapor as the magneto-opticwidth. Faraday filters provide an optical passband at material inserted between crossed polarizers. Thefixed wavelengths associated with strong atomic ab- metal vapor exhibits rotary power only in the immedi-sorption lines as do ALF schemes. In addition, Fara- ate vicinity of an absorption line, providing the 900day filters offer the advantages of near-unity peak turn needed to pass the second polarizer. A simple
transmission for linearly polarized light, image preser- peaked transmission spectrum is obtained when thevation,6 and real-time operation (no excited-state de- filter parameters are adjusted to provide a maximumcay delays). Although unpolarized light is limited to a rotation of 90°; at higher vapor densities and/or fields,peak transmission approaching one half, the combina- multiple rotations lead to rapid modulations in thetion of two filters in parallel can be used to provide transmission spectrum. Away from the absorptionnear-unity transmission for each of the polarization line, the filter provides an out-of-band rejection deter-components. Three early applications of Faraday fil- mined by the extinction ratio of the crossed polarizersters were to high-speed optical modulation,7 dye-laser (typically >105). Under our operating conditions,frequency locking, 2'3 and the observation of solar sodi- both circular polarization components of light be-um D lines.8 tween the left and right circular lines are absorbed by
The filters can provide passbands either at or in the the line wings. Light at either of the lines experiences
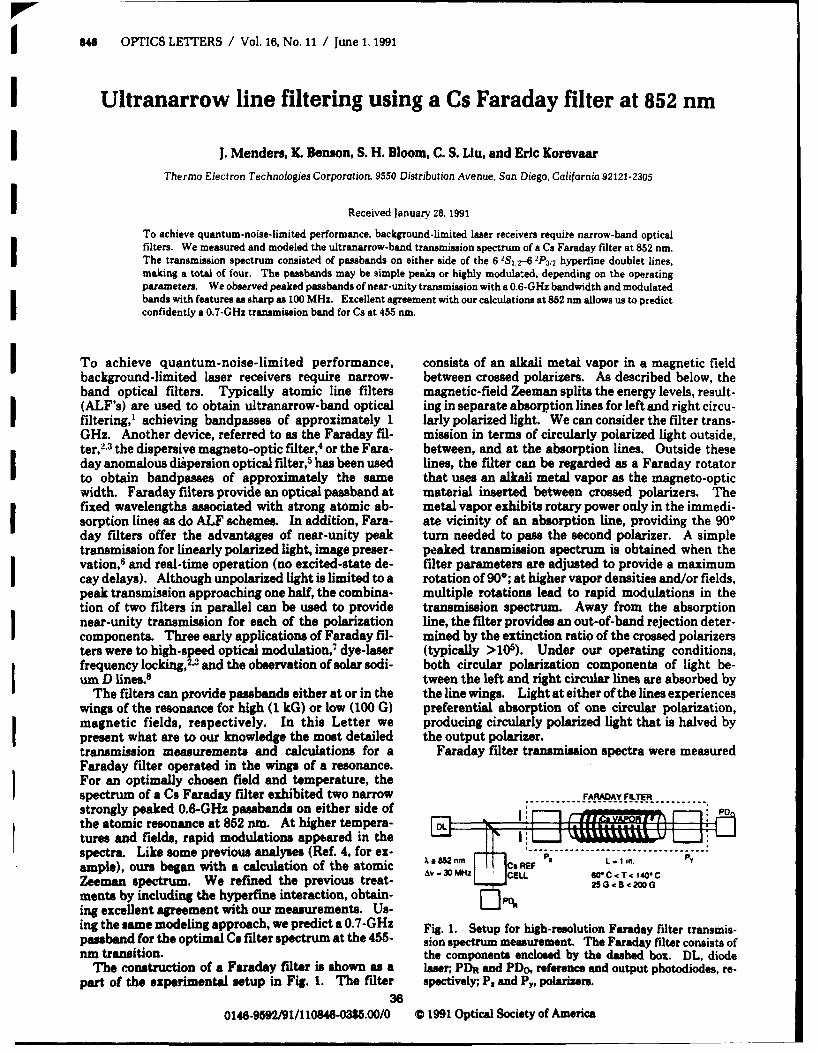
wings of the resonance for high (1 kG) or low (100 G) preferential absorption of one circular polarization,magnetic fields, respectively. In this Letter we producing circularly polarized light that is halved bypresent what are to our knowledge the most detailed the output polarizer.transmission measurements and calculations for a Faraday filter transmission spectra were measuredFaraday filter operated in the wings of a resonance.For an optimally chosen field and temperature, thespectrum of a Cs Faraday filter exhibited two narrow FARADAY FILTER
strongly peaked 0.6-GHz passbands on either side of Pothe atomic resonance at 852 nm. At higher tempera- DLtures and fields, rapid modulations appeared in thespectra. Like some previous analyses (Ref. 4, for ex- - -----------------------------ample), ours began with a calculation of the atomic X a 2 Sin. •AV - 3 0 k *4 2 I C E L L. 6 0 ' C -c T" 14 0 "Zeeman spectrum. We refined the previous treat- 250C <13 c 20G Cments by including the hyperf'me interaction, obtain-ing excellent agreement with our measurements. Us-
ing the same modeling approach, we predict a 0.7-GHz Fig. 1. Setup for high-resolution Faraday filter transmis-passband for the optimal Ca filter spectrum at the 455- sion spectrum measurement. The Faraday filter consists ofnm transition. the components enclosed by the dashed box. DL, diode
The construction of a Faraday filter is shown as a laser; PDR and PDo, reference and output photodiodes, re-part of the experimental setup in Fig. 1. The filter spectively; P. and Ps, polarizers.
360146-9592/91/110846-03$5.00/0 0 1991 Optical Society of America

June 1. 1991 / Vol. 16, No. 11 / OPTICS LETTERS 847
tion of the primary passband is shifted away from line80. C center as the vapor density is increased with tempera-100 G HYPERFINE ture. The property could be useful for tracking Dopp-
9 * 9 2 GHzT ler-shifted signals from satellites. Note the develop-
1k .ment of a nearly square passband in the 200-G, 1000 Ccase. This feature occurs because the nearly linearlydecreasing circular birefringence from the two lines-:2 Gsz . . .. - 1, 6 GsHz sum to a constant between the lines. The transmis-
, ,. sion is easily modulated by a 20-G change in the field,• I'.which offers the potential for use as a rapid beam
REUNCYmodulator.
A convincing demonstration of the accuracy of our
Fig. 2. Cs 852-nm Faraday filter transmission spectrum model can be made by using the complicated spectrum
optimized for a laser receiver application. The magnetic taken at 200 G and 1200C. A comparison between thefield and the vapor temperature were chosen to produce a measurement and our calculations is shown in Fig. 4.narrow bandpass with high transmission. Fresnel losses, The coincidence of the modulation peaks and thewhich can be grEatly reduced, accounted for 90% of the shape of the primary passbands indicates that ourtransmission losses. model accurately predicts the rotation spectrum of the
Faraday cell. The Faraday filter was analyzed infor a range of fields and vapor densities using the setup terms of a circularly birefringent, dichroic mediumshown in Fig. 1. A frequency-ramped, narrow-band between crossed polarizers. The medium was charac-beam provided by a current-modulated diode laser terized by the circular refractive indices n, and ab-(Mitsubishi ML 2701) was split between the filter and sorption coefficients a,, where a = +, - for left anda reference absorption cell. The filter 9 consisted of aI2.5-cm-long cell containing Cs vapor in a magnetic 10G10C2000G 100* Cfield provided by a coaxial solenoid sandwiched be-tween two Glan-Thompson polarizers. The vapordensity was determined by the regulated (±0.10 C)temperature of a cold finger in the cell, which ranged 4between 60 and 140*C, giving densities between 9.1 x ,1011 and 1.3 X 10¹⁵ atoms/cm3 . The field was deter- --
mined from a measure of the solenoid current using a < .1G 0°C 2000G so Cfactory-supplied calibration factor. We varied the
current between 2 and 18 A to obtain fields of as muchas 200 G. The filter and reference cell throughputswere monitored by silicon photodiodes, whose outputs iwere simultaneously displayed on an oscilloscope and • __________,_______dumped to a plotter. I .... ..........
An example of a useful transmission spectrum for MAGNETIC FIELD
laser receiver applications is represented by the data Fig. 3. Tramsmission spectrum variation for varying tem-presented in Fig. 2. The narrow peak on the blue side perature and field strength. The passband position can beof the spectrum has a bandwidth of 0.6 GHz and a shifted by adjusting the temperature of the field. A squarepeak transmission of approximately 48% compared passband can be produced between the hyperfine splitting.with that of a cold filter (i.e., no vapor or field, with oneuncoated polarizer removed) of approximately 54%. C Exp"r
I Thus, at this operating point, all the filter losses can be o 2o0 12'c
attributed to Fresnel losses, which can be reduced to afew percent by using antireflection coatings. The fourpassbands correspond to two pairs of passbands, one .pair for each of the lines in the hyperfine doublet. - it4 \,
I This 9-GHz doublet appears in all passive Cs-based ..
filters. The 2-GHz stop band between a pair of pass-bands is formed by the combination of absorption by 8- THEORv
the Doppler-broadened (0.4-G~li) left and right circu- -
lar lines and a transmission null caused by a 1800rotation. As shown in Fig. 2, the transmission peaksoccur for a 90* rotation, with an attenuated secondarypeak for a rotation of 2700. 5.
Additional measurements of transmission spectral --20 0o 40
variation with temperature and field showed the ad- 'reauency (GHz)
justability of filter bandwidth and position. A few Fig. 4. Transmission spectrum in excellent agreement withexamples from a series of measurements are presented the calculation. The coincidence of the transmission peaksin Fig. 3. The spectrum discussed above is the 100-G, shows the correspondence between the measured and calcu-800C case. As the 200-G column illustrates, the posi- lated polarization rotation.
I 37
au OPTICS LETTERS / Vol. 16. No. 11 / June 1. 1991
455 ,nym tion, and, finally, the total a,(v) and n,(P) are found byl / summing the contributions from each of the a transi-
82% ions.- - - -- / 200G 140'C
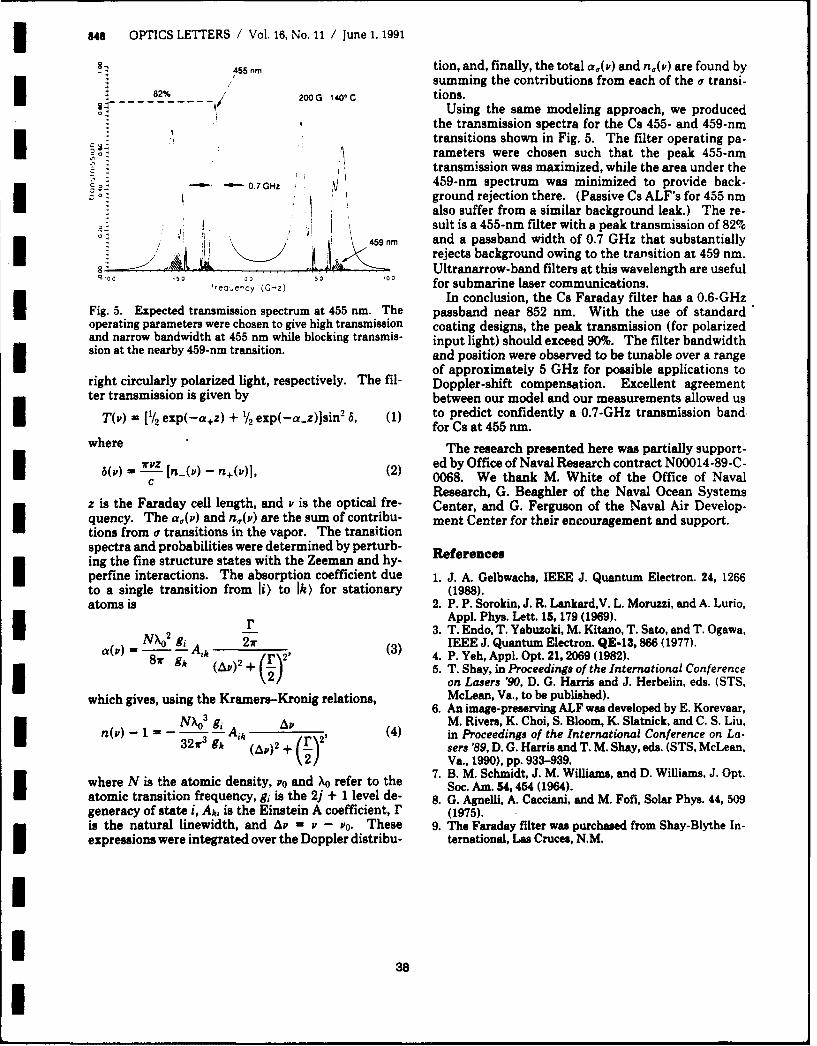
o- Using the same modeling approach, we producedthe transmission spectra for the Cs 455- and 459-nmtransitions shown in Fig. 5. The filter operating pa-
2 ' rameters were chosen such that the peak 455-nmtransmission was maximized, while the area under the
0. 7 GHz 459-nm spectrum was minimized to provide back-ground rejection there. (Passive Cs ALF's for 455 nm
"also suffer from a similar background leak.) The re-suit is a 455-nm filter with a peak transmission of 82%
9 n and a passband width of 0.7 GHz that substantially:L 2• lrejects background owing to the transition at 459 nm.
8/ A/- L Ultranarrow-band filters at this wavelength are usefulq-,00 -50 3o50 'oo
",eque'•cy (GHZ) for submarine laser communications.In conclusion, the Cs Faraday filter has a 0.6-GHz
Fig. 5. Expected transmission spectrum at 455 nm. The passband near 852 nm. With the use of standardoperating parameters were chosen to give high transmission coating designs, the peak transmission (for polarizedand narrow bandwidth at 455 nm while blocking transmis- input light) should exceed 90%. The filter bandwidthsion at the nearby 459-nm transition. and position were observed to be tunable over a range
of approximately 5 GHz for possible applications toright circularly polarized light, respectively. The fil- Doppler-shift compensation. Excellent agreementter transmission is given by between our model and our measurements allowed us
T(v) - [1/2 exp(-a+z) + '/2 exp(-a-z)]sin 2 6, (1) to predict confidently a 0.7-GHz transmission bandfor Cs at 455 nm.
where The research presented here was partially support-I5(p) -p 2 (n..(v) -n+(0, (2) ed by Office of Naval Research contract N00014-89-C-c 0068. We thank M. White of the Office of Naval
Research, G. Beaghler of the Naval Ocean Systemsz is the Faraday cell length, and P is the optical fre- Center, and G. Ferguson of the Naval Air Develop-quency. The a,(v) and n,(v) are the sum of contribu- ment Center for their encouragement and support.tions from a transitions in the vapor. The transitionspectra and probabilities were determined by perturb- Referencesing the fine structure states with the Zeeman and hy-perfine interactions. The absorption coefficient due 1. J. A. Gelbwachs, IEEE J. Quantum Electron. 24, 1266to a single transition from 1i) to 1k) for stationary (1988).atoms is 2. P. P. Sorokin, J. R. Lankard,V. L. Moruzzi, and A. Lurio,
Appl. Phys. Lett. 15, 179 (1969).
__2 g,_r 3. T. Endo, T. Yabuzoki, M. Kitano, T. Sato, and T. Ogawa,a() 2 IEEE J. Quantum Electron. QE-13, 866 (1977).
NXr) 2' 4. P. Yeh, Appl. Opt. 21, 2069 (1982).8 9 gk (Av) 2 + 5. T. Shay, in Proceedings of the International Conference
(Df on Lasers '90, D. G. Harris and J. Herbelin, eds. (STS,which gives, using the Kramers-Kronig relations, McLean, Va., to be published).
6. An image-preserving ALF was developed by E. Korevaar,N)•0
3 g, AV_ M. Rivers, K. Choi, S. Bloom, K. Slatnick, and C. S. Liu,n(v) - 1- Ai' (4) in Proceedings of the International Conference on La-
32ir 3 gt (AV) 2 + sers '89, D. G. Harris and T. M. Shay, eds. (STS, McLean.Va., 1990), pp. 933-939.
7. B. M. Schmidt, J. M. Williams, and D. Williams, J. Opt.where N is the atomic density, vo and Xo refer to the Soc. Am. 54,454 (1964).atomic transition frequency, gi is the 2j + 1 level de- 8. G. Agnelli, A. Cacciani, and M. Fofi, Solar Phys. 44, 509generacy of state i, Aki is the Einstein A coefficient, r (1975).is the natural linewidth, and Av - v - vo. These 9. The Faraday filter was purchased from Shay-Blythe In-expressions were integrated over the Doppler distribu- ternational, Las Cruces, N.M.
38
1388 OPTICS LETTERS , Vol. 17, No. 19 / October 1, 1992
IBlue cesium Faraday and Voigt magneto-optic
* atomic line filters
3 J. Menders. P. Searcy, K. Roff, and Eric Korevaar
Thermo Electron Technologies Corporation. 9550 Distribution Avenue. San Diego. California 92121-2305
3 Received June II. 1992
We measured cesium magneto-optic line filter spectra at 455 nm for several field orientations. When opti-mized to achieve the narrowest passbands and the highest transmission, the Faraday filter t B along ki exhibitednear-unity transmission peaks of 0.7-GHz bandwidth with an integrated transmission of -3 GHz. A transmis-sion calculation that includes the field angle was confirmed experimentally and used to show that the Faradayfilter field of view is >60°. We devised- a new type of magneto-optic atomic line filter that uses a transversemagnetic field, which we call the Voigt filter.
To achieve quantum-noise-limited performance, larization rotation of a beam propagating throughbackground-limited laser receivers require narrow- the vapor. On the other hand, a Voigt filter uses aband optical filters. Laser communications and re- transverse magnetic field, which gives rise to a lin-mote sensing have provided a strong impetus for the ear birefringence. Voigt filter passbands are ob-development of a variety of narrow-band filters, in- tained by forming a resonant half-wave plate out ofcluding those that operate in the blue-green for the vapor, oriented at 450 with respect to the inputundersea applications. Magneto-optic atomic line polarizer.filters known as Faraday filters have been shown to The left and right circular refractive indices, n,.
offer near-unity peak transmission and narrow and n,-, are needed to analyze the Faraday filter.passbands at discrete wavelengths associated with Calculations of these indices from atomic parame-atomic transitions, especially those of the alkali ters can be found in the literature.56 With an addi-metals.` 3 For the blue-green region of the spec- tional calculation of the n. index, the dielectrictrum, a Ca filter was recently reported,4 and a filter tensor can be evaluated, and the polarization changeutilizing the blue Cs 6 2s 12-7
2 P3,2 transition at for propagation through a vapor at an arbitrary455 nm has been proposed and analyzed"5 6 but not angle to the magnetic field can be analyzed. In ourdemonstrated until now.] approach, we began by assuming a form for the di-
In this Letter we report what are to our knowl- electric tensor that incorporates a gyration tensor inedge the first transmission spectrum measurements the Fresnel equation,' solved for the eigenindices inof a Cs Faraday filter operated in the wings of the terms of the tensor elements, and evaluated the ten-resonance near 455 nm. We measured spectra sor elements using special cases. Here we use 8 tounder varying conditions designed to demon- denote the angle between the magnetic field and thestrate optimal filter characteristics, check high- wave vector and 4b to denote the angle between thetemperature operation, and anchor field-of-view input polarization and the plane containing the fieldcalculations. We also describe what is to our and the wave vector. Thus, for the Faraday filter,knowledge the first transverse field magneto-optic 0 = 0, and for the Voigt filter, 0 - 90° and 4- = 45'.filter, which we call the Voigt filter, after the Voigt For the Voigt filter, we obtained the simple resulteffect.' A nonoptimal Voigt filter spectrum is that the eigenpolarizations are linear along and per-presented, along with a calculation of an optimized pendicular to the magnetic field, with eigenindicesVoigt filter. The Voigt filter provides a simple n• and 1/2(n,. + n,-), respectively.geometry when permanent magnets are used. We measured blue Cs magneto-optic transmission
Both the Faraday and Voigt filters are based on spectra using the setup shown in Fig. 1. Athe resonant birefringence induced in some atomic 1-in. (2.5-cm) Cs vapor cell [0.8-in. (2-cm) vaporvapors by a magnetic field. The filters are thickness], immersed in a uniform magnetic fieldconstructed by sandwiching the birefringent vapor provided by a Helmholtz coil, was sandwiched be-
between crossed polarizers, so that only light experi- tween crossed Glan-Thompson polarizers. Theencing a net polarization rotation of 900 is passed by vapor density was determined by the temperature-the output polarizer. The required birefringence regulated coldfinger in the cell. Measurements atoccurs close to the atomic absorption line, so that a various field angles were obtained by rotating thepassband is bounded by the absorption line on one magnetic field (0) and rolling the polarizers (40) withside and the decay of the birefringence on the other. the vapor cell held stationary. This approach wasIn the case of the Faraday filter, a magnetic field advantageous over rotating the cell and magnet asoriented along the axis of the filter gives rise to cir- an assembly, in that it precluded Fresnel reflectionscular birefringence, which results in a gradual po- by beams of uncertain polarization. A narrow-band
0146-9592/92/191388-03$5.00/0 3C 1992 Optical Society of America
3 October 1, 1992 / Vol. 17, No. 19 / OPTICS LETTERS 1389
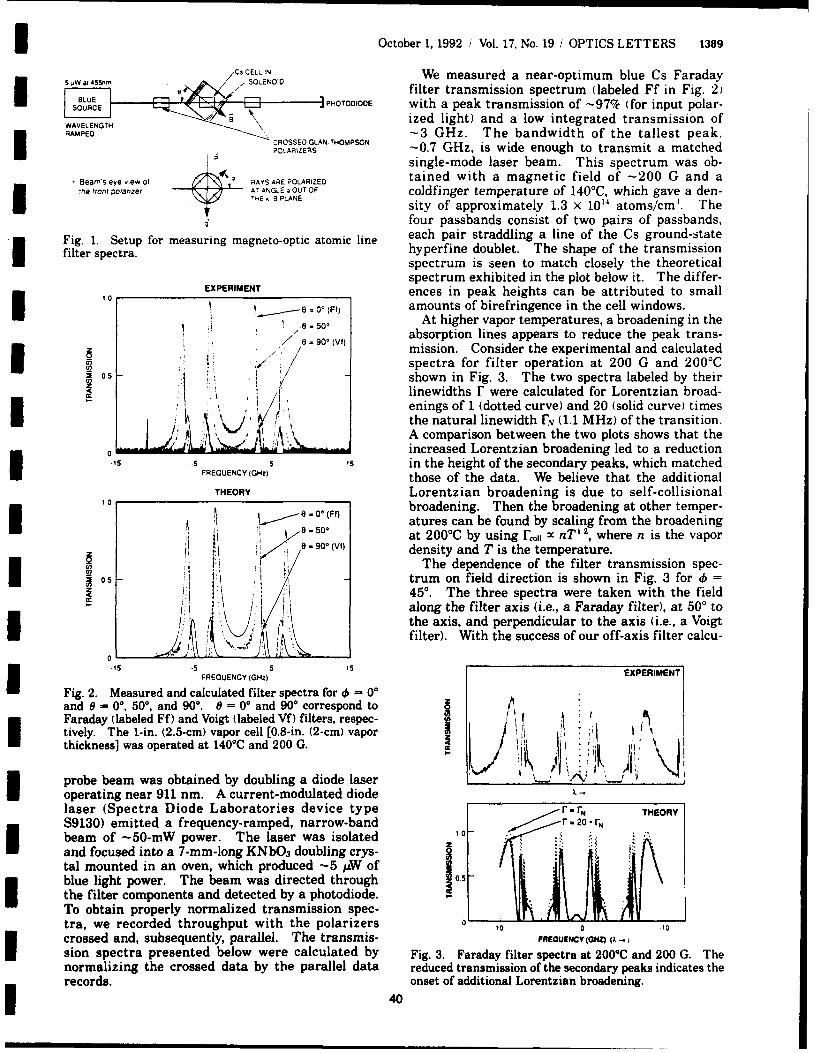
,CSOCELLN We measured a near-optimum blue Cs Faraday5pW at4551M S filter transmission spectrum (labeled Ff in Fig. 2)
U__.j. PHOTODIODE with a peak transmission of -97% (for input polar-WV-G "i ized light) and a low integrated transmission of
RMDOS NGTH -3 GHz. The bandwidth of the tallest peak.
I0-_ARZENS -0.7 GHz, is wide enough to transmit a matchedsingle-mode laser beam. This spectrum was ob-
Beam's eye vew ot R •ASRE POLARIZED tained with a magnetic field of -200 G and a*,e front poianzer AT ANGLE a OUT OF coldfinger temperature of 140°C, which gave a den-
-E .PLANE sity of approximately 1.3 x 10" atoms/cm'. Thefour passbands consist of two pairs of passbands,
Fig. 1. Setup for measuring magneto-optic atomic line each pair straddling a line of the Cs ground-statefilter spectra. hyperfine doublet. The shape of the transmission
spectrum is seen to match closely the theoreticalspectrum exhibited in the plot below it. The differ-EXPERIMENT ences in peak heights can be attributed to small
* 0°(Ff) amounts of birefringence in the cell windows.
At higher vapor temperatures, a broadening in the- e- 50o (vabsorption lines appears to reduce the peak trans-
/ , = 90' () mission. Consider the experimental and calculated
_S ,.spectra for filter operation at 200 G and 200'C02 05 i- shown in Fig. 3. The two spectra labeled by their
linewidths r were calculated for Lorentzian broad-enings of 1 (dotted curve) and 20 (solid curve) times
* • (i 'the natural linewidth Fv (1.1 MHz) of the transition.his' r A'\•j .j\ V' A comparison between the two plots shows that the
0 increased Lorentzian broadening led to a reduction.15 -5 5 , in the height of the secondary peaks, which matched
FREQUENCY (GHz) those of the data. We believe that the additionalTHEORY Lorentzian broadening is due to self-collisional
S0 broadening. Then the broadening at other temper-atures can be found by scaling from the broadening
S' 50 at 200°C by using roll o nT"2 , where n is the vapori I e- 90 (VI) density and T is the temperature.
U) !"The dependence of the filter transmission spec-3 05 - trum on field direction is shown in Fig. 3 ford) =
450. The three spectra were taken with the fieldalong the filter axis (i.e., a Faraday filter), at 500 tothe axis, and perpendicular to the axis (i.e., a Voigt
\. J 5filter). With the success of our off-axis filter calcu-0L
FREQUENCY (GHz) EXPERIMENT
Fig. 2. Measured and calculated filter spectra for 46 - 0°and 0 = 0°, 50°, and 90". 0 - 0° and 90° correspond to 0Faraday (labeled Ff) and Voigt (labeled Vf) filters, respec-tively. The 1-in. (2.5-cm) vapor cell [0.8-in. (2-cm) vaporthickness] was operated at 140°C and 200 G. cc
/ ,L - ,I , ,i' • \
probe beam was obtained by doubling a diode laser I , *
operating near 911 nm. A current-modulated diodelaser (Spectra Diode Laboratories device type rrFN THEORYS9130) emitted a frequency-ramped, narrow-band r: 20.r,
I beam of 50-mW power. The laser was isolatedand focused into a 7-mm-long KNbO3 doubling crys- "tal mounted in an oven, which produced -5 AW of : :blue light power. The beam was directed throughthe filter components and detected by a photodiode.To obtain properly normalized transmission spec-
tra, we recorded throughput with the polarizers 00 0
crossed and, subsequently, parallel. The transmis- FREGrENCY (0HZ) (k
sion spectra presented below were calculated by Fig. 3. Faraday filter spectra at 200°C and 200 G. Thenormalizing the crossed data by the parallel data reduced transmission of the secondary peaks indicates therecords. onset of additional Lorentzian broadening.
40
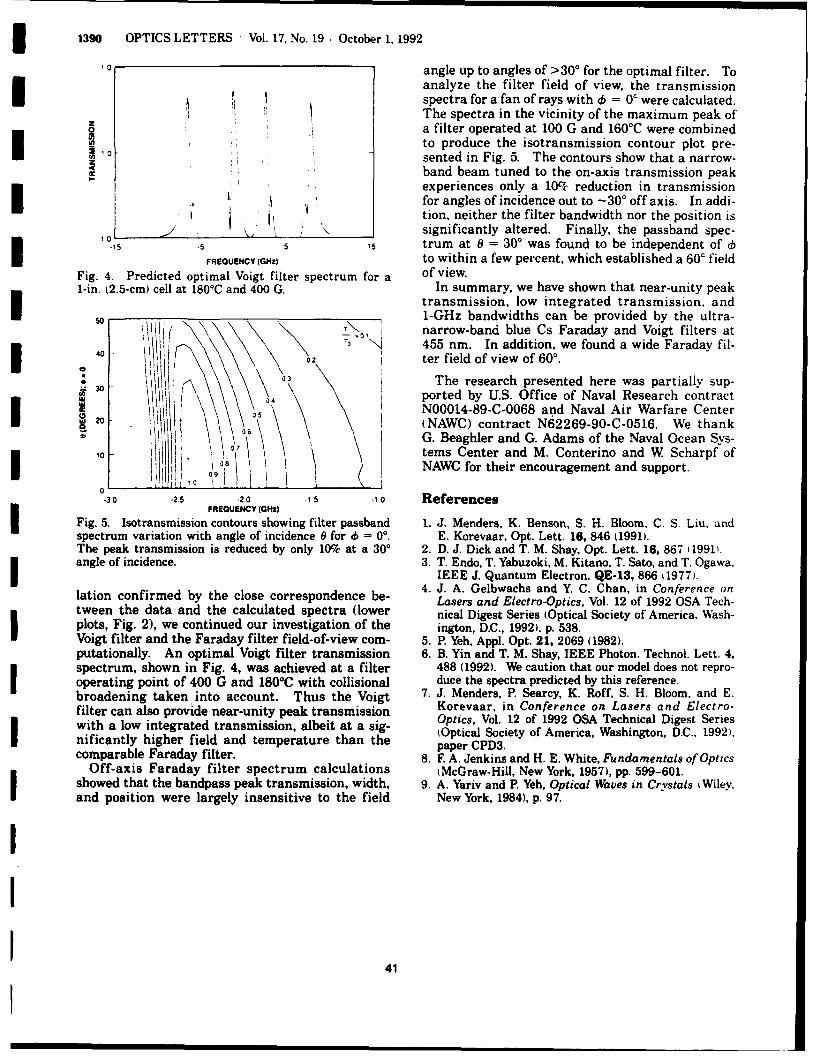
1390 OPTICS LETTERS Vol. 17, No. 19 October 1, 1992
, 0| angle up to angles of >30' for the optimal filter. Toanalyze the filter field of view, the transmissionSspectra for a fan of rays with 6 = 0' were calculated.The spectra in the vicinity of the maximum peak of
a i::a filter operated at 100 G and 1600C were combinedC •to produce the isotransmission contour plot pre-
sented in Fig. 5. The contours show that a narrow-band beam tuned to the on-axis transmission peakII " ' , experiences only a 10%• reduction in transmission
for angles of incidence out to -30' off axis. In addi-•'i tion, neither the filter bandwidth nor the position is
, _____0________________ significantly altered. Finally, the passband spec-'5 .5 51 trum at 0 = 300 was found to be independent of db
FREQUENCY (GHz) to within a few percent, which established a 60' fieldFig. 4. Predicted optimal Voigt filter spectrum for a of view.1-in. (2.5-cm) cell at 180°C and 400 G. In summary, we have shown that near-unity peak
transmission, low integrated transmission, and50 1-GHz bandwidths can be provided by the ultra-
narrow-band blue Cs Faraday and Voigt filters at4 \ ", 455 nm. In addition, we found a wide Faraday fil-4o02 ter field of view of 60°.
14 ; ported by U.S. Office of Naval Research contract
N00014-89-C-0068 and Naval Air Warfare Center2(NAWC) contract N62269-90-C-0516. We thank
G. Beaghler and G. Adams of the Naval Ocean Sys-
i0 ii!]i 0\ 'tems Center and M. Conterino and W Scharpf ofH K iNAWC for their encouragement and support.
00
-3.0 2.5 -20 -1 s .1i ReferencesFR5EUENCY (0HZ)
Fig. 5. Isotransmission contours showing filter passband 1. J. Menders, K. Benson, S. H. Bloom, C. S. Liu, andspectrum variation with angle of incidence 0 for ib = 00. E. Korevaar, Opt. Lett. 16, 846 (1991).The peak transmission is reduced by only 10% at a 30' 2. D. J. Dick and T. M. Shay. Opt. Lett. 16, 867 ' 1991.angle of incidence. 3. T. Endo, T. Yabuzoki, M. Kitano, T. Sato, and T. Ogawa.
IEEE J. Quantum Electron. QE-13, 866 (1977).lation confirmed by the close correspondence be- 4. J. A. Gelbwachs and Y. C. Chan, in Conference on
Lasers and Electro-Optics, Vol. 12 of 1992 OSA Tech-tween the data and the calculated spectra (lower nical Digest Series (Optical Society of America. Wash-plots, Fig. 2), we continued our investigation of the ington, D.C., 1992). p. 538.Voigt filter and the Faraday filter field-of-view com- 5. P. Yeh, Appl. Opt. 21, 2069 (1982).putationally. An optimal Voigt filter transmission 6. B. Yin and T. M. Shay, IEEE Photon. Technol. Lett. 4.spectrum, shown in Fig. 4, was achieved at a filter 488 (1992). We caution that our model does not repro-operating point of 400 G and 180°C with collisional duce the spectra predicted by this reference.broadening taken, into account. Thus the Voigt 7. J. Menders, P. Searcy, K. Roff, S. H. Bloom. and E.filter can also provide near-unity peak transmission Korevaar, in Conference on Lasers and Electro-with a low integrated transmission, albeit at a sig- Optics, Vol. 12 of 1992 OSA Technical Digest Series
(Optical Society of America, Washington, D.C., 1992).nificantly higher field and temperature than the paper CPD3.comparable Faraday filter. 8. F A. Jenkins and H. E. White, Fundamentals of Optics
Off-axis Faraday filter spectrum calculations (McGraw-Hill, New York, 1957), pp. 599-601.showed that the bandpass peak transmission, width, 9. A. Yariv and P. Yeh, Optical Waves in Crystals iWiley,and position were largely insensitive to the field New York, 1984), p. 97.
41
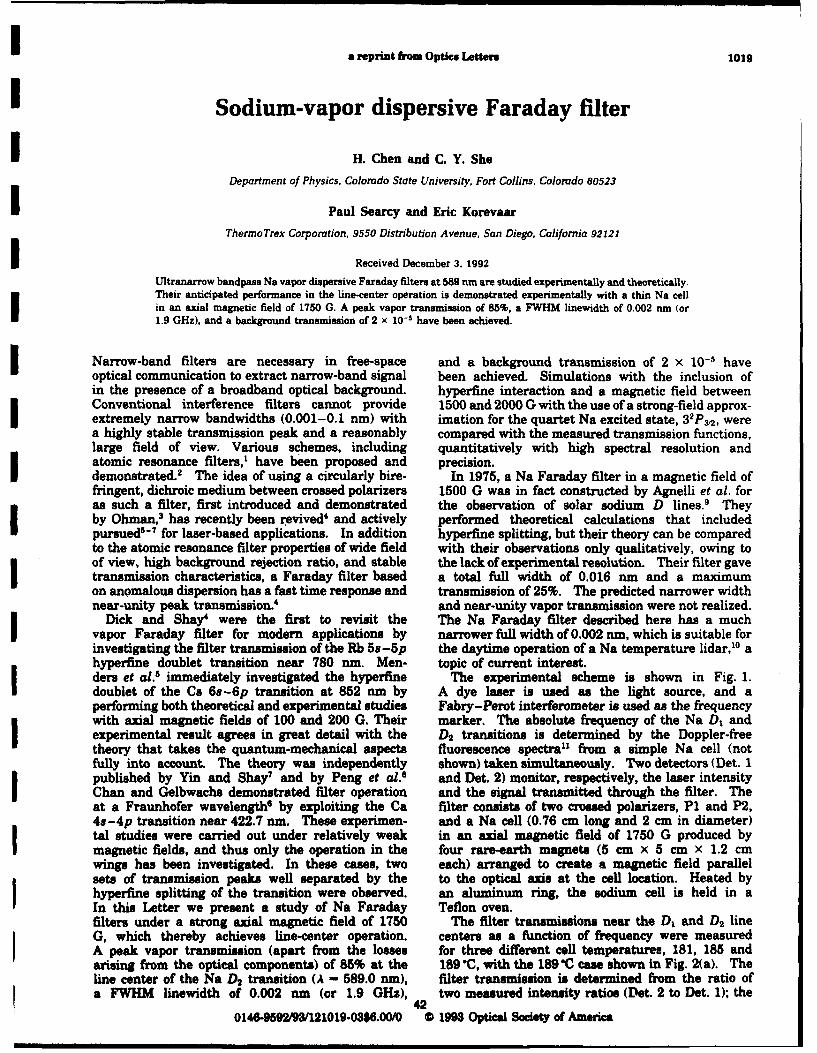
a reprint from Optics Letters 1019
Sodium-vapor dispersive Faraday filter
H. Chen and C. Y. She
Department of Physics. Colorado State UniversiLy, Fort Collins, Colorado 80523
Paul Searcy and Eric Korevaar
ThermoTrex Corporation. 9550 Distribution Avenue, San Diego, California 92121
Received December 3. 1992
Ultranarrow bandpass Na vapor dispersive Faraday filters at 589 nm are studied experimentally and theoretically.Their anticipated performance in the line-center operation is demonstrated experimentally with a thin Na cellin an axial magnetic field of 1750 G. A peak vapor transmission of 85%, a FWHM linewidth of 0.002 nm (or1.9 GHz), and a background transmission of 2 x 10⁻¹ have been achieved.
Narrow-band filters are necessary in free-space and a background transmission of 2 x 10⁻⁵ have
optical communication to extract narrow-band signal been achieved. Simulations with the inclusion ofin the presence of a broadband optical background. hyperfine interaction and a magnetic field betweenConventional interference filters cannot provide 1500 and 2000 G with the use of a strong-field approx-extremely narrow bandwidths (0.001-0.1 nm) with imation for the quartet Na excited state, 32P&, werea highly stable transmission peak and a reasonably compared with the measured transmission functions,large field of view. Various schemes, including quantitatively with high spectral resolution andatomic resonance filters,' have been proposed and precision.demonstrated. 2 The idea of using a circularly bire- In 1975, a Na Faraday filter in a magnetic field offringent, dichroic medium between crossed polarizers 1500 G was in fact constructed by Agnelli et al. foras such a filter, first introduced and demonstrated the observation of solar sodium D lines.9 Theyby Ohman,3 has recently been revived4 and actively performed theoretical calculations that includedpursued5-7 for laser-based applications. In addition hyperfine splitting, but their theory can be comparedto the atomic resonance filter properties of wide field with their observations only qualitatively, owing toof view, high background rejection ratio, and stable the lack of experimental resolution. Their filter gavetransmission characteristics, a Faraday filter based a total full width of 0.016 nm and a maximumon anomalous dispersion has a fast time response and transmission of 25%. The predicted narrower width
near-unity peak transmission.4 and near-unity vapor transmission were not realized.Dick and Shay' were the first to revisit the The Na Faraday filter described here has a much
vapor Faraday filter for modern applications by narrower full width of 0.002 nm, which is suitable forinvestigating the filter transmission of the Rb 5s-5p the daytime operation of a Na temperature lidar,'0 ahyperfine doublet transition near 780 nm. Men- topic of current interest.ders et al.s immediately investigated the hyperfine The experimental scheme is shown in Fig. 1.doublet of the Cs 6 s- 6 p transition at 852 nm by A dye laser is used as the light source, and aperforming both theoretical and experimental studies Fabry- Perot interferometer is used as the frequencywith axial magnetic fields of 100 and 200 G. Their marker. The absolute frequency of the Na D, andexperimental result agrees in great detail with the D2 transitions is determined by the Doppler-freetheory that takes the quantum-mechanical aspects fluorescence spectral' from a simple Na cell (notfully into account. The theory was independently shown) taken simultaneously. Two detectors (Det. 1published by Yin and Shay7 and by Peng et al.8 and Det. 2) monitor, respectively, the laser intensityChan and Gelbwachs demonstrated filter operation and the signal transmitted through the filter. Theat a Fraunhofer wavelength' by exploiting the Ca filter consists of two crossed polarizers, P1 and P2,4s-4p transition near 422.7 nm. These experimen- and a Na cell (0.76 cm long and 2 cm in diameter)tal studies were carried out under relatively weak in an axial magnetic field of 1750 G produced bymagnetic fields, and thus only the operation in the four rare-earth magnets (5 cm x 5 cm x 1.2 cmwings has been investigated. In these cases, two each) arranged to create a magnetic field parallelsets of transmission peaks well separated by the to the optical axis at the cell location. Heated byhyperfine splitting of the transition were observed. an aluminum ring, the sodium cell is held in aIn this Letter we present a study of Na Faraday Teflon oven.filters under a strong axial magnetic field of 1750 The filter transmissions near the D, and D2 lineG, which thereby achieves line-center operation. centers as a function of frequency were measuredA peak vapor transmission (apart from the losses for three different cell temperatures, 181, 185 andarising from the optical components) of 85% at the 189"C, with the 189"C case shown in Fig. 2(a). The
line center of the Na D2 transition (A - 589.0 nm), fiter transmission is determined from the ratio ofa FWHM linewidth of 0.002 nm (or 1.9 GHz), two measured intensity ratio@ (et. 2 to Det. 1); the
420146-959M/3121019.03$6.00/ 0 IM99 Optical Society of America
1020 OPTICS LETTERS / Vol. 18, No. 12 / June 15, 1993
sl s2 Pi B P2 polarizers, P1 and P2, are set parallel to each other.At the line center, the transmission function of the
Dyeacl D2 line has its peak value, whereas it shows a dipfor the D1 line. The peak transmission of the D2
aswer Inwensit7 y Signal line is higher than that of the D, line by more thana factor of 2. As the cell temperature increases,7 F-P omthe transmissions for both D, and D)2 lines increase
SComputer and the linewidth of the D2 line decreases. TheFrequency Marker measured peak transmission, the FWHM linewidth,
Scan Contol and the equivalent noise bandwidth for all three tem-peratures are given in Table 1, along with the associ-
Fig. 1. Experimental setup for measuring the filter ated theoretical values. The effective optical depthtransmission. The Na vapor cell is held in a Teflon oven, of the filter, 7, is defined as Ne2 tfIL/vi(dwd)mcE0o,where four rare-earth permanent magnets are arranged where f, L, and (dwd) are, respectively, the emissionso that the magnetic field at the cell position is axial.F-P, Fabry-Perot interferometer; S1, S2, beam splitters; oscillator strength, the cell length, and v'2 times theB, magnetic field. rms Doppler width of the transition. The calculated
and measured values are in good agreement. In ad-,- dition to the extinction of the crossed polarizers, the
0.8.....................(a) background transmission depends more critically onD2 the temperature-dependent birefringence of the cell
0.6 window. At the operation temperatures, we mea-0.4 - sured the background transmission to be 2 X 10-.
The theory of a vapor dispersive Faraday filter has0. 0.2 been described previously2 4 -9 and is not repeated
0 I here. To obtain the numerical results for the D, and)D2 transitions, we solve the eigenvalue problem of
-0.2_- a Na atom in an axial magnetic field including the-is -10 -s 0 s 10 is hyperfine interaction for the 32SL, 32 PL, and 32P3
Frequency (GHz) manifolds separately; a rough estimate of the ra-tio of hyperfine to Zeeman energies, DHh/DHz,,
(gives 320/B, 100/B, and 10/B, respectively, where0.8 .. .. B is the axial magnetic field in Gauss. Because
D the field strength of interest is between 1500 and.. ..... 200 G.. we..... solve the.. eiev.u prbe o 2S
and 32 P• manifolds exactly and use the strong-field~0.4 . .. . approximation for the 32P" manifold. The calcu-
lated transmission function for the cell temperatureD of 189 'C and magnetic field of 1750 G is shown
0.2 0 . 1 1 in Fig. 2(b), which is in good agreement with the-1s -10 -5 0 s 10 is measured results shown in Fig. 2(a). The agreement
I Frequency (GHz) holds for cell temperatures of 181 and 185 "C as well.Fig. 2. (a) Experimental and (b) theoretical filter trans- The filter parameters for all three cases are comparedmissions for D, and D2 lines in an axial magnetic field of in Table 1. Using the existing code for the I -1750 G with a cell, 0.76 cm long, at 189 *C. 3/2 case,5 we have also calculated the transmission
function for the case of 1750 G and 189 C exactlynumerator is the intensity ratio at the frequency and found it to be in complete agreement with resultof interest when the polarizers, P1 and P2, are set based on a strong-field approximation for the 32PYperpendicular to each other as required for the filter manifold.operation, and the denominator is the intensity ratio To understand the transmission functions of theoff resonance (by 0.3 nm, for example) when the line-center operation for D, and D2 transitions in
Table 1. Experimental and Theoretical Na Faraday Filter Characteristics for the Di and D2 lines in anAxial Magnetic Field of 1750 G
• Peak Transmission (%) FHM (GHz)Effective Optical Equivalent NoiseTemperature Depth r Experimental Theoretical Experimental Theoretical Bandwidth (GHz)
D, 181 2.56 19 21 10.2 10.2 8.2185 3.36 28 29 9.9 10.2 8.4189 4.21 37 37 10.5 10.4 8.3
D2 181 2.56 58 58 3.4 3.4 5.2185 3.36 76 78 2.5 2.4 5.0189 4.21 85 85 1.9 1.8 5.1
43
June 15, 1993 / Vol. 18, No. 12 / OPTICS LETTERS 1021
I t •As is shown in Fig. 3(b), if the Faraday rotation angle3.. a)I at the center of D 2 line is -7r/2, the transmissionDZ D, of D2 will decrease if we increase the vapor den-
± sity. A higher magnetic field would be needed for-4 the peak transmission to exceed 85%. However, if~ VDL / D, the rotation at the line center of the D, transitiono \6/ _ is only 0.167r, its peak transmission will continue
0 , to increase as the Na density increases. Since the_ __hyperfine splitting of the Na ground state is onlys s1.7 GHz, comparable with its Doppler broadening,s10 0 10 i unlike for the case of Cs, 4
.7 the behavior of the Na
Frequency (GHz) filter transmission function is qualitatively the same
0.6as the case without hyperfine splitting, which was( considered by Yeh. 2
-0.4 .In conclusion, we have demonstrated the expected}° D line-center operation of an ultranarrow bandpass0.2 ... .. ....... vapor dispersive Faraday filter. With a Na cell of
0.76 cm in length in an axial magnetic field ofV 01750 G, the peak transmission has reached 85%
-0.2 with a FW`HM bandwidth of only 1.9 GHz. Thebackground transmission off resonance has been
-0.44 I i i blocked to a level of 2 x 10⁻¹. Theoretical and-IS -10o - o s is experimental results are in good agreement for both
Frequency (GHz) D, and D2 transitions. Since the hyperfine energy is
Fig. 3. Calculated (a) optical depth a-L (not to be con- less than 0.7% of the Zeeman energy for the quartetfused with r) and (b) Faraday rotation (angle) for the a' Na excited state, 32 P•, in a magnetic field greaterand a- transitions of the Di and D2 lines of a Na cell, 0.76 than 1500 G, the strong-field approximation may becm long, in an axial magnetic field of 1750 G at 189 *C. used in calculation for this manifold. In addition tofree-space communication, a unique application for a
more detail, we plot the optical depth, a=L (not to narrow bandpass filter at Na resonance is to blockbe confused with r, with a - being the absorption effectively the broadband sunlit sky background tocoefficient), and the angle of Faraday rotation for aid the observation of solar sodium D lines 9 and forthe oa- and oa- transitions as shown in Figs. 3(a) the daytime operation of a Na temperature lidar.'°and 3(b). As mentioned above, under a strong B The research at Colorado State University wasfield, a* and o- absorption peaks are separated done with the experimental assistance of J. R. Yufrom each other, showing negligible circular dichro- and was partially supported by National Scienceism at the line center. The transmission is deter- Foundation grant ATM-91-01842. The research atmined mainly by the Faraday rotation, which shows ThermoTrex was conducted under Strategic Defensea dip in the center owing to the fact that the Zeeman Initiative Organization/SSDC contract DASG60-89-shift, -3.3 GHz, is larger than the FWHM Doppler C-0120 and U.S. Office of Naval Research contractlinewidth by more than a factor of 2. For the D, N00014-89-C-0068 and with the support of Kepi Wu,transition the absorption peaks occur farther away John Johnson, and Guy Beaghler.from the line center than do the peaks of the Faradayrotation, which leads to four resolvable peaks in Referencesthe transmission function There are four peaks inthe profile of the D2 absorption coefficient because 1. J. A. Gelbwachs, IEEE J. Quantum Electron. 24, 1266the total electron angular momentum of the excited (1988).state is 3/2. The two peaks that have larger tran- 2. P. Yeh, Appl. Opt. 21, 2069 (1982).sition matrix elements are closer to the line center, 3. Y. Ohman, Stockholm Obs. Ann. 19, 3 (1956).-2.4 GHz away. This combination gives a Faraday 4. D. J. Dick and T. M. Shay, Opt. Lett. 16, 867 (1991).
5. J. Menders, K Benson, S. H. Bloom, C. S. Liu, and E.rotation for a strong peak in the line center plus two Korevaar, Opt. Lett. 16, 846 (1991).weak satellite peaks in the transmission.2 Under 6. Y. C. Chan and J. A. Gelbwachs, IEEE J. Quantuma proper setting of cell temperature, the two satel- Electron. (to be published).lite peaks may be suppressed as the strong dichro- 7. B. Yin and T. M. Shay, Opt. Lett. 16, 1617 (1991).ism overlaps the extrema in Faraday rotation. With 8. Y. F. Peng, J. X. Tang, and Q. J. Wang, Acta Phys.large dichroism occurring near the strong D2 absorp- Sinica 2, 39 (1992).tion peaks, ± 1.5 to ±3.5 GHz from the line center, one 9. G. Agnelli, A. Cacciani, and M. Fofi, Solar Phys. 44,Ip 509 (1975).circularly polarized component is nearly completely 10. C. Y. She, H. Latifi, J. R. Yu, R. J. Alvarez II, R. E.
absorbed, while the other component totally trans- Bills, and C. S. Gardner, Geophys. Res. Lett. 17, 929mitted, giving a filter transmission of roughly 25%. (1990).Since the oscillator strength of the D, line is half as 11. C. Y. She, J. R. Yu, H. Latifi, and R. E. Bills, Appl.large as that of the D, line, the D, line has a smaller Opt. 31, 2095 (1992).Faraday rotation, thus a lower peak transmission.
44
IIIIIIIII 4. Locked Laser
II
III
2B47-R 45
Optics Communications 88 (1992) 385-390 OPTICSNorth-Holland COMMUNICATIONS
A Q-switched alexandrite laser injection seeded by a rubidiumabsorption frequency matched diode laser
K. Choi, S.H. Lin, Eric Korevaar and C.S. LiuThermo Electron Technologies. 9550 Distribution Avenue. San Diego. CA 92121. L'SA
Received 25 August 1991
We developed a narrowband Q-switched alexandrite laser injection seeded by a diode laser which was frequency stabilized tothe 780 nm rubidium atomic absorption line. We were able to get injection seeded single-mode output pulses of - 10 mJ per pulseenergy at 780 nm with - 200 ns fwhm pulse duration. By using a side injection scheme and an active cavity length control tech-nique high efficiency injection locking was obtained with small injection power. This system was used as an illumination sourcefor atomic line filters with excellent long term stability and day4o-day reliability.
1. Introduction. tral and spatial properties would otherwise not be sogood [ 2 J. By injecting the master laser output beam
The alexandrite laser can be tuned to match the into the slave laser cavity the high power slave laseratomic absorption wavelengths in potassium and ru- can have a single mode laser output without the usebidium which are useful materials for atomic line fit- of etatons or other intra-cavity line selecting ele-ters [ 1]. Atomic line filters using potassium require ments. Previous reports on injection seeding of ansignal photon wavelengths of 767 or 770 nm while alexandrite laser used end injection schemes in whicha rubidium filter requires 780 nm signal photons. All the diode laser beam was injected through the highthese wavelengths are covered by an alexandrite las- reflecting end mirror [ 31 or the output coupler [ 4 1.er's tuning range. For remote target detection in We report here the use of a side injection scheme inwhich a laser beam is scattered off of an object and which the rubidium absorption frequency matchedthe return signal is detected, the transmitted power diode laser beam is injected into the resonance con-requirement is generally high enough to require a dition matched alexandrite oscillator from the sidepulsed laser. And, to be useful for the atomic line fil- through a polarizing beam splitter to provide a largeter applications the signal laser bandwidth needs to number of injecting photons during the early stagesbe smaller than the Doppler width of the atomic of the Q-switch pulse buildup.transition so that most of the signal photons are ab-sorbed in the atomic vapor cell. The power andbandwidth requirements for many applications can 2. Theorybe met by using a Q-switched alexandrite laser in-jection seeded by a single mode cw diode laser locked The cavity field equation when the injection seed-to an atomic or molecular absorption feature at the ing beam is present [51 iswavelength of interest.
Injection seeding-which is the term used for dE.(t)/dt=?n(t) Eo,(t)pulsed lasers - and injection locking - the term usedfor cw lasers - is a technique by which a low-powerlaser with desirable frequency and spatial properties In this equation E,, is the injected field with fre-(the master) is used to impose its good character- quency w, E. is the cavity field at the injected fre-istics onto a high power laser (the slave) whose spec- quency c(, m(t) is the time dependent gain term in
0030-4018/92,'$05.00 ( 1992 Elsevier Science Publishers B.V All rights reserved. 385
46
Volume 88, number 4.5.6 OPTICS COMMUNICATIONS I April 1992
the laser cavity (per unit time), and 2T is the cavity I: 2:10 thickness ratio ( I corresponds to a 0.5 mmround trip time. During the initial buildup stage, thickness quartz plate) is used to tune the laser towhen in(t) is small. the field is driven mainly by the 780 rim.second term which is the Fabry-Perot modulated in- The alexandrite laser rod is a biaxial crystal withjection field. When the gain is larger than the loss three crystallographic axes. The c-axis is parallel toand m becomes large. the first term, which is the am- the optic z-axis and the b-axis is set parallel to theplification term, soon dominates over the second laser beam polarization direction since the laser gainterm. Hence, the influence of the injected field on with b-axis parallel to the E-field (bilE) is ten timesthe cavity field is important only during the initial higher than for allE. Perfect parallelism between bbuildup time of the slave oscillator. Numerical stud- and E is very important since the residual birefrin-ies [ 51 detailing eq. ( I ) show that when there is a gence due to a mismatch between E-field polariza-frequency mismatch between the frequency of the tion direction and the b-axis prevents continuousinjected field and the cavity resonance frequency, the tuning of the laser [6 1.injection field undergoes a rapid phase change which The injection seeding source is a gain guided diodecauses the field frequency to shift toward the nearest laser (Mitsubishi ML 4102) emitting 3 mW outputaxial mode of the slave oscillator during the ampli- power at 780 nm with <30 MHz linewidth. Thefication process. In other words, the output fre- wavelength tunability of this diode laser is 0.016 nm/quency is determined by the slave oscillator, not by mA for bias current tuning and 0.22 nm/* C for tem-the master oscillator. The detuning range for single perature tuning. The output frequency of the diodeaxial mode operation is defined as the frequency de- laser is locked to an atomic rubidium absorption linetuning range over which the output power ratio be- by using a reference rubidium cell, a small wave-tween the seeded axial mode and the non-seeded ad- length modulation, and an electronic feedback cir-jacent axial mode always exceeds an arbitrary set cuit. In this experiment, we used the strongest ab-value. sorption maximum of the rubidium 5s,/2-- 6 p3,2
hyperfine transitions at 780 nm The linewidth of thelaser was determined to be - 30 MHz (fwhm) from
3. Experimental detail interferometric fringe visibility measurements. Thediode laser is powered by a battery operated ultra low
Fig. I shows a schematic of the experimental setup noise current source (ILX Lightwave LDX-3620)used in the injection seeding demonstration. The and its temperature is controlled by a thermoelectricwhole setup can be divided into the alexandrite laser, temperature controller which has better than 0.0 ! *Cthe injection seeder and the interfacing optics. The stability and ±0.2"C accuracy. The diode laser isslave oscillator is a modified SEO (Schwartz Electro mounted in a temperature controlled laser diodeOptics) laser 1-2-3 alexandrite laser which is tunable mount which includes a thermoelectric cooler and afrom 720-790 nm. The laser rod size is 5 mm di- lens assembly for beam collimation. A Faraday iso-ameter X 75 mm length with 0.12% atomic weight lator is used to block unwanted alexandrite laser lightCr concentration. The charging unit supplies the from reaching the diode laser.charging current and voltage to a PFN with a 1000 The s-polarized diode laser beam is injected intoJ/s charging capacity. The PFN charging capaci- the alexandrite cavity from the side. Before Q-tance is 200 piF. Cooling is done by circulating switching, the s-polarized injection beam becomes p-deionized water with a Neslab circulator with I gpm polarized after passing the quarter wave plate twiceflow rate at 60 psi pressure. The Q-switch is a KD*P and thus passes through the alexandrite rod. When.crystal with 780 nm AR coated windows and a as a result of Q-switching, the quarter wave plate isquarter-wave (./4) voltage of 2.4 kV. The total nullified by the Q-switch, the s-polanzed injectionlength of the cavity is 65 cm. The output coupler is seeding beam will not reach the alexandrite rod.a 80% reflective flat mirror and the rear mirror is a During the Q-switch build up period, the laser cavity98% reflective concave mirror with 5 meter radius of losses decrease (allowing buildup of laser oscilla-curvature. A three plate birefringent filter with a tion) at the same time that the injected power in the
386
47
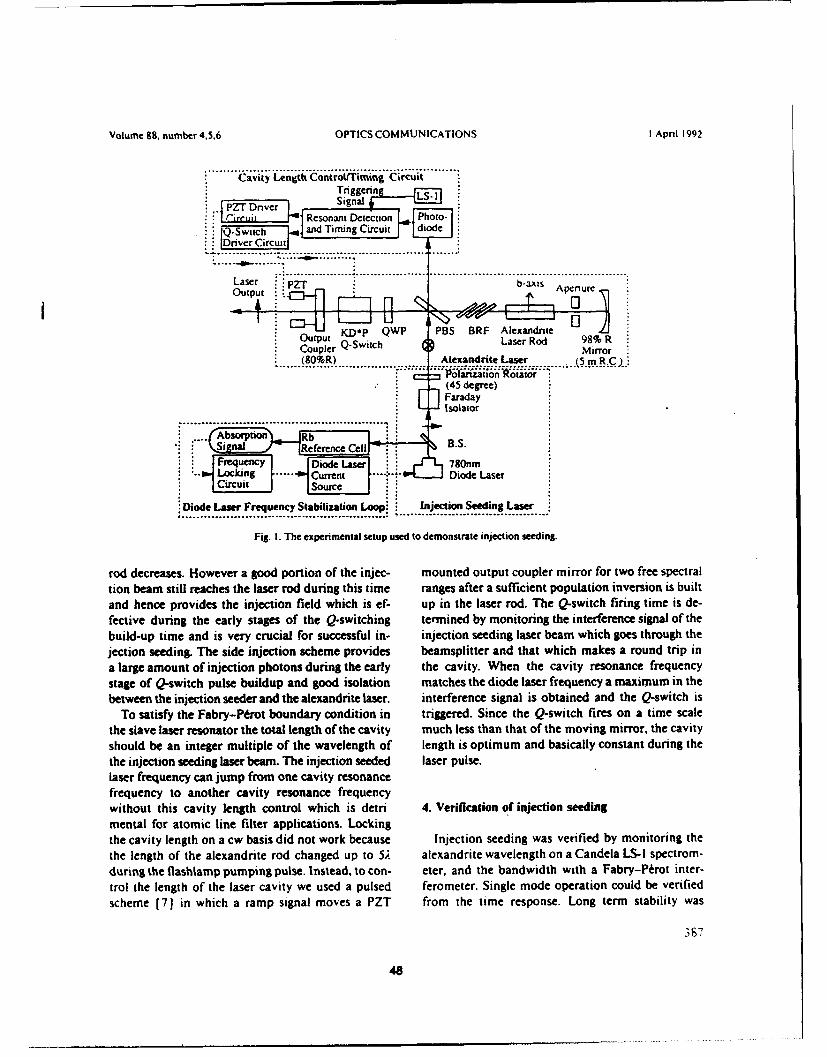
Volume 88, number 4.5.6 OPTICS COMMUNICATIONS I April 1992
.. . ... .......................................... ..........Caity Length Control/Timning Circuit
TnggeninaSPZT Driver l Signal • ...
fl-rcir m, f1Resoat Dectoon Photo-IPT-SwZich . and Timing Circuit - di oe
[Driver Circuit
....... .m .R............................. !... ..... •.... • .................... g............ ......
Laser b-xiOutput0
KD-PQWP PBS BRF AlexandriteOutput Laser Rod 98% RCoupler Q-Swztch Mro
....(80%.R) ....... ...... ..Alexatidrite.Laser ....... or........ ........ ."......i;;i"R6~i "
(45 degree)FaradayIsolator
A-bs-or-ption) Rb BSSi fnal Reference Cell B.S.
Frequency Diode Laser 780nm" LOCking ..... Curen .- Diode Laser
Diode Laser Frequency Stabilization Loop. Injection Seeding Laser........................................................................
Fig. I. The experimental setup used to demonstrate injection seeding.
rod decreases. However a good portion of the injec- mounted output coupler mirror for two free spectraltion beam still reaches the laser rod during this time ranges after a sufficient population inversion is builtand hence provides the injection field which is ef- up in the laser rod. The Q-switch firing time is de-fective during the early stages of the Q-switching termined by monitoring the interference signal of thebuild-up time and is very crucial for successful in- injection seeding laser beam which goes through thejection seeding. The side injection scheme provides beamsplitter and that which makes a round trip ina large amount of injection photons during the early the cavity. When the cavity resonance frequencystage of Q-switch pulse buildup and good isolation matches the diode laser frequency a maximum in thebetween the injection seeder and the alexandrite laser. interference signal is obtained and the Q-switch is
To satisfy the Fabry-Ptrot boundary condition in triggered. Since the Q-switch fires on a time scalethe slave laser resonator the total length of the cavity much less than that of the moving mirror, the cavityshould be an integer multiple of the wavelength of length is optimum and basically constant during thethe injection seeding laser beam. The injection seeded laser pulse.laser frequency can jump from one cavity resonancefrequency to another cavity resonance frequencywithout this cavity length control which is detri 4. Verification of injection seedingmental for atomic line filter applications. Lockingthe cavity length on a cw basis did not work because Injection seeding was verified by monitoring thethe length of the alexandrite rod changed up to 5. alexandrite wavelength on a Candela LS-I spectrom-during the flashlamp pumping pulse. Instead, to con- eter, and the bandwidth with a Fabry-Ptrot inter-trol the length of the laser cavity we used a pulsed ferometer. Single mode operation could be verifiedscheme (7) in which a ramp signal moves a PZT from the time response. Long term stability was
347
48
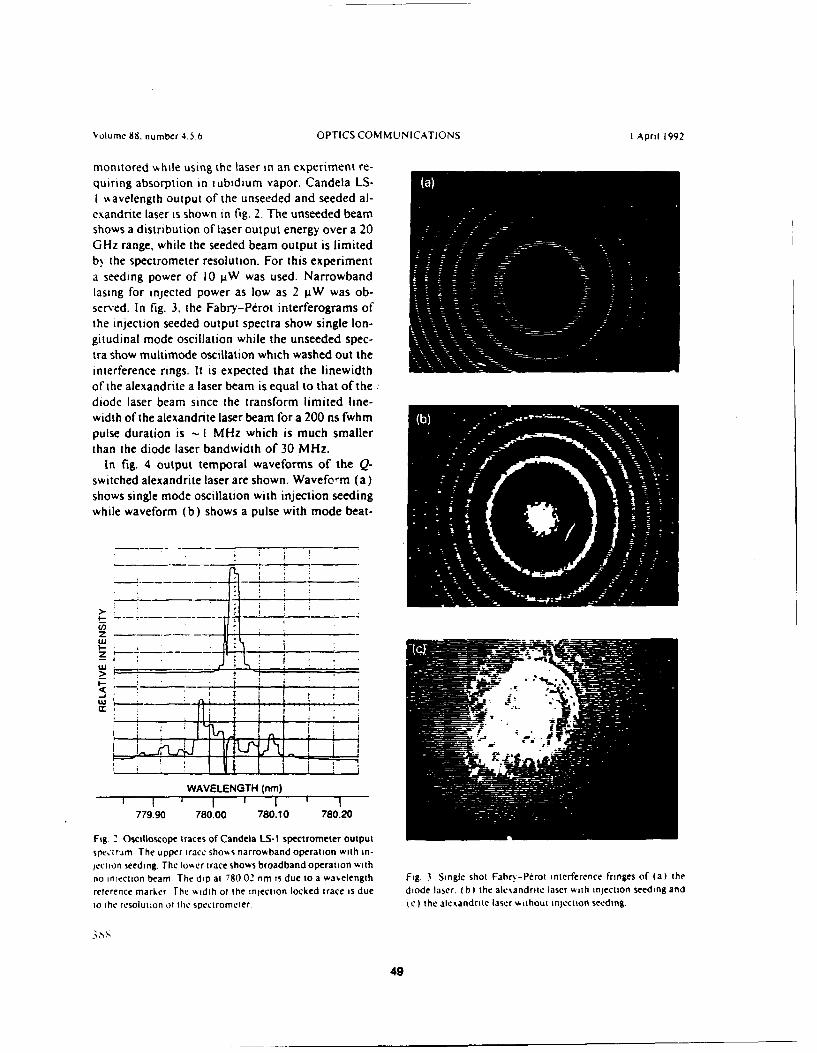
"Nolume 88. number 4.5.6 OPTICS COMMUNICATIONS I April 1992
monitored while using the laser in an experiment re-quiring absorption in iubidium vapor. Candela LS-i wavelength output of the unseeded and seeded al-cxandrite laser is shown in fig. 2. The unseeded beamshows a distribution of laser output energy over a 20GHz range, while the seeded beam output is limitedby the spectrometer resolution. For this experimenta seeding power of 10 pW was used. Narrowbandlasing for injected power as low as 2 pW was ob-served. In fig. 3. the Fabry-Perot interferograms ofthe injection seeded output spectra show single lon-gitudinal mode oscillation while the unseeded spec-tra show multimode oscillation which washed out theinterference rings. It is expected that the linewidthof the alexandrite a laser beam is equal to that of thediode laser beam since the transform limited line-width of the alexandrite laser beam for a 200 ns fwhmpulse duration is I I MHz which is much smallerthan the diode laser bandwidth of 30 MHz.
In fig. 4 output temporal waveforms of the Q-switched alexandrite laser are shown. Wavefom (a)shows single mode oscillation with injection seedingwhile waveform (b) shows a pulse with mode beat-
Z --z
> I
WAVELENGTH (nm)SI t I '
779.90 780.00 780.10 780.20
Figý 2. Oscilloscope traces of Candela LS-I spectrometer outputspectrum. The upper trace shov~s narrovband operation with in-jection seeding. The Iover trace shows broadband operation withno inlection beam. The dip at 780.02 nm is due to a wa,.elength Fig. 3. Single shot Fabr%.-Perot interference fringes of (a) thereference marker The % idih of the injection locked trace is due diode laser. (b) the alcandrite laser with injeciton seeding andto the resolution oitlic spectrometer. (c) the alexandrite laser without injection seeding.
49
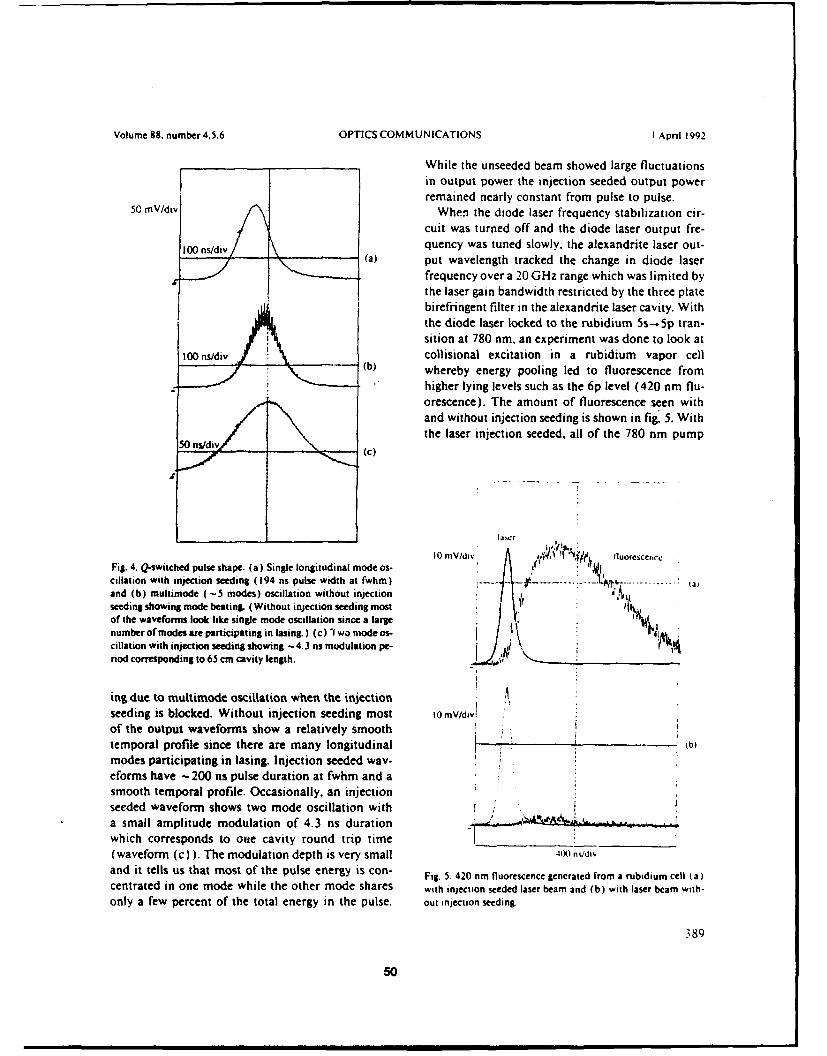
Volume 88. number 4.5.6 OPTICS COMMUNICATIONS I April 1992
While the unseeded beam showed large fluctuationsin output power the injection seeded output powerremained nearly constant from pulse to pulse.
50 mV/div •When the diode laser frequency stabilization cir-cuit was turned off and the diode laser output fre-
10 quency was tuned slowly, the alexandrite laser out-(a) put wavelength tracked the change in diode laser
frequency over a 20 GHz range which was limited bythe laser gain bandwidth restricted by the three platebirefringent filter in the alexandrite laser cavity. Withthe diode laser locked to the rubidium Ss-.Sp tran-sition at 780 nm. an experiment was done to look at
100nsidiv A collisional excitation in a rubidium vapor cell-(b) whereby energy pooling led to fluorescence from
"higher lying levels such as the 6p level (420 nm flu-orescence). The amount of fluorescence seen withand without injection seeding is shown in fig. 5. Withthe laser injection seeded, all of the 780 nm pump
I aw' r
10 mV/d, L ,, '"74 ,luorescereFig. 4. Q-switched pulse shape. (a) Single longitudinal mode os- Acillation with injection seeding (194 ns pulse width at fwhm) -.. .: . ---------and (b) multimode (-5 modes) oscillation without injection 117'seeding showing mode beating. (Without injection seeding mostof the waveforms look like single mode oscillation since a largenumber of modes are participating in lasing.) (c) " wo mode os-cillation with injection seeding showing - 4.3 ns modulation pe-nod corresponding to 65 cm cavity length.
in% due to muttimode oscillation when the injectionseeding is blocked. Without injection seeding most i0 mV/div!
of the output waveforms show a relatively smoothtemporal profile since there are many longitudinal -b)modes participating in lasing. Injection seeded wav-eforms have - 200 ns pulse duration at fwhm and asmooth temporal profile. Occasionally, an injectionseeded waveform shows two mode oscillation witha small amplitude modulation of 4.3 ns duration.__"__ __
which corresponds to onse cavity round trip time ________ ______
(waveform (c)). The modulation depth is very small 4(t) ns/di'
and it tells us that most of the pulse energy is con- Fig. 5. 420 nm fluorescence generated from a rubidium cell (a)centrated in one mode while the other mode shares with injection seeded laser beam and (b) with laser beam with-only a few percent of the total energy in the pulse. out injection seeding.
389
50
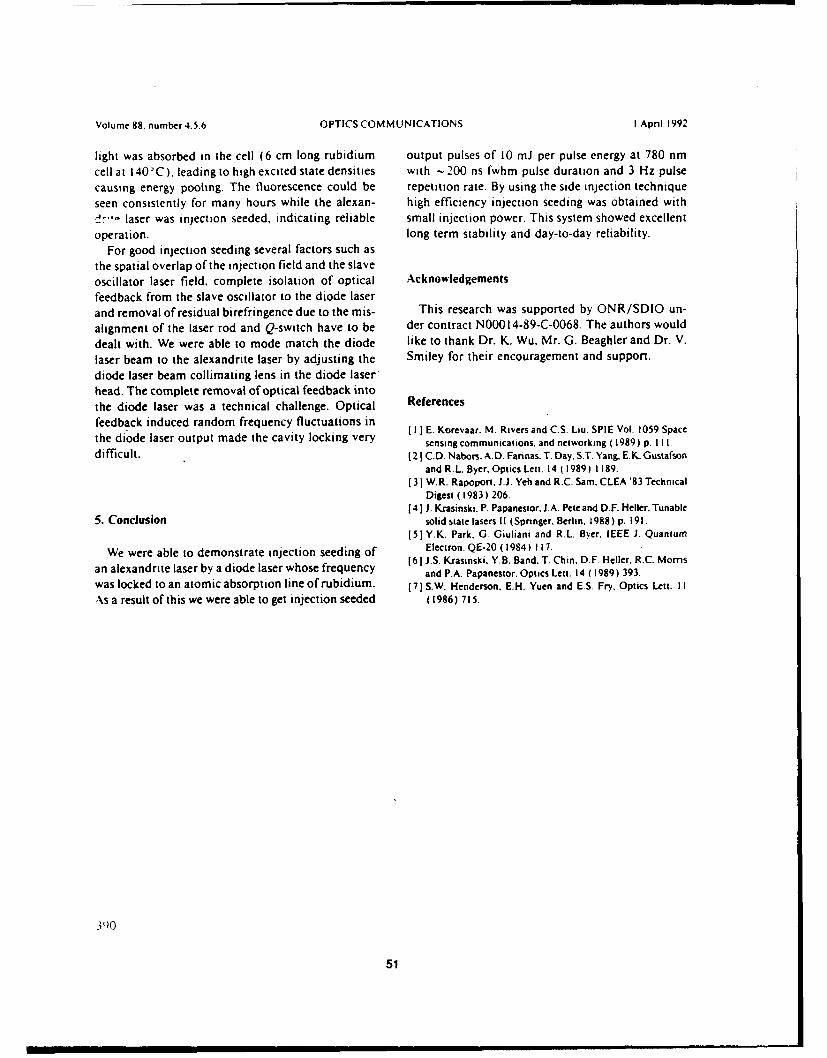
Volume 88, number 4.5.6 OPTICS COMMUNICATIONS I Apnl 1992
light was absorbed in the cell (6 cm long rubidium output pulses of 10 mJ per pulse energy at 780 nmcell at 140'C), leading to high excited state densities with - 200 ns fwhm pulse duration and 3 Hz pulsecausing energy poohng. The fluorescence could be repetition rate. By using the side injection techniqueseen consistently for many hours while the alexan- high efficiency injection seeding was obtained with
" laser was injection seeded, indicating reliable small injection power. This system showed excellentoperation. long term stability and day-to-day reliability.
For good injection seeding several factors such asthe spatial overlap of the injection field and the slaveoscillator laser field, complete isolation of optical Acknowledgementsfeedback from the slave oscillator to the diode laserand removal of residual birefringence due to the mis- This research was supported by ONR/SDIO un-
alignment of the laser rod and Q-switch have to be der contract NOOO I 4-89-C-0068. The authors would
dealt with. We were able to mode match the diode like to thank Dr. K. Wu. Mr. G. Beaghler and Dr. V.
laser beam to the alexandrite laser by adjusting the Smiley for their encouragement and support.
diode laser beam collimating lens in the diode laserhead. The complete removal of optical feedback intothe diode laser was a technical challenge. Optical Referencesfeedback induced random frequency fluctuations infee c dinde aserouptandom frequencaity fluctuations iy I E. Korevaar. M. Rivers and C.S. Li. SPIE Vol. 1059 Spacethe diode laser output made the cavity locking very sensing communications. and networking (1989) p. I II.
difficult. 121 C.D. Nabors. A.D. Fannas. T. Day. ST. Yang. E.K. Gustafson
and R.L. Byer, Optics Lett. 14 (1989) 1189.[3 J W.R. Rapoport. J.J. Yeh and R.C. Sam. CLEA '83 Technical
Digest (1983) 206.[41 J. Krasinski. P. Papanestor. J.A. Pete and D.F. Heller. Tunable
5. Conclusion solid state lasers II (Spnnger. Berlin. 1988) p. 191.[51 Y.K. Park, G_ Giuliani and R.L. Byer. IEEE J. Quantum
We were able to demonstrate injection seeding of Electron. QE-20 (1984) 117.[61 J.S. Krasinski. Y.B. Band. T. Chin. D.F. Heller. R.C. Morms
an alexandrite laser by a diode laser whose frequency and P.A. Papanestor. Optics Leti. 14 (1989) 393.
was locked to an atomic absorption line of rubidium. 171] S.W. Henderson, E.H. Yuen and E.S. Fry, Optics Lett. I I
As a result of this we were able to get injection seeded (1986) 715.
390
51

IIIIIIII* 5. Combat IDIIIIIIIII 2847-A 52
I
i
I
COMBAT IDENTIFICATION USING A FARADAY FILTER
J. Menders and P. Searcy
ABSTRACT
This project produced a preliminary demonstration of an optical combat identification (CID)
system featuring an optical receiver with an atomic line filter. These filters are needed foroptical receivers to detect weak signals at the quantum limit in the presence of background
noise. Without adequate background rejection, compensating increases in laser power arerequired. We designed and constructed a CID system comprised of a low power, (ANSI
standard) eyesafe diode laser interrogator, a modulated retro-reflector responder and anoptical receiver with an atomic line filter. To permit hand pointing of the interrogator, the
interrogator beam divergence and receiver field of view were large, > 1 mrad. The system
was designed to show that a responder identification code could be read at a range of about5 km. Preliminary tests at 0.25 km demonstrated code reception by the filtered receiver.
INTRODUCTIONIOur matched ultra-narrowband transceiver approach to optical CID uniquely features
atomic line filter (Faraday filter) technology; however, our overall approach to optical CIDis generic. Our overall approach consists of equipping friendly platforms with passive
responders which impress an identifying code on an interrogation beam originating from a
weapons platform. Here, the optical responders are retroreflectors with a liquid crystalmodulator. In general, the range required for a system must match that of the associated
weapon. Similarly, the interrogator pointing tolerance should be equal to or greater than
that of the weapon.
Additional design complexity is driven by other system and component requirements. The
system design must consider the need to conceal the responder from enemy sensors. Thecommon approach to concealing the responder is for its aperture to remain normally closed
until a "wake-up" signal is received, initiating a response. However, because of scarce
2847-R 53
resources, we limited our development to the interrogator, comprised of the laser and the
receiver, and the respondcý.
Our primary goal in the development of this hardware was to produce a CID demonstrator
ready for field demonstrations at a range of about 5 km. The system would be eyesafe,portable and easy to operate. We completed this program with mixed results. We did
demonstrate responder code interrogation using a Faraday filtered receiver at a range of
about 0.25 km, as described below. The demonstration utilized a frequency matched single
mode diode laser, a liquid crystal modulated responder operating in the field at 10 kHz and
i a Faraday filtered receiver. Because we did not yet possess a laser ready for out-of-doors
operation, we set the interrogator up inside our building, and linked with a responder at the
I longest possible distance outside. We observed the responder signal and signal power
measurements confirmed our link budget analysis. However, the test also revealed a
serious shortcoming in our custom integrated detector/high gain current preamplifier: the
dynamic range was not sufficient to accomodate the moderate amplitude fluctuations
present in the scintillated responder signal.
Solutions to these difficulties are now at hand. We have just completed a small production
I run of a locked diode laser, ruggedized for an aircraft application, which can be operated
out-of-doors. In addition, since the conclusion of the effort, we have obtained and tested
new, off-the-shelf detector/preamplifiers with the required gain, noise and dynamic range
characteristics. We describe the new diode laser and detector/preamplifier performance in
the field test equipment descriptions below.
SYSTEM DESCRIPTION
A block diagram of the system is shown in Fig. 1. The interrogator, on the left hand side
of the figure, consists of the optical head, driver electronics and signal processor. The
optical head consists of a locked laser transmitter, a filtered optical receiver and a sight.
The locked transmitter is a single mode diode laser at about 852 rin, precisely tuned to the
6 GHz passband of the Faraday filter passband in the receiver. The beam divergence of >1
mrad is wide enough to make illumination of the responder possible using the sight. The
2847-R 54
!I
beam is impressed with a 16 bit modulation (identification code) at 10 kHz and retro-
reflected by the responder. The receiver collects the signal, and passes it through the
Faraday filter to a combination avalanche photodiode and preamplifier. The signal isdigitized and processed to retrieve the identification code.
To avoid drop out in signal transmission by atmospheric scintillation, the modulation rate
of the system was chosen such that an identification code could be transmitted within the
scintillation period of about 1 ms. Thus, a modulation rate of >10 kHz is required for a 10
bit code. Fortunately, a modulation rate of about 10 kHz can be provided by a ferro-
electric liquid crystal, a potentially low cost device.
A link calculation of the total signal power incident on the photodetector as a function of
range shown in Fig. 2, was developed to assess the range capability of the system. The
calculation assumes that the interrogator transmits about 150 mW in a 1 mrad divergent
beam, a 25 mm responder aperture, a 45 mm receiver aperture and appropriate optical
attenuation coefficients. The calculation neglects atmospheric scintillation. The estimate
predicts a responder signal of about 100 pW at the 5 km range goal.
LASER TRANSMITTER
For the demonstration described below, the laser transmitter consisted of a 150 mW diode
laser tuned to the passband of the Faraday filter. We used a Spectra Diode Labs model
SDL-5420 with a room temperature wavelength of 852 nm, which could be
temperature/current tuned to the filter passband. The diode was mounted in a temperature
controlled mount, and driven using a precision low noise current supply. Because the
tuning of this laser was sensitive to ambient small temperature variations brought about by
exposure to drafts, it was necessary to operate this laser in the conditioned environment of
our building. In addition, this laser was susceptible to frequency drift with current drift and
destabilization by feedback typically originating from local beam steering optics.
ThermoTrex now produces a temperature and feedback resistant feedback locked diode
laser, shown in Fig. 3. This 150 mW laser features an external cavity which incorporates
2847-A 55
an atomic line filter, fixing the frequency of operation to the filter passband. Laboratory
tests have shown that this laser is immune to feedback, and remains frequency locked overlarge variations in drive current. The enclosure design features an insulating layer designed
to provide a stable temperature environment.
RESPONDER
The responder, a modulated retroreflector, is shown in Fig. 4. The retro-reflector is a gold
comer cube, with a total beam deviation of 2 arcseconds. Recessed into the retroreflector
enclosure is a 1 inch diameter ferro-electric liquid crystal modulator behind a polarcor
infrared polarizer. At 852 nm, the liquid crystal can be switched between a zero and
quarter waveplate state; in the quarter wave state, the double pass has the effect of rotating
the polarization by 90 degrees. The rotated light is then extinguished by the polarizer upon
exit.
The one inch responder aperture was the largest off-the-shelf ferro-electric liquid crystal
modulator size available. Larger custom made devices were available, but required an
unacceptably long lead time.
FARADAY FILTERED RECEIVER
The Faraday filtered receiver is shown in Fig. 5. The entire assembly is portable and
battery operated. Light enters the receiver through a bandpass filter and is collected by afast 2 inch diameter lens. The receiver field-of-view can be varied down to about 1 mrad
by a iris at the focal plane of the lens. The signal is then relayed to the 3 mm diameter
active area of the avalanche photodiode (APD) by a lens which is integrated into the
Faraday filter. The Faraday filter consists of an entrance polarizer followed by a cesiumvapor cell in a longitudinal magnetic field and an exit polaizer. The cell is enclosed by
windowed air spaces for insulation, the relay lens serving the additional purpose of entry
jacket window.
2847-R 56

The transmission spectrum of the Faraday filter along with that of a cesium absorption
reference cell is shown in Fig. 6. The beam from a frequency ramped diode laser was
ramped and passed through the reference cell and Faraday filter simultaneously. The
reference cell transmission shows the cesium 6 'S1/2-6 2p doublet with a spacing of 9.2
GHz. The Faraday filter transmission was designed to provide the relatively wide
passband filling the frequency interval between the lines to relax the laser tuning
requirements. In this configuration, the filter uses about 1 cm pathlength of vapor at about
100 C in a field of about 100 G. The interrogator emission frequency position is shown.
The APD/preamplifier consisted of a low noise transimpedance amplifier integrated with
Hamamatsu photodiode by Analog Modules, Inc. When operated at the recommended gain
of M = 60, this APD, model S2384, was characterized by an excess noise factor of 0.3 and
a dark noise of 1 nA. For a beam divergence of 5 mrad, the signal light at about 100 pW
was expected to dominate the background light. Then, noise equivalent power including
the shot noise and the excess noise (but ignoring the preamplifier noise) was estimated to
be about 1 pW, giving a signal to noise ratio of 100. However, at these levels, the
preamplifier would be the dominant noise source. To minimize the noise, amplifier gain
bandwidth was set to about 25 kHz. Furthermore, by setting the amplifier cut-on to about
I kHz, we attempted remove the l/f noise at low frequencies and to block low frequency
atmospheric scintillation noise. Analog Modules delivered an integrated APD/preamplifierwith a transimpedance gain of 10 MQ and a noise density of 550 fAb/i-z, corresponding to
a contribution of about 2 pW. However, as we learned durnig our tests, the small dynamic
range of the APD/preamplifier limited its application to short ranges. In the lab we tested
the receiver response against the amplitude of an optical square wave input. We found that
the receiver exhibited a threshold and a saturation level that was only 3 times threshold!
We have since received an off-the-shelf APD/preamplifier, the Advanced Photonics APM-
22, that should enable 3 km interrogations. This unit features a 5 mm active area, gain
from DC to 35 kHz and a transimpedance gain of 1 MO. In laboratory evaluations, we
measured the noise density of the ADP/preamplifier at M=50 under 100 pW illumination at
633 nm to be about I pW/rt Hz. Thus, at the receiver bandwidth of 20 kHz, we expect an
2847-R 57
NEP of about 150 pW, giving a signal to noise ratio of about 10 at a range of 3 km. In
addition, we have observed linear response of photoreceiver from 1 pW to >1 p.W.
DEMONSTRATION EXPERIMENT
We performed field test to demonstrating responder interrogation at a range of 0.25 km.
This demonstration included the laser transmitter, responder and receiver described in the
paragraphs above. Fig. 7 shows the interrogator and the responder during the test.
Because the frequency locked laser was not yet operable out-of-doors, we used a diode
laser in a standard mount, tuned to the Faraday filter passband. The photograph of the
interrogator shows a short optical rail, mounted on a tripod, supporting the laser on the
right and the receiver on the left. A sighting scope is built into the center of the rail.
Because the retroreflected beam was only inches in extent, it was necessary to launch the
interrogator beam from a position in front of the receiver. In addition, rapid alignment was
facilitated using a camera to observe the beam striking on the target.
The laser transmitter beam was about 125 mW, with a divergence of about 1 mrad. Once
the sighting scope was co-aligned, it could be used !o illuminate the responder. The
responder was positioned at range and set up to provide a repetitve 16 bit sequence at about
10 kHz. The sequence consisted of a "start character" consisting of 4 off bits, several
ii alternating bits and a "stop character" consisting of 2 on bits. The return beam was
received and captured using a digital oscilloscope. Fig. 8 shows responder signals at 30
and 260 m range. The signal at close range shows a cleanly received signal. An extended
measurement of the long range signal (Fig. 7b) over 100 ms shows how atmospheric
scintillation corrupted the signal detected by our dynamic range limited receiver. The figure
detail of the long range signal (Fig. 7c) shows how the receiver threshold and saturation
behavior limnis receiver response to a narrow range of signal amplitudes.
RECOMMENDATIONS FOR FURTHER DEVELOPMENT
The results of this program indicate that this combat identification scheme could
demonstrate responder interrogation in the field with augmentation. We can now provide a
2847-R 58
new, ruggedized frequency locked diode laser suitable for field operation. In recent
months, new off the shelf photo-receivers have become available with the required
performance. These enhancements should provide responder interrogation at a range of 3
km. Additional range can be obtained by increasing the area of the responder. If the return
beam spot size is proportional to the diffraction limit, then the signal received is
proportional to the respnder diameter D4, and inversely proportional to the range R'. Thus,
the two inch diameter responder, obtainable as a custom product, could extend the range to
6 km.
2847-R 59

INTERROGATOR RESPONDER
MODULATED RETRO
S LOCKED,.
G SIGHT ANDA
FILTERED "
RECEIVER MODULATOR•i• DRIVER
INTERROGATORELECTRONICS
PC-BASEDSIGNAL A/D,DECODING
94-17818
Figure 1. Combat ID system block diagram.
6o
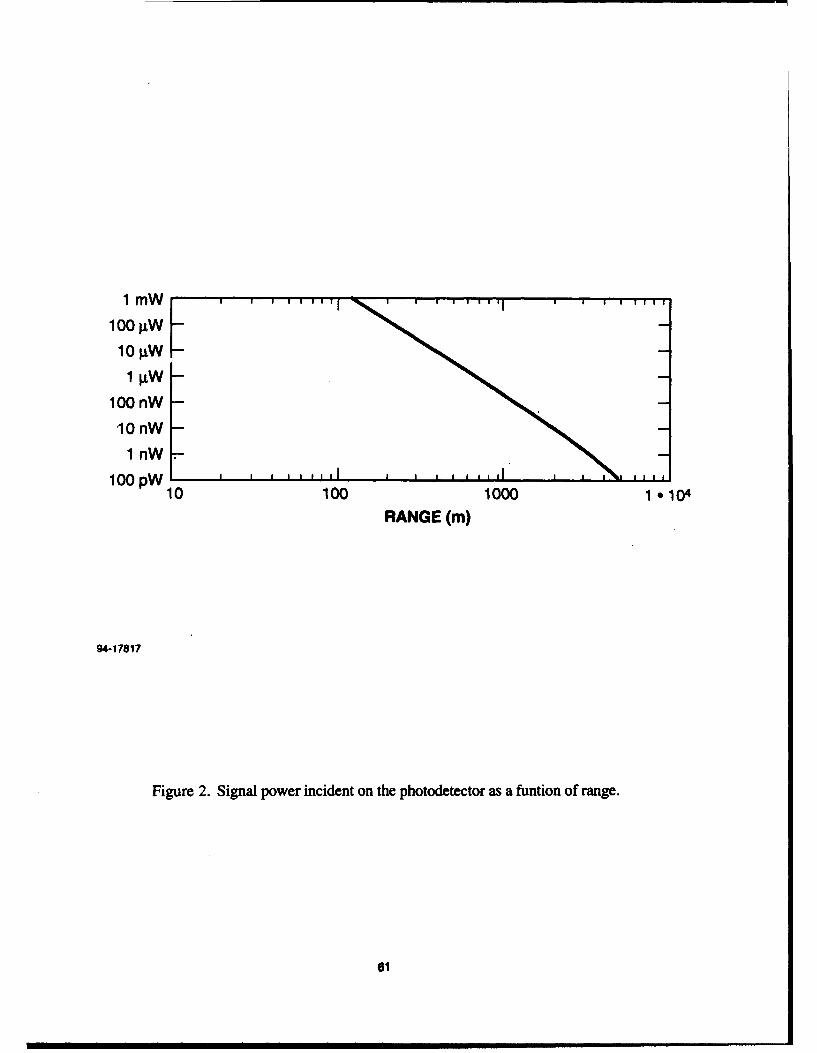
1l m W / ' ' ' t i l l ' '
100AW
1 IPW
100 nW
10 nW
1 nW -100 pW, , ,,, ,, , , , ,,, I , I , l
10 100 1000 1 * 104
RANGE (m)
94-17817
Figure 2. Signal power incident on the photodetector as a funtion of range.
61

93-165194
Figure 3. TTC frequency locked diode laser.
i ii i ii " m m m m ,.,,i,.i.,,... • • - . . . . .
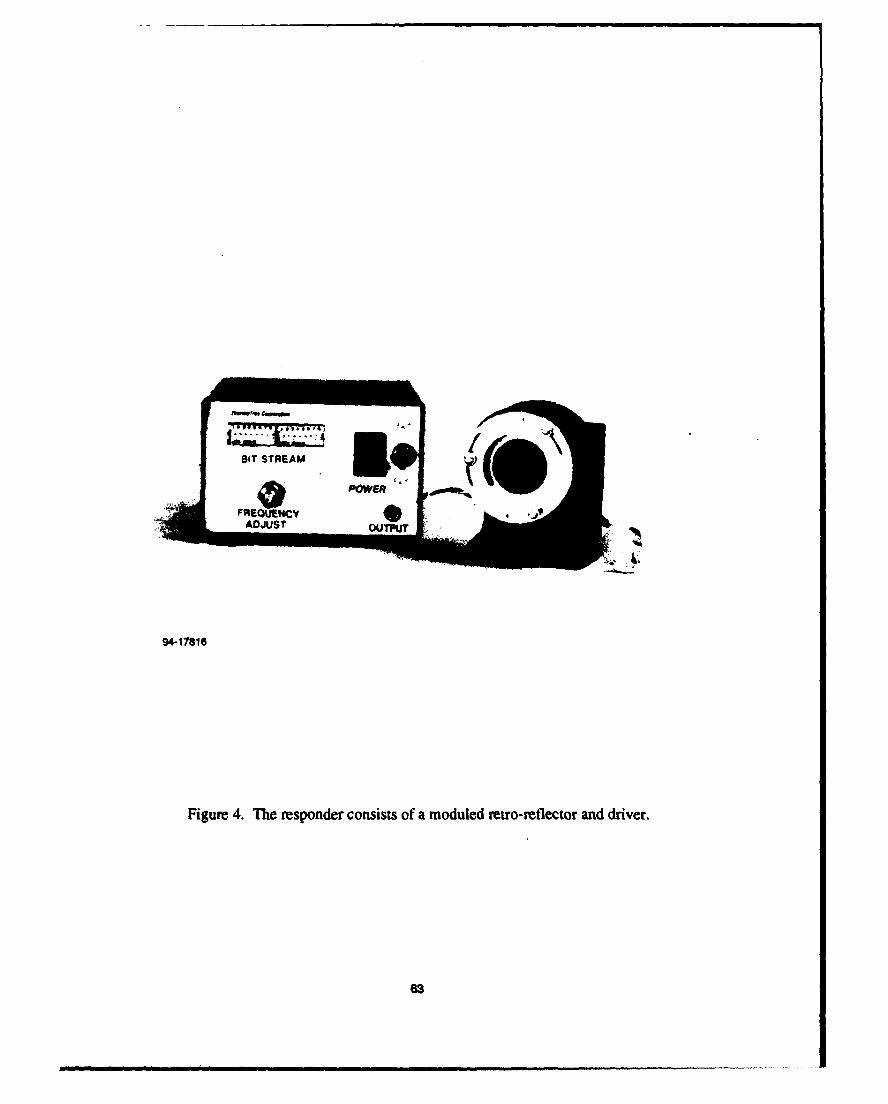
BIT STREAM . •)
ADJUST OUTPUT
94-17816
Figure 4. The responder consists of a moduled retro-reflector and driver.
S-- I I I II III I II I I I IIII J ill I I I II I • III I
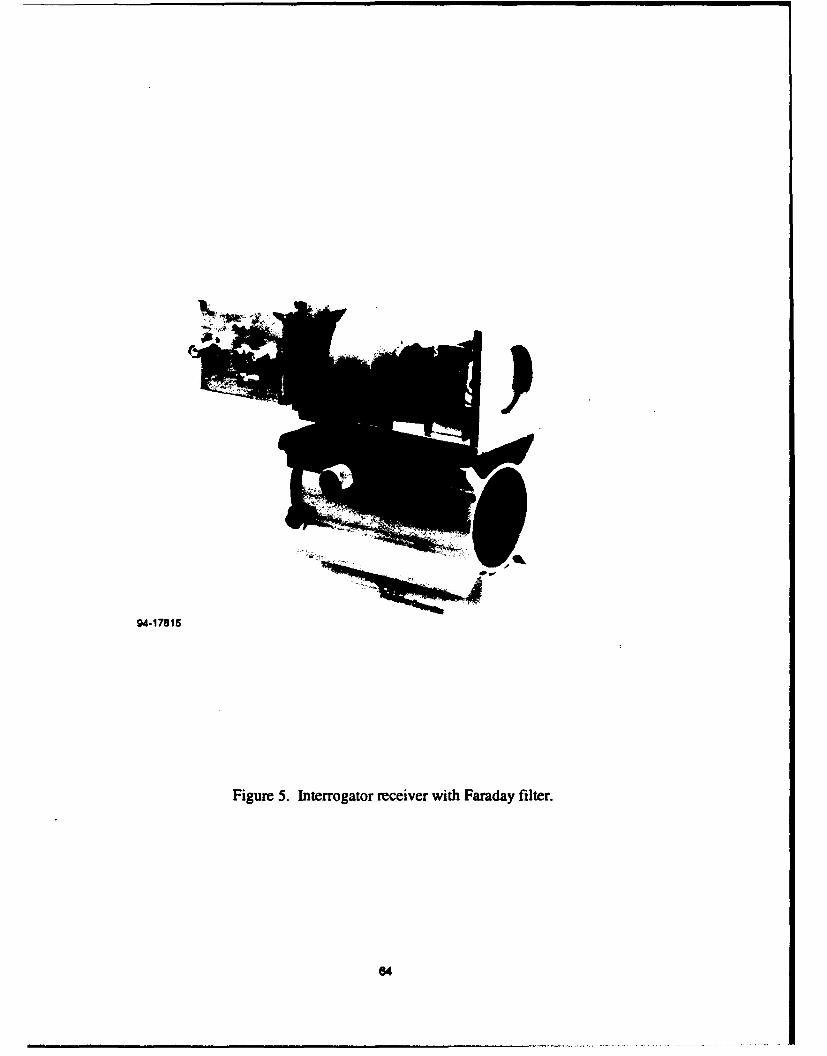
94-17815
Figure 5. Interrogator receiver with Faraday filter.
84
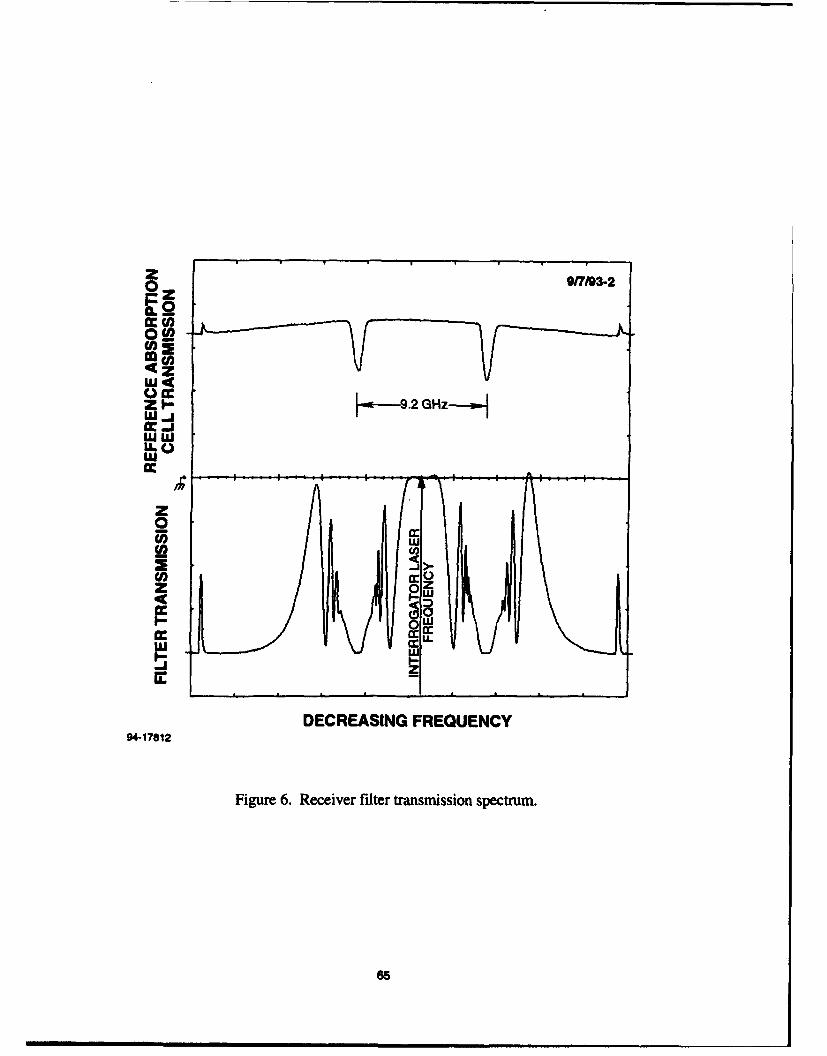
z 917193-2
00
0 cc
z ý-H .2 GHz-H--wi
LL
I;
z0
FA- w
z0O-
DECREASING FREQUENCY94-17812
Figure 6. Receiver filter transmission spectrum.
66
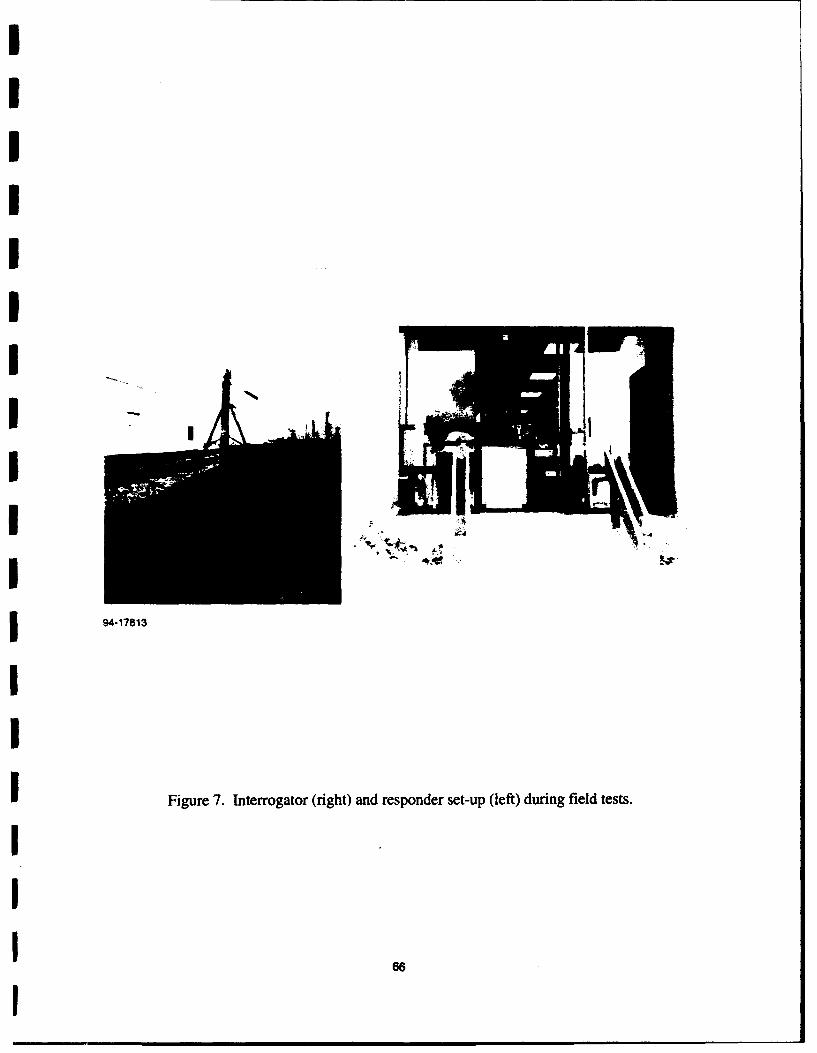
iIIiI
II I
I
I 94-17813
I Figure 7. Interrogator (right) and responder set-up (left) during field tests.
I 66
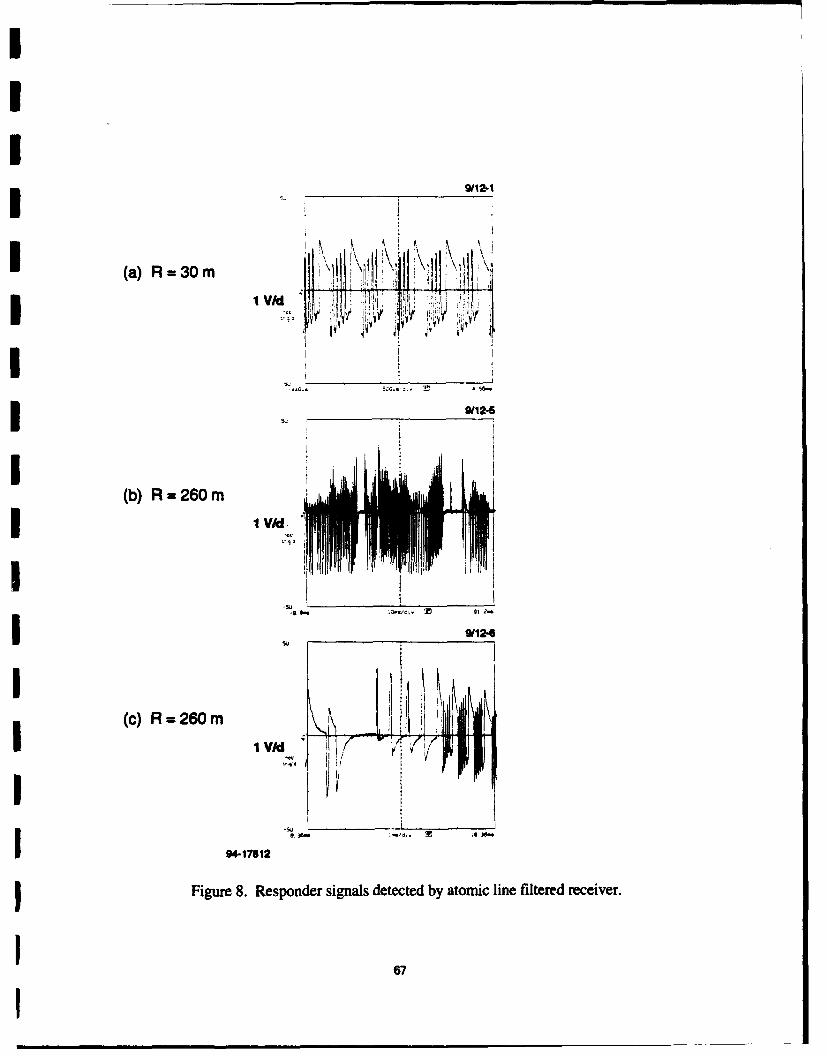
9I12-1
(a) R=30m m
1
I 5g.
9112-5
(b) R =260 m
I (C)
(c) R :260 m 1
I lVw *lr •
I *1i-s itM
94-17812
Figure 8. Responder signals detected by atomic line filtered receiver.
67
I