atomic structure of myoglobin (mb) ligand diffusion...
TRANSCRIPT

Atomic structure of Myoglobin (Mb)
Myoglobin is a small, monomeric protein which serves as oxygen storage in the muscles
of mammals. It has an all helical structure, 153 amino acids, about 2600 atoms, about
3 nm of diameter. It binds reversibly O2 at the active site, called the heme, with a
bond to an Iron atom.
Myoglobin is a small, monomeric protein which serves as oxygen storage and transport in mammals. It binds O2 and oxygen compounds (CO, NO) at the active site, the heme, with a bond to an Iron atom
L. M., G. Cottone, G. Ciccotti and E. Vanden-Eijnden J. Am. Chem. Soc., 132, 1010 (2010)
Ligand diffusion in myoglobin

Ligand diffusion in myoglobin
Quest for the complete network of possible paths for the ligand to reach (escape) the binding site.
Historically, the first guess was for a direct path from the Distal Pocket, DP (above the binding site) to the surface, passing close to a histidine side-chain (His gate).
Role of internal (Xenon) cavities emerged over the years.
Time-scale: >1000 ns
Xe1
Xe2
Xe3
Xe4
Friday, October 30, 2009
The heme is buried inside the molecule, and it has been proved that exposed hemes
do not bind O2 anymore. So, how does oxygen reach the heme?
No clear path to the binding site from observation of the atomic structure.
Cavities (packing defects) inside Mb found with Xenon gas pressure.
DP

Mb structure before and after dissociation
Cyan: MbCO, Orange: Mb. No large scale conformational change in the protein after
dissociation. Only localized change in Iron coordination and structure of the heme
(time-scale < 500fs) represented by changing the parameters in the force field.
Cyan: MbCO, Orange: photolyzed Mb. Only localized change in Iron coordination and structure of the heme (time-scale < 500fs) represented by changing the parameters in the force field
Assumption: no large scale conformational changes of the protein.
Ligand diffusion in myoglobin
Collective variables: cartesian coordinates of CO center of mass (constrained rotations and translations of the protein)
Task: Compute the PMF landscape of CO location inside Mb

TAMD simulations
Collective variables: center of mass coordinates of CO. Constrained rotations and
translations of the protein. 11 independent TAMD trajectories, each less than 100ps
long.
Mean forces collected in 239 centers over 500ps long trajectories.
TAMD simulations
11 independent TAMD trajectories of the order of 100ps. Effective thermal energy 10 kcal/mol.TAMD simulations
Collective variables: center of mass coordinates of CO. Constrained rotations and
translations of the protein. 11 independent TAMD trajectories, each less than 100ps
long.
Mean forces collected in 239 centers over 500ps long trajectories.
A collection of CO positions extracted from all TAMD trajectories:
PMF map reconstruction
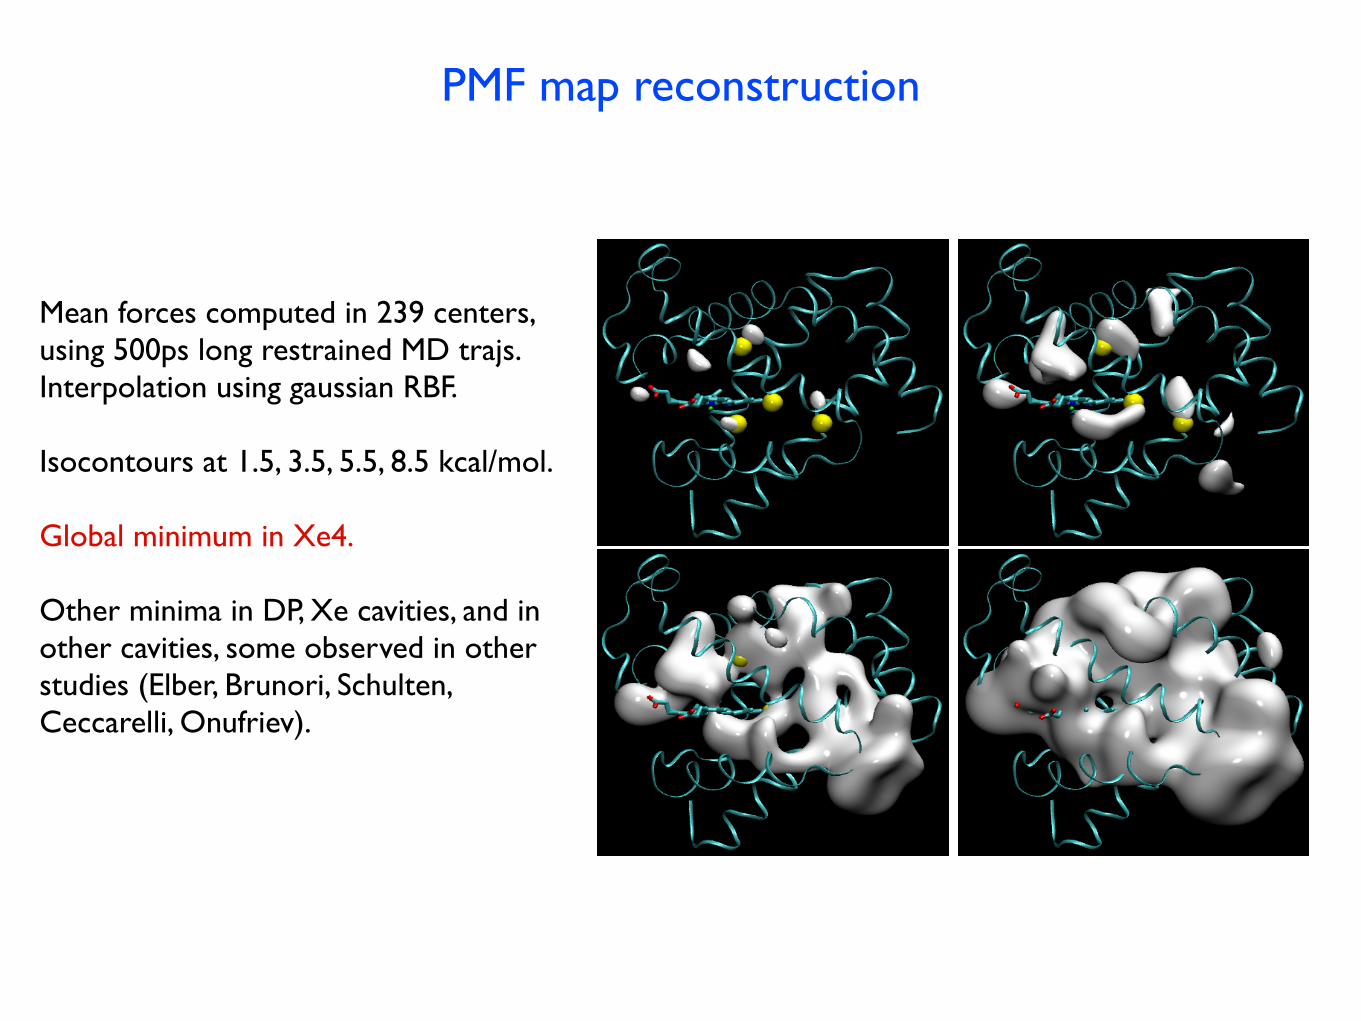
Mean forces computed in 239 centers,using 500ps long restrained MD trajs.Interpolation using gaussian RBF.
Isocontours at 1.5, 3.5, 5.5, 8.5 kcal/mol.
Global minimum in Xe4.
Other minima in DP, Xe cavities, and inother cavities, some observed in other studies (Elber, Brunori, Schulten, Ceccarelli, Onufriev).
Free energy reconstruction
6
FIG. 2: Four isosurfaces of the three dimensional PMF map
of CO center of mass inside Mb, superposed on the protein
structure. Energy levels are from left to right and top to
bottom, 1.5, 3.5, 5.5 and 8.5 kcal/mol, with respect to the
global minimum in the Xe4 cavity. The protein’s backbone
is represented as ribbons, the heme residue as sticks, and the
locations of the xenon binding cavities as yellow spheres.
In addition to the xenon binding sites and DP, our mapshows other features that are similar to those obtainedin other computational studies12,13,27. In particular, weobserve two local minima above Xe3 that are located incorrespondence to cavities visited by the dissociated COtrajectory in Refs. 13 and 12 (they were called Ph1 andPh2 in Ref. 13), and were also present in the map ofRef. 27. The ring-shaped structure above Xe3 is verysimilar to that obtained in Ref. 27. The shape of theisosurfaces in the DP region matches the plot of the po-sitions occupied by dissociated CO in the extensive simu-lations of Ref. 12, where the ligand also visited the largestof the two minima we find in the proximity of the heme,close to the protein surface. Finally, the region aboveXe4 towards the solvent was visited by the dissociatedtrajectories in Refs. 11–13.
B. Pathways of CO migration inside Mb
In order to accurately locate pathways and computeenergy barriers for CO migration inside Mb, we use thestring method to calculate MFEPs (i.e. the curves whosetangent is always parallel to∇A(z), see Sec. IIID) on thereconstructed PMF surface. These MFEPs are identifiedas migration pathways for CO inside Mb. Fig. 3 showsour results. MFEPs are shown a yellow curves. Two iso-surfaces of the PMF map are represented (red 2, blue 5kcal/mol, with respect to Xe4). White spheres representlocations of energy barriers along the pathways. Starting
FIG. 3: CO migration pathways inside Mb. Yellow curves are
MFEPs on the CO PMF map, which identifies possible CO
routes. Two isosurfaces of the PMF map are shown (red 2.0,
blue 5.0 kcal/mol, with respect to Xe4). White spheres rep-
resent locations of energy barriers along the pathways. The
protein’s backbone is represented as ribbons and the heme as
sticks.
from the DP, a network of possible pathways is accessi-ble to the dissociated CO molecule. The locations of thepathways we found is in excellent agreement with pre-vious studies. In the massive simulations of dissociatedCO in Ref. 12, nine different gates were identified for theligand to exit/enter Mb. Each one of these gates is con-nected with one of our pathways. Moreover, most of thetrajectories followed by the CO molecules in Ref. 12 arealong some of our pathways.
On the experimental side, many of the residues thatwere found by random mutagenesis54 to affect ligandbinding kinetics lie along our paths. In particular, all ofthe energy barriers we find are close to at least one of theresidues identified in Ref. 54. This result, as already ob-served in Refs. 27 and 12, is an important step towards amore atomistically based interpretation of the mutagene-sis results. The largest cluster of such residues is aroundthe DP, where indeed we observe three different possibleescape routes towards the solvent, all of them in prox-imity of at least one of the kinetically relevant residues.Among these paths, is the so called histidine gate, whichfor many years has been considered the only possible forCO to entry/exit Mb55. From our results, this is theshortest path connecting DP and the solvent. It is alsothe only direct one, i.e. without intermediate minimaalong it. This might reflect the importance of this pathin the escape process. Fig. 4 shows a detailed view ofthe histidine gate path from our calculations. The yel-low curve is the MFEP. In orange, we show the positionof H64 sidechain in the crystal of Mb with CO bound,while in blue we show its position as we find it in the
Gaussian RBFs. Isocontours of 1.5, 3.5, 5.5 and 8.5 kcal/mol wrt global minimum(Xe4).
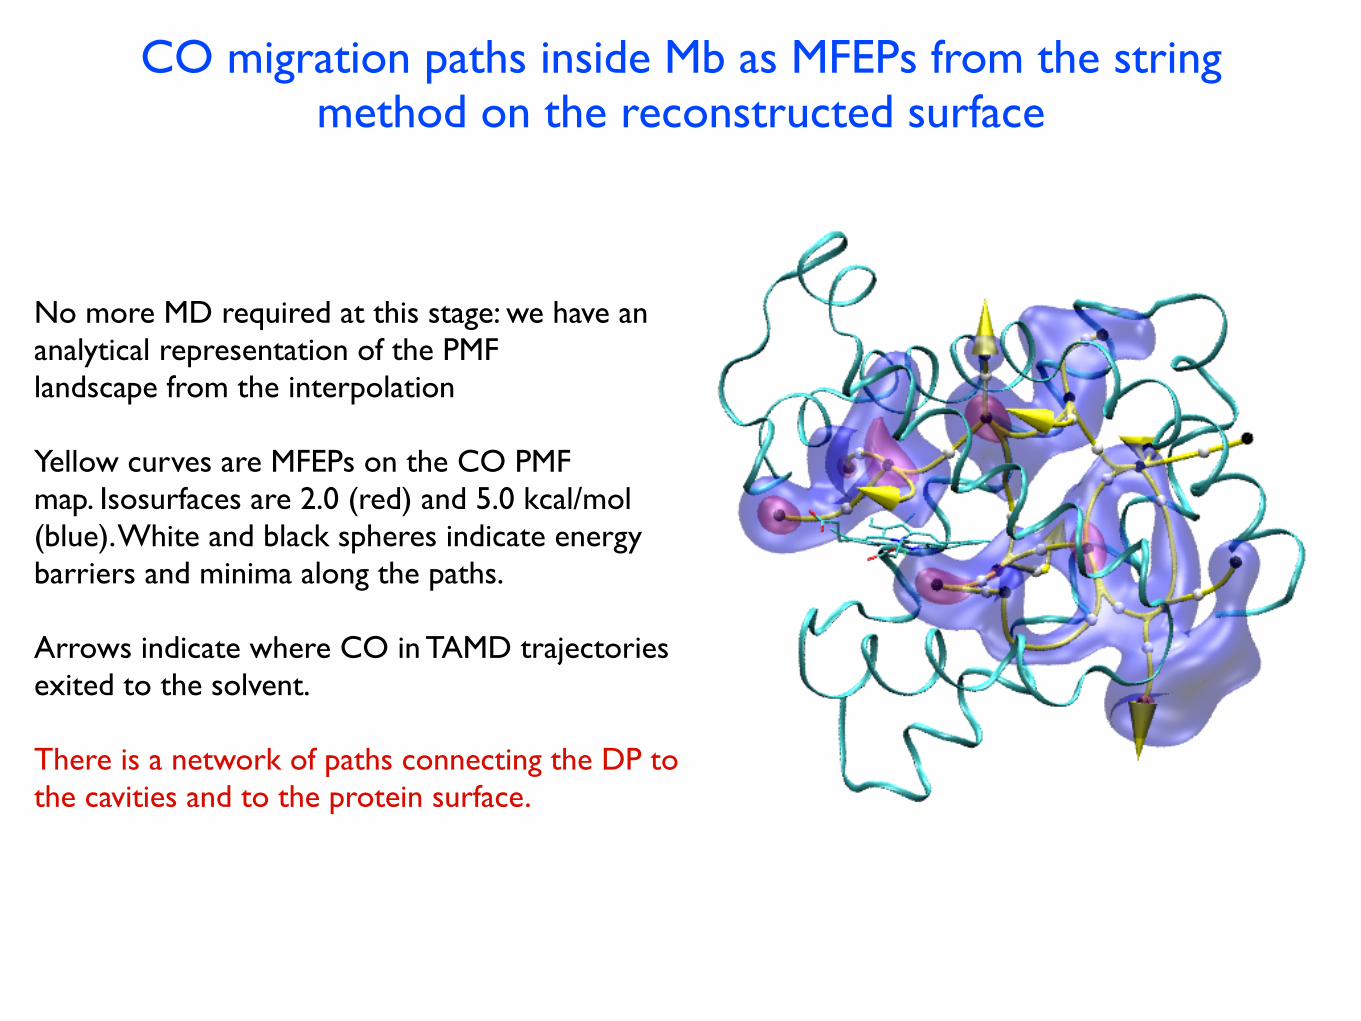
CO migration paths inside Mb as MFEPs from the string method on the reconstructed surface
No more MD required at this stage: we have an analytical representation of the PMF landscape from the interpolation
Yellow curves are MFEPs on the CO PMF map. Isosurfaces are 2.0 (red) and 5.0 kcal/mol (blue). White and black spheres indicate energy barriers and minima along the paths.
Arrows indicate where CO in TAMD trajectories exited to the solvent.
There is a network of paths connecting the DP to the cavities and to the protein surface.
CO migration pathways inside Mb as MFEPs from the string method
on the reconstructed surface
Yellow curves are MFEPs on the CO free energy map. Isosurfaces are 2.0 (red) and 5.0
kcal/mol (blue) White and black spheres represent, respectively, locations of energy
barriers and minima along the paths.

Histidine gate pathHistidine gate
The yellow curve is the MFEP. Orange and blue sticks represent the sidechain of theproximal Histidine in the crystal of Mb with CO bound and in a deoxy Mb configurationfrom our simulations.
The yellow curve is the MFEP.
Orange sticks: proximal Histidine as in the crystal of Mb with CO bound.
Blue sticks: deoxy Mb conformation from our simulations.

PMF barriers along the paths
CO migration pathways inside Mb as MFEPs from the string method
on the reconstructed surface
Free energy barriers (kcal/mol) in very good agreement with previous results, whereavailable (different methods, different force-fields).
also colored according to their value. A movie with a 360° viewof Figure 5 is available online as a Web-enhanced object. Thevalues of some of the barriers are also reported in Table 1. Afull list of energy values for barriers and minima is reported inthe Supporting Information.
It can be seen that, starting from the DP, the CO has severalpossible routes. The path to the histidine gate involves a barrierof 6.7 kcal/mol. The energy barrier along the path connectingthe DP to Xe4 is 4.5 and 5.1 kcal/mol, starting from DP andXe4, respectively, close to what was found by Cohen et al.,37
who measured for the same barriers 3.5 and 4.5 kcal/mol,respectively. From our results, once the ligand migrates fromthe DP to Xe4, it can take several possible paths. One of thesebrings it to Xe1, where fewer paths are available and the ligandshould reside for longer times. This is in qualitative agreementwith experimental results where the lifetime of the signalassociated with the ligand in Xe1 is found to be longer thanthat in Xe4.9,63
By looking at the full network of paths, barriers, and minimain Figure 5, we can speculate not only on the mechanism ofCO migration inside Mb, but also on the possible gates towardthe solvent. Indeed, there is still debate on whether in physi-ological conditions the ligand exits to the solvent from the DPonly, or also from sites far from the heme. Kinetic models usedto interpret experimental data are based on the definition ofdifferent “states” according to whether the ligand is in thesolvent, in the DP, or inside one of the cavities.63 Although the
presence of hydrophobic cavities inside Mb has been knownfor a long time,7 only recently experimental evidence wascollected for exit pathways involving them.17,63 Such possibleroutes were suggested already in the pioneering simulations ofElber and Karplus6 and confirmed in more recent detailedsimulation studies.20,37 Our results also support this view.Indeed, we find that from each xenon cavity there is a possibleroute toward the solvent. To reach the farthest cavities fromthe DP, the ligand has to find a way through the network ofpaths, crossing multiple barriers. This will slow the diffusionprocess and can possibly explain the diffuse ligand density thatmakes it difficult to identify the CO in cavities far from the DPin photolysis experiments at room temperature.
A few of the centers used in the region of the histidine gatewere obtained from the TAMD trajectory after it exits the Mbprotein. As a result we can infer the free energy of CO in thesolvent from the value of the free energy at these points. Thisfree energy is about 9 kcal/mol, i.e., almost 8.5 above the valueof the energy in the DP, which is not unreasonable. In particular,it is very close to the barrier from the DP to the solvent via thehistidine gate found by Cohen et al.37 (7.5 kcal/mol). Interest-ingly, from our results the free energy barrier from the DPtoward Xe4 is lower than the one toward the solvent, also inagreement with ref 37. This implies that, starting from the DP,the diffusion of CO toward the interior of the protein is morelikely than its direct exit to the solvent from the histidine gate.This finding confirms the importance of the cavities in theprocess of CO release and binding by Mb. A precise quantifica-tion of the rate of exit from Mb to the solvent along the networkof pathways found here will be the subject of future work, usingmethods developed by some of us.64,65
Concluding Remarks
The process of CO diffusion in myoglobin at room temper-ature was investigated by reconstructing, via the single-sweepmethod and fully atomistic MD simulations, a three-dimensionalPMF landscape for the ligand position inside the molecule. Thislandscape shows minima in correspondence with the DP andxenon cavities and in other pockets more recently observed inother studies.15,37 We have also computed the MFEPs on thislandscape, which give the possible migration paths of CO insidethe protein and toward the solvent and permit estimation of theenergy barriers involved in this diffusion process. Our results,in line with previous experimental and theoretical findings, showthat a network of possible pathways is accessible to thedissociated ligand in the protein interior. Furthermore, we findthat from each internal cavity there is a possible gate towardthe solvent. Among the paths connecting the DP and the solvent,the one going through the histidine gate is the shortest and theonly direct one, i.e., without intermediate minima along it. Thismight reflect its importance in the ligand escape/enteringprocess.
The basic assumption of our work is that the CO diffusionprocess inside myoglobin can be described as the navigation ofthe ligand molecule over its free energy landscape, whichaccounts via thermal averages for the influence of the proteinmolecules as well as the solvent. In this picture, we rely on thecalculation of a few statistical quantities needed to explain themechanism of CO diffusion, rather than simple observation of
(63) Nishihara, Y.; Sakakura, M.; Kimura, Y.; Terazima, M. J. Am. Chem.Soc. 2004, 126, 11877–11888.
(64) Vanden-Eijnden, E.; Venturoli, M.; Ciccotti, G.; Elber, R. J. Chem.Phys. 2008, 129, 174102.
(65) Vanden-Eijnden, E.; Venturoli, M. J. Chem. Phys. 2009, 19, 194101.
Figure 5. CO migration pathways inside Mb, colored according to thevalue of the PMF along them (kcal/mol). The Xe4 minimum is taken asthe zero of the energy. Local minima and energy barriers along the pathsare represented as spheres. Yellow arrows represent the locations of COexits to the solvent as observed in the TAMD simulations. The protein’sbackbone is represented as ribbons and the heme as sticks. The isosurfaceat 2 kcal/mol is also shown in arbitrary color.
Table 1. Free Energy Barriers (kcal/mol) between Pairs of Minima
(DP, HG)a (DP, Xe4) (Xe4, Xe2) (Xe2, Xe1) (Xe2, Xe3)
!A1b 6.7 4.5 5.3 0.2 2.7
!A2 0.1 5.1 3.5 1.3 3.9
a Histidine gate (HG) path. DP stands for distal pocket. b !A1,2 arevalues measured from the first and second minima of each pair,respectively.
1016 J. AM. CHEM. SOC. 9 VOL. 132, NO. 3, 2010
A R T I C L E S Maragliano et al.
Location of barriers correlates with randommutagenesis work of Huang & Boxer.
Values agree with literature where available(Schulten, Ceccarelli, Meuwly).
(X,Y)
X to YY to X

Conclusions on Mb
CO can diffuse inside Mb across a network of paths passing through the Xenon cavities and several others not found by Xenon experiments.
The His gate is not the only possible path from the binding site to the protein surface. It ishowever the shortest from DP, and the only one without intermediate minima.
The energy barrier for the CO from DP to Xe4 (i.e. towards the interior of the protein) is smaller than the PMF barrier towards the His gate, which reveals the importance of internal paths.

Reconstruction of PMF surfaces and reaction pathways
Combine TAMD with other methods
Single Sweep for PMF surface reconstruction
String method for finding reaction pathways

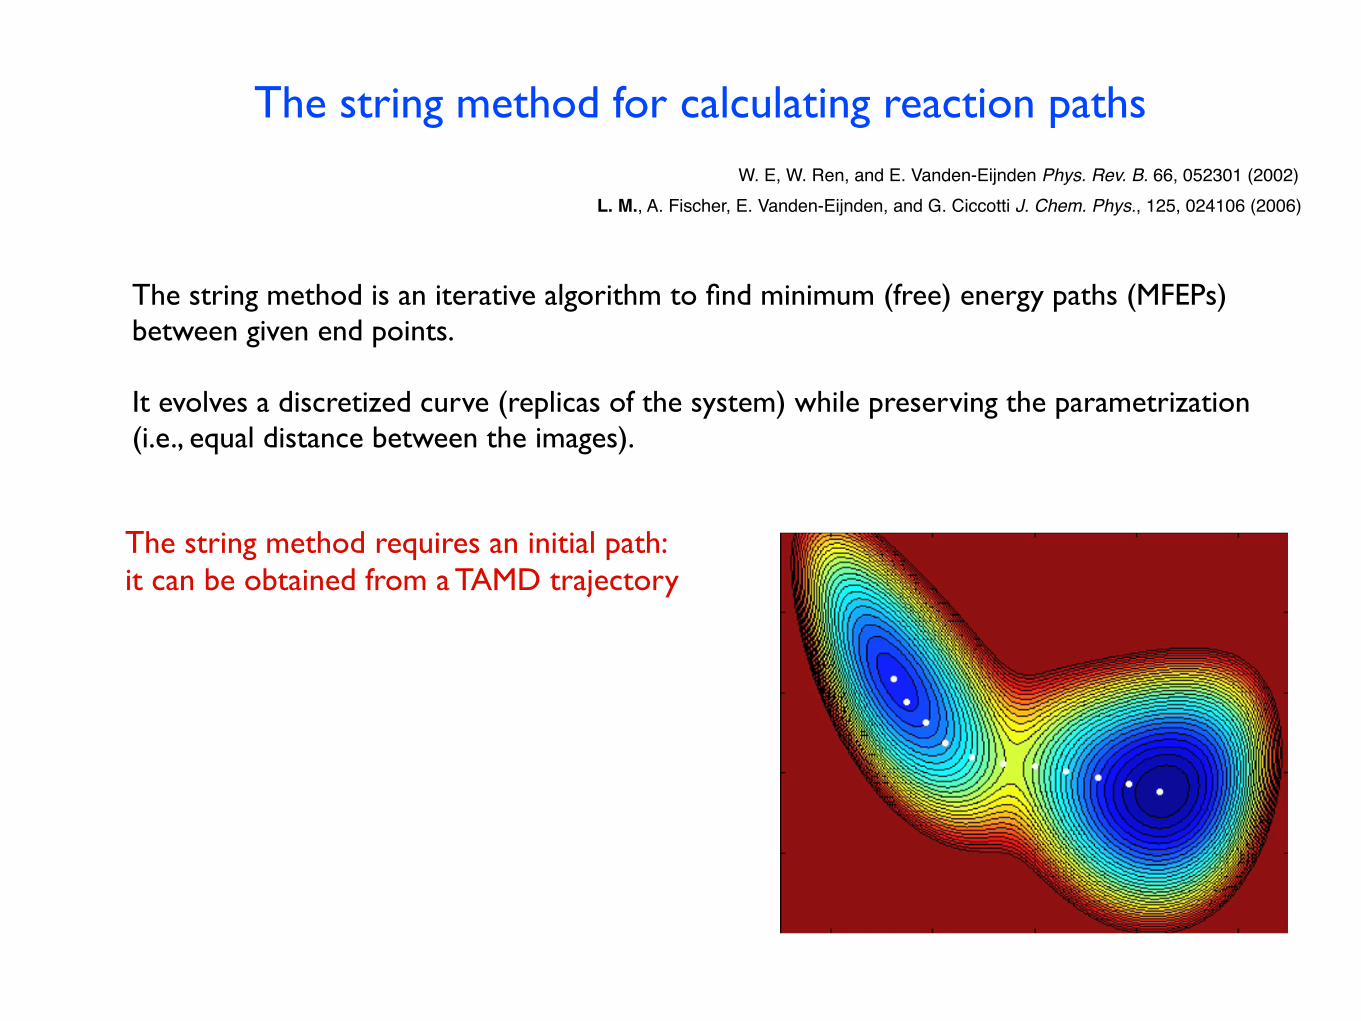
The string method for calculating reaction paths
The string method is an iterative algorithm to find minimum (free) energy paths (MFEPs) between given end points.
It evolves a discretized curve (replicas of the system) while preserving the parametrization (i.e., equal distance between the images).
z(t + h) = z(t) + h M(z(t))F(z(t))
Mij(z) =
�N�
k
1mk
∂θi
∂xk
∂θj
∂xk
�
θ(x)=z
with
In collective variables space, mean-force based evolution of images:
Fi = −∂A
∂zi
L. M., A. Fischer, E. Vanden-Eijnden, and G. Ciccotti J. Chem. Phys., 125, 024106 (2006)
W. E, W. Ren, and E. Vanden-Eijnden Phys. Rev. B. 66, 052301 (2002)
To use a larger number of collective variables, focus on local search for transition paths.
The string method for calculating reaction paths
The string method is an iterative algorithm to find minimum (free) energy paths (MFEPs) between given end points.
It evolves a discretized curve (replicas of the system) while preserving the parametrization (i.e., equal distance between the images).
z(t + h) = z(t) + h M(z(t))F(z(t))
Mij(z) =
�N�
k
1mk
∂θi
∂xk
∂θj
∂xk
�
θ(x)=z
with
In collective variables space, mean-force based evolution of images:
Fi = −∂A
∂zi
L. M., A. Fischer, E. Vanden-Eijnden, and G. Ciccotti J. Chem. Phys., 125, 024106 (2006)
W. E, W. Ren, and E. Vanden-Eijnden Phys. Rev. B. 66, 052301 (2002)
To use a larger number of collective variables, focus on local search for transition paths.
The string method requires an initial path:it can be obtained from a TAMD trajectory
The string method for calculating reaction paths
The string method is an iterative algorithm to find minimum (free) energy paths (MFEPs) between given end points.
It evolves a discretized curve (replicas of the system) while preserving the parametrization (i.e., equal distance between the images).
z(t + h) = z(t) + h M(z(t))F(z(t))
Mij(z) =
�N�
k
1mk
∂θi
∂xk
∂θj
∂xk
�
θ(x)=z
with
In collective variables space, mean-force based evolution of images:
Fi = −∂A
∂zi
L. M., A. Fischer, E. Vanden-Eijnden, and G. Ciccotti J. Chem. Phys., 125, 024106 (2006)
W. E, W. Ren, and E. Vanden-Eijnden Phys. Rev. B. 66, 052301 (2002)
To use a larger number of collective variables, focus on local search for transition paths.
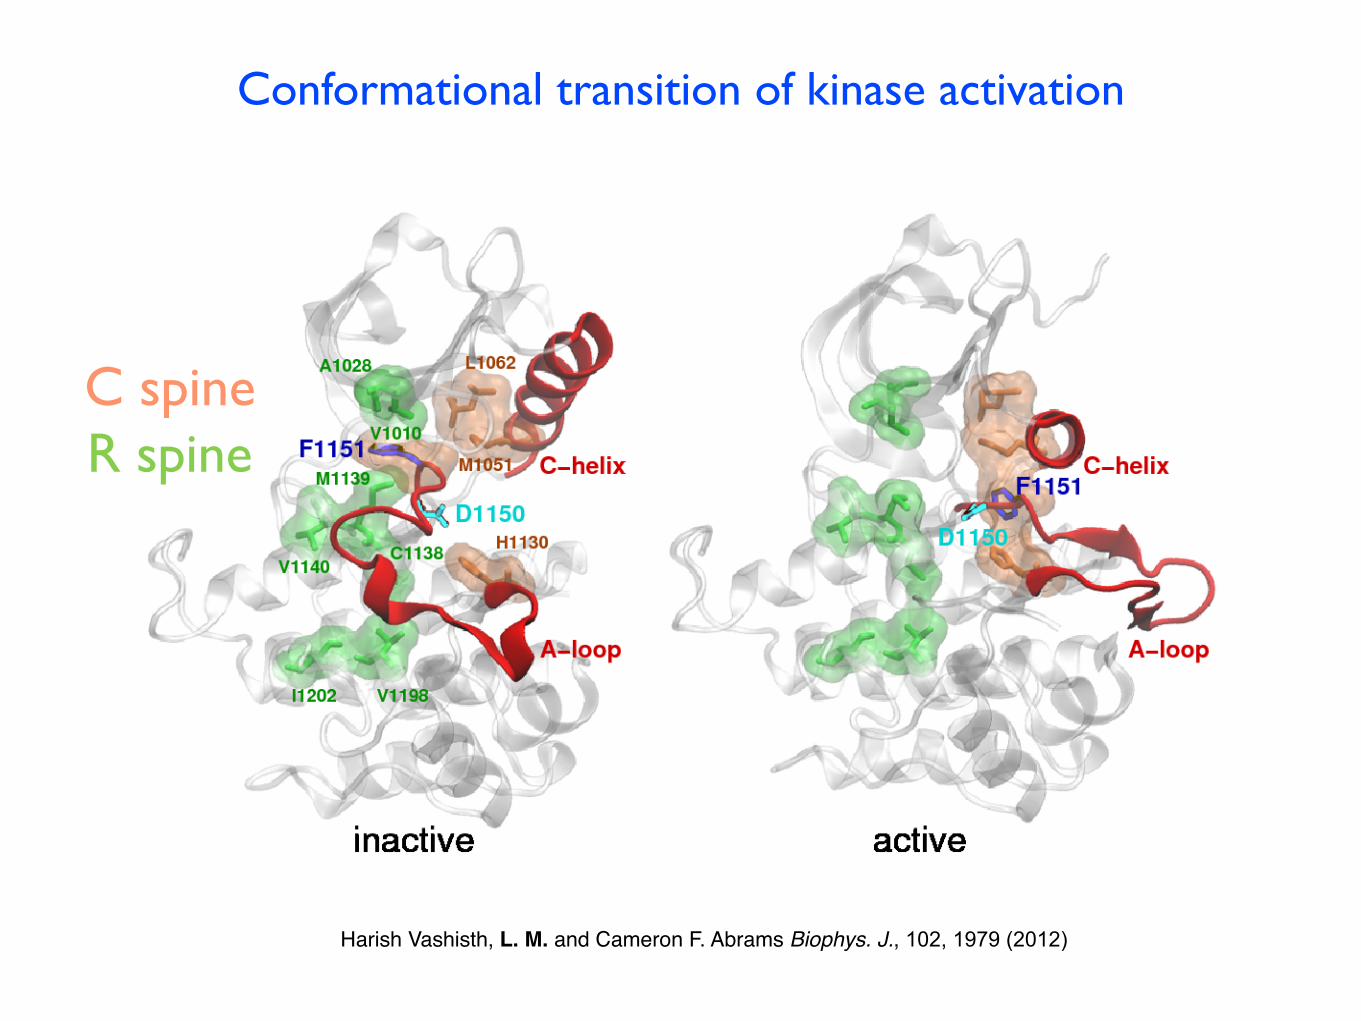
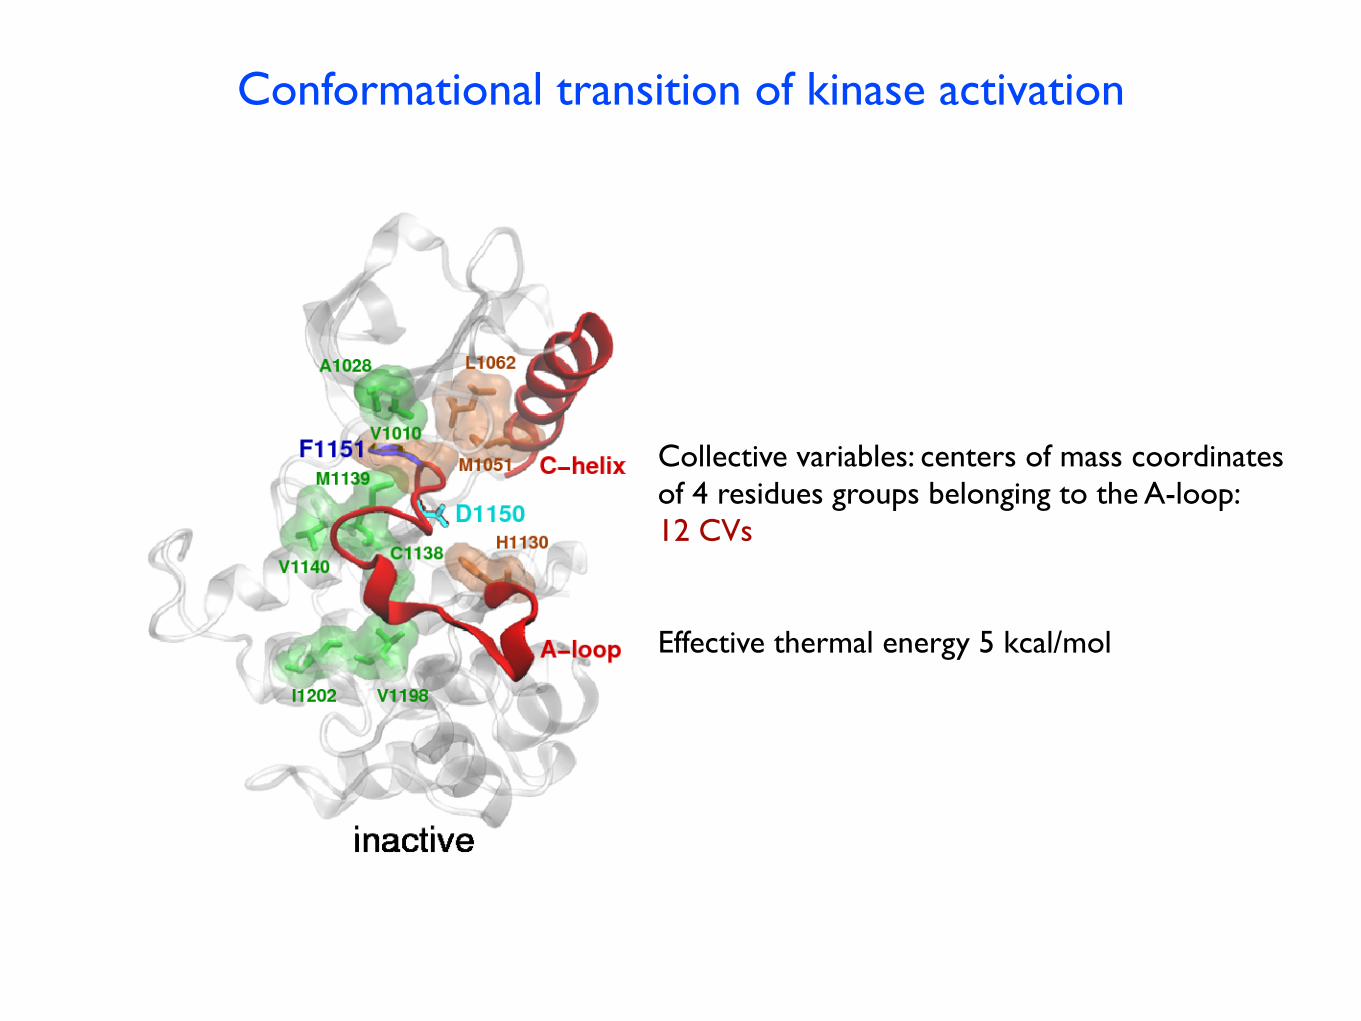
Conformational transition of kinase activation
Harish Vashisth, L. M. and Cameron F. Abrams Biophys. J., 102, 1979 (2012)
R spineC spine
Conformational transition of kinase activation
Collective variables: centers of mass coordinatesof 4 residues groups belonging to the A-loop:12 CVs
Effective thermal energy 5 kcal/mol

Conformational transition of kinase activation
Presence of a helical conformation for the A-loop along the TAMD

Conformational transition of kinase activationMFEP from the string method
0 5 10 15 20 25images
0
5
10
15
20
25
30
PMF
(kca
l/mol
)
salt bridge by pulling E1047 (and in turn the aC-helix)toward K1030 (snapshot at 40.97 and 45.60 ns in Fig. 3 b).R1155 also intermittently interacts with D1150 (snapshot at19.83 ns in Fig. 3 b). We do not observe a R1155-Y1163 saltbridge except a transient proximity of both residues (snap-shot at 20.95 ns in Fig. 3 b) because this interaction requiresphosphorylated Y1163, which is not the case in our simula-tions. We also observe that K1030 can engage both E1047
and D1150 (after DFG-flip) simultaneously in salt-bridginginteractions (snapshot at 40.97 ns in Fig. 3 b). But in thefinal state, we only observe a stable K1030-E1047 salt bridgeand not a K1030-D1150 salt bridge (Fig. 3 a, and snapshot at45.60 ns in Fig. 3 b).
The crystal structures suggest that Y1158 and Y1162 aresignificantly exposed to the solvent on phosphorylation,whereas Y1163 is buried. The A-loop transition studied inthis work also provides insights into the solvent exposureof these catalytic tyrosines. In Fig. 3 c, we show the snap-shots of IRKD at different simulation times highlightingthe side chain of three tyrosine residues (1158, 1162, and1163). We observe that during TAMD, Y1162 is the firstresidue to leave the active site and expose itself to thesolvent, immediately followed by Y1158 (snapshots at20.53 and 23.43 ns). The last tyrosine to expose itself tothe solvent is Y1163 (snapshot at 34.69 ns), which becomesfurther buried due to conformational change in the A-loop,leaving Y1158 and Y1162 solvent-exposed as seen in theactive crystal structure (snapshots at 41.03 and 43.90 ns).These results suggest that Y1162, Y1158, and Y1163 likelyare the first, second, and third tyrosines respectively toundergo trans-autophosphorylation by the other kinasedomain, which is consistent with earlier experiments (33).Also, Hubbard et al. (3) suggest that Y1162 is likely the firstresidue to disengage from the active site because it unblocksthe nucleotide-binding site of IRKD.
Free-energy calculation of the activation pathwayvia String method
The conformation of the A-loop in the equilibratedinactive IRKD is devoid of a defined secondary structure.However, we observe in our independent TAMD trajectories(see Fig. S6, Fig. S7, and Fig. S8) that the A-loop adoptsa helical conformation, before unfolding and subsequentlyadopting an extended activelike conformation (Fig. 2 band see Fig. S6, Fig. S7, and Fig. S8). The fact thatTAMD induces exploration of the physical free-energysurface implies that states observed under TAMD withmoderate fictitious temperatures (here, 5 kcal/mol) are infact statistically significant, suggesting the folding/unfold-ing transition that drives DFG-flip is an important part ofthe activation mechanism. However, to validate this implica-tion, and thereby elucidate the detailed transition mecha-nism, we used the string method (20,26–30) to refine theactivation pathway generated by TAMD (run No. 1) toward
the minimum free-energy path (MFEP; see Methods).The free energy profiles computed along both the initialand converged pathways appear in Fig. 4 a. The initialpathway generated by TAMD converges to the MFEP in25 iterations during which the free-energy of the end image
FIGURE 4 (Color online) (a) Free energy profiles along the initial (red)and final converged (black) activation pathways. (Profiles for all stringmethod iterations appear in Fig. S1 in the Supporting Material.) (b) Repre-sentative conformations of IRKD fromMFEP images 1, 4, 6, 12, 13, 14, 18,and 23, with the A-loop (red), and the side chains of Asp1150 and Phe1151
(cyan and blue, respectively).
Biophysical Journal 102(8) 1979–1987
1984 Vashisth et al.
The MFEP shows a metastable intermediate characterized by a helical configuration of the loop
0 5 10 15 20string iterations
0
0.05
0.1
aver
age
RM
SD fr
om in
itial
pat
h
salt bridge by pulling E1047 (and in turn the aC-helix)toward K1030 (snapshot at 40.97 and 45.60 ns in Fig. 3 b).R1155 also intermittently interacts with D1150 (snapshot at19.83 ns in Fig. 3 b). We do not observe a R1155-Y1163 saltbridge except a transient proximity of both residues (snap-shot at 20.95 ns in Fig. 3 b) because this interaction requiresphosphorylated Y1163, which is not the case in our simula-tions. We also observe that K1030 can engage both E1047
and D1150 (after DFG-flip) simultaneously in salt-bridginginteractions (snapshot at 40.97 ns in Fig. 3 b). But in thefinal state, we only observe a stable K1030-E1047 salt bridgeand not a K1030-D1150 salt bridge (Fig. 3 a, and snapshot at45.60 ns in Fig. 3 b).
The crystal structures suggest that Y1158 and Y1162 aresignificantly exposed to the solvent on phosphorylation,whereas Y1163 is buried. The A-loop transition studied inthis work also provides insights into the solvent exposureof these catalytic tyrosines. In Fig. 3 c, we show the snap-shots of IRKD at different simulation times highlightingthe side chain of three tyrosine residues (1158, 1162, and1163). We observe that during TAMD, Y1162 is the firstresidue to leave the active site and expose itself to thesolvent, immediately followed by Y1158 (snapshots at20.53 and 23.43 ns). The last tyrosine to expose itself tothe solvent is Y1163 (snapshot at 34.69 ns), which becomesfurther buried due to conformational change in the A-loop,leaving Y1158 and Y1162 solvent-exposed as seen in theactive crystal structure (snapshots at 41.03 and 43.90 ns).These results suggest that Y1162, Y1158, and Y1163 likelyare the first, second, and third tyrosines respectively toundergo trans-autophosphorylation by the other kinasedomain, which is consistent with earlier experiments (33).Also, Hubbard et al. (3) suggest that Y1162 is likely the firstresidue to disengage from the active site because it unblocksthe nucleotide-binding site of IRKD.
Free-energy calculation of the activation pathwayvia String method
The conformation of the A-loop in the equilibratedinactive IRKD is devoid of a defined secondary structure.However, we observe in our independent TAMD trajectories(see Fig. S6, Fig. S7, and Fig. S8) that the A-loop adoptsa helical conformation, before unfolding and subsequentlyadopting an extended activelike conformation (Fig. 2 band see Fig. S6, Fig. S7, and Fig. S8). The fact thatTAMD induces exploration of the physical free-energysurface implies that states observed under TAMD withmoderate fictitious temperatures (here, 5 kcal/mol) are infact statistically significant, suggesting the folding/unfold-ing transition that drives DFG-flip is an important part ofthe activation mechanism. However, to validate this implica-tion, and thereby elucidate the detailed transition mecha-nism, we used the string method (20,26–30) to refine theactivation pathway generated by TAMD (run No. 1) toward
the minimum free-energy path (MFEP; see Methods).The free energy profiles computed along both the initialand converged pathways appear in Fig. 4 a. The initialpathway generated by TAMD converges to the MFEP in25 iterations during which the free-energy of the end image
FIGURE 4 (Color online) (a) Free energy profiles along the initial (red)and final converged (black) activation pathways. (Profiles for all stringmethod iterations appear in Fig. S1 in the Supporting Material.) (b) Repre-sentative conformations of IRKD fromMFEP images 1, 4, 6, 12, 13, 14, 18,and 23, with the A-loop (red), and the side chains of Asp1150 and Phe1151
(cyan and blue, respectively).
Biophysical Journal 102(8) 1979–1987
1984 Vashisth et al.
Find the MFEP in the 12D FE space

Summary
TAMD can be used for exploration of unknown PMF landscapes, searching for new conformers (meta-stable states). It can give rough estimates of the PMF barriers by comparison with the effective energy on collective variables.
A large number of collective variables can be used (Abrams & Vanden-Eijnden PNAS 2010, 69 variables for the conformational transition of HIV-1 gp120)
More accurate PMF estimation and reconstruction obtained using TAMD in conjunction with the single-sweep method (multi-dimensional analogue of thermodynamic integration) and the string method (to specifically find MFEPs).