atp-driven separation of liquid phase condensates in bacteria
TRANSCRIPT

HAL Id hal-02391672httpshalarchives-ouvertesfrhal-02391672
Submitted on 2 Oct 2020
HAL is a multi-disciplinary open accessarchive for the deposit and dissemination of sci-entific research documents whether they are pub-lished or not The documents may come fromteaching and research institutions in France orabroad or from public or private research centers
Lrsquoarchive ouverte pluridisciplinaire HAL estdestineacutee au deacutepocirct et agrave la diffusion de documentsscientifiques de niveau recherche publieacutes ou noneacutemanant des eacutetablissements drsquoenseignement et derecherche franccedilais ou eacutetrangers des laboratoirespublics ou priveacutes
ATP-Driven Separation of Liquid Phase Condensates inBacteria
Baptiste Guilhas Jean-Charles Walter Jerome Rech Gabriel David Nils-OleWalliser John Palmeri Ceacuteline Mathieu-Demaziere Andrea Parmeggiani
Jean-Yves Bouet Antoine Le Gall et al
To cite this versionBaptiste Guilhas Jean-Charles Walter Jerome Rech Gabriel David Nils-Ole Walliser et al ATP-Driven Separation of Liquid Phase Condensates in Bacteria Molecular Cell Cell Press 2020 79 (2)pp293-303 101016jmolcel202006034 hal-02391672
ATP-driven separation of liquid phase condensates in bacteria
B Guilhas1 JC Walter2 J Rech3 G David2 N-O Walliser 2 J Palmeri2 C
Mathieu-Demaziere3 A Parmeggiani24 JY Bouet3 A Le Gall1 M Nollmann1
1 Centre de Biochimie Structurale CNRS UMR 5048 INSERM U1054 Universiteacute de Montpellier 60 rue
de Navacelles 34090 Montpellier France
2 Laboratoire Charles Coulomb (L2C) Univ Montpellier CNRS Montpellier France
3 LMGM CBI CNRS Univ Toulouse UPS Toulouse France
4 LPHI CNRS Univ Montpellier Montpellier France
Corresponding authors
Page 1
certified by peer review) is the authorfunder All rights reserved No reuse allowed without permission The copyright holder for this preprint (which was notthis version posted May 4 2020 httpsdoiorg101101791368doi bioRxiv preprint
Abstract
Liquid-liquid phase separated (LLPS) states are key to compartmentalise
components in the absence of membranes however it is unclear whether LLPS condensates
are actively and specifically organized in the sub-cellular space and by which mechanisms
Here we address this question by focusing on the ParABS DNA segregation system
composed of a centromeric-like sequence ( parS) a DNA-binding protein (ParB) and a motor
(ParA) We show that parS-ParB associate to form nanometer-sized round condensates
ParB molecules diffuse rapidly within the nucleoid volume but display confined motions
when trapped inside ParB condensates Single ParB molecules are able to rapidly diffuse
between different condensates and nucleation is strongly favoured by parS Notably the
ParA motor is required to prevent the fusion of ParB condensates These results describe a
novel active mechanism that splits segregates and localises non-canonical LLPS condensates
in the sub-cellular space
Keywords
liquid droplets phase separation liquid phase-condensation plasmid partition ParABS single
particle tracking photo-activated localization microscopy
Page 2
certified by peer review) is the authorfunder All rights reserved No reuse allowed without permission The copyright holder for this preprint (which was notthis version posted May 4 2020 httpsdoiorg101101791368doi bioRxiv preprint
Introduction
In the past bacteria were often viewed as homogeneous systems lacking the
complex sub-cellular spatial organization patterns observed in eukaryotes The advent of
powerful labeling and imaging methods has enabled the discovery of a plethora of
mechanisms used by bacteria to specifically and precisely localize components in space and
time within their sub-cellular volume (Surovtsev and Jacobs-Wagner 2018 Shapiro
McAdams and Losick 2009) These mechanisms include pole-to-pole oscillatory systems to
define the site of cell division (eg MinCDE) dynamic ATP-driven polymerization to drive
cell division and cell growth (eg FtsZ MreB) recognition of cell curvature to localize
chemotaxis complexes (eg DivIVA (Ramamurthi and Losick 2009)) ATP-powered
translocation of membrane-bound machines to power cell motility (eg Agl-Glt (Faure et al
2016)) or nucleoid-bound oscillatory systems to localize chromosomal loci (eg ParABS (Le
Gall et al 2016)) More recently it became apparent that many cellular components (eg
ribosomes RNA polymerases P-granules) (Sanamrad et al 2014 van Gijtenbeek et al 2016
Moffitt et al 2016 Racki et al 2017) display specific sub-cellular localization patterns
leading to the spatial segregation of biochemical reactions (eg translation transcription or
polyP biosynthesis) Most notably bacteria are able to achieve this precise sub-cellular
compartmentalization without resorting to membrane-enclosed organelles
Recently important progress has been made in understanding the formation of
membrane-less organelles in eukaryotic cells (Hyman Weber and Juumllicher 2014) A
combination of in vitro and in vivo experiments demonstrated that such compartments are
formed by liquid-liquid phase separation (LLPS) (Hyman Weber and Juumllicher 2014) a
thermodynamic process by which attractive molecular interactions counterbalance
entropy-driven effects This phenomenon promotes the self-organisation of a condensed
Page 3
certified by peer review) is the authorfunder All rights reserved No reuse allowed without permission The copyright holder for this preprint (which was notthis version posted May 4 2020 httpsdoiorg101101791368doi bioRxiv preprint
phase in which molecules are close enough from each other to experience their mutual
attraction interfaced with a dilute phase This mechanism provides advantages such as
rapid assemblydisassembly absence of a breakable membrane and serves fundamental
biological processes such as regulation of biochemical reactions sequestration of toxic
factors or organization of hubs (Shin and Brangwynne 2017)
The first evidence that eukaryotic cells use LLPS came from examination of P
granules in C elegans (Brangwynne et al 2009) In this study Brangwynne et al observed
different key signatures of liquid droplets P granules formed spherical bodies that could
fuse together drip and wet and displayed a dynamic internal organisation Since then
many other processes in eukaryotes were shown to display LLPS properties (Banani et al
2017) A few recent examples show that this phenomenon also exists in bacteria for
instance ribonucleoprotein granules (Al-Husini et al 2018) the cell division protein FtsZ
(Monterroso et al 2019) and carboxysomes (Wang et al 2019 MacCready Basalla and
Vecchiarelli 2020) Thus LLPS seems to be a universal mechanism to compartmentalise
components in the absence of membranes However it is unclear whether LLPS
condensates are actively and specifically organized in the sub-cellular space and by which
mechanisms
We addressed this problem by investigating how specific DNA sequences are
organized within the sub-cellular volume in space and time We focused on the ParABS
partition system responsible for chromosome and plasmid segregation in bacteria and
archaea (Bouet et al 2014 Toro and Shapiro 2010 Baxter and Funnell 2014 Schumacher et
al 2015) This system is composed of three components (1) a centromeric sequence ( parS)
(2) a dimeric DNA binding protein (ParB) that binds parS and (3) a Walker A ATPase (ParA)
We have previously shown that ParB is very abundant (gt850 dimers per cell) (Bouet et al
Page 4
certified by peer review) is the authorfunder All rights reserved No reuse allowed without permission The copyright holder for this preprint (which was notthis version posted May 4 2020 httpsdoiorg101101791368doi bioRxiv preprint
2005) and localizes to a large extent (~90 of ParB molecules) to regions containing parS
(Sanchez et al 2015) to form a tight nucleoprotein complex (partition complex) In addition
to specific interactions with parS other ingredients were shown to be involved in the
assembly of the partition complex weak ParB-ParB dimer interactions mediated by its
disordered low complexity region as well as non-specific interactions with the surrounding
DNA (Debaugny et al 2018) Different models were proposed for the assembly of partition
complexes The lsquospreadingrsquo model postulates that ParB dimers load at parS sites and then
spread outwards over large genomic distances (Murray Ferreira and Errington 2006
Rodionov Lobocka and Yarmolinsky 1999) In the lsquospreading and bridgingrsquo and lsquocagingrsquo
models additional long-range interactions between ParB dimers and DNA help the partition
complex assemble and coalesce into compact three dimensional assemblies (Broedersz et al
2014 Sanchez et al 2015 Graham et al 2014)
Here we used super-resolution microscopy and single-particle analysis to investigate
the physical mechanisms involved in the formation of bacterial partition complexes We
show that partition complexes are small (lt50nm) spherical objects Single isolated ParB
molecules diffuse rapidly within the nucleoid volume but display confined motions when
trapped inside partition complexes These results suggest a partition of ParB into two
phases a gas-like phase and a dense liquid-like condensate phase that shows
nanometer-sized spherical droplets Next we show that the nucleation of ParB condensates
is strongly favoured by the presence of the centromeric sequence parS and that separation
and proper sub-cellular localization of ParB condensates require the ParA motor Critically
different ParB condensates collapse into a single condensate upon degradation of ParA or
by mutating ParArsquos ATPase nucleotide-binding site These results describe a novel active
mechanism that splits segregates and localises LLPS condensates in the sub-cellular space
Page 5
certified by peer review) is the authorfunder All rights reserved No reuse allowed without permission The copyright holder for this preprint (which was notthis version posted May 4 2020 httpsdoiorg101101791368doi bioRxiv preprint
Results
ParB assembles into spherical nano-condensates
Previous studies revealed that the partition complex is made of ~250 dimers of ParB
(Adachi Hori and Hiraga 2006 Bouet et al 2005) and ~10kb of parS-proximal DNA
(Rodionov Lobocka and Yarmolinsky 1999) This complex is held together by specific
high-affinity interactions between ParB and parS and by low-affinity interactions between
ParB dimers that are essential for the distribution of ParB around parS sites (Figure 1A)
(Sanchez et al 2015 Debaugny et al 2018) However technological limitations have
thwarted the investigation of the physical mechanisms involved in the formation of partition
complexes
We addressed these limitations by first investigating the shape and size of the
F-plasmid partition complex reasoning that the former should inform us on the role of the
mechanisms involved in the maintenance of the complex cohesion while the latter would
enable an estimation of protein concentration within the partition complex To this aim we
combined Photo-Activated Localisation Microscopy (PALM) (Marbouty et al 2015 Fiche et
al 2013) with single-particle reconstruction (Salas et al 2017) and used a previously
validated functional ParB-mEos2 fusion strain (Sanchez et al 2015) In addition we
implemented an efficient and well-controlled fixation protocol (Figure S1A and Methods) to
limit the influence of partition complex dynamics and reach a localization precision of
(Figures S1B-C) Most single ParB particles localized to the partition complex as4 6 nm1 plusmn
we previously observed by live PALM (Sanchez et al 2015) (Figure 1B) Next we clustered
localizations pertaining to each partition complex using a density-based clusterization
algorithm (Cattoni et al 2017 Levet et al 2015) Partition complexes were positioned near
Page 6
certified by peer review) is the authorfunder All rights reserved No reuse allowed without permission The copyright holder for this preprint (which was notthis version posted May 4 2020 httpsdoiorg101101791368doi bioRxiv preprint
the quarter cell positions (Figure S1A) as reported previously (Le Gall et al 2016) Partition
complex shapes displayed heterogeneity reflecting the different three dimensional
projections and conformational states of the complex (Figure 1B-C) Thus we used
single-particle analysis to classify them into eight major class averages that contained most
partition complexes (Figure 1C S1D-E) and applied several quantitative methods to assess
particle shape in each class (Figures S1G-I) Direct comparison with simulated spherical
particles revealed that experimental particles within each class display highly symmetric
shapes with very little roughness From the first eight class averages we generated 3D
reconstructions reaching nanometer-scale isotropic resolution (Figure 1D) (Salas et al 2017)
Next we estimated the size of the partition complex by calculating the mean full
width at half maximum of the reconstructions obtained from each single class average
(average of all classes = 43 7 nm) (Figure S1F) Thus from the size of the partition plusmn
complex and the average number of ParB in each partition complex (~250 ParB dimers)
(Adachi Hori and Hiraga 2006 Bouet et al 2005) we can estimate a local ParB dimer
concentration of the order of ~10 mM (see Methods for details) Remarkably this extremely
high concentration is comparable to that of the total protein concentration in the bacterial
cytoplasm (~10 mM for proteins of the same size as ParB) (Elowitz et al 1999) suggesting
that ParB dimers represent most of the total protein volume within a partition complex
ParB dimers interact together with sub-microM affinities (03-1 microM) (Taylor et al 2015 Sanchez
et al 2015) thus we expect virtually every ParB dimer within a partition complex to be
interacting with another ParB dimer Overall these data show that ParB assembles
nanometer-sized high-concentration membrane-free spherical compartments
Page 7
certified by peer review) is the authorfunder All rights reserved No reuse allowed without permission The copyright holder for this preprint (which was notthis version posted May 4 2020 httpsdoiorg101101791368doi bioRxiv preprint
ParB exists in an equilibrium between liquid- and gas-like phases
Next we investigated whether single ParB dimers were able to escape partition
complexes by using single-particle tracking PALM (sptPALM) (Le Gall et al 2016 Sanchez et
al 2015 Manley et al 2008 Niu and Yu 2008) We observed two distinct dynamic behaviors
reflected by low-mobility (or confined) and high-mobility trajectories with clearly different
apparent diffusional properties (Figures 2A-B) The low-mobility species is consistent with
immobile ParB dimers bound to DNA specifically whereas the high-mobility fraction is
consistent with ParB dimers interacting non-specifically with chromosomal DNA (see
discussion in Figure S2)
A recent study explored the dynamic behaviour of LacI in conditions where the
number of LacI molecules was in vast excess with respect to the number of specific Lac
repressor sites mirroring the experimental conditions found in the ParBS system (Garza de
Leon et al 2017) In this case the authors observed that ~80 of trajectories were highly
mobile corresponding to repressors interacting non-specifically with DNA with only ~20
of tracks displaying low mobility and corresponding to repressors bound to their operators
In stark contrast for the ParAB S system most ParB particles displayed a low-mobility
(~95) and only a small proportion of particles were highly mobile (lt5) (Figure 2B)
Low-mobility trajectories localized near the quarter cell positions similarly to ParB
complexes (Figure S2A-B) To determine whether these trajectories clustered in space we
calculated the pair correlation between low-mobility trajectories (see Methods) For a
homogeneous distribution we would expect a flat line (see dashed curve in Figure 2C) In
contrast we observed a sharp peak at short distances indicating that low-mobility ParB
particles are spatially confined within partition complexes (Figure 2C blue curve)
High-mobility trajectories instead occupied the whole nucleoid space (Figure S2A) Thus
Page 8
certified by peer review) is the authorfunder All rights reserved No reuse allowed without permission The copyright holder for this preprint (which was notthis version posted May 4 2020 httpsdoiorg101101791368doi bioRxiv preprint
from the percentage of high-mobility trajectories detected (~5 of all trajectories) and the
estimated number of ParB dimers per cell (~800) one can estimate that only ~20 ParB
dimers are typically moving between partition complexes High-mobility ParB dimers move
on the nucleoid volume thus we estimate that this species exists at a concentration of ~20
nM five orders of magnitude smaller than the ParB concentration within partition
complexes (~10 mM) Therefore these results suggest that ParB molecules exist in two
well-defined phases (1) a highly condensed liquid-like state (ParB condensate) containing a
high concentration of low-mobility ParB dimers and (2) a diluted gas-like phase where
single high-mobility ParB dimers diffuse on the nucleoid by weak non-specific DNA
interactions (Sanchez et al 2013 Taylor et al 2015 Fisher et al 2017)
ParB diffuses across phase boundaries
This interpretation suggests that single ParB molecules should be able to diffuse
between two different partition complexes within the same cell To test this we
photobleached a single partition complex and monitored the total fluorescence signal in
both the bleached and unbleached complex (Figure 2D) Strikingly we observed a clear
increase in the fluorescence signal of the bleached complex over time with a concomitant
decrease of the fluorescence signal of the unbleached complex (Figures 2D-E) This
behaviour can only be explained by the escape of fluorescent proteins from the unbleached
complex into the gas-phase and the entry of proteins from the gas-phase into the bleached
complex This produces a net flux between unbleached and bleached complexes and
vice-versa The symmetry between both curves suggests that both fluxes have similar
magnitudes (Figure 2E S2C) By modeling the diffusion process we could fit the
experimental curves to a model and estimated the residence time of a ParB molecule in a
Page 9
certified by peer review) is the authorfunder All rights reserved No reuse allowed without permission The copyright holder for this preprint (which was notthis version posted May 4 2020 httpsdoiorg101101791368doi bioRxiv preprint
ParB condensate to be ~ 100 s (Figures S2D-F) while the typical time in the gas-like phase
was ~23 s Note that these typical times provide a good estimate (~90) of the number of
ParB dimers confined within partition complexes (see Figure S2)
Eventually the system reached equilibrium (after ~4 min) At this point the
fluorescence intensities of bleached and unbleached complexes became equal indicating
that ParB molecules equipartitioned between the two condensates We note that
equipartition between ParB condensates would only be possible if single ParB dimers were
diffusing across the liquid-like and gas-like phase boundaries therefore equilibrating
chemical potentials between these two phases (Hyman Weber and Juumllicher 2014) In
equilibrium small condensates in a canonical LLPS system are expected to fuse into a single
large condensate for instance by Ostwald ripening (Hyman et al 2014) Thus the
observation that ParB condensates are in mutual stationary equilibrium at times smaller
than the cell cycle suggests non-canonical mechanisms to suppress droplet fusion
ParB condensates are able to merge
Biomolecular condensates can exhibit different internal architectures For example
the Balbiani body is a solid-like structure maintained by a network of amyloid-type fibers
(Shin and Brangwynne 2017) while liquid-like behavior of P granules denotes an internal
disordered organization Thus the ability of two compartments to fuse helps distinguish
between these two different internal structures To study whether ParB condensates were
able to fuse over time we performed live time-lapse fluorescence microscopy experiments
We observed that independent partition complexes were able to fuse into a single partition
complex (Figure 2F) Notably we observed that fused complexes move in concert during
several seconds (Figure 2F) These fusion events were rapid (~5plusmn3 s) and reversible (14 out
Page 10
certified by peer review) is the authorfunder All rights reserved No reuse allowed without permission The copyright holder for this preprint (which was notthis version posted May 4 2020 httpsdoiorg101101791368doi bioRxiv preprint
of 14 events) To estimate whether the number of ParB molecules was conserved upon
fusion we integrated the fluorescence intensity signal of each ParB condensate prior and
after fusion As expected the integrated intensity increased upon fusion (Figure S2G) but
only by 15plusmn01 fold instead of the two-fold increase expected for canonical LLPS systems
Conversely splitting of ParB condensates decreased the integrated intensity by 07plusmn01 fold
(Figure S2H) We note that this ability of ParB complexes to fuse is not unique to the
F-plasmid system and was also observed for P1 plasmids which also segregate using a
ParABS system (Sengupta et al 2010)
parS and low- and high-affinity ParB interactions are sufficient for phase separation
Next we performed a thermodynamic analysis and Monte-Carlo simulations to find
the minimal set of assumptions that would be necessary to reproduce an equilibrium
between liquid- and gas-like phases For this we considered a minimalistic gas-liquid lattice
model that shows in mean field theory a generic LLPS diagram (Figure S3A) In our
experimental conditions the percentage loss of plasmid in a ΔParAB mutant strain can be
used to estimate on average ~1 plasmidParB condensate Thus we simulated 300 ParB
particles on a three-dimensional 2x05x05 microm3 lattice with a spacing of 5 nm and
represented the F-plasmid by a single static high affinity binding site within this lattice
containing a repeat of 10 parS sequences ParB interacted with high affinity with the parS
cluster (hereafter parS10) with low-affinity with all other sites in the lattice and with
low-affinity with itself Affinities and concentrations were based on
experimentally-determined coefficients (Figure S3) The system was left to evolve under
different initial conditions (pure gas-like or liquid-like states) and in the presence or absence
of parS10 The system remained in a gas-like phase in the absence of parS10 (Figure 3A
Page 11
certified by peer review) is the authorfunder All rights reserved No reuse allowed without permission The copyright holder for this preprint (which was notthis version posted May 4 2020 httpsdoiorg101101791368doi bioRxiv preprint
green curve) or when ParB-ParB interactions were too weak (Figure S3D-E) In contrast in
the presence of parS10 and of physiological ParB-ParB interactions the system sequentially
evolved towards states involving parS binding nucleation and stable co-existence of liquid-
and gas-like phases (Figure 3A blue curve) The system evolved towards the same endpoint
when the initial condition was a pure liquid-like state (Figure 3A gray curve) At this
endpoint 80 of the molecules were in a liquid-phase and the remainder in a gas-like state
comparable to the proportion of clustered low-mobility trajectories observed
experimentally (95 Figure 2B) Thus this minimalist model reproduces the basic
experimental phenomenology and shows that the only elements required to reach a stable
coexistence between liquid and gas-like ParB phases are low-affinity interactions between
ParB dimers and high-affinity interactions between ParB and the nucleation sequence parS
Critically ParB was unable to form a stable liquid-gas coexistence phase in the absence of
parS within physiological timescales (Figure 3A green curve) whilst the nucleation of ParB
condensates was accelerated by an increasing number of parS sequences (Figure S3F) Thus
our simulations suggest that efficient nucleation of ParB into condensates requires parS
We experimentally tested this prediction by performing sptPALM experiments in a
strain lacking parS In contrast to our previous results we frequently observed high-mobility
trajectories (Figure 3B-C) In fact the proportion of this population increased from ~5 in
the wild-type to ~50 in the absence of parS The persistence of low-mobility trajectories
suggests that a fraction of ParB dimers can remain bound to other chromosomal sequences
mimicking parS sites To test this hypothesis we first searched the Ecoli chromosome for
sequences displaying homology to the parS motif (TGGGACCACGGTCCCA) using FIMO and
found tens of sequences displaying only two or three mutations in the consensus parS
sequence (Figure S3G) Second we observed using Monte-Carlo simulations that single
Page 12
certified by peer review) is the authorfunder All rights reserved No reuse allowed without permission The copyright holder for this preprint (which was notthis version posted May 4 2020 httpsdoiorg101101791368doi bioRxiv preprint
parS -like chromosomal sequences can be partially occupied in the absence of parS (Figure
S3H) Finally we found using sptPALM that a ParB mutant with reduced parS-binding affinity
exhibits a further reduction in the low-mobility population with respect to the strain lacking
parS (from 50 to 30 Figure S3I) Overall these results indicate that weakening ParB-parS
interactions leads to a large shift of ParB dimers towards the gas phase However it was not
clear whether the remaining low-mobility ParB dimers still formed condensed phases
To address this question we performed pair-correlation analysis of low-mobility
trajectories (Figure 3D) Clearly low-mobility trajectories displayed a homogeneous
distribution and failed to cluster in both mutant strains in contrast with the clustering
behaviour of low-mobility trajectories in the wild-type (Figure 3D) All in all these
observations show that formation of ParB condensates requires ParB-parS interactions and
are consistent with previous studies (Erdmann Petroff and Funnell 1999 Sanchez et al
2013) (Sanchez et al 2013)
A second conclusion of our Monte-Carlo model is that ParB dimer interactions are
also required for the formation of a condensed phase To test this prediction
experimentally we used a strain carrying a mutation in the arginine-rich motif of ParB that
partially reduces ParB dimer interactions (ParB-3R mutant) In this mutant formation of
partition complexes is considerably impaired (Debaugny et al 2018) By sptPALM we
observed that low-mobility trajectories considerably decrease their ability to cluster (Figure
3D) consistent with previous studies (Debaugny et al 2018 Song et al 2017) and in
support of our Monte Carlo simulations (Figure S3D-E) Taken together these data indicate
that high-affinity ParB-parS interactions and low-affinity ParB dimer interactions are
needed for the assembly of stable liquid-like ParB condensates Weak interactions between
Page 13
certified by peer review) is the authorfunder All rights reserved No reuse allowed without permission The copyright holder for this preprint (which was notthis version posted May 4 2020 httpsdoiorg101101791368doi bioRxiv preprint
ParB dimers and nsDNA were also shown to be necessary for partition complex assembly
(Sanchez et al 2013 Taylor et al 2015 Fisher et al 2017)
Motor proteins drive ParB condensates out-of-equilibrium
At equilibrium a passive system undergoing phase separation displays a single
condensed phase if initially multiple condensed phases are found the lowest energy state
comprises a single liquid-separated phase that can be reached either by fusion or through
Ostwald ripening (Zwicker et al 2014) Partition systems have specifically evolved to ensure
faithful DNA segregation to daughter cells which would be impeded by fusion into single
stable partition complexes Our previous time-lapse fluorescence microscopy experiments
showed that single partition complexes can merge at short time-scales (tens of seconds
Figure 2F) At longer time-scales (tens of minutes) however ParB condensates are not only
kept apart from each other but are also actively segregated concomitantly with the growth
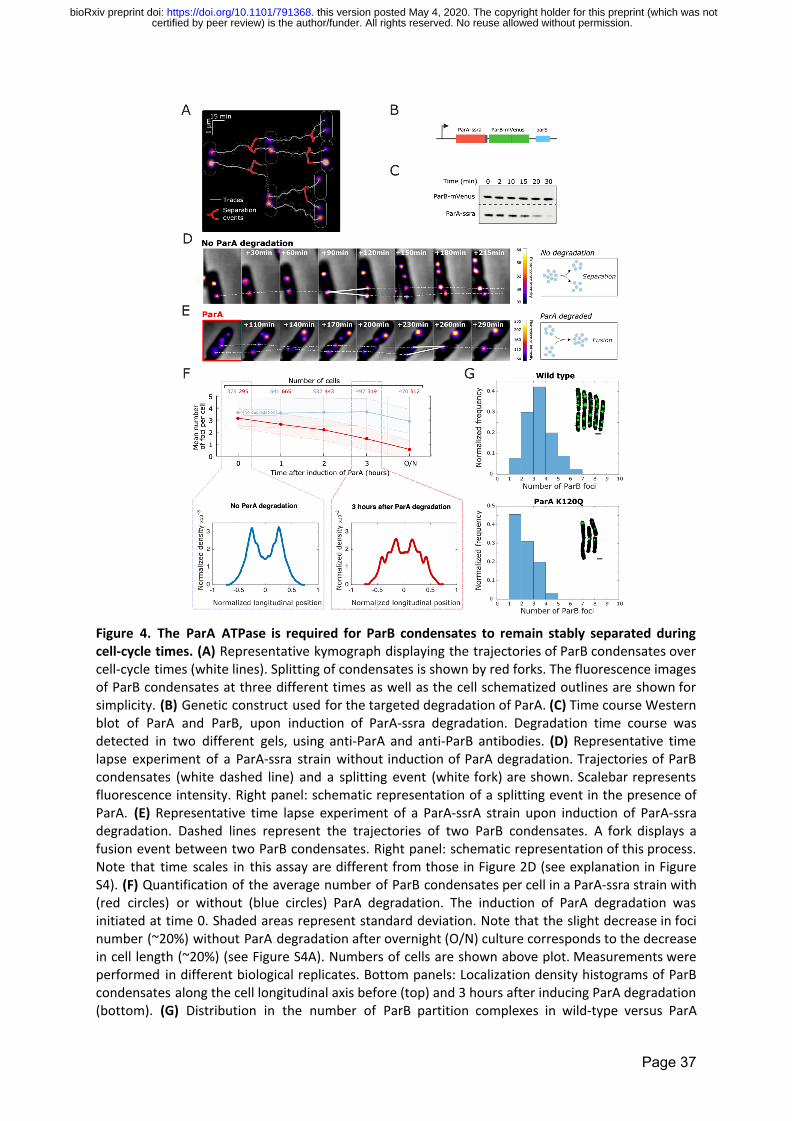
of the host cell (Figure 4A) Previous reports have shown that the ParA motor protein is
necessary to ensure faithful separation and segregation of partition complexes (Le Gall et al
2016 Erdmann Petroff and Funnell 1999) This function requires both ParArsquos ATP
hydrolysis activity and its stimulation by ParB (Le Gall et al 2016 Ah-Seng et al 2013) and
would ensure the segregation of ParB condensates However it is not clear whether ParA
may play a role at preventing fusion of ParB condensates
If ParA was the factor preventing fusion of ParB condensates then its slow removal
should lead to the fusion of all ParB condensates in a cell To test this hypothesis we
generated a strain where ParA can be selectively degraded using a degron system
(McGinness Baker and Sauer 2006) (Figure 4B) In this strain we observed a large reduction
in ParA levels after 30 min of degron induction (Figure 4C) In the absence of ParA
Page 14
certified by peer review) is the authorfunder All rights reserved No reuse allowed without permission The copyright holder for this preprint (which was notthis version posted May 4 2020 httpsdoiorg101101791368doi bioRxiv preprint
degradation this strain displayed wildtype ParB condensate separation dynamics (Figure 4D
white traces) Strikingly upon degradation of ParA we observed the fusion of ParB
condensates (Figure 4E white traces) Over time the average number of ParB condensates
per cell collapsed to 06 plusmn 07 ParB condensatescell in ParA-degraded cells but remained at
29 plusmn 10 ParB condensatescell in cells where ParA degradation was not induced (Figure 4F
S4A) To test whether this reduction was due to the fusion of partition complexes we
quantified the mean intensity of ParB condensates before (0h) and 3h after ParA
degradation (Figure S4B) The marked increase in the mean intensity of ParB condensates
over time (from 29plusmn09 at 0h to 49plusmn 23 at 3h) further suggests that the observed decrease
in the number of ParB condensates was due to condensate fusion
Next we wondered whether ParA degradation would have other consequences in
ParB condensate dynamics For this we quantified the sub-cellular positioning of ParB
condensates before (0h) and 3h after ParA degradation by calculating the localization
density histogram of ParB condensates along the longitudinal axis of the cell These
histograms show that ParA degradation changes the average sub-cellular positioning of ParB
condensates (Figure 4F) in good agreement with previous findings using ParA deletion
strains (Le Gall et al 2016)
While these results show that ParA is necessary to maintain ParB condensates apart
they do not provide direct evidence for the need of ParArsquos ATPase activity in this process
For this we quantified the number of partition complexes in cells where we directly
mutated ParArsquos ATPase nucleotide-binding site (ParAK120Q a mutant impaired in ATP
hydrolysis stimulated by ParB) The mean number of partition complexes was 30plusmn11 in
wild-type cells and decreased to 18plusmn09 in the ParA ATPase mutant strain (Figure 4G)
Page 15
certified by peer review) is the authorfunder All rights reserved No reuse allowed without permission The copyright holder for this preprint (which was notthis version posted May 4 2020 httpsdoiorg101101791368doi bioRxiv preprint
consistent with ParArsquos ATPase activity being implicated in the separation of ParB
condensates
Discussion
Here we provide evidence in support of a new class of droplet-like-forming system
with unique properties that ensure the stable coexistence and regulated inheritance of
separate liquid-condensates Interestingly the three components of the ParABS partition
system and an exquisite regulation of their multivalent interactions are required to observe
this complex behavior (1) High-affinity interactions between ParB and the parS centromeric
sequence are necessary for the nucleation of the ParB condensate (2) Weak interactions of
ParB with chromosomal DNA and with itself are necessary to produce phase separation (3)
The ParA ATPase is required to counter condensate fusion and to properly position
condensates in the cell Interestingly this system displays several non-canonical properties
discussed below
In vivo ParB binds parS and an extended genomic region of ~10kb around parS
(Murray Ferreira and Errington 2006 Rodionov Lobocka and Yarmolinsky 1999 Sanchez
et al 2015) Interestingly the size of this extended genomic region is independent of the
intracellular ParB concentration (Debaugny et al 2018) suggesting that an increase in the
total number of ParB molecules per cell either leads to an increase in the concentration of
ParB within droplets or that an unknown mechanism controls the size of ParB droplets
Here we found that the intensity of ParB condensates increases by 15plusmn01 fold upon
fusion instead of doubling as expected for a conservative process Consistently the
intensity of ParB condensates did not decrease by two-fold but by 07plusmn01 upon condensate
splitting All in all these results suggest that droplet fusionsplitting may be
Page 16
certified by peer review) is the authorfunder All rights reserved No reuse allowed without permission The copyright holder for this preprint (which was notthis version posted May 4 2020 httpsdoiorg101101791368doi bioRxiv preprint
semi-conservative and point to a more complex mechanism regulating ParB number andor
droplet size
Proteins in canonical LLPS systems assemble in compact droplets such as oil
molecules in an oil-in-water emulsion In this case an increase in the number of lsquooilrsquo
molecules leads to an increase in droplet size because the concentration of oil molecules in
droplets is at its maximum (ie the droplet is compact) There are two key differences in the
ParABS system that mean that a doubling in ParB number does not necessarily lead to a
doubling in droplet volume First most ParB proteins in ParBS condensates are bound to the
DNA lattice formed by parS and the surrounding chromosomeplasmid DNA Thus ParB
mainly lives on a polymer and therefore an increase in ParB number can compact the DNA in
the droplet leading to only slight increases in condensate size Second the concentration of
ParB in ParB condensates is ~10 mM This concentration is not that of a compact aggregate
in a watery solvent Therefore increases in ParB numbers can lead to increases in the
concentration of ParB in droplets that do not lead to noticeable changes in droplet sizes
Finally we cannot discard mechanisms controlling the size of ParB condensates (Soumlding et
al 2019 Garcia-Jove Navarro et al 2019 Zwicker et al 2014) that could decouple increases
in droplet volume from increases in the number of ParB molecules
In passive canonical phase-separation systems separate liquid droplets grow by
taking up material from a supersaturated environment by Ostwald ripening or by fusion of
droplets Over time these processes lead to a decrease in the number of droplets and an
increase in their size This reflects the behaviour we observed for ParB condensates upon
depletion of ParA or when its ATPase activity was reduced Recently theoretical models
have predicted mechanisms to enable the stable coexistence of multiple liquid phases
(Zwicker Hyman and Juumllicher 2015) These mechanisms require constituents of the phase
Page 17
certified by peer review) is the authorfunder All rights reserved No reuse allowed without permission The copyright holder for this preprint (which was notthis version posted May 4 2020 httpsdoiorg101101791368doi bioRxiv preprint
separating liquids to be converted into each other by nonequilibrium chemical reactions
(Zwicker Hyman and Juumllicher 2015 Zwicker et al 2016) Our result that the ATPase activity
of ParA is required to maintain ParB condensates well separated indicates that motor
proteins can be involved in the active control of droplet number and in their sub-cellular
localization Interestingly similar mechanisms ndashyet to be discoveredndash could control the
number size and sub-cellular localization of other droplet-forming systems such as
P-granules (Brangwynne 2011) stress granules (Jain et al 2016) or heterochromatin
domains (Strom et al 2017)
Acknowledgments
This project has received funding from the European Research Council (ERC) under the
European Unionrsquos Horizon 2020 Research and Innovation Program (Grant ID 724429) (MN)
the Agence Nationale pour la Recherche grant HiResBacs (ANR-15-CE11-0023) (MN) grant
IBM (ANR-14-CE09-0025-01) (MN J-YB AP) the ECOS-Sud program (A16B01) the
Program lsquoInvestissements drsquoAvenirrsquo for the Labex NUMEV (2011-LABX-076) integrated into
the I-Site MUSE (AAP 2013-2-005 2015-2-055 2016-1-024) (GD J-CW N-OW JP AP)
and the CNRS INPHYNITI program (J-CW J-YB) We acknowledge the France-BioImaging
infrastructure supported by the French National Research Agency (grant ID ANR-10-INBS-04
lsquolsquoInvestments for the Futurersquorsquo) BG and GD were supported by a PhD fellowship from the
French Ministegravere de lrsquoEnseignement Supeacuterieur de la Recherche et de lrsquoInnovation
Data availability statement
The data that support the findings of this study are available from the corresponding author
upon reasonable request
Page 18
certified by peer review) is the authorfunder All rights reserved No reuse allowed without permission The copyright holder for this preprint (which was notthis version posted May 4 2020 httpsdoiorg101101791368doi bioRxiv preprint
Code availability
Most analysis tools and methods used in this study are in the open domain (see Methods)
Code developed specifically for this manuscript can be obtained from the corresponding
author upon request
Methods
Sample preparation
sptPALM PALM FRAP and time-lapse microscopy (fast dynamics)
Microscopy coverslips and glass slides were rinsed with acetone and sonicated in a
1M KOH solution for 20 minutes Next they were dried over an open flame to eliminate any
remaining fluorescent contamination A frame of double-sided adhesive tape was placed on
a glass slide and a ~5mm channel was extruded from its center as previously described (Le
Gall Cattoni and Nollmann 2017) Briefly 20 microl of 2 melted agarose (diluted in M9 media
melted at 80degC for the imaging of DLT3469 strain 1 melted agarose diluted in M9 + 02
arabinose) were spread on the center of the glass slide and covered with a second glass slide
to ensure a flat agarose surface The sandwich slides were kept on a horizontal position for 5
min under external pressure at room temperature (RT) to allow the agarose to solidify The
top slide was then carefully removed when bacteria were ready to be deposited in the agar
pad (see below) Cells were harvested during the exponential phase (optical density at 600
nm ~03) For PALM experiments cells were fixed in a 2 PFA solution for 15 min at room
temperature and 30 min at 4degC (for the detailed procedure refer to (Visser Joshi and Bates
2017)) A bacterial aliquot was spun down in a bench centrifuge at RT at 3000g for 3
minutes The supernatant was then discarded and the pellet re-suspended in 10 microl of
minimal media 15 microl of 110 fiducial beads (TetraSpeck TM Life Technologies) were added
Page 19
certified by peer review) is the authorfunder All rights reserved No reuse allowed without permission The copyright holder for this preprint (which was notthis version posted May 4 2020 httpsdoiorg101101791368doi bioRxiv preprint
17 microl of the resulting bacterial solution were pipetted onto the agar After deposition of
bacteria the second face of the double -sided tape was removed and the pad was then
sealed with a clean coverslip
Time-lapse microscopy (slow dynamics)
Long-term ParB-GFP droplet dynamics (Figure 4) were monitored by following the
movement of ParB droplets over several cell cycle times For this cells were first harvested
during the exponential phase (optical density at 600 nm ~03) then diluted to 1300 to
adjust the bacterial density on the field of view and finally deposed in an ONIX CellAsic
microfluidic chamber (B04A plates Merck-Millipore) Bacteria were immobilized and fresh
culture medium (supplemented with 02 arabinose) was provided (103 kPa) throughout
the acquisition
Fluorescence microscopy
PALM and sptPALM
PALM and sptPALM imaging of ParB-mEos2 were performed on a home -built experimental
setup based on a Zeiss Axiovert 200 by continuously acquiring 7000 (20000 for sptPALM)
images at 50ms exposure time (8ms for sptPALM) with a 561 nm readout laser (Sapphire
561LP 100mW Coherent) and continuous illumination with a 405 nm laser for
photoactivation (OBIS 40550 Coherent) Data were acquired using custom-made code
written in Labview The readout laser intensity used was 14 kWcmsup2 at the sample plane
The intensity of the 405nm laser was modified during the course of the experiment to
maintain the density of activated fluorophores constant while ensuring single molecule
Page 20
certified by peer review) is the authorfunder All rights reserved No reuse allowed without permission The copyright holder for this preprint (which was notthis version posted May 4 2020 httpsdoiorg101101791368doi bioRxiv preprint
imaging conditions PALM acquisitions were carried out until all mEos2 proteins were
photoactivated and bleached Fluorescent beads (TetraSpeck TM Life Technologies) were
used as fiducial marks to correct for sample drift by post-processing analysis For cell
segmentation a bright field image was taken on each field of view
Time-lapse microscopy
Long-term time-lapse microscopy to monitor of ParB-GFP droplet dynamics was performed
on the same optical setup by continuously acquiring images at 50ms exposure time with a
561 nm readout laser (Sapphire 561LP 100mW Coherent) until complete photobleaching
FRAP
FRAP experiments on ParB-GFP droplets were conducted on a ZEISS LSM 800 by acquiring
318x318x5 (XYZ) images every 10 seconds with 106x106x230 nm 3 voxels exposed during
108 micros Data were acquired using Zen Black (Zeiss acquisition suite) The photo-bleaching of
ParB-GFP droplets was performed in circular regions with a diameter of 12 microm covering
single droplets in cells with exactly two droplets To be able to detect them and estimate
their intensity afterwards droplets were only partially photo-bleached (50 approximately)
To estimate photo-bleaching during fluorescence recovery fluorescent intensity was also
monitored in bacteria in which ParB-GFP droplets were not pre-bleached The resulting
z-stack images were then projected and analyzed
ParA degradation experiments
ParA degron experiments (DLT3469 strain) were conducted on an Eclipse TI-EB wide field
epifluorescence microscope with a phase contrast objective To quantify the number of
ParB-GFP droplets samples were prepared at different time points (t induction tinduction + 1h
tinduction + 2h tinduction + 3h and one night after induction of degradation) by harvesting cells
from the solution and snapshot images were acquired with an exposure time of 06 s
Page 21
certified by peer review) is the authorfunder All rights reserved No reuse allowed without permission The copyright holder for this preprint (which was notthis version posted May 4 2020 httpsdoiorg101101791368doi bioRxiv preprint
Images were then analysed using the MATLAB-based open-source software MicrobeTracker
and the SpotFinderZ tool ( Sliusarenko et al 2011) To monitor the dynamics of ParB-GFP
droplets images were acquired every 42 seconds
Data analysis
PALM
Localization of single molecules for PALM experiments was performed using 3D-DAOSTORM
(Babcock Sigal and Zhuang 2012) To discard poorly sampled clusters localization stitching
was used to select clusters with more than 10 ParB-mEos2 molecules Stitching was realized
by grouping together localizations appearing in successive frames or separated by up to 10
frames (to account for fluorescent blinking) and that were 50 nm apart Stitched
localizations were clustered using a voronoi-based cluster identification method (Levet et al
2015 Cattoni et al 2017) In total 990 clusters with an average of localizations 4 578 plusmn
(mean std) were analyzed (Figure S1C) To validate that chemical fixation did not alter the plusmn
localization of ParB droplets we measured the position of droplets in small cells as these
most often contained two droplets (Figure S1A) ParB-mEos2 droplets observed by PALM
displayed the typical localization pattern of ParB-GFP observed in live cells ie a preferential
localization near quarter positions along the cells main axis (Le Gall et al 2016)
3D isotropic reconstructions from single-molecule localizations
Super-resolved images were reconstructed and classified using our Single-Particle Analysis
method (Salas et al 2017) based on iterations of multi-reference alignment and multivariate
statistical analysis classification (van Heel Portugal and Schatz 2016) N = 990 clusters were
sorted into 50 class averages (Figure S1D) 51 (506990) of the total clusters fell into only
Page 22
certified by peer review) is the authorfunder All rights reserved No reuse allowed without permission The copyright holder for this preprint (which was notthis version posted May 4 2020 httpsdoiorg101101791368doi bioRxiv preprint
eight classes (Figure S1E) which were further analysed for particle reconstructions To
measure the size of the partition complex we reconstructed the three dimensional
structures of the eight most represented classes using the angular reconstitution method
(Van Heel 1987) and evaluated their Full-Width at Half Maximum (FWHM Figure S1F)
sptPALM
Single-molecules for sptPALM analysis were localized using MultipleTarget Tracking (MTT)
(Sergeacute et al 2008) Single ParB-mEos2 localizations were linked to single tracks if they
appeared in consecutive frames within a spatial window of 500nm To account for
fluorescent protein blinking or missed events fluorescence from single ParB-mEos2
molecules were allowed to disappear for a maximum of 3 frames Short tracks of less than
four detections were discarded from subsequent analysis The mean-squared displacement
(MSD) was computed as described in (Uphoff Sherratt and Kapanidis 2014) The apparent
diffusion coefficient was calculated from the MSD using the following equation
where SD (4 Δt)D = M t 7 msecΔ = 9
In all cases the distribution of apparent diffusion coefficients were satisfactorily
fitted by a two-Gaussian function These fits were used to define the proportions of low-
and high-mobility species present for wild-type and mutant strains Trajectories were then
classified as low- or high-mobility using a fixed threshold The value of the threshold was
optimized so that the number of trajectories in each species matched that obtained from
the two-Gaussian fit
Pairwise distances between ParB molecules were computed as described in (Stracy
et al 2015) First the tracks appearing in a spatio-temporal window of 50 nm and 67 frames
were linked together to correct for long-time fluorescence blinking of mEos2 that could lead
to biased results towards short distances Then the distances between the first localizations
Page 23
certified by peer review) is the authorfunder All rights reserved No reuse allowed without permission The copyright holder for this preprint (which was notthis version posted May 4 2020 httpsdoiorg101101791368doi bioRxiv preprint
of each trajectory were computed Finally these distances were normalized by a
homogeneous distribution obtained from simulating random distributions of 500 emitters in
a 1 microm by 05 microm nucleoid space The threshold to define the shaded region in Fig 2C
(200nm) was obtained from the value in the x-axis where the pair correlation surpassed 1
This value is considerably larger than the size of a ParB condensate measured in fixed cells
(Figure 1) because the partition complex moves during acquisition in live sptPALM
experiments leading to an effective confinement region of ~150-200 nm (Sanchez et al
2015)
FRAP
ParB-GFP droplets from FRAP experiments were tracked using 3D-DAOSTORM (Babcock
Sigal and Zhuang 2012) The fluorescence intensity of each ParB-GFP droplet was computed
by integrating the intensity of a 318nm x 318nm region (3x3 pixels) centered on the centroid
of the focus The trace in Figure 2E was built by averaging the time-dependent fluorescent
decayincrease curves from photo-bleachedunbleached ParB-GFP droplets Each curve was
first normalized by the initial droplet intensity estimated by the average intensity in the
three images prior to photo-bleaching To estimate and correct for natural photo-bleaching
we used bacteria present on the same fields of view but whose ParB-GFP droplet had not
been photo-bleached
Calculation of ParB concentrations
The concentration of ParB molecules per partition complex was calculated as follows The
total number of ParB dimers per cell is estimated at ~850 dimers with 95 of them residing
within a partition complex (Figure 1B) Therefore there are in average N = 85035095 =
231 dimers per partition complex given that there are ~35 partition complexes per cell in
average The volume of a partition complex can be estimated as V = 43Pirsup3=41610^20
Page 24
certified by peer review) is the authorfunder All rights reserved No reuse allowed without permission The copyright holder for this preprint (which was notthis version posted May 4 2020 httpsdoiorg101101791368doi bioRxiv preprint
liters with r being the mean radius of a partition complex (r = 215 nm) Thus the
concentration of ParB in a partition complex is estimated as C = NNaV = 92 mM with Na
being Avogadrorsquos number
Bacterial strains and plasmids
E coli strains and plasmids are listed in Tables S1-S2 Cultures were grown at 37degC
with aeration in LB (Miller 1972) containing thymine (10 microgml -1) and antibiotics as
appropriate chloramphenicol (10 microgml -1) kanamycin (50 microgml -1) For microscopy and
stability assays cultures were grown at 30degC with aeration in MGC (M9 minimal medium
supplemented with 04 glucose (glycerol or maltose for microscopy assays) 02
casamino acids 1 mM MgSO 4 01 mM CaCl 2 1 microgml -1 thiamine 20 microgml -1 leucine and 40
microgml -1 thymine)
DLT3298 ( sspBkan) was constructed by P1 transduction from strain JW3197 (Baba
et al 2006) The excision of the FRT-kan-FRT selection cassette from strains DLT3053 and
DLT3298 was performed using the pCP20 plasmid (Datsenko and Wanner 2000) The sspB
gene under the control of the arabinose-inducible PBAD promoter was introduced in DLT3299
by P1 transduction from strain SM997 resulting in DLT3401 (∆sspB PBAD -sspB kan) The
mini-F pCMD6 carrying parA F-mVenus-ssrA AEAS was introduced by transformation in DLT3401
to generate DLT3469 The induction was performed with 02 arabinose
The mini-F plasmids expressing the fluorescently tagged Par proteins are derivatives
of the wild-type mini-F pDAG114 The double ParB mutant K191A-R195A was generated by
Quikchange mutagenesis from pJYB212 The plasmid pJYB240 was generated from pJYB212
by exchanging the mEos2 open reading frame by a PCR-amplified mTurquoise2 DNA
(Goedhart et al 2012) using the InFusion kit (Clontech) The parBF - mTurquoise2 gene from
pJYB240 was introduced into pJYB243 using MfeI and SpeI restriction enzymes to give
Page 25
certified by peer review) is the authorfunder All rights reserved No reuse allowed without permission The copyright holder for this preprint (which was notthis version posted May 4 2020 httpsdoiorg101101791368doi bioRxiv preprint
pJYB249 A SsrA tag (SsrA AEAS AANDENYSENYAEAS) to specifically induce the degradation of
ParAF was introduced in frame after the last codon of ParA generating pCMD6 The ssrAAEAS
sequence carries the wild-type co-translational signals between parAF and parB F All plasmid
constructs were verified by DNA sequencing (Eurofins)
Table S1 Strains list
(all strains used are derivatives of E coli K12)
DLT1215 F ndash thi leu thyA deoB supE rpsL Δ(ara-leu) zac3051Tn10
(Bouet Bouvier and Lane 2006)
DLT2887 DLT1215 pJYB212 This work Figures 1B 1C 1D 2A 2B 2C
DLT3053 DLT1215 Hu-mCherry FRT-Kan-FRT (Le Gall et al 2016)
DLT3289 DLT1215 Hu-mCherry This work
DLT3264 DLT1215 pJYB216 This work Figures 3B 3C 3D
DLT3298 DLT3289 sspBkan This work
DLT3299 DLT3289 ∆sspB This work
DLT3401 DLT3299 nocus-PBAD -sspB kan This work
DLT3469 DLT3401 pCMD6 This work Figures 4B 4C 4D 4E 4F
DLT3851 DLT1215 pJYB213 This work Figures 2D 2E 2F 4A
DLT3997 DLT1215pJYB224 This work Figures 3D S2C
JW3197 BW25113 sspBkan Keio collection (Baba et al 2006)
SM997 sspBcat nocus-PBAD -sspB kan Gift from C Lesterlin
Page 26
certified by peer review) is the authorfunder All rights reserved No reuse allowed without permission The copyright holder for this preprint (which was notthis version posted May 4 2020 httpsdoiorg101101791368doi bioRxiv preprint
Table S2 Plasmids list
pCMD6 pJYB249 parA F -mVenus-ssrAAEAS parBF -mTurquoise2 This work
pDAG114
mini-F repFIA+ parABS F + ccdB - resD+ rsfF + cat+ (Lemonnier et al 2000)
pJYB212 pDAG114 parB F -mEos2 (Sanchez et al 2015)
pJYB213 pDAG114 parBF -eGfp (Sanchez et al 2015)
pJYB216 pJYB212 ∆parS (Sanchez et al 2015)
pJYB240 pDAG114 parBF -mTurquoise2 This work
pJYB243 pDAG114 parAF -mVenus (Sanchez et al 2015)
pJYB249 pDAG114 parAF -mVenus parB F -mTurquoise2 This work
pJYB224 parBF _K191A_R195A-mEos2 This work
Key resources table
Reagent or resource Source Identifier
Deposited Data doi1017632c3gymp7vbn1 Experimental data types
Page 27
certified by peer review) is the authorfunder All rights reserved No reuse allowed without permission The copyright holder for this preprint (which was notthis version posted May 4 2020 httpsdoiorg101101791368doi bioRxiv preprint
References
Adachi Shun Kotaro Hori and Sota Hiraga 2006 ldquoSubcellular Positioning of F Plasmid Mediated by Dynamic Localization of SopA and SopBrdquo Journal of Molecular Biology 356 (4) 850ndash63
Ah-Seng Yoan Frederic Lopez Franck Pasta David Lane and Jean-Yves Bouet 2009 ldquoDual Role of DNA in Regulating ATP Hydrolysis by the SopA Partition Proteinrdquo The Journal of Biological Chemistry 284 (44) 30067ndash75
Ah-Seng Yoan Jeacuterocircme Rech David Lane and Jean-Yves Bouet 2013 ldquoDefining the Role of ATP Hydrolysis in Mitotic Segregation of Bacterial Plasmidsrdquo PLoS Genetics 9 (12) e1003956
Al-Husini Nadra Dylan T Tomares Obaidah Bitar W Seth Childers and Jared M Schrader 2018 ldquoα-Proteobacterial RNA Degradosomes Assemble Liquid-Liquid Phase-Separated RNP Bodiesrdquo Molecular Cell 71 (6) 1027ndash39e14
Baba Tomoya Takeshi Ara Miki Hasegawa Yuki Takai Yoshiko Okumura Miki Baba Kirill A Datsenko Masaru Tomita Barry L Wanner and Hirotada Mori 2006 ldquoConstruction of Escherichia Coli K-12 In-frame Single-gene Knockout Mutants The Keio Collectionrdquo Molecular Systems Biology 2 (1) 20060008
Babcock Hazen Yaron M Sigal and Xiaowei Zhuang 2012 ldquoA High-Density 3D Localization Algorithm for Stochastic Optical Reconstruction Microscopyrdquo Optical Nanoscopy 1 (6) httpsdoiorg1011862192-2853-1-6
Banani Salman F Hyun O Lee Anthony A Hyman and Michael K Rosen 2017 ldquoBiomolecular Condensates Organizers of Cellular Biochemistryrdquo Nature Reviews Molecular Cell Biology 18 (5) 285ndash98
Baxter Jamie C and Barbara E Funnell 2014 ldquoPlasmid Partition Mechanismsrdquo Microbiology Spectrum 2 (6) httpsdoiorg 101128microbiolspecPLAS-0023-2014
Binney J J N J Dowrick A J Fisher and M E J Newman 1992 The Theory of Critical Phenomena An Introduction to the Renormalization Group Oxford University Press
Bouet Jean-Yves Marie Bouvier and David Lane 2006 ldquoConcerted Action of Plasmid Maintenance Functions Partition Complexes Create a Requirement for Dimer Resolutionrdquo Molecular Microbiology 62 (5) 1447ndash59
Bouet Jean-Yves Jeacuterocircme Rech Sylvain Egloff Donald P Biek and David Lane 2005 ldquoProbing Plasmid Partition with Centromere-Based Incompatibilityrdquo Molecular Microbiology 55 (2) 511ndash25
Bouet Jean-Yves Mathieu Stouf Elise Lebailly and Franccedilois Cornet 2014 ldquoMechanisms for Chromosome Segregationrdquo Current Opinion in Microbiology 22 (December) 60ndash65
Brangwynne Clifford P 2011 ldquoSoft Active Aggregates Mechanics Dynamics and Self-Assembly of Liquid-like Intracellular Protein Bodiesrdquo Soft Matter 7 (7) 3052ndash59
Brangwynne Clifford P Christian R Eckmann David S Courson Agata Rybarska Carsten Hoege Joumlbin Gharakhani Frank Juumllicher and Anthony A Hyman 2009 ldquoGermline P Granules Are Liquid Droplets That Localize by Controlled Dissolutioncondensationrdquo Science 324 (5935) 1729ndash32
Broedersz Chase P Xindan Wang Yigal Meir Joseph J Loparo David Z Rudner and Ned S Wingreen 2014 ldquoCondensation and Localization of the Partitioning Protein ParB on the Bacterial Chromosomerdquo Proceedings of the National Academy of Sciences of the United States of America 111 (24) 8809ndash14
Page 28
certified by peer review) is the authorfunder All rights reserved No reuse allowed without permission The copyright holder for this preprint (which was notthis version posted May 4 2020 httpsdoiorg101101791368doi bioRxiv preprint
Cattoni Diego I Andreacutes M Cardozo Gizzi Mariya Georgieva Marco Di Stefano Alessandro Valeri Delphine Chamousset Christophe Houbron et al 2017 ldquoSingle-Cell Absolute Contact Probability Detection Reveals Chromosomes Are Organized by Multiple Low-Frequency yet Specific Interactionsrdquo Nature Communications 8 (1) 1753
Datsenko K A and B L Wanner 2000 ldquoOne-Step Inactivation of Chromosomal Genes in Escherichia Coli K-12 Using PCR Productsrdquo Proceedings of the National Academy of Sciences of the United States of America 97 (12) 6640ndash45
David G J -C Walter C P Broedersz J Dorignac F Geniet A Parmeggiani N -O Walliser and J Palmeri 2018 ldquoPhase Separation of Polymer-Bound Particles Induced by Loop-Mediated 1D Effective Long-Range Interactionsrdquo arXiv Preprint arXiv181109234 arXiv httparxivorgabs181109234
Debaugny Roxanne E Aurore Sanchez Jeacuterocircme Rech Delphine Labourdette Jeacuterocircme Dorignac Freacutedeacuteric Geniet John Palmeri et al 2018 ldquoA Conserved Mechanism Drives Partition Complex Assembly on Bacterial Chromosomes and Plasmidsrdquo Molecular Systems Biology 14 (11) e8516
Elowitz M B M G Surette P E Wolf J B Stock and S Leibler 1999 ldquoProtein Mobility in the Cytoplasm of Escherichia Colirdquo Journal of Bacteriology 181 (1) 197ndash203
Erdmann N T Petroff and B E Funnell 1999 ldquoIntracellular Localization of P1 ParB Protein Depends on ParA and parSrdquo Proceedings of the National Academy of Sciences of the United States of America 96 (26) 14905ndash10
Faure Laura M Jean-Bernard Fiche Leon Espinosa Adrien Ducret Vivek Anantharaman Jennifer Luciano Seacutebastien Lhospice et al 2016 ldquoThe Mechanism of Force Transmission at Bacterial Focal Adhesion Complexesrdquo Nature October httpsdoiorg101038nature20121
Fiche Jean-Bernard Diego I Cattoni Nele Diekmann Julio Mateos Langerak Caroline Clerte Catherine A Royer Emmanuel Margeat Thierry Doan and Marcelo Nollmann 2013 ldquoRecruitment Assembly and Molecular Architecture of the SpoIIIE DNA Pump Revealed by Superresolution Microscopyrdquo PLoS Biology 11 (5) e1001557
Fisher Gemma Lm Ceacutesar L Pastrana Victoria A Higman Alan Koh James A Taylor Annika Butterer Timothy Craggs et al 2017 ldquoThe Structural Basis for Dynamic DNA Binding and Bridging Interactions Which Condense the Bacterial Centromererdquo eLife 6 (December) httpsdoiorg 107554eLife28086
Garcia-Jove Navarro Marina Shunnichi Kashida Racha Chouaib Sylvie Souquere Geacuterard Pierron Dominique Weil and Zoher Gueroui 2019 ldquoRNA Is a Critical Element for the Sizing and the Composition of Phase-Separated RNA-Protein Condensatesrdquo Nature Communications 10 (1) 3230
Garza de Leon Federico Laura Sellars Mathew Stracy Stephen J W Busby and Achillefs N Kapanidis 2017 ldquoTracking Low-Copy Transcription Factors in Living Bacteria The Case of the Lac Repressorrdquo Biophysical Journal 112 (7) 1316ndash27
Gijtenbeek Lieke A van Andrew Robinson Antoine M van Oijen Bert Poolman and Jan Kok 2016 ldquoOn the Spatial Organization of mRNA Plasmids and Ribosomes in a Bacterial Host Overexpressing Membrane Proteinsrdquo PLoS Genetics 12 (12) e1006523
Goedhart Joachim David von Stetten Marjolaine Noirclerc-Savoye Mickaeumll Lelimousin Linda Joosen Mark A Hink Laura van Weeren Theodorus W J Gadella Jr and Antoine Royant 2012 ldquoStructure-Guided Evolution of Cyan Fluorescent Proteins towards a Quantum Yield of 93rdquo Nature Communications 3 (March) 751
Graham Thomas G W Xindan Wang Dan Song Candice M Etson Antoine M van Oijen David Z Rudner and Joseph J Loparo 2014 ldquoParB Spreading Requires DNA Bridgingrdquo
Page 29
certified by peer review) is the authorfunder All rights reserved No reuse allowed without permission The copyright holder for this preprint (which was notthis version posted May 4 2020 httpsdoiorg101101791368doi bioRxiv preprint
Genes amp Development 28 (11) 1228ndash38 Heel Marin van Rodrigo V Portugal and Michael Schatz 2016 ldquoMultivariate Statistical
Analysis of Large Datasets Single Particle Electron Microscopyrdquo Open Journal of Statistics httpsdoiorg 104236ojs201664059
Hyman Anthony A Christoph A Weber and Frank Juumllicher 2014 ldquoLiquid-Liquid Phase Separation in Biologyrdquo Annual Review of Cell and Developmental Biology 30 39ndash58
Jain Saumya Joshua R Wheeler Robert W Walters Anurag Agrawal Anthony Barsic and Roy Parker 2016 ldquoATPase-Modulated Stress Granules Contain a Diverse Proteome and Substructurerdquo Cell 164 (3) 487ndash98
Le Gall Antoine Diego I Cattoni Baptiste Guilhas Ceacuteline Mathieu-Demaziegravere Laura Oudjedi Jean-Bernard Fiche Jeacuterocircme Rech et al 2016 ldquoBacterial Partition Complexes Segregate within the Volume of the Nucleoidrdquo Nature Communications 7 (July) 12107
Le Gall Antoine Diego I Cattoni and Marcelo Nollmann 2017 ldquoImaging of Bacterial Chromosome Organization by 3D Super-Resolution Microscopyrdquo Methods in Molecular Biology 1624 253ndash68
Lemonnier M J Y Bouet V Libante and D Lane 2000 ldquoDisruption of the F Plasmid Partition Complex in Vivo by Partition Protein SopArdquo Molecular Microbiology 38 (3) 493ndash505
Levet Florian Eric Hosy Adel Kechkar Corey Butler Anne Beghin Daniel Choquet and Jean-Baptiste Sibarita 2015 ldquoSR-Tesseler A Method to Segment and Quantify Localization-Based Super-Resolution Microscopy Datardquo Nature Methods 12 (11) 1065ndash71
MacCready Joshua S Joseph L Basalla and Anthony G Vecchiarelli 2020 ldquoOrigin and Evolution of Carboxysome Positioning Systems in Cyanobacteriardquo Molecular Biology and Evolution January httpsdoiorg 101093molbevmsz308
Manley Suliana Jennifer M Gillette George H Patterson Hari Shroff Harald F Hess Eric Betzig and Jennifer Lippincott-Schwartz 2008 ldquoHigh-Density Mapping of Single-Molecule Trajectories with Photoactivated Localization Microscopyrdquo Nature Methods 5 (2) 155ndash57
Marbouty Martial Antoine Le Gall Diego I Cattoni Axel Cournac Alan Koh Jean-Bernard Fiche Julien Mozziconacci Heath Murray Romain Koszul and Marcelo Nollmann 2015 ldquoCondensin- and Replication-Mediated Bacterial Chromosome Folding and Origin Condensation Revealed by Hi-C and Super-Resolution Imagingrdquo Molecular Cell 59 (4) 588ndash602
McGinness Kathleen E Tania A Baker and Robert T Sauer 2006 ldquoEngineering Controllable Protein Degradationrdquo Molecular Cell 22 (5) 701ndash7
Moffitt Jeffrey R Shristi Pandey Alistair N Boettiger Siyuan Wang and Xiaowei Zhuang 2016 ldquoSpatial Organization Shapes the Turnover of a Bacterial Transcriptomerdquo eLife 5 (May) httpsdoiorg 107554eLife13065
Monterroso Begontildea Silvia Zorrilla Marta Sobrinos-Sanguino Miguel A Robles-Ramos Marina Loacutepez-Aacutelvarez William Margolin Christine D Keating and Germaacuten Rivas 2019 ldquoBacterial FtsZ Protein Forms Phase-Separated Condensates with Its Nucleoid-Associated Inhibitor SlmArdquo EMBO Reports 20 (1) httpsdoiorg1015252embr201845946
Murray Heath Henrique Ferreira and Jeff Errington 2006 ldquoThe Bacterial Chromosome Segregation Protein Spo0J Spreads along DNA from parS Nucleation Sitesrdquo Molecular Microbiology 61 (5) 1352ndash61
Niu Lili and Ji Yu 2008 ldquoInvestigating Intracellular Dynamics of FtsZ Cytoskeleton with
Page 30
certified by peer review) is the authorfunder All rights reserved No reuse allowed without permission The copyright holder for this preprint (which was notthis version posted May 4 2020 httpsdoiorg101101791368doi bioRxiv preprint
Photoactivation Single-Molecule Trackingrdquo Biophysical Journal 95 (4) 2009ndash16 Normanno Davide Lydia Boudaregravene Claire Dugast-Darzacq Jiji Chen Christian Richter
Florence Proux Olivier Beacutenichou Raphaeumll Voituriez Xavier Darzacq and Maxime Dahan 2015 ldquoProbing the Target Search of DNA-Binding Proteins in Mammalian Cells Using TetR as Model Searcherrdquo Nature Communications httpsdoiorg101038ncomms8357
Pillet Flavien Aurore Sanchez David Lane Veacuteronique Anton Leberre and Jean-Yves Bouet 2011 ldquoCentromere Binding Specificity in Assembly of the F Plasmid Partition Complexrdquo Nucleic Acids Research httpsdoiorg 101093nargkr457
Racki Lisa R Elitza I Tocheva Michael G Dieterle Meaghan C Sullivan Grant J Jensen and Dianne K Newman 2017 ldquoPolyphosphate Granule Biogenesis Is Temporally and Functionally Tied to Cell Cycle Exit during Starvation in Pseudomonas Aeruginosardquo Proceedings of the National Academy of Sciences of the United States of America 114 (12) E2440ndash49
Ramamurthi Kumaran S and Richard Losick 2009 ldquoNegative Membrane Curvature as a Cue for Subcellular Localization of a Bacterial Proteinrdquo Proceedings of the National Academy of Sciences of the United States of America 106 (32) 13541ndash45
Rodionov O M Lobocka and M Yarmolinsky 1999 ldquoSilencing of Genes Flanking the P1 Plasmid Centromererdquo Science 283 (5401) 546ndash49
Salas Desireacutee Antoine Le Gall Jean-Bernard Fiche Alessandro Valeri Yonggang Ke Patrick Bron Gaetan Bellot and Marcelo Nollmann 2017 ldquoAngular Reconstitution-Based 3D Reconstructions of Nanomolecular Structures from Superresolution Light-Microscopy Imagesrdquo Proceedings of the National Academy of Sciences of the United States of America August httpsdoiorg 101073pnas1704908114
Sanamrad Arash Fredrik Persson Ebba G Lundius David Fange Arvid H Gynnaring and Johan Elf 2014 ldquoSingle-Particle Tracking Reveals That Free Ribosomal Subunits Are Not Excluded from the Escherichia Coli Nucleoidrdquo Proceedings of the National Academy of Sciences of the United States of America 111 (31) 11413ndash18
Sanchez Aurore Diego I Cattoni Jean-Charles Walter Jeacuterocircme Rech Andrea Parmeggiani Marcelo Nollmann and Jean-Yves Bouet 2015 ldquoStochastic Self-Assembly of ParB Proteins Builds the Bacterial DNA Segregation Apparatusrdquo Cell Systems 1 (2) 163ndash73
Sanchez Aurore Jeacuterocircme Rech Cyrielle Gasc and Jean-Yves Bouet 2013 ldquoInsight into Centromere-Binding Properties of ParB Proteins A Secondary Binding Motif Is Essential for Bacterial Genome Maintenancerdquo Nucleic Acids Research 41 (5) 3094ndash3103
Schumacher Maria A Nam K Tonthat Jeehyun Lee Fernando A Rodriguez-Castantildeeda Naga Babu Chinnam Anne K Kalliomaa-Sanford Irene W Ng Madhuri T Barge Porsha L R Shaw and Daniela Barillagrave 2015 ldquoStructures of Archaeal DNA Segregation Machinery Reveal Bacterial and Eukaryotic Linkagesrdquo Science 349 (6252) 1120ndash24
Sengupta Manjistha Henrik Jorck Nielsen Brenda Youngren and Stuart Austin 2010 ldquoP1 Plasmid Segregation Accurate Redistribution by Dynamic Plasmid Pairing and Separationrdquo Journal of Bacteriology 192 (5) 1175ndash83
Sergeacute Arnauld Nicolas Bertaux Herveacute Rigneault and Didier Marguet 2008 ldquoDynamic Multiple-Target Tracing to Probe Spatiotemporal Cartography of Cell Membranesrdquo Nature Methods 5 (8) 687ndash94
Shapiro L H H McAdams and R Losick 2009 ldquoWhy and How Bacteria Localize Proteinsrdquo Science 326 (5957) 1225ndash28
Shin Yongdae and Clifford P Brangwynne 2017 ldquoLiquid Phase Condensation in Cell Physiology and Diseaserdquo Science 357 (6357) httpsdoiorg 101126scienceaaf4382
Page 31
certified by peer review) is the authorfunder All rights reserved No reuse allowed without permission The copyright holder for this preprint (which was notthis version posted May 4 2020 httpsdoiorg101101791368doi bioRxiv preprint
Soumlding Johannes David Zwicker Salma Sohrabi-Jahromi Marc Boehning and Jan Kirschbaum 2019 ldquoMechanisms of Active Regulation of Biomolecular Condensatesrdquo Cell Biology bioRxiv
Stracy Mathew Marcin Jaciuk Stephan Uphoff Achillefs N Kapanidis Marcin Nowotny David J Sherratt and Pawel Zawadzki 2016 ldquoSingle-Molecule Imaging of UvrA and UvrB Recruitment to DNA Lesions in Living Escherichia Colirdquo Nature Communications 7 (August) 12568
Stracy Mathew and Achillefs N Kapanidis 2017 ldquoSingle-Molecule and Super-Resolution Imaging of Transcription in Living Bacteriardquo Methods httpsdoiorg101016jymeth201704001
Stracy Mathew Christian Lesterlin Federico Garza de Leon Stephan Uphoff Pawel Zawadzki and Achillefs N Kapanidis 2015 ldquoLive-Cell Superresolution Microscopy Reveals the Organization of RNA Polymerase in the Bacterial Nucleoidrdquo Proceedings of the National Academy of Sciences of the United States of America 112 (32) E4390ndash99
Strom Amy R Alexander V Emelyanov Mustafa Mir Dmitry V Fyodorov Xavier Darzacq and Gary H Karpen 2017 ldquoPhase Separation Drives Heterochromatin Domain Formationrdquo Nature httpsdoiorg101038nature22989
Surovtsev Ivan V and Christine Jacobs-Wagner 2018 ldquoSubcellular Organization A Critical Feature of Bacterial Cell Replicationrdquo Cell 172 (6) 1271ndash93
Taylor James A Cesar L Pastrana Annika Butterer Christian Pernstich Emma J Gwynn Frank Sobott Fernando Moreno-Herrero and Mark S Dillingham 2015 ldquoSpecific and Non-Specific Interactions of ParB with DNA Implications for Chromosome Segregationrdquo Nucleic Acids Research January httpsdoiorg101093nargku1295
Thrall Elizabeth S James E Kath Seungwoo Chang and Joseph J Loparo 2017 ldquoSingle-Molecule Imaging Reveals Multiple Pathways for the Recruitment of Translesion Polymerases after DNA Damagerdquo Nature Communications 8 (1) 2170
Toro Esteban and Lucy Shapiro 2010 ldquoBacterial Chromosome Organization and Segregationrdquo Cold Spring Harbor Perspectives in Biology 2 (2) a000349
Uphoff Stephan David J Sherratt and Achillefs N Kapanidis 2014 ldquoVisualizing Protein-DNA Interactions in Live Bacterial Cells Using Photoactivated Single-Molecule Trackingrdquo Journal of Visualized Experiments JoVE no 85 (March) httpsdoiorg10379151177
Van Heel M 1987 ldquoAngular Reconstitution A Posteriori Assignment of Projection Directions for 3D Reconstructionrdquo Ultramicroscopy 21 (2) 111ndash23
Visser Bryan J Mohan C Joshi and David Bates 2017 ldquoMultilocus Imaging of the E Coli Chromosome by Fluorescent In Situ Hybridizationrdquo Methods in Molecular Biology 1624 213ndash26
Walter J C and G T Barkema 2015 ldquoAn Introduction to Monte Carlo Methodsrdquo Physica A Statistical Mechanics and Its Applications httpswwwsciencedirectcomsciencearticlepiiS0378437114004798
Wang H X Yan H Aigner A Bracher N D Nguyen W Y Hee B M Long G D Price F U Hartl and M Hayer-Hartl 2019 ldquoRubisco Condensate Formation by CcmM in β-Carboxysome Biogenesisrdquo Nature 566 (7742) 131ndash35
Zawadzki Pawel Mathew Stracy Katarzyna Ginda Katarzyna Zawadzka Christian Lesterlin Achillefs N Kapanidis and David J Sherratt 2015 ldquoThe Localization and Action of Topoisomerase IV in Escherichia Coli Chromosome Segregation Is Coordinated by the SMC Complex MukBEFrdquo Cell Reports 13 (11) 2587ndash96
Zheng J and R D Hryciw 2015 ldquoTraditional Soil Particle Sphericity Roundness and
Page 32
certified by peer review) is the authorfunder All rights reserved No reuse allowed without permission The copyright holder for this preprint (which was notthis version posted May 4 2020 httpsdoiorg101101791368doi bioRxiv preprint
Surface Roughness by Computational Geometryrdquo Geacuteotechnique httpsdoiorg101680geot14p192
Zwicker David Markus Decker Steffen Jaensch Anthony A Hyman and Frank Juumllicher 2014 ldquoCentrosomes Are Autocatalytic Droplets of Pericentriolar Material Organized by Centriolesrdquo Proceedings of the National Academy of Sciences of the United States of America 111 (26) E2636ndash45
Zwicker David Anthony A Hyman and Frank Juumllicher 2015 ldquoSuppression of Ostwald Ripening in Active Emulsionsrdquo Physical Review E Statistical Nonlinear and Soft Matter Physics 92 (1) 012317
Zwicker David Rabea Seyboldt Christoph A Weber Anthony A Hyman and Frank Juumllicher 2016 ldquoGrowth and Division of Active Droplets Provides a Model for Protocellsrdquo Nature Physics 13 (December) 408
Page 33
certified by peer review) is the authorfunder All rights reserved No reuse allowed without permission The copyright holder for this preprint (which was notthis version posted May 4 2020 httpsdoiorg101101791368doi bioRxiv preprint
Figures
Figure 1 ParB is confined into spherical nano-condensates (A) Schematic representation of a ParB partition complex (red circle) ParB is represented by blue spheres the centromeric parS sequence by a red line and non-specific DNA (plasmid and bacterial chromosome) is represented by a grey curved line Three types of interactions have been reported ParB- parS (high affinity 2 nM) ParB-non-specific DNA (low affinity 03-05 microM for DNA fragments of 120-150bp) and ParB-ParB dimer (low affinity 03-1 microM) (Ah-Seng et al 2009 Sanchez et al 2015 Taylor et al 2015) (B) Partition complexes (N=990) were visualized by either widefield microscopy (first panel) or by PALM (second and third panels for raw localizations and reconstruction representations respectively) Magnified views of the two partition complexes are shown for clarity (panel 3) Panel 4 displays representative ParB partition complex reconstructions from other cells to exemplify the heterogeneity in shapes (C) Super-resolved images of ParB partition complexes were classified using single-particle analysis to overcome heterogeneity between single complexes ParB complexes of the most populated classes exhibited spherical shapes (D) A three-dimensional reconstruction of the ParB partition complex was obtained using the most populated classes Diameter was estimated by calculating the full width at half maximum Colors represent reconstruction density (highred lowblue) outer shell is represented in shaded red Right panel schematic representation of the ParB partition complex and estimation of ParB concentration based on the size of the complex and the number of ParB molecules measured experimentally (see Results and Methods) Measurements were performed in different biological replicates
Page 34
certified by peer review) is the authorfunder All rights reserved No reuse allowed without permission The copyright holder for this preprint (which was notthis version posted May 4 2020 httpsdoiorg101101791368doi bioRxiv preprint
Figure 2 Dynamic properties of ParB condensates (A) Representative image of a live cell (cell contour schematized in white) and trajectories of single ParB molecules (low-mobility blue high-mobility red) Right panels show magnified views of each ParB condensate with different low-mobility trajectories shown with different colors The slight spatial shifts between trajectories reflect partition complex movement during acquisition (Sanchez et al 2015) (B) Histogram of apparent diffusion coefficients for low- (blue) and high-mobility (red) trajectories n=156 (number of cells) N = 3205 tracks (C) Pairwise distance analysis of low-mobility trajectories Expectation for a homogeneous distribution is shown as a horizontal dashed line Right panels schematic representations of ParB proteins within (top) and outside (bottom) ParB condensates the grey matrix represents the DNA substrate n=156 (number of cells) (D) Representative example of a Fluorescence Recovery After Photobleaching experiment A single ParB-GFP condensate (red circle) was photobleached in a cell containing two condensates (E) The average intensity of photobleached ParB condensates (orange) increased over time with a concomitant and symmetric decrease in the fluorescence intensity of the unbleached condensate (green) This requires single ParB proteins to exchange between liquid and gas-like phases (right panel) Grayed shade represents standard error of the mean Dashed lines represent the behavior predicted from modeling in Figure S2 n=146 (number of cells) (F) Representative example of a fast time-lapse fluorescence movie Four ParB condensates can be seen to fluctuate and fuse during the movie (white line) Schematic representation of a fusion event is shown in the right panel Measurements were performed in different biological replicates (ngt14 fusion events) In panels A D and F solid white lines are used to represent cell contours
Page 35
certified by peer review) is the authorfunder All rights reserved No reuse allowed without permission The copyright holder for this preprint (which was notthis version posted May 4 2020 httpsdoiorg101101791368doi bioRxiv preprint
Figure 3 Centromeric sequences and ParB-ParB interactions are required for the nucleation and stability of ParB condensates (A) The movement of three hundred ParB dimers (grey disks) within a simulated cell was governed by free diffusion (1 micromsup2s) weak ParB-ParB dimer interactions (J=45 kT) high-affinity ParB- parS interactions and low-affinity interactions with the lattice Regardless of initial conditions ParB dimers formed a condensate in the presence of parS10 (gray blue) In contrast no condensate is formed in the absence of a nucleation sequence (green) Schematic representations are used to show the initial and final configurations (left and right panels) For simplicity parS+ refers to a simulation with parS10 (B) Representative single-molecule tracking experiment of ParB in absence of parS Low-mobility trajectories are shown in blue and high-mobility trajectories in red while the cell contour is schematized as a white line (C) Distribution of apparent diffusion coefficients for low-mobility (blue 50) and high-mobility trajectories (red 50) The distribution for a wild-type strain containing parS (same data as in Figure 2B) is shown as a dashed grey line for comparison n=209 (number of cells) (D) Pairwise distance analysis of low-mobility trajectories in absence of parS (green curve) in a ParB mutant impaired for parS binding (cyan curve) and in a ParB-ParB interaction mutant (blue curve) The expected curve for a homogeneous distribution is shown as a horizontal dashed line The distribution for a wild-type strain containing parS is shown as a dashed grey line for comparison (same data as in Figure 2C) Schematic representations of single-molecule ParB trajectories in the absence (top) and presence of parS (bottom) are shown in the panels on the right n=209 (number of cells) Measurements were performed in different biological replicates
Page 36
certified by peer review) is the authorfunder All rights reserved No reuse allowed without permission The copyright holder for this preprint (which was notthis version posted May 4 2020 httpsdoiorg101101791368doi bioRxiv preprint
Figure 4 The ParA ATPase is required for ParB condensates to remain stably separated during cell-cycle times (A) Representative kymograph displaying the trajectories of ParB condensates over cell-cycle times (white lines) Splitting of condensates is shown by red forks The fluorescence images of ParB condensates at three different times as well as the cell schematized outlines are shown for simplicity (B) Genetic construct used for the targeted degradation of ParA (C) Time course Western blot of ParA and ParB upon induction of ParA-ssra degradation Degradation time course was detected in two different gels using anti-ParA and anti-ParB antibodies (D) Representative time lapse experiment of a ParA-ssra strain without induction of ParA degradation Trajectories of ParB condensates (white dashed line) and a splitting event (white fork) are shown Scalebar represents fluorescence intensity Right panel schematic representation of a splitting event in the presence of ParA (E) Representative time lapse experiment of a ParA-ssrA strain upon induction of ParA-ssra degradation Dashed lines represent the trajectories of two ParB condensates A fork displays a fusion event between two ParB condensates Right panel schematic representation of this process Note that time scales in this assay are different from those in Figure 2D (see explanation in Figure S4) (F) Quantification of the average number of ParB condensates per cell in a ParA-ssra strain with (red circles) or without (blue circles) ParA degradation The induction of ParA degradation was initiated at time 0 Shaded areas represent standard deviation Note that the slight decrease in foci number (~20) without ParA degradation after overnight (ON) culture corresponds to the decrease in cell length (~20) (see Figure S4A) Numbers of cells are shown above plot Measurements were performed in different biological replicates Bottom panels Localization density histograms of ParB condensates along the cell longitudinal axis before (top) and 3 hours after inducing ParA degradation (bottom) (G) Distribution in the number of ParB partition complexes in wild-type versus ParA
Page 37
certified by peer review) is the authorfunder All rights reserved No reuse allowed without permission The copyright holder for this preprint (which was notthis version posted May 4 2020 httpsdoiorg101101791368doi bioRxiv preprint
ATPase deficient cells (ParA_K120Q) The mean number of partition complexes in wild-type cells grown in LB was 30plusmn11 (N = 105 cells) versus 18plusmn09 in the ParA ATPase mutant strain (N = 124 cells) Insets show examples of segmented cells (black) with ParB partition complexes (green) Scale bar is 1microm
Page 38
certified by peer review) is the authorfunder All rights reserved No reuse allowed without permission The copyright holder for this preprint (which was notthis version posted May 4 2020 httpsdoiorg101101791368doi bioRxiv preprint
Supplementary Figures
Figure S1
S1A To control for fixation artifacts we built the histogram of localization of ParB clusters along the main axis of the cell ParB clusters in fixed cells were localized near the quarter positions of the cell axis mirroring the localization pattern of partition complexes from live experiments (Le Gall et al 2016) Only clusters of small cells with a length of less than 27 microm were selected to avoid cells with more than 2 ParB complexes that would confound the overall localization pattern N=990 (number of clusters) S1B Histogram of the standard deviations of the localization positions from single molecules The mean of the standard deviation of localization which provides an estimate of the localization precision is (mean std) N=990 (number of clusters)4 6 nm 1 plusmn plusmn S1C Histogram of single ParB-mEos2 localizations per cluster The average number of localizations per cluster is (mean std) N=990 (number of clusters)4 578 plusmn plusmn
Page 39
certified by peer review) is the authorfunder All rights reserved No reuse allowed without permission The copyright holder for this preprint (which was notthis version posted May 4 2020 httpsdoiorg101101791368doi bioRxiv preprint
S1E Examples of raw clusters for the eight most represented classes which represent more than 50 of the total number of clusters (N=990) S1F Full width at half maxima (reconstruction size) extracted from the 3D reconstructions obtained from each class average The average reconstruction size is (mean 25 nm 94 plusmn 6
std)plusmn S1G-I Quantitative assessment of particles shape Roundness sphericity and aspect ratios parameters of individual raw particles were calculated within each class Particle roundness was computed as the ratio of the average radius of curvature of the corners of the particle to the radius of the maximum inscribed circle while sphericity was computed as the ratio of the projected area of the particle to the area of the minimum circumscribing circle (Zheng and Hryciw 2015) In addition we generated simulated 3D localizations homogeneously distributed within a sphere and reconstructed projected density images to obtain a reference of the shape characteristics we should expect for a perfect sphere taking into account experimental localizations errors The results of these analyses reveal that raw particles display highly symmetric shapes (Panel H) with very little roughness in their contour (Panel G) The residual deviations of some classes from a perfect sphere likely originate from shape fluctuations over time Finally we computed the aspect ratio of each particle in each class (Panel I) In this case raw particles were aligned by using MRAMSA (van Heel Portugal and Schatz 2016) their sizes were estimated in x and y by measuring the full width at half maximum and the aspect ratio was calculated as a ratio between the particle sizes in the x and y dimensions This analysis shows that the aspect ratio was on average close to one as expected for spherical particles
Page 40
certified by peer review) is the authorfunder All rights reserved No reuse allowed without permission The copyright holder for this preprint (which was notthis version posted May 4 2020 httpsdoiorg101101791368doi bioRxiv preprint
Figure S2
S2A Representative images of live cells and single ParB trajectories (low-mobility blue high-mobility red) Processed bright field images are shown in white Bright field images are not drift-corrected thus in some fields of view trajectories may appear shifted with respect to cell masks Low-mobility trajectories tend to cluster while high-mobility trajectories display a dispersed nucleoid localization
S2B Sub-cellular localization of ParB tracks along the long axis of the cell
Apparent diffusion coefficients for high- and low-mobility species
The apparent diffusion coefficient of proteins bound to DNA non-specifically was
reported to range between 03 and 07 μm2s (Garza de Leon et al 2017 Stracy and
Kapanidis 2017 Stracy et al 2016) These values are consistent with the high-mobility
species corresponding to ParB particles interacting non-specifically with chromosomal DNA
The measured apparent diffusion coefficient (D) comprises cell confinement
motion blurring and localization uncertainty (Stracy et al 2016) Thus immobile molecules
have a non-zero D due to the localization uncertainty in each measurement σloc which
manifests itself as a positive offset in the D value of ~σloc2Δt (Δt is the exposure time)
By using the localization uncertainty and exposure times in our experimental conditions
(σloc ~15nm and Δt = 8ms) we estimate a non-zero offset in the apparent diffusion
coefficient of ~002 μm2s exactly our estimation of D for the low-mobility species
Previous studies reported an apparent diffusion coefficient of ~01 μm2s for proteins bound
specifically to DNA (Stracy and Kapanidis 2017 Stracy et al 2016 Zawadzki et al 2015
Thrall et al 2017) This D was similar to that of chromosomal DNA itself (~011 μm2s) as
reported by the D of LacITetR specifically bound to DNA (Garza de Leon et al 2017
Normanno et al 2015) These studies however used different experimental conditions
(σloc~40 nm and Δt = 15ms) leading to a D for immobile particles of ~01 μm2s (Stracy et
al 2016 Zawadzki et al 2015 Garza de Leon et al 2017) Thus we conclude that the D of
Page 41
certified by peer review) is the authorfunder All rights reserved No reuse allowed without permission The copyright holder for this preprint (which was notthis version posted May 4 2020 httpsdoiorg101101791368doi bioRxiv preprint
our low-mobility species is consistent with previous measurements for the apparent
diffusion coefficient of proteins bound specifically to their DNA targets
Calculation of residence time in ParB condensates
In Figure 2E are shown the fluorescence intensity profiles in time from both ParB
condensates after the photo-bleaching of the condensate that we number by 1 We first
notice that the foci intensity curves are symmetric (see Figure S2C below) by doing a simple
manipulation of the data is the symmetric curve of according to the (t) 2I (t)I1 = infin minus I1 I1
asymptotic intensity value I I (t ) I (t ) 07 infin = 1 rarr infin = 2 rarr infin ≃
S2C Fluorescence intensity curves of photo-bleached (orange ) and unbleached (t)I1 condensates (green ) The curve (red) is symmetric to according to the (t)I2 (t)I
1 (t)I1 asymptotic value It shows the symmetrical behavior I I (t ) I (t ) 7 infin = 1 rarr infin = 2 rarr infin ≃ 0 between both condensates which we used in the model developed here
We therefore describe the FRAP experiments by the following simple kinetic model
on the distribution of ParB proteins in both condensates and the rest of the cytoplasm
S2D Schematic representation of the model parameters ( respectively) is the ratio of the(t) S1 (t) S2 average number of fluorescent ParB-GFP proteins in the photo-bleached (un-bleached resp)
condensate is the ratio of the average number of fluorescent ParB-GFP proteins outside of the(t) σ condensates Due to symmetry we consider and k kk1in = 2in = in k kk1out = 2out = out
This model is described by the following equations
Page 42
certified by peer review) is the authorfunder All rights reserved No reuse allowed without permission The copyright holder for this preprint (which was notthis version posted May 4 2020 httpsdoiorg101101791368doi bioRxiv preprint
where and are respectively the ratios of average number of ParB proteins in (t)S1 (t)S2
the condensates (droplets) and after photobleaching and σ(t) the ratio of average F 1 F 2
number of ParB proteins in the cytoplasm after photobleaching All these quantities were
normalized by (see also below) in order to directly compare the experimental (0)S2
normalized intensities and with the model variables and Rates ( (t)I1 (t)I2 (t)S1 (t)S2 kiin
resp) ( ) count for the probability per unit of time to enter (exit resp) the kiout i = 1 2
condensate Note that here we assume that the fluorescence intensity is proportional toF i
the number of ParB proteins and that there are no stericexclusion effects among ParB
Due to the symmetric behavior of the FRAP signals for each condensate (Figure S2C) we
assume that the kinetic rates are the same for each condensate Therefore the F i
equations write
Starting from these assumptions we first study the asymptotic limit of eq 2 where we
notice from Figure S2C that In this case it is simple to (t ) S (t ) S 7S1 rarr infin = 2 rarr infin = infin ≃ 0
notice that
Live data provided an estimation of this ratio (Figure 2C) k 5 S σ kinfin infin = in out ≃ 4
We then write the explicit time dependence of and As intensities have (t)S1 (t)S2 (t) σ
been normalized by the natural photo-bleaching we can first use the conservation of the
total number of proteins just after FRAP photobleaching
Page 43
certified by peer review) is the authorfunder All rights reserved No reuse allowed without permission The copyright holder for this preprint (which was notthis version posted May 4 2020 httpsdoiorg101101791368doi bioRxiv preprint
It is useful to consider that the same condition is valid all over the acquisition (ie we also
assume that degradation of ParB is negligible during the 5min-experiment) therefore at
long times
The conservation of the total particle number (ratio) in eq 4 allows us to eliminate the
equation on the variable σ from the equations 2 and write the new set of equations
General solutions of the systems of equations (6) is as follows
(7)
where equations (6) are still symmetrical for the 1 harr 2 exchange To perform a fit of the
date it is useful to consider the symmetric and antisymmetric variables = (t)Splusmn (t)S1 plusmn (t)S2
and write
The first equation (8) (in accordance with solutions in eq 7) gives the simple exponential
solution
(9)
A simple exponential fit (see Figure S2E below) already provides
s kout = (00100plusmn00004) minus1
Page 44
certified by peer review) is the authorfunder All rights reserved No reuse allowed without permission The copyright holder for this preprint (which was notthis version posted May 4 2020 httpsdoiorg101101791368doi bioRxiv preprint
S2E Anti-symmetric intensity curve (blue) and associated fitted curve(t) (t) S (t)Sminus = S1 minus 2
(red)(t) (0) eSminus = Sminusminusk tout
or reciprocally a residence time in the focus
and
By using the knowledge of the previously estimated parameters and one can kout Sminus (t)
still exploit the solution of (in eq 7) to fit the remaining parameters and S2 (t) kin S+ (t) We fitted the data with the right side of the following rewritten equation (see fit in Figure
S2F)
S2F Intensity curve (purple) and associated fitted curve (see eq 10)(cyan)(t) (t))e(S2 minus Sinfink tout
From this fit we obtain and The reciprocal of s kin = (0044plusmn0012) minus1 97plusmn018 S+ (0) = 0 represents the residence time of ParB in the cytoplasm kin
3 sτ in = ~ 2 Remarkably from this analysis and by using equation 3 we find a ratio of rates
Page 45
certified by peer review) is the authorfunder All rights reserved No reuse allowed without permission The copyright holder for this preprint (which was notthis version posted May 4 2020 httpsdoiorg101101791368doi bioRxiv preprint
kinkout
= (44 3)plusmn 1
which provides an estimate (~90) of the proportion of ParB proteins confined within ParB
condensates in good agreement with experimental results (~95) The agreement between
theoretical and experimental curves can be verified by plotting eqs (7) together with the
experimental datasets (Figure 2F)
G
H
S2G Integrated fluorescence intensity of two ParB condensates before and after fusion Dots represent the integrated ParB condensate intensity before (blue) and after (red) fusion Black line and the shaded regions represent median and one standard deviation respectively The average increase in fluorescence intensity upon fusion was 15plusmn01 S2H Integrated fluorescence intensity of a ParB condensate before and after splitting Dots represent the integrated ParB condensate intensity before (blue) and after (red) Black lines and the shaded regions represent median and one standard deviation respectively The average decrease in fluorescence intensity upon splitting was 07plusmn01
Page 46
certified by peer review) is the authorfunder All rights reserved No reuse allowed without permission The copyright holder for this preprint (which was notthis version posted May 4 2020 httpsdoiorg101101791368doi bioRxiv preprint
Figure S3
The Lattice-Gas model
The ParB proteins in the nucleoid were modeled by a Lattice Gas (LG) which is the
paradigmatic system of particles displaying attractive contact interactions (Binney et al
1992) It is important to note that the LG model presents a first-order phase transition
between a gas phase in which the particles diffuse homogeneously throughout the lattice
and a liquid-gas coexistence phase in which liquid droplets coexist with diffusing particles in
the gas phase An exchange of particles between the two phases maintains a dynamic
equilibrium As we will see below the metastable region of the gas can account for the
experimental observations on ParBS We use the LG as a qualitative model for ParB in the
nucleoid in order to offer a proof of concept of the mechanism of formation of the ParBS
complexes
For 1d 2d square and 3d simple cubic lattices the LG coordination number is q = 2d
Recent work (David et al 2018) shows that a 1D LG model on a fluctuating polymer like DNA
can undergo phase separation and that such a model can after averaging over the polymer
conformational fluctuations be assimilated approximately to a LG with short range
(nearest-neighbor) interactions on a lattice with an effective perhaps fractal coordination
number between 2 and 6 (G David PhD Thesis in preparation) The increase in
coordination number from the value of 2 expected for a linear polymer is due to the
combined effects of nearest-neighbor (spreading) interactions along the polymer and
bridging interactions between proteins widely separated on the polymer but close in space
Here for simplicity and purposes of illustration of the basic mechanism we adopt a simple
cubic (sc) lattice
The ParB proteins were modeled by particles with a diameter which were 5 nma =
located on the nodes of a simple cubic lattice representing segments of the nucleoid on
which ParB is able to bind to or unbind from The distance between nearest-neighbour sites
was as large as the size of a particle ie The lattice was chosen to display the nm5
dimension of a bacterial nucleoid and (equivalent to 5 μmLx = Ly = 0 μmLz = 2
and ) The total number of binding sites in the lattice was then00 aLx = Ly = 1 00 aLz = 4
To match the experimentally determined number of ParB proteins per10N s = 4 6
condensate the particle number was fixed at 300 Thus the particle density was N ρ = N s
very low ( ) placing the LG model in a configuration where only a first-order phase ρ ~ 10minus4
separation transition can occur Particles could interact between each other when they are
at adjacent sites on the sc lattice (nearest neighbour contact interaction) with a magnitude
For the LG model the total energy of the system is where isJ ε ϕε = minus J sum
ltijgtϕi j ϕi
the occupation variable at site i taking the value 1 if the site i is occupied or 0 if not The sum
runs over the pairs of nearest-neighbour sites ltijgt of the latticeΣ
Page 47
certified by peer review) is the authorfunder All rights reserved No reuse allowed without permission The copyright holder for this preprint (which was notthis version posted May 4 2020 httpsdoiorg101101791368doi bioRxiv preprint
The phase diagram of the LG model
The sc LG model displays only 3 parameters the particle density the temperature ρ
(or equivalently ) and the coupling between particles Despite its minimalism aspectT β J
the LG model is a paradigmatic model for phase transitions and displays a rich phase
diagram (Binney et al 1992) The metastable region is bound by the coexistence and the
spinodal curves where the LG can transiently remain in a metastable gas or liquid state
before crossing a free energy barrier to reach a stable coexistence state The time required
to cross this free energy barrier can be very long but their transition rate can also be
considerably increased by a nucleation factor such as a parS site the effect of which can be
modeled within the LG model by particles fixed on the lattice by a strong binding potential
The phenomenology observed in the metastable region is the same as that observed
experimentally for a ParB condensate without a parS site ParBs were homogeneously
distributed in the cell while with parS sites we observed formation of ParB droplets The
parS sites catalyzed the condensation of ParB droplets
Before presenting MC simulations for a finite size system representing the DNA in
the bacterial volume it is instructive to present the thermodynamics of liquid-gas phase
separation (infinite volume limit) Although no analytical solution exists for the sc LG with
nearest-neighbour interactions mean field theory provides an approximate analytical
solution that gives a global perspective For a fixed value of the coexistence and
spinodal curves are usually presented in the density-temperature plane ( ρ T) In the present
case it is more useful to fix the temperature at its room value T r then plot the coexistence
and spinodal curves in the ( ρ J ) plane with J measured in units of the thermal energy kBT r
The mean field phase diagram is presented in Fig S3A For the LG model we note the exact
(particle-hole) symmetry about the critical density where the coexistence and
spinodal curves coincide
Page 48
certified by peer review) is the authorfunder All rights reserved No reuse allowed without permission The copyright holder for this preprint (which was notthis version posted May 4 2020 httpsdoiorg101101791368doi bioRxiv preprint
Fig S3A The mean field coexistence and spinodal curves are presented in the
density-coupling plane (ρ J) with the homogeneous fluid metastable and unstable regions
indicated
At biological density and room temperature the homogeneous (possibly ρ ~ 10minus4
meta or unstable) system is in the extreme low-density regime Although the mean field
prediction for the coexistence curve is asymptotically exact in this regime the same is not
true for the mean field spinodal curve In this limit it is possible however to perform an
asymptotically exact low density (virial) expansion that leads to a simple expression for the
system free energy from which the pressure and chemical potential can be obtained The
coexistence curve is found by equating the pressure and chemical potential in the gas and
liquid phases which are in equilibrium The spinodal curve is determined by the divergence
of the isothermal compressibility At low density the gas branch coexistence (coex) ρ≪ 1
and spinodal (sp) curves are given by (G David in preparation 2019)
We present in Fig S3B the asymptotically exact low-density results for the
coexistence and spinodal curves in the density-coupling plane ( ρ J) The above limiting low
density forms indicate that the coexistence and spinodal curves become straight lines in a
log-linear plot
Fig S3B The asymptotically exact low-density results for the coexistence (red) and spinodal
(blue) curves in the density-coupling plane (ρ J) The upper and lower limits of metastability
in (black horizontal lines) at are shown ( ) The07J low = 3 42Jup = 7
homogeneous fluid phase is stable below the coexistence curve metastable between the
coexistence and spinodal curves and unstable above the spinodal curve
Page 49
certified by peer review) is the authorfunder All rights reserved No reuse allowed without permission The copyright holder for this preprint (which was notthis version posted May 4 2020 httpsdoiorg101101791368doi bioRxiv preprint
A system prepared above the coexistence curve will at equilibrium show phase
separation between a low density gas phase with and a high density liquid
phase with (by particle-hole symmetry) If the system is prepared
in a metastable gas state the time needed to nucleate the phase transition depends on the
distance from the coexistence and spinodal curves since the nucleation barrier decreases as
the spinodal curve is approached where it vanishes
We performed Monte Carlo simulations of the LG in contact with a thermal bath
using the standard Metropolis algorithm (Walter and Barkema 2015) In the following
is the inverse of thermal energy where T is the absolute temperature and(k T ) β = 1 b kbthe Boltzmann constant (in the following all energies are expressed in units of the thermal
energy thus ) The Monte Carlo procedure corresponding to a unit time step is T kb β = 1
the following
1 Choose a particle at random
2 Propose a move to a random empty site of the lattice
3 Calculate the energy difference between the initial and final stateϵ Δ = εf minus ε0
4 If the displacement is accepted otherwise the displacement is accepted ϵ Δ lt 0
with a probability P = eminusβΔϵ
5 Return N times to step 1
The particle relocation of the step 2 defines the order of the time unit of the Monte Carlo
simulation as approximately one second ParB proteins diffusing at (Figure sim1 μm sD 2 minus1
2B) can move at any point on a nucleoid after one second μm1 2
We first used simulations to estimate the range of the interaction term for which J
the LG model is found in the metastable region ie between the coexistence and the
spinodal lines (see Figure S3B and S3C below) To find these lines and define a we J
calculated the energy of the system at equilibrium as a function of with increasing and J
decreasing variations Thus the signature of the first-order transition was visible with a
hysteresis cycle and the range of for which the LG was metastable was bound by the two J
jumps of energy the jump at low corresponding to the coexistence curve and the jump J
at large corresponding to the distance from the spinodal curve at which the nucleation J
time in the presence of a free energy barrier becomes comparable to the simulation time
To identify the hysteresis cycle we increased and decreased by steps of J
After incrementing by (or depending on initial conditions) theJ 005Δ = 0 J JΔ J minus Δ
system was first thermalized to the new coupling value The sampling of the energy was
subsequently performed at intervals long enough to consider that the sampling was not
correlated After 8104 independent samplings was increased to its new valueJ
We observed different regimes (see Figure S3C below)
I In the case of a weak initial the system was first in a gas phase (the interactions J
are too weak to maintain a cohesive phase) In such a configuration the system
favors a homogeneous distribution of particles to maximize entropy with very few
Page 50
certified by peer review) is the authorfunder All rights reserved No reuse allowed without permission The copyright holder for this preprint (which was notthis version posted May 4 2020 httpsdoiorg101101791368doi bioRxiv preprint
interactions between the particles Then by crossing the coexistence line the gas
state became metastable but the system remained in that state until it reached the
point before the spinodal line where nucleation time became comparable to the
simulation one and the gas phase was depleted in favour of the liquid-gas
coexistence phase
II In the case of a high initial the system was first in the liquid-gas coexistence J
phase the particles condensed locally in a droplet and increased the number of
nearest-neighbour interactions The droplet coexisted with a small fraction of freely
diffusing particles Then by approaching and then crossing the coexistence line the
system switched smoothly to a gaseous phase state This protocol defines a
hysteresis cycle determined by simulations for a finite system that delimits the value
of J for which the LG is effectively in the metastable phase Because of the protocol
this range depends on the time scale of the simulations We note furthermore that
fluctuations in finite size systems are more important than in an infinite one
(thermodynamic limit) and therefore the range of effective metastability determined
by simulations should lie within the true thermodynamic range as is the case
S3C Variation of the energy at the equilibrium of the Lattice-Gas model according to the
magnitude of the interaction between particles ( ) in the presence of parS For weak s J J
the system is in the gaseous state while for high s the system is in the liquid state The J
transition from one state to another takes place in a metastable region delimited by
coexistence and spinodal lines In this region the state of the system depends on the initial
state either gaseous (blue curve) or liquid (red curve) We observed a hysteresis cycle which
is characteristic of a first-order phase transition of the LG model between the two states For
the simulations shown on Figure 3A we used =45J
The coupling range for setting the LG in the metastable regime was estimated as
This range falls as it should in the thermodynamic range9 73 lt J lt 4
Page 51
certified by peer review) is the authorfunder All rights reserved No reuse allowed without permission The copyright holder for this preprint (which was notthis version posted May 4 2020 httpsdoiorg101101791368doi bioRxiv preprint
computed above (see Fig S3B) In the dynamic simulations of the main text we chose the
value close to the estimated upper limit in order to be as close as possible to the 5J = 4
experimental value of 90 of ParB inside the droplets ( (Sanchez et al 2015) and here) This
value is in semi-quantitative agreement with other simulation works on ParB-ParB
(Broedersz et al 2014 David et al 2018) At the gas density on the thermodynamic
coexistence curve is very low (see Fig S3A) and the liquid density was very
close to 1 which leads to 98 of ParB inside the droplets We expect however simulations
on finite size systems to show quantitative differences with respect to the thermodynamic
limit because of boundary effects and enhanced fluctuations
Effect of parS on the nucleation
The LG provides a proof of concept of the physical mechanisms at work in the
formation of ParB droplets in the metastable region of the liquid-gas coexistence phase the
nucleation factor parS site catalyzes the formation of a ParB droplet To show this effect we
first thermalized the system from a random distribution of ParB on the nucleoid
(corresponding to the absence of coupling ie ) to the coupling of the simulation J = 0
At time we monitored the time evolution of and the number of ParB in5 J = 4 t = 0 ε
the droplet (Figure 3A) The parameters were the same as before and we averaged over
250 different thermal histories
We checked two different conditions (i) without a parS sequence (ii) with a parS
sequence which were modeled by 10 lattice sites with high affinity for ParB proteins (in
practice 10 ParB were always fixed on these sites after a short transitional time) As a
control we also performed a simulation (iii) with an initial start where all the particles
packed in a single droplet centered on a parS sequence Convergence towards the
equilibrium state was achieved in this case by simple relaxation and not by nucleation
The gas phase is characterized by small values of the energy (the particles are 0 ε ~
dispersed in the lattice) while in the liquid-gas coexistence phase the condensation of the
particles increases the number of interactions and therefore the energy ltε lt 0
In the case (i) without parS the system remained at a small equilibrium value
until the final moment of the simulations ie theminus 4 10ε asymp 2 3 10 MC stepstf = 3 7
condensation into a droplet was not observed In the case (ii) the system was initially at the
small value of as in case (i) but was followed by another plateau between minus 4 10ε = 2 3
and corresponding to the binding of ParB to the 10 parS sites Thet = 104 MC steps105
energy decreased from to which corresponds to the interactions minus 4ε asymp 2 0 10minus 8 3
between the ten ParB fixed side by side on the parS At the time the 10 MC stepst ~ 3 5
system switched from a high energy value to a low value corresponding to the formation of
a droplet around parS At larger times the signal saturated at 10 MC stepst gt 3 5
indicating that the droplet is stable Thus the addition of parS reduced theminus 650 10ε ~ 2 3
nucleation time by at least two orders of magnitude These observations correspond to
Page 52
certified by peer review) is the authorfunder All rights reserved No reuse allowed without permission The copyright holder for this preprint (which was notthis version posted May 4 2020 httpsdoiorg101101791368doi bioRxiv preprint
experimental phenomenology without parS ParB is homogeneously distributed throughout
the cell whereas with parS ParB forms protein condensates
Case (iii) is the control simulation with the fully packed droplet It took at large
times the same value of as case (ii) after a slight decrease corresponding to the escape ε
from the cluster of particles in the gas phase coexisting with the droplet We also monitored
the number of particles inside the droplet (Figure 3A) We observed ~80 of the particles in
the droplet which is in semi-quantitative agreement with experiments (~90 in (Sanchez et
al 2015) and 95 from Figure 2B) In conclusion the ParB complex behaves similarly to a
system in the metastable region of the liquid-gas coexistence phase (Figure S3A) The
addition of parS acting as a nucleator for ParB condensation significantly reduces the time it
takes to form a ParB droplet
To assess the effect of interaction strengths of ParB particles on their nucleation we
performed additional simulations with lower or higher values of J for our two initial
conditions (a gas-like and liquid-like state) When the system was first in a gas phase with
weak interaction strengths (J = 35 kT Figure S3D) particles were unable to form
condensates regardless of the presence of parS sites Without parS sites particles favored a
homogeneous distribution while in presence of parS sites particles equilibrated to a state
with only ParB particles bound specifically to the centromeric sequence In the initial
conditions where ParB particles were released from a liquid-like state the system
equilibrated to a final state where we did not observe nucleation but rather ParB particles
specifically bound to the centromeric sequence
In the case of strong interaction strengths (J = 6 kT Figure S3E) with or without parS
sites particles initially in a gas-like state immediately started forming small droplets (hence
low energy values at initial conditions) until a single large droplet prevailed over the others
In presence of centromeric sequences no binding of ParB to parS was visible due to the fast
local aggregation of ParBs at short timescales giving rise to energy variations of the same
order of magnitude In the case where ParB particles were released from a liquid-like state
particles remained in this state throughout the simulation timescales used here Overall
these simulations highlight the range of interaction strengths required for ParB to nucleate
specifically at parS For weak ParB-ParB interactions (low J) ParB particles are unable to
form a condensate regardless of the presence of centromeric sequences For strong
ParB-ParB interactions (high J) ParB particles nucleate spontaneously independently of the
presence of parS sequences and therefore of the plasmid to segregate A balance of
ParB-ParB interactions strengths and the presence of the centromeric sequence are
therefore both essential for the partition complex to form and to function in plasmid
partitioning
The minimalist model presented in this section explains the basic phenomenology of
our system however it may fail to explain more complex scenarios for which new more
complex models will need to be devised
Page 53
certified by peer review) is the authorfunder All rights reserved No reuse allowed without permission The copyright holder for this preprint (which was notthis version posted May 4 2020 httpsdoiorg101101791368doi bioRxiv preprint
S3D-E Monte-Carlo simulations of the Lattice-Gas model for weak (left panel) and strong (right panel) interaction strengths between ParB particles (D) Weak ParB-ParB interactions (J=35 kT) and high-affinity ParB-parS interactions are considered here Regardless of initial conditions (gas or liquid-like state) ParB proteins are unable to form a condensate in the presence of parS10 (gray blue) and the system equilibrates to a state where only ParBs bind specifically to the centromeric sequences (E) In contrast when strong ParB-ParB interactions (J=6 kT) are considered small droplets immediately appear and nucleate into a single larger condensate independently of the presence or absence of a nucleation sequence (blue and green curves respectively)
Page 54
certified by peer review) is the authorfunder All rights reserved No reuse allowed without permission The copyright holder for this preprint (which was notthis version posted May 4 2020 httpsdoiorg101101791368doi bioRxiv preprint
Nucleation of the partition complex with decreasing number of parS sites
To study the influence of the number of parS sites in the speed of nucleation we
performed simulations with a variable number of parS sites ( nparS= 1 to 10) We observe
nucleation for all values of n parS with n parS = 1 and nparS = 2 displaying nucleation times (τ)
exceeding the range of MC times reported in the Main Text (see Figure S3F below)
However the nucleation time τ( nparS) follows a power law such thatτ( nparS) ~ 1n parS sup2 (see
inset) that can be used to extrapolate the nucleation times for n parS = 1 and n parS = 2 Overall
these data support the finding of Broedersz et al (Broedersz et al 2014) that a single parS
site is sufficient to nucleate a ParB condensate and additionally indicate that the nucleation
of ParB condensates is accelerated by the number of parS sequences per plasmid
S3F Energy as a function of Monte Carlo time for Lattice-gas simulations using different numbers of parS sites (nparS) Nucleation can be detected by a terminal decrease in the energy Inset Nucleation time (τ) versus n parS Red dashed line shows a fit to τ(n parS) = An parSsup2 where A is a constant
Low-mobility ParB trajectories in the absence of parS In spt-PALM experiments we observed an unexpected low-mobility ParB population
with the strain lacking natural parS sequences The simplest explanation for this result is
that in the absence of parS low-mobility ParB tracks correspond to ParB dimers bound to
chromosomal sequences mimicking parS (hereby parS) This interpretation suggests that in
wild-type strains ParB molecules can be in either of three states (1) in a lsquogas-likersquo state
where they move through the nucleoid with low-affinity interactions with non-specific DNA
(2) in a condensed state where they interact specifically with parS and with other ParB
dimers (3) in a transient DNA bound state where they can remain bound to other
chromosomal sequences (such as cryptic parS ) but without interacting with other ParB
dimers
Page 55
certified by peer review) is the authorfunder All rights reserved No reuse allowed without permission The copyright holder for this preprint (which was notthis version posted May 4 2020 httpsdoiorg101101791368doi bioRxiv preprint
To test this hypothesis we searched the Ecoli chromosome for sequences displaying
homology to the parS motif (TGGGACCACGGTCCCA (Pillet et al 2011)) using FIMO
(httpmeme-suiteorgtoolsfimo)
S3G Results of the FIMO analysis for parS mimicking sequences in the Ecoli MG1655
genome
This analysis shows that there are indeed tens of sequences displaying only 2 or 3
mutations in the consensus parS sequence ParB binds nonspecific DNA with an affinity of
250nM and parS with an affinity of 25nM Introduction of 2-3 mutations in the consensus
parS sequence changes the affinity of ParB from 6 and 250nM depending on the position of
the nucleotide change (Pillet et al 2011) Thus tens of cryptic parS sequences exist that
could be populated when the population of ParB in the gas-like state is abundant
Next we performed simulations to explore whether cryptic parS sequences could
get occupied in the absence of the ten natural copies of parS in the F-plasmid For this we
used our Lattice-gas model to measure the occupancy of single copies of parS and varied the
the energy of interaction between ParB and parS (see below)
S3H Occupation of single parS sites for different interaction energies as a function of
Page 56
certified by peer review) is the authorfunder All rights reserved No reuse allowed without permission The copyright holder for this preprint (which was notthis version posted May 4 2020 httpsdoiorg101101791368doi bioRxiv preprint
Monte-Carlo time
ParB-parS interactions with affinities between 6-200nM would have energies
between 46 and 02 kT in our simulations (0 kT representing the baseline for nsDNA
interactions) Thus these simulations show that cryptic parS sites would be occupied
(0-50) in absence of the 10 wildtype high-affinity parS sequences explaining the
persistence of low-mobility unclustered trajectories under these conditions
Finally we performed sptPALM experiments on a ParB mutant with reduced
parS -binding ability to test whether low-mobility trajectories corresponded to ParB
molecules bound to cryptic chromosomal parS sequences We observed a reduction in the
low-mobility population from 50 in the strain lacking parS to 30 in the mutant with
reduced parS binding ability (Figure S3I) Importantly residual low-mobility trajectories in
this ParB mutant failed to cluster (Figure 3D)
S3I Distribution of apparent diffusion coefficients for low- (blue 30) and high-mobility
trajectories (red 70) for a ParB mutant impaired in parS binding (pJYB224DLT3997) The
distribution for a wild-type strain (same data as in Figure 2B) is shown as a dashed grey line
for comparison N=7453 tracks
This new interpretation explains all our experimental observations (1) in wild-type
cells ParB dimers in the gas-like fraction can stably bind and nucleate at the F-plasmid
because it harbours multiple high-affinity contiguous parS sequences This gives rise to
low-mobility clustered tracks observed by spt-PALM In these conditions the proportion of
ParB dimers in the gas-like state is extremely small therefore lower-affinity sparsely
distributed parS sequences do not get populated (2) In contrast in the absence of the 10
wildtype parS sequences a large number of ParB dimers in the gas-like phase can occupy
the lower-affinity sparsely-distributed parS chromosomal sites giving rise to low-mobility
unclustered tracks
Page 57
certified by peer review) is the authorfunder All rights reserved No reuse allowed without permission The copyright holder for this preprint (which was notthis version posted May 4 2020 httpsdoiorg101101791368doi bioRxiv preprint
Figure S4
B
S4A Average cell length and average number of ParB condensates per cell during time-lapse
imaging of the ParA-ssrA strain (pCMD6DLT3469) without induction of ParA degradation
The decrease in the average number of foci per cell observed after one night is due to a
change in cellular metabolism as reflected by the decrease in the average cell length
presumably due to entrance into stationary phase Shaded areas represent standard
deviation
S4B Distribution of partition complex mean intensities at t = 0h (top panel mean intensity
29plusmn09) and 3h after ParA degradation in cells where fusion occurred (bottom panel mean
intensity 49plusmn23) Insets show a typical field of view Cells are shown in black and white
and ParB partition complexes in green Scale bar is 1microm
Time-scales for the observation of ParB condensate fusion in Figures 2 and 4
Data presented in Figures 2 and 4 were acquired under very different experimental conditions
In Figure 2 we used fast time-lapse microscopy (50 ms between frames) to observe fusion of ParB condensates in single cells From these observations we found that fusion events occur rapidly (~5plusmn3 s) and perhaps more critically were in all cases reversible (Ngt14) With wildtype levels of ParA the subcellular position of ParB condensates fluctuates rapidly (~few seconds timescale) (Sanchez et al 2015) Thus in wildtype cells the random encounter of rapidly fluctuating ParB condensates leads to condensate fusion and the presence of endogenous levels of ParA ensures their subsequent separation
In Figure 4 we show that the average number of ParB condensates per cell decreases slowly (over tens of minutes) and irreversibly when ParA is gradually degraded These measurements were performed every 30 minutes thus transient and rapid fusion events (as observed in Figure 2) could not be detected due to the sparse and ensemble
Page 58
certified by peer review) is the authorfunder All rights reserved No reuse allowed without permission The copyright holder for this preprint (which was notthis version posted May 4 2020 httpsdoiorg101101791368doi bioRxiv preprint
sampling In these experiments ParA degradation is never complete as it competes with ParA expression therefore a minimal cellular concentration of ParA may be required to maintain ParB condensates separated at long time-scales
Page 59
certified by peer review) is the authorfunder All rights reserved No reuse allowed without permission The copyright holder for this preprint (which was notthis version posted May 4 2020 httpsdoiorg101101791368doi bioRxiv preprint

ATP-driven separation of liquid phase condensates in bacteria
B Guilhas1 JC Walter2 J Rech3 G David2 N-O Walliser 2 J Palmeri2 C
Mathieu-Demaziere3 A Parmeggiani24 JY Bouet3 A Le Gall1 M Nollmann1
1 Centre de Biochimie Structurale CNRS UMR 5048 INSERM U1054 Universiteacute de Montpellier 60 rue
de Navacelles 34090 Montpellier France
2 Laboratoire Charles Coulomb (L2C) Univ Montpellier CNRS Montpellier France
3 LMGM CBI CNRS Univ Toulouse UPS Toulouse France
4 LPHI CNRS Univ Montpellier Montpellier France
Corresponding authors
Page 1
certified by peer review) is the authorfunder All rights reserved No reuse allowed without permission The copyright holder for this preprint (which was notthis version posted May 4 2020 httpsdoiorg101101791368doi bioRxiv preprint
Abstract
Liquid-liquid phase separated (LLPS) states are key to compartmentalise
components in the absence of membranes however it is unclear whether LLPS condensates
are actively and specifically organized in the sub-cellular space and by which mechanisms
Here we address this question by focusing on the ParABS DNA segregation system
composed of a centromeric-like sequence ( parS) a DNA-binding protein (ParB) and a motor
(ParA) We show that parS-ParB associate to form nanometer-sized round condensates
ParB molecules diffuse rapidly within the nucleoid volume but display confined motions
when trapped inside ParB condensates Single ParB molecules are able to rapidly diffuse
between different condensates and nucleation is strongly favoured by parS Notably the
ParA motor is required to prevent the fusion of ParB condensates These results describe a
novel active mechanism that splits segregates and localises non-canonical LLPS condensates
in the sub-cellular space
Keywords
liquid droplets phase separation liquid phase-condensation plasmid partition ParABS single
particle tracking photo-activated localization microscopy
Page 2
certified by peer review) is the authorfunder All rights reserved No reuse allowed without permission The copyright holder for this preprint (which was notthis version posted May 4 2020 httpsdoiorg101101791368doi bioRxiv preprint
Introduction
In the past bacteria were often viewed as homogeneous systems lacking the
complex sub-cellular spatial organization patterns observed in eukaryotes The advent of
powerful labeling and imaging methods has enabled the discovery of a plethora of
mechanisms used by bacteria to specifically and precisely localize components in space and
time within their sub-cellular volume (Surovtsev and Jacobs-Wagner 2018 Shapiro
McAdams and Losick 2009) These mechanisms include pole-to-pole oscillatory systems to
define the site of cell division (eg MinCDE) dynamic ATP-driven polymerization to drive
cell division and cell growth (eg FtsZ MreB) recognition of cell curvature to localize
chemotaxis complexes (eg DivIVA (Ramamurthi and Losick 2009)) ATP-powered
translocation of membrane-bound machines to power cell motility (eg Agl-Glt (Faure et al
2016)) or nucleoid-bound oscillatory systems to localize chromosomal loci (eg ParABS (Le
Gall et al 2016)) More recently it became apparent that many cellular components (eg
ribosomes RNA polymerases P-granules) (Sanamrad et al 2014 van Gijtenbeek et al 2016
Moffitt et al 2016 Racki et al 2017) display specific sub-cellular localization patterns
leading to the spatial segregation of biochemical reactions (eg translation transcription or
polyP biosynthesis) Most notably bacteria are able to achieve this precise sub-cellular
compartmentalization without resorting to membrane-enclosed organelles
Recently important progress has been made in understanding the formation of
membrane-less organelles in eukaryotic cells (Hyman Weber and Juumllicher 2014) A
combination of in vitro and in vivo experiments demonstrated that such compartments are
formed by liquid-liquid phase separation (LLPS) (Hyman Weber and Juumllicher 2014) a
thermodynamic process by which attractive molecular interactions counterbalance
entropy-driven effects This phenomenon promotes the self-organisation of a condensed
Page 3
certified by peer review) is the authorfunder All rights reserved No reuse allowed without permission The copyright holder for this preprint (which was notthis version posted May 4 2020 httpsdoiorg101101791368doi bioRxiv preprint
phase in which molecules are close enough from each other to experience their mutual
attraction interfaced with a dilute phase This mechanism provides advantages such as
rapid assemblydisassembly absence of a breakable membrane and serves fundamental
biological processes such as regulation of biochemical reactions sequestration of toxic
factors or organization of hubs (Shin and Brangwynne 2017)
The first evidence that eukaryotic cells use LLPS came from examination of P
granules in C elegans (Brangwynne et al 2009) In this study Brangwynne et al observed
different key signatures of liquid droplets P granules formed spherical bodies that could
fuse together drip and wet and displayed a dynamic internal organisation Since then
many other processes in eukaryotes were shown to display LLPS properties (Banani et al
2017) A few recent examples show that this phenomenon also exists in bacteria for
instance ribonucleoprotein granules (Al-Husini et al 2018) the cell division protein FtsZ
(Monterroso et al 2019) and carboxysomes (Wang et al 2019 MacCready Basalla and
Vecchiarelli 2020) Thus LLPS seems to be a universal mechanism to compartmentalise
components in the absence of membranes However it is unclear whether LLPS
condensates are actively and specifically organized in the sub-cellular space and by which
mechanisms
We addressed this problem by investigating how specific DNA sequences are
organized within the sub-cellular volume in space and time We focused on the ParABS
partition system responsible for chromosome and plasmid segregation in bacteria and
archaea (Bouet et al 2014 Toro and Shapiro 2010 Baxter and Funnell 2014 Schumacher et
al 2015) This system is composed of three components (1) a centromeric sequence ( parS)
(2) a dimeric DNA binding protein (ParB) that binds parS and (3) a Walker A ATPase (ParA)
We have previously shown that ParB is very abundant (gt850 dimers per cell) (Bouet et al
Page 4
certified by peer review) is the authorfunder All rights reserved No reuse allowed without permission The copyright holder for this preprint (which was notthis version posted May 4 2020 httpsdoiorg101101791368doi bioRxiv preprint
2005) and localizes to a large extent (~90 of ParB molecules) to regions containing parS
(Sanchez et al 2015) to form a tight nucleoprotein complex (partition complex) In addition
to specific interactions with parS other ingredients were shown to be involved in the
assembly of the partition complex weak ParB-ParB dimer interactions mediated by its
disordered low complexity region as well as non-specific interactions with the surrounding
DNA (Debaugny et al 2018) Different models were proposed for the assembly of partition
complexes The lsquospreadingrsquo model postulates that ParB dimers load at parS sites and then
spread outwards over large genomic distances (Murray Ferreira and Errington 2006
Rodionov Lobocka and Yarmolinsky 1999) In the lsquospreading and bridgingrsquo and lsquocagingrsquo
models additional long-range interactions between ParB dimers and DNA help the partition
complex assemble and coalesce into compact three dimensional assemblies (Broedersz et al
2014 Sanchez et al 2015 Graham et al 2014)
Here we used super-resolution microscopy and single-particle analysis to investigate
the physical mechanisms involved in the formation of bacterial partition complexes We
show that partition complexes are small (lt50nm) spherical objects Single isolated ParB
molecules diffuse rapidly within the nucleoid volume but display confined motions when
trapped inside partition complexes These results suggest a partition of ParB into two
phases a gas-like phase and a dense liquid-like condensate phase that shows
nanometer-sized spherical droplets Next we show that the nucleation of ParB condensates
is strongly favoured by the presence of the centromeric sequence parS and that separation
and proper sub-cellular localization of ParB condensates require the ParA motor Critically
different ParB condensates collapse into a single condensate upon degradation of ParA or
by mutating ParArsquos ATPase nucleotide-binding site These results describe a novel active
mechanism that splits segregates and localises LLPS condensates in the sub-cellular space
Page 5
certified by peer review) is the authorfunder All rights reserved No reuse allowed without permission The copyright holder for this preprint (which was notthis version posted May 4 2020 httpsdoiorg101101791368doi bioRxiv preprint
Results
ParB assembles into spherical nano-condensates
Previous studies revealed that the partition complex is made of ~250 dimers of ParB
(Adachi Hori and Hiraga 2006 Bouet et al 2005) and ~10kb of parS-proximal DNA
(Rodionov Lobocka and Yarmolinsky 1999) This complex is held together by specific
high-affinity interactions between ParB and parS and by low-affinity interactions between
ParB dimers that are essential for the distribution of ParB around parS sites (Figure 1A)
(Sanchez et al 2015 Debaugny et al 2018) However technological limitations have
thwarted the investigation of the physical mechanisms involved in the formation of partition
complexes
We addressed these limitations by first investigating the shape and size of the
F-plasmid partition complex reasoning that the former should inform us on the role of the
mechanisms involved in the maintenance of the complex cohesion while the latter would
enable an estimation of protein concentration within the partition complex To this aim we
combined Photo-Activated Localisation Microscopy (PALM) (Marbouty et al 2015 Fiche et
al 2013) with single-particle reconstruction (Salas et al 2017) and used a previously
validated functional ParB-mEos2 fusion strain (Sanchez et al 2015) In addition we
implemented an efficient and well-controlled fixation protocol (Figure S1A and Methods) to
limit the influence of partition complex dynamics and reach a localization precision of
(Figures S1B-C) Most single ParB particles localized to the partition complex as4 6 nm1 plusmn
we previously observed by live PALM (Sanchez et al 2015) (Figure 1B) Next we clustered
localizations pertaining to each partition complex using a density-based clusterization
algorithm (Cattoni et al 2017 Levet et al 2015) Partition complexes were positioned near
Page 6
certified by peer review) is the authorfunder All rights reserved No reuse allowed without permission The copyright holder for this preprint (which was notthis version posted May 4 2020 httpsdoiorg101101791368doi bioRxiv preprint
the quarter cell positions (Figure S1A) as reported previously (Le Gall et al 2016) Partition
complex shapes displayed heterogeneity reflecting the different three dimensional
projections and conformational states of the complex (Figure 1B-C) Thus we used
single-particle analysis to classify them into eight major class averages that contained most
partition complexes (Figure 1C S1D-E) and applied several quantitative methods to assess
particle shape in each class (Figures S1G-I) Direct comparison with simulated spherical
particles revealed that experimental particles within each class display highly symmetric
shapes with very little roughness From the first eight class averages we generated 3D
reconstructions reaching nanometer-scale isotropic resolution (Figure 1D) (Salas et al 2017)
Next we estimated the size of the partition complex by calculating the mean full
width at half maximum of the reconstructions obtained from each single class average
(average of all classes = 43 7 nm) (Figure S1F) Thus from the size of the partition plusmn
complex and the average number of ParB in each partition complex (~250 ParB dimers)
(Adachi Hori and Hiraga 2006 Bouet et al 2005) we can estimate a local ParB dimer
concentration of the order of ~10 mM (see Methods for details) Remarkably this extremely
high concentration is comparable to that of the total protein concentration in the bacterial
cytoplasm (~10 mM for proteins of the same size as ParB) (Elowitz et al 1999) suggesting
that ParB dimers represent most of the total protein volume within a partition complex
ParB dimers interact together with sub-microM affinities (03-1 microM) (Taylor et al 2015 Sanchez
et al 2015) thus we expect virtually every ParB dimer within a partition complex to be
interacting with another ParB dimer Overall these data show that ParB assembles
nanometer-sized high-concentration membrane-free spherical compartments
Page 7
certified by peer review) is the authorfunder All rights reserved No reuse allowed without permission The copyright holder for this preprint (which was notthis version posted May 4 2020 httpsdoiorg101101791368doi bioRxiv preprint
ParB exists in an equilibrium between liquid- and gas-like phases
Next we investigated whether single ParB dimers were able to escape partition
complexes by using single-particle tracking PALM (sptPALM) (Le Gall et al 2016 Sanchez et
al 2015 Manley et al 2008 Niu and Yu 2008) We observed two distinct dynamic behaviors
reflected by low-mobility (or confined) and high-mobility trajectories with clearly different
apparent diffusional properties (Figures 2A-B) The low-mobility species is consistent with
immobile ParB dimers bound to DNA specifically whereas the high-mobility fraction is
consistent with ParB dimers interacting non-specifically with chromosomal DNA (see
discussion in Figure S2)
A recent study explored the dynamic behaviour of LacI in conditions where the
number of LacI molecules was in vast excess with respect to the number of specific Lac
repressor sites mirroring the experimental conditions found in the ParBS system (Garza de
Leon et al 2017) In this case the authors observed that ~80 of trajectories were highly
mobile corresponding to repressors interacting non-specifically with DNA with only ~20
of tracks displaying low mobility and corresponding to repressors bound to their operators
In stark contrast for the ParAB S system most ParB particles displayed a low-mobility
(~95) and only a small proportion of particles were highly mobile (lt5) (Figure 2B)
Low-mobility trajectories localized near the quarter cell positions similarly to ParB
complexes (Figure S2A-B) To determine whether these trajectories clustered in space we
calculated the pair correlation between low-mobility trajectories (see Methods) For a
homogeneous distribution we would expect a flat line (see dashed curve in Figure 2C) In
contrast we observed a sharp peak at short distances indicating that low-mobility ParB
particles are spatially confined within partition complexes (Figure 2C blue curve)
High-mobility trajectories instead occupied the whole nucleoid space (Figure S2A) Thus
Page 8
certified by peer review) is the authorfunder All rights reserved No reuse allowed without permission The copyright holder for this preprint (which was notthis version posted May 4 2020 httpsdoiorg101101791368doi bioRxiv preprint
from the percentage of high-mobility trajectories detected (~5 of all trajectories) and the
estimated number of ParB dimers per cell (~800) one can estimate that only ~20 ParB
dimers are typically moving between partition complexes High-mobility ParB dimers move
on the nucleoid volume thus we estimate that this species exists at a concentration of ~20
nM five orders of magnitude smaller than the ParB concentration within partition
complexes (~10 mM) Therefore these results suggest that ParB molecules exist in two
well-defined phases (1) a highly condensed liquid-like state (ParB condensate) containing a
high concentration of low-mobility ParB dimers and (2) a diluted gas-like phase where
single high-mobility ParB dimers diffuse on the nucleoid by weak non-specific DNA
interactions (Sanchez et al 2013 Taylor et al 2015 Fisher et al 2017)
ParB diffuses across phase boundaries
This interpretation suggests that single ParB molecules should be able to diffuse
between two different partition complexes within the same cell To test this we
photobleached a single partition complex and monitored the total fluorescence signal in
both the bleached and unbleached complex (Figure 2D) Strikingly we observed a clear
increase in the fluorescence signal of the bleached complex over time with a concomitant
decrease of the fluorescence signal of the unbleached complex (Figures 2D-E) This
behaviour can only be explained by the escape of fluorescent proteins from the unbleached
complex into the gas-phase and the entry of proteins from the gas-phase into the bleached
complex This produces a net flux between unbleached and bleached complexes and
vice-versa The symmetry between both curves suggests that both fluxes have similar
magnitudes (Figure 2E S2C) By modeling the diffusion process we could fit the
experimental curves to a model and estimated the residence time of a ParB molecule in a
Page 9
certified by peer review) is the authorfunder All rights reserved No reuse allowed without permission The copyright holder for this preprint (which was notthis version posted May 4 2020 httpsdoiorg101101791368doi bioRxiv preprint
ParB condensate to be ~ 100 s (Figures S2D-F) while the typical time in the gas-like phase
was ~23 s Note that these typical times provide a good estimate (~90) of the number of
ParB dimers confined within partition complexes (see Figure S2)
Eventually the system reached equilibrium (after ~4 min) At this point the
fluorescence intensities of bleached and unbleached complexes became equal indicating
that ParB molecules equipartitioned between the two condensates We note that
equipartition between ParB condensates would only be possible if single ParB dimers were
diffusing across the liquid-like and gas-like phase boundaries therefore equilibrating
chemical potentials between these two phases (Hyman Weber and Juumllicher 2014) In
equilibrium small condensates in a canonical LLPS system are expected to fuse into a single
large condensate for instance by Ostwald ripening (Hyman et al 2014) Thus the
observation that ParB condensates are in mutual stationary equilibrium at times smaller
than the cell cycle suggests non-canonical mechanisms to suppress droplet fusion
ParB condensates are able to merge
Biomolecular condensates can exhibit different internal architectures For example
the Balbiani body is a solid-like structure maintained by a network of amyloid-type fibers
(Shin and Brangwynne 2017) while liquid-like behavior of P granules denotes an internal
disordered organization Thus the ability of two compartments to fuse helps distinguish
between these two different internal structures To study whether ParB condensates were
able to fuse over time we performed live time-lapse fluorescence microscopy experiments
We observed that independent partition complexes were able to fuse into a single partition
complex (Figure 2F) Notably we observed that fused complexes move in concert during
several seconds (Figure 2F) These fusion events were rapid (~5plusmn3 s) and reversible (14 out
Page 10
certified by peer review) is the authorfunder All rights reserved No reuse allowed without permission The copyright holder for this preprint (which was notthis version posted May 4 2020 httpsdoiorg101101791368doi bioRxiv preprint
of 14 events) To estimate whether the number of ParB molecules was conserved upon
fusion we integrated the fluorescence intensity signal of each ParB condensate prior and
after fusion As expected the integrated intensity increased upon fusion (Figure S2G) but
only by 15plusmn01 fold instead of the two-fold increase expected for canonical LLPS systems
Conversely splitting of ParB condensates decreased the integrated intensity by 07plusmn01 fold
(Figure S2H) We note that this ability of ParB complexes to fuse is not unique to the
F-plasmid system and was also observed for P1 plasmids which also segregate using a
ParABS system (Sengupta et al 2010)
parS and low- and high-affinity ParB interactions are sufficient for phase separation
Next we performed a thermodynamic analysis and Monte-Carlo simulations to find
the minimal set of assumptions that would be necessary to reproduce an equilibrium
between liquid- and gas-like phases For this we considered a minimalistic gas-liquid lattice
model that shows in mean field theory a generic LLPS diagram (Figure S3A) In our
experimental conditions the percentage loss of plasmid in a ΔParAB mutant strain can be
used to estimate on average ~1 plasmidParB condensate Thus we simulated 300 ParB
particles on a three-dimensional 2x05x05 microm3 lattice with a spacing of 5 nm and
represented the F-plasmid by a single static high affinity binding site within this lattice
containing a repeat of 10 parS sequences ParB interacted with high affinity with the parS
cluster (hereafter parS10) with low-affinity with all other sites in the lattice and with
low-affinity with itself Affinities and concentrations were based on
experimentally-determined coefficients (Figure S3) The system was left to evolve under
different initial conditions (pure gas-like or liquid-like states) and in the presence or absence
of parS10 The system remained in a gas-like phase in the absence of parS10 (Figure 3A
Page 11
certified by peer review) is the authorfunder All rights reserved No reuse allowed without permission The copyright holder for this preprint (which was notthis version posted May 4 2020 httpsdoiorg101101791368doi bioRxiv preprint
green curve) or when ParB-ParB interactions were too weak (Figure S3D-E) In contrast in
the presence of parS10 and of physiological ParB-ParB interactions the system sequentially
evolved towards states involving parS binding nucleation and stable co-existence of liquid-
and gas-like phases (Figure 3A blue curve) The system evolved towards the same endpoint
when the initial condition was a pure liquid-like state (Figure 3A gray curve) At this
endpoint 80 of the molecules were in a liquid-phase and the remainder in a gas-like state
comparable to the proportion of clustered low-mobility trajectories observed
experimentally (95 Figure 2B) Thus this minimalist model reproduces the basic
experimental phenomenology and shows that the only elements required to reach a stable
coexistence between liquid and gas-like ParB phases are low-affinity interactions between
ParB dimers and high-affinity interactions between ParB and the nucleation sequence parS
Critically ParB was unable to form a stable liquid-gas coexistence phase in the absence of
parS within physiological timescales (Figure 3A green curve) whilst the nucleation of ParB
condensates was accelerated by an increasing number of parS sequences (Figure S3F) Thus
our simulations suggest that efficient nucleation of ParB into condensates requires parS
We experimentally tested this prediction by performing sptPALM experiments in a
strain lacking parS In contrast to our previous results we frequently observed high-mobility
trajectories (Figure 3B-C) In fact the proportion of this population increased from ~5 in
the wild-type to ~50 in the absence of parS The persistence of low-mobility trajectories
suggests that a fraction of ParB dimers can remain bound to other chromosomal sequences
mimicking parS sites To test this hypothesis we first searched the Ecoli chromosome for
sequences displaying homology to the parS motif (TGGGACCACGGTCCCA) using FIMO and
found tens of sequences displaying only two or three mutations in the consensus parS
sequence (Figure S3G) Second we observed using Monte-Carlo simulations that single
Page 12
certified by peer review) is the authorfunder All rights reserved No reuse allowed without permission The copyright holder for this preprint (which was notthis version posted May 4 2020 httpsdoiorg101101791368doi bioRxiv preprint
parS -like chromosomal sequences can be partially occupied in the absence of parS (Figure
S3H) Finally we found using sptPALM that a ParB mutant with reduced parS-binding affinity
exhibits a further reduction in the low-mobility population with respect to the strain lacking
parS (from 50 to 30 Figure S3I) Overall these results indicate that weakening ParB-parS
interactions leads to a large shift of ParB dimers towards the gas phase However it was not
clear whether the remaining low-mobility ParB dimers still formed condensed phases
To address this question we performed pair-correlation analysis of low-mobility
trajectories (Figure 3D) Clearly low-mobility trajectories displayed a homogeneous
distribution and failed to cluster in both mutant strains in contrast with the clustering
behaviour of low-mobility trajectories in the wild-type (Figure 3D) All in all these
observations show that formation of ParB condensates requires ParB-parS interactions and
are consistent with previous studies (Erdmann Petroff and Funnell 1999 Sanchez et al
2013) (Sanchez et al 2013)
A second conclusion of our Monte-Carlo model is that ParB dimer interactions are
also required for the formation of a condensed phase To test this prediction
experimentally we used a strain carrying a mutation in the arginine-rich motif of ParB that
partially reduces ParB dimer interactions (ParB-3R mutant) In this mutant formation of
partition complexes is considerably impaired (Debaugny et al 2018) By sptPALM we
observed that low-mobility trajectories considerably decrease their ability to cluster (Figure
3D) consistent with previous studies (Debaugny et al 2018 Song et al 2017) and in
support of our Monte Carlo simulations (Figure S3D-E) Taken together these data indicate
that high-affinity ParB-parS interactions and low-affinity ParB dimer interactions are
needed for the assembly of stable liquid-like ParB condensates Weak interactions between
Page 13
certified by peer review) is the authorfunder All rights reserved No reuse allowed without permission The copyright holder for this preprint (which was notthis version posted May 4 2020 httpsdoiorg101101791368doi bioRxiv preprint
ParB dimers and nsDNA were also shown to be necessary for partition complex assembly
(Sanchez et al 2013 Taylor et al 2015 Fisher et al 2017)
Motor proteins drive ParB condensates out-of-equilibrium
At equilibrium a passive system undergoing phase separation displays a single
condensed phase if initially multiple condensed phases are found the lowest energy state
comprises a single liquid-separated phase that can be reached either by fusion or through
Ostwald ripening (Zwicker et al 2014) Partition systems have specifically evolved to ensure
faithful DNA segregation to daughter cells which would be impeded by fusion into single
stable partition complexes Our previous time-lapse fluorescence microscopy experiments
showed that single partition complexes can merge at short time-scales (tens of seconds
Figure 2F) At longer time-scales (tens of minutes) however ParB condensates are not only
kept apart from each other but are also actively segregated concomitantly with the growth
of the host cell (Figure 4A) Previous reports have shown that the ParA motor protein is
necessary to ensure faithful separation and segregation of partition complexes (Le Gall et al
2016 Erdmann Petroff and Funnell 1999) This function requires both ParArsquos ATP
hydrolysis activity and its stimulation by ParB (Le Gall et al 2016 Ah-Seng et al 2013) and
would ensure the segregation of ParB condensates However it is not clear whether ParA
may play a role at preventing fusion of ParB condensates
If ParA was the factor preventing fusion of ParB condensates then its slow removal
should lead to the fusion of all ParB condensates in a cell To test this hypothesis we
generated a strain where ParA can be selectively degraded using a degron system
(McGinness Baker and Sauer 2006) (Figure 4B) In this strain we observed a large reduction
in ParA levels after 30 min of degron induction (Figure 4C) In the absence of ParA
Page 14
certified by peer review) is the authorfunder All rights reserved No reuse allowed without permission The copyright holder for this preprint (which was notthis version posted May 4 2020 httpsdoiorg101101791368doi bioRxiv preprint
degradation this strain displayed wildtype ParB condensate separation dynamics (Figure 4D
white traces) Strikingly upon degradation of ParA we observed the fusion of ParB
condensates (Figure 4E white traces) Over time the average number of ParB condensates
per cell collapsed to 06 plusmn 07 ParB condensatescell in ParA-degraded cells but remained at
29 plusmn 10 ParB condensatescell in cells where ParA degradation was not induced (Figure 4F
S4A) To test whether this reduction was due to the fusion of partition complexes we
quantified the mean intensity of ParB condensates before (0h) and 3h after ParA
degradation (Figure S4B) The marked increase in the mean intensity of ParB condensates
over time (from 29plusmn09 at 0h to 49plusmn 23 at 3h) further suggests that the observed decrease
in the number of ParB condensates was due to condensate fusion
Next we wondered whether ParA degradation would have other consequences in
ParB condensate dynamics For this we quantified the sub-cellular positioning of ParB
condensates before (0h) and 3h after ParA degradation by calculating the localization
density histogram of ParB condensates along the longitudinal axis of the cell These
histograms show that ParA degradation changes the average sub-cellular positioning of ParB
condensates (Figure 4F) in good agreement with previous findings using ParA deletion
strains (Le Gall et al 2016)
While these results show that ParA is necessary to maintain ParB condensates apart
they do not provide direct evidence for the need of ParArsquos ATPase activity in this process
For this we quantified the number of partition complexes in cells where we directly
mutated ParArsquos ATPase nucleotide-binding site (ParAK120Q a mutant impaired in ATP
hydrolysis stimulated by ParB) The mean number of partition complexes was 30plusmn11 in
wild-type cells and decreased to 18plusmn09 in the ParA ATPase mutant strain (Figure 4G)
Page 15
certified by peer review) is the authorfunder All rights reserved No reuse allowed without permission The copyright holder for this preprint (which was notthis version posted May 4 2020 httpsdoiorg101101791368doi bioRxiv preprint
consistent with ParArsquos ATPase activity being implicated in the separation of ParB
condensates
Discussion
Here we provide evidence in support of a new class of droplet-like-forming system
with unique properties that ensure the stable coexistence and regulated inheritance of
separate liquid-condensates Interestingly the three components of the ParABS partition
system and an exquisite regulation of their multivalent interactions are required to observe
this complex behavior (1) High-affinity interactions between ParB and the parS centromeric
sequence are necessary for the nucleation of the ParB condensate (2) Weak interactions of
ParB with chromosomal DNA and with itself are necessary to produce phase separation (3)
The ParA ATPase is required to counter condensate fusion and to properly position
condensates in the cell Interestingly this system displays several non-canonical properties
discussed below
In vivo ParB binds parS and an extended genomic region of ~10kb around parS
(Murray Ferreira and Errington 2006 Rodionov Lobocka and Yarmolinsky 1999 Sanchez
et al 2015) Interestingly the size of this extended genomic region is independent of the
intracellular ParB concentration (Debaugny et al 2018) suggesting that an increase in the
total number of ParB molecules per cell either leads to an increase in the concentration of
ParB within droplets or that an unknown mechanism controls the size of ParB droplets
Here we found that the intensity of ParB condensates increases by 15plusmn01 fold upon
fusion instead of doubling as expected for a conservative process Consistently the
intensity of ParB condensates did not decrease by two-fold but by 07plusmn01 upon condensate
splitting All in all these results suggest that droplet fusionsplitting may be
Page 16
certified by peer review) is the authorfunder All rights reserved No reuse allowed without permission The copyright holder for this preprint (which was notthis version posted May 4 2020 httpsdoiorg101101791368doi bioRxiv preprint
semi-conservative and point to a more complex mechanism regulating ParB number andor
droplet size
Proteins in canonical LLPS systems assemble in compact droplets such as oil
molecules in an oil-in-water emulsion In this case an increase in the number of lsquooilrsquo
molecules leads to an increase in droplet size because the concentration of oil molecules in
droplets is at its maximum (ie the droplet is compact) There are two key differences in the
ParABS system that mean that a doubling in ParB number does not necessarily lead to a
doubling in droplet volume First most ParB proteins in ParBS condensates are bound to the
DNA lattice formed by parS and the surrounding chromosomeplasmid DNA Thus ParB
mainly lives on a polymer and therefore an increase in ParB number can compact the DNA in
the droplet leading to only slight increases in condensate size Second the concentration of
ParB in ParB condensates is ~10 mM This concentration is not that of a compact aggregate
in a watery solvent Therefore increases in ParB numbers can lead to increases in the
concentration of ParB in droplets that do not lead to noticeable changes in droplet sizes
Finally we cannot discard mechanisms controlling the size of ParB condensates (Soumlding et
al 2019 Garcia-Jove Navarro et al 2019 Zwicker et al 2014) that could decouple increases
in droplet volume from increases in the number of ParB molecules
In passive canonical phase-separation systems separate liquid droplets grow by
taking up material from a supersaturated environment by Ostwald ripening or by fusion of
droplets Over time these processes lead to a decrease in the number of droplets and an
increase in their size This reflects the behaviour we observed for ParB condensates upon
depletion of ParA or when its ATPase activity was reduced Recently theoretical models
have predicted mechanisms to enable the stable coexistence of multiple liquid phases
(Zwicker Hyman and Juumllicher 2015) These mechanisms require constituents of the phase
Page 17
certified by peer review) is the authorfunder All rights reserved No reuse allowed without permission The copyright holder for this preprint (which was notthis version posted May 4 2020 httpsdoiorg101101791368doi bioRxiv preprint
separating liquids to be converted into each other by nonequilibrium chemical reactions
(Zwicker Hyman and Juumllicher 2015 Zwicker et al 2016) Our result that the ATPase activity
of ParA is required to maintain ParB condensates well separated indicates that motor
proteins can be involved in the active control of droplet number and in their sub-cellular
localization Interestingly similar mechanisms ndashyet to be discoveredndash could control the
number size and sub-cellular localization of other droplet-forming systems such as
P-granules (Brangwynne 2011) stress granules (Jain et al 2016) or heterochromatin
domains (Strom et al 2017)
Acknowledgments
This project has received funding from the European Research Council (ERC) under the
European Unionrsquos Horizon 2020 Research and Innovation Program (Grant ID 724429) (MN)
the Agence Nationale pour la Recherche grant HiResBacs (ANR-15-CE11-0023) (MN) grant
IBM (ANR-14-CE09-0025-01) (MN J-YB AP) the ECOS-Sud program (A16B01) the
Program lsquoInvestissements drsquoAvenirrsquo for the Labex NUMEV (2011-LABX-076) integrated into
the I-Site MUSE (AAP 2013-2-005 2015-2-055 2016-1-024) (GD J-CW N-OW JP AP)
and the CNRS INPHYNITI program (J-CW J-YB) We acknowledge the France-BioImaging
infrastructure supported by the French National Research Agency (grant ID ANR-10-INBS-04
lsquolsquoInvestments for the Futurersquorsquo) BG and GD were supported by a PhD fellowship from the
French Ministegravere de lrsquoEnseignement Supeacuterieur de la Recherche et de lrsquoInnovation
Data availability statement
The data that support the findings of this study are available from the corresponding author
upon reasonable request
Page 18
certified by peer review) is the authorfunder All rights reserved No reuse allowed without permission The copyright holder for this preprint (which was notthis version posted May 4 2020 httpsdoiorg101101791368doi bioRxiv preprint
Code availability
Most analysis tools and methods used in this study are in the open domain (see Methods)
Code developed specifically for this manuscript can be obtained from the corresponding
author upon request
Methods
Sample preparation
sptPALM PALM FRAP and time-lapse microscopy (fast dynamics)
Microscopy coverslips and glass slides were rinsed with acetone and sonicated in a
1M KOH solution for 20 minutes Next they were dried over an open flame to eliminate any
remaining fluorescent contamination A frame of double-sided adhesive tape was placed on
a glass slide and a ~5mm channel was extruded from its center as previously described (Le
Gall Cattoni and Nollmann 2017) Briefly 20 microl of 2 melted agarose (diluted in M9 media
melted at 80degC for the imaging of DLT3469 strain 1 melted agarose diluted in M9 + 02
arabinose) were spread on the center of the glass slide and covered with a second glass slide
to ensure a flat agarose surface The sandwich slides were kept on a horizontal position for 5
min under external pressure at room temperature (RT) to allow the agarose to solidify The
top slide was then carefully removed when bacteria were ready to be deposited in the agar
pad (see below) Cells were harvested during the exponential phase (optical density at 600
nm ~03) For PALM experiments cells were fixed in a 2 PFA solution for 15 min at room
temperature and 30 min at 4degC (for the detailed procedure refer to (Visser Joshi and Bates
2017)) A bacterial aliquot was spun down in a bench centrifuge at RT at 3000g for 3
minutes The supernatant was then discarded and the pellet re-suspended in 10 microl of
minimal media 15 microl of 110 fiducial beads (TetraSpeck TM Life Technologies) were added
Page 19
certified by peer review) is the authorfunder All rights reserved No reuse allowed without permission The copyright holder for this preprint (which was notthis version posted May 4 2020 httpsdoiorg101101791368doi bioRxiv preprint
17 microl of the resulting bacterial solution were pipetted onto the agar After deposition of
bacteria the second face of the double -sided tape was removed and the pad was then
sealed with a clean coverslip
Time-lapse microscopy (slow dynamics)
Long-term ParB-GFP droplet dynamics (Figure 4) were monitored by following the
movement of ParB droplets over several cell cycle times For this cells were first harvested
during the exponential phase (optical density at 600 nm ~03) then diluted to 1300 to
adjust the bacterial density on the field of view and finally deposed in an ONIX CellAsic
microfluidic chamber (B04A plates Merck-Millipore) Bacteria were immobilized and fresh
culture medium (supplemented with 02 arabinose) was provided (103 kPa) throughout
the acquisition
Fluorescence microscopy
PALM and sptPALM
PALM and sptPALM imaging of ParB-mEos2 were performed on a home -built experimental
setup based on a Zeiss Axiovert 200 by continuously acquiring 7000 (20000 for sptPALM)
images at 50ms exposure time (8ms for sptPALM) with a 561 nm readout laser (Sapphire
561LP 100mW Coherent) and continuous illumination with a 405 nm laser for
photoactivation (OBIS 40550 Coherent) Data were acquired using custom-made code
written in Labview The readout laser intensity used was 14 kWcmsup2 at the sample plane
The intensity of the 405nm laser was modified during the course of the experiment to
maintain the density of activated fluorophores constant while ensuring single molecule
Page 20
certified by peer review) is the authorfunder All rights reserved No reuse allowed without permission The copyright holder for this preprint (which was notthis version posted May 4 2020 httpsdoiorg101101791368doi bioRxiv preprint
imaging conditions PALM acquisitions were carried out until all mEos2 proteins were
photoactivated and bleached Fluorescent beads (TetraSpeck TM Life Technologies) were
used as fiducial marks to correct for sample drift by post-processing analysis For cell
segmentation a bright field image was taken on each field of view
Time-lapse microscopy
Long-term time-lapse microscopy to monitor of ParB-GFP droplet dynamics was performed
on the same optical setup by continuously acquiring images at 50ms exposure time with a
561 nm readout laser (Sapphire 561LP 100mW Coherent) until complete photobleaching
FRAP
FRAP experiments on ParB-GFP droplets were conducted on a ZEISS LSM 800 by acquiring
318x318x5 (XYZ) images every 10 seconds with 106x106x230 nm 3 voxels exposed during
108 micros Data were acquired using Zen Black (Zeiss acquisition suite) The photo-bleaching of
ParB-GFP droplets was performed in circular regions with a diameter of 12 microm covering
single droplets in cells with exactly two droplets To be able to detect them and estimate
their intensity afterwards droplets were only partially photo-bleached (50 approximately)
To estimate photo-bleaching during fluorescence recovery fluorescent intensity was also
monitored in bacteria in which ParB-GFP droplets were not pre-bleached The resulting
z-stack images were then projected and analyzed
ParA degradation experiments
ParA degron experiments (DLT3469 strain) were conducted on an Eclipse TI-EB wide field
epifluorescence microscope with a phase contrast objective To quantify the number of
ParB-GFP droplets samples were prepared at different time points (t induction tinduction + 1h
tinduction + 2h tinduction + 3h and one night after induction of degradation) by harvesting cells
from the solution and snapshot images were acquired with an exposure time of 06 s
Page 21
certified by peer review) is the authorfunder All rights reserved No reuse allowed without permission The copyright holder for this preprint (which was notthis version posted May 4 2020 httpsdoiorg101101791368doi bioRxiv preprint
Images were then analysed using the MATLAB-based open-source software MicrobeTracker
and the SpotFinderZ tool ( Sliusarenko et al 2011) To monitor the dynamics of ParB-GFP
droplets images were acquired every 42 seconds
Data analysis
PALM
Localization of single molecules for PALM experiments was performed using 3D-DAOSTORM
(Babcock Sigal and Zhuang 2012) To discard poorly sampled clusters localization stitching
was used to select clusters with more than 10 ParB-mEos2 molecules Stitching was realized
by grouping together localizations appearing in successive frames or separated by up to 10
frames (to account for fluorescent blinking) and that were 50 nm apart Stitched
localizations were clustered using a voronoi-based cluster identification method (Levet et al
2015 Cattoni et al 2017) In total 990 clusters with an average of localizations 4 578 plusmn
(mean std) were analyzed (Figure S1C) To validate that chemical fixation did not alter the plusmn
localization of ParB droplets we measured the position of droplets in small cells as these
most often contained two droplets (Figure S1A) ParB-mEos2 droplets observed by PALM
displayed the typical localization pattern of ParB-GFP observed in live cells ie a preferential
localization near quarter positions along the cells main axis (Le Gall et al 2016)
3D isotropic reconstructions from single-molecule localizations
Super-resolved images were reconstructed and classified using our Single-Particle Analysis
method (Salas et al 2017) based on iterations of multi-reference alignment and multivariate
statistical analysis classification (van Heel Portugal and Schatz 2016) N = 990 clusters were
sorted into 50 class averages (Figure S1D) 51 (506990) of the total clusters fell into only
Page 22
certified by peer review) is the authorfunder All rights reserved No reuse allowed without permission The copyright holder for this preprint (which was notthis version posted May 4 2020 httpsdoiorg101101791368doi bioRxiv preprint
eight classes (Figure S1E) which were further analysed for particle reconstructions To
measure the size of the partition complex we reconstructed the three dimensional
structures of the eight most represented classes using the angular reconstitution method
(Van Heel 1987) and evaluated their Full-Width at Half Maximum (FWHM Figure S1F)
sptPALM
Single-molecules for sptPALM analysis were localized using MultipleTarget Tracking (MTT)
(Sergeacute et al 2008) Single ParB-mEos2 localizations were linked to single tracks if they
appeared in consecutive frames within a spatial window of 500nm To account for
fluorescent protein blinking or missed events fluorescence from single ParB-mEos2
molecules were allowed to disappear for a maximum of 3 frames Short tracks of less than
four detections were discarded from subsequent analysis The mean-squared displacement
(MSD) was computed as described in (Uphoff Sherratt and Kapanidis 2014) The apparent
diffusion coefficient was calculated from the MSD using the following equation
where SD (4 Δt)D = M t 7 msecΔ = 9
In all cases the distribution of apparent diffusion coefficients were satisfactorily
fitted by a two-Gaussian function These fits were used to define the proportions of low-
and high-mobility species present for wild-type and mutant strains Trajectories were then
classified as low- or high-mobility using a fixed threshold The value of the threshold was
optimized so that the number of trajectories in each species matched that obtained from
the two-Gaussian fit
Pairwise distances between ParB molecules were computed as described in (Stracy
et al 2015) First the tracks appearing in a spatio-temporal window of 50 nm and 67 frames
were linked together to correct for long-time fluorescence blinking of mEos2 that could lead
to biased results towards short distances Then the distances between the first localizations
Page 23
certified by peer review) is the authorfunder All rights reserved No reuse allowed without permission The copyright holder for this preprint (which was notthis version posted May 4 2020 httpsdoiorg101101791368doi bioRxiv preprint
of each trajectory were computed Finally these distances were normalized by a
homogeneous distribution obtained from simulating random distributions of 500 emitters in
a 1 microm by 05 microm nucleoid space The threshold to define the shaded region in Fig 2C
(200nm) was obtained from the value in the x-axis where the pair correlation surpassed 1
This value is considerably larger than the size of a ParB condensate measured in fixed cells
(Figure 1) because the partition complex moves during acquisition in live sptPALM
experiments leading to an effective confinement region of ~150-200 nm (Sanchez et al
2015)
FRAP
ParB-GFP droplets from FRAP experiments were tracked using 3D-DAOSTORM (Babcock
Sigal and Zhuang 2012) The fluorescence intensity of each ParB-GFP droplet was computed
by integrating the intensity of a 318nm x 318nm region (3x3 pixels) centered on the centroid
of the focus The trace in Figure 2E was built by averaging the time-dependent fluorescent
decayincrease curves from photo-bleachedunbleached ParB-GFP droplets Each curve was
first normalized by the initial droplet intensity estimated by the average intensity in the
three images prior to photo-bleaching To estimate and correct for natural photo-bleaching
we used bacteria present on the same fields of view but whose ParB-GFP droplet had not
been photo-bleached
Calculation of ParB concentrations
The concentration of ParB molecules per partition complex was calculated as follows The
total number of ParB dimers per cell is estimated at ~850 dimers with 95 of them residing
within a partition complex (Figure 1B) Therefore there are in average N = 85035095 =
231 dimers per partition complex given that there are ~35 partition complexes per cell in
average The volume of a partition complex can be estimated as V = 43Pirsup3=41610^20
Page 24
certified by peer review) is the authorfunder All rights reserved No reuse allowed without permission The copyright holder for this preprint (which was notthis version posted May 4 2020 httpsdoiorg101101791368doi bioRxiv preprint
liters with r being the mean radius of a partition complex (r = 215 nm) Thus the
concentration of ParB in a partition complex is estimated as C = NNaV = 92 mM with Na
being Avogadrorsquos number
Bacterial strains and plasmids
E coli strains and plasmids are listed in Tables S1-S2 Cultures were grown at 37degC
with aeration in LB (Miller 1972) containing thymine (10 microgml -1) and antibiotics as
appropriate chloramphenicol (10 microgml -1) kanamycin (50 microgml -1) For microscopy and
stability assays cultures were grown at 30degC with aeration in MGC (M9 minimal medium
supplemented with 04 glucose (glycerol or maltose for microscopy assays) 02
casamino acids 1 mM MgSO 4 01 mM CaCl 2 1 microgml -1 thiamine 20 microgml -1 leucine and 40
microgml -1 thymine)
DLT3298 ( sspBkan) was constructed by P1 transduction from strain JW3197 (Baba
et al 2006) The excision of the FRT-kan-FRT selection cassette from strains DLT3053 and
DLT3298 was performed using the pCP20 plasmid (Datsenko and Wanner 2000) The sspB
gene under the control of the arabinose-inducible PBAD promoter was introduced in DLT3299
by P1 transduction from strain SM997 resulting in DLT3401 (∆sspB PBAD -sspB kan) The
mini-F pCMD6 carrying parA F-mVenus-ssrA AEAS was introduced by transformation in DLT3401
to generate DLT3469 The induction was performed with 02 arabinose
The mini-F plasmids expressing the fluorescently tagged Par proteins are derivatives
of the wild-type mini-F pDAG114 The double ParB mutant K191A-R195A was generated by
Quikchange mutagenesis from pJYB212 The plasmid pJYB240 was generated from pJYB212
by exchanging the mEos2 open reading frame by a PCR-amplified mTurquoise2 DNA
(Goedhart et al 2012) using the InFusion kit (Clontech) The parBF - mTurquoise2 gene from
pJYB240 was introduced into pJYB243 using MfeI and SpeI restriction enzymes to give
Page 25
certified by peer review) is the authorfunder All rights reserved No reuse allowed without permission The copyright holder for this preprint (which was notthis version posted May 4 2020 httpsdoiorg101101791368doi bioRxiv preprint
pJYB249 A SsrA tag (SsrA AEAS AANDENYSENYAEAS) to specifically induce the degradation of
ParAF was introduced in frame after the last codon of ParA generating pCMD6 The ssrAAEAS
sequence carries the wild-type co-translational signals between parAF and parB F All plasmid
constructs were verified by DNA sequencing (Eurofins)
Table S1 Strains list
(all strains used are derivatives of E coli K12)
DLT1215 F ndash thi leu thyA deoB supE rpsL Δ(ara-leu) zac3051Tn10
(Bouet Bouvier and Lane 2006)
DLT2887 DLT1215 pJYB212 This work Figures 1B 1C 1D 2A 2B 2C
DLT3053 DLT1215 Hu-mCherry FRT-Kan-FRT (Le Gall et al 2016)
DLT3289 DLT1215 Hu-mCherry This work
DLT3264 DLT1215 pJYB216 This work Figures 3B 3C 3D
DLT3298 DLT3289 sspBkan This work
DLT3299 DLT3289 ∆sspB This work
DLT3401 DLT3299 nocus-PBAD -sspB kan This work
DLT3469 DLT3401 pCMD6 This work Figures 4B 4C 4D 4E 4F
DLT3851 DLT1215 pJYB213 This work Figures 2D 2E 2F 4A
DLT3997 DLT1215pJYB224 This work Figures 3D S2C
JW3197 BW25113 sspBkan Keio collection (Baba et al 2006)
SM997 sspBcat nocus-PBAD -sspB kan Gift from C Lesterlin
Page 26
certified by peer review) is the authorfunder All rights reserved No reuse allowed without permission The copyright holder for this preprint (which was notthis version posted May 4 2020 httpsdoiorg101101791368doi bioRxiv preprint
Table S2 Plasmids list
pCMD6 pJYB249 parA F -mVenus-ssrAAEAS parBF -mTurquoise2 This work
pDAG114
mini-F repFIA+ parABS F + ccdB - resD+ rsfF + cat+ (Lemonnier et al 2000)
pJYB212 pDAG114 parB F -mEos2 (Sanchez et al 2015)
pJYB213 pDAG114 parBF -eGfp (Sanchez et al 2015)
pJYB216 pJYB212 ∆parS (Sanchez et al 2015)
pJYB240 pDAG114 parBF -mTurquoise2 This work
pJYB243 pDAG114 parAF -mVenus (Sanchez et al 2015)
pJYB249 pDAG114 parAF -mVenus parB F -mTurquoise2 This work
pJYB224 parBF _K191A_R195A-mEos2 This work
Key resources table
Reagent or resource Source Identifier
Deposited Data doi1017632c3gymp7vbn1 Experimental data types
Page 27
certified by peer review) is the authorfunder All rights reserved No reuse allowed without permission The copyright holder for this preprint (which was notthis version posted May 4 2020 httpsdoiorg101101791368doi bioRxiv preprint
References
Adachi Shun Kotaro Hori and Sota Hiraga 2006 ldquoSubcellular Positioning of F Plasmid Mediated by Dynamic Localization of SopA and SopBrdquo Journal of Molecular Biology 356 (4) 850ndash63
Ah-Seng Yoan Frederic Lopez Franck Pasta David Lane and Jean-Yves Bouet 2009 ldquoDual Role of DNA in Regulating ATP Hydrolysis by the SopA Partition Proteinrdquo The Journal of Biological Chemistry 284 (44) 30067ndash75
Ah-Seng Yoan Jeacuterocircme Rech David Lane and Jean-Yves Bouet 2013 ldquoDefining the Role of ATP Hydrolysis in Mitotic Segregation of Bacterial Plasmidsrdquo PLoS Genetics 9 (12) e1003956
Al-Husini Nadra Dylan T Tomares Obaidah Bitar W Seth Childers and Jared M Schrader 2018 ldquoα-Proteobacterial RNA Degradosomes Assemble Liquid-Liquid Phase-Separated RNP Bodiesrdquo Molecular Cell 71 (6) 1027ndash39e14
Baba Tomoya Takeshi Ara Miki Hasegawa Yuki Takai Yoshiko Okumura Miki Baba Kirill A Datsenko Masaru Tomita Barry L Wanner and Hirotada Mori 2006 ldquoConstruction of Escherichia Coli K-12 In-frame Single-gene Knockout Mutants The Keio Collectionrdquo Molecular Systems Biology 2 (1) 20060008
Babcock Hazen Yaron M Sigal and Xiaowei Zhuang 2012 ldquoA High-Density 3D Localization Algorithm for Stochastic Optical Reconstruction Microscopyrdquo Optical Nanoscopy 1 (6) httpsdoiorg1011862192-2853-1-6
Banani Salman F Hyun O Lee Anthony A Hyman and Michael K Rosen 2017 ldquoBiomolecular Condensates Organizers of Cellular Biochemistryrdquo Nature Reviews Molecular Cell Biology 18 (5) 285ndash98
Baxter Jamie C and Barbara E Funnell 2014 ldquoPlasmid Partition Mechanismsrdquo Microbiology Spectrum 2 (6) httpsdoiorg 101128microbiolspecPLAS-0023-2014
Binney J J N J Dowrick A J Fisher and M E J Newman 1992 The Theory of Critical Phenomena An Introduction to the Renormalization Group Oxford University Press
Bouet Jean-Yves Marie Bouvier and David Lane 2006 ldquoConcerted Action of Plasmid Maintenance Functions Partition Complexes Create a Requirement for Dimer Resolutionrdquo Molecular Microbiology 62 (5) 1447ndash59
Bouet Jean-Yves Jeacuterocircme Rech Sylvain Egloff Donald P Biek and David Lane 2005 ldquoProbing Plasmid Partition with Centromere-Based Incompatibilityrdquo Molecular Microbiology 55 (2) 511ndash25
Bouet Jean-Yves Mathieu Stouf Elise Lebailly and Franccedilois Cornet 2014 ldquoMechanisms for Chromosome Segregationrdquo Current Opinion in Microbiology 22 (December) 60ndash65
Brangwynne Clifford P 2011 ldquoSoft Active Aggregates Mechanics Dynamics and Self-Assembly of Liquid-like Intracellular Protein Bodiesrdquo Soft Matter 7 (7) 3052ndash59
Brangwynne Clifford P Christian R Eckmann David S Courson Agata Rybarska Carsten Hoege Joumlbin Gharakhani Frank Juumllicher and Anthony A Hyman 2009 ldquoGermline P Granules Are Liquid Droplets That Localize by Controlled Dissolutioncondensationrdquo Science 324 (5935) 1729ndash32
Broedersz Chase P Xindan Wang Yigal Meir Joseph J Loparo David Z Rudner and Ned S Wingreen 2014 ldquoCondensation and Localization of the Partitioning Protein ParB on the Bacterial Chromosomerdquo Proceedings of the National Academy of Sciences of the United States of America 111 (24) 8809ndash14
Page 28
certified by peer review) is the authorfunder All rights reserved No reuse allowed without permission The copyright holder for this preprint (which was notthis version posted May 4 2020 httpsdoiorg101101791368doi bioRxiv preprint
Cattoni Diego I Andreacutes M Cardozo Gizzi Mariya Georgieva Marco Di Stefano Alessandro Valeri Delphine Chamousset Christophe Houbron et al 2017 ldquoSingle-Cell Absolute Contact Probability Detection Reveals Chromosomes Are Organized by Multiple Low-Frequency yet Specific Interactionsrdquo Nature Communications 8 (1) 1753
Datsenko K A and B L Wanner 2000 ldquoOne-Step Inactivation of Chromosomal Genes in Escherichia Coli K-12 Using PCR Productsrdquo Proceedings of the National Academy of Sciences of the United States of America 97 (12) 6640ndash45
David G J -C Walter C P Broedersz J Dorignac F Geniet A Parmeggiani N -O Walliser and J Palmeri 2018 ldquoPhase Separation of Polymer-Bound Particles Induced by Loop-Mediated 1D Effective Long-Range Interactionsrdquo arXiv Preprint arXiv181109234 arXiv httparxivorgabs181109234
Debaugny Roxanne E Aurore Sanchez Jeacuterocircme Rech Delphine Labourdette Jeacuterocircme Dorignac Freacutedeacuteric Geniet John Palmeri et al 2018 ldquoA Conserved Mechanism Drives Partition Complex Assembly on Bacterial Chromosomes and Plasmidsrdquo Molecular Systems Biology 14 (11) e8516
Elowitz M B M G Surette P E Wolf J B Stock and S Leibler 1999 ldquoProtein Mobility in the Cytoplasm of Escherichia Colirdquo Journal of Bacteriology 181 (1) 197ndash203
Erdmann N T Petroff and B E Funnell 1999 ldquoIntracellular Localization of P1 ParB Protein Depends on ParA and parSrdquo Proceedings of the National Academy of Sciences of the United States of America 96 (26) 14905ndash10
Faure Laura M Jean-Bernard Fiche Leon Espinosa Adrien Ducret Vivek Anantharaman Jennifer Luciano Seacutebastien Lhospice et al 2016 ldquoThe Mechanism of Force Transmission at Bacterial Focal Adhesion Complexesrdquo Nature October httpsdoiorg101038nature20121
Fiche Jean-Bernard Diego I Cattoni Nele Diekmann Julio Mateos Langerak Caroline Clerte Catherine A Royer Emmanuel Margeat Thierry Doan and Marcelo Nollmann 2013 ldquoRecruitment Assembly and Molecular Architecture of the SpoIIIE DNA Pump Revealed by Superresolution Microscopyrdquo PLoS Biology 11 (5) e1001557
Fisher Gemma Lm Ceacutesar L Pastrana Victoria A Higman Alan Koh James A Taylor Annika Butterer Timothy Craggs et al 2017 ldquoThe Structural Basis for Dynamic DNA Binding and Bridging Interactions Which Condense the Bacterial Centromererdquo eLife 6 (December) httpsdoiorg 107554eLife28086
Garcia-Jove Navarro Marina Shunnichi Kashida Racha Chouaib Sylvie Souquere Geacuterard Pierron Dominique Weil and Zoher Gueroui 2019 ldquoRNA Is a Critical Element for the Sizing and the Composition of Phase-Separated RNA-Protein Condensatesrdquo Nature Communications 10 (1) 3230
Garza de Leon Federico Laura Sellars Mathew Stracy Stephen J W Busby and Achillefs N Kapanidis 2017 ldquoTracking Low-Copy Transcription Factors in Living Bacteria The Case of the Lac Repressorrdquo Biophysical Journal 112 (7) 1316ndash27
Gijtenbeek Lieke A van Andrew Robinson Antoine M van Oijen Bert Poolman and Jan Kok 2016 ldquoOn the Spatial Organization of mRNA Plasmids and Ribosomes in a Bacterial Host Overexpressing Membrane Proteinsrdquo PLoS Genetics 12 (12) e1006523
Goedhart Joachim David von Stetten Marjolaine Noirclerc-Savoye Mickaeumll Lelimousin Linda Joosen Mark A Hink Laura van Weeren Theodorus W J Gadella Jr and Antoine Royant 2012 ldquoStructure-Guided Evolution of Cyan Fluorescent Proteins towards a Quantum Yield of 93rdquo Nature Communications 3 (March) 751
Graham Thomas G W Xindan Wang Dan Song Candice M Etson Antoine M van Oijen David Z Rudner and Joseph J Loparo 2014 ldquoParB Spreading Requires DNA Bridgingrdquo
Page 29
certified by peer review) is the authorfunder All rights reserved No reuse allowed without permission The copyright holder for this preprint (which was notthis version posted May 4 2020 httpsdoiorg101101791368doi bioRxiv preprint
Genes amp Development 28 (11) 1228ndash38 Heel Marin van Rodrigo V Portugal and Michael Schatz 2016 ldquoMultivariate Statistical
Analysis of Large Datasets Single Particle Electron Microscopyrdquo Open Journal of Statistics httpsdoiorg 104236ojs201664059
Hyman Anthony A Christoph A Weber and Frank Juumllicher 2014 ldquoLiquid-Liquid Phase Separation in Biologyrdquo Annual Review of Cell and Developmental Biology 30 39ndash58
Jain Saumya Joshua R Wheeler Robert W Walters Anurag Agrawal Anthony Barsic and Roy Parker 2016 ldquoATPase-Modulated Stress Granules Contain a Diverse Proteome and Substructurerdquo Cell 164 (3) 487ndash98
Le Gall Antoine Diego I Cattoni Baptiste Guilhas Ceacuteline Mathieu-Demaziegravere Laura Oudjedi Jean-Bernard Fiche Jeacuterocircme Rech et al 2016 ldquoBacterial Partition Complexes Segregate within the Volume of the Nucleoidrdquo Nature Communications 7 (July) 12107
Le Gall Antoine Diego I Cattoni and Marcelo Nollmann 2017 ldquoImaging of Bacterial Chromosome Organization by 3D Super-Resolution Microscopyrdquo Methods in Molecular Biology 1624 253ndash68
Lemonnier M J Y Bouet V Libante and D Lane 2000 ldquoDisruption of the F Plasmid Partition Complex in Vivo by Partition Protein SopArdquo Molecular Microbiology 38 (3) 493ndash505
Levet Florian Eric Hosy Adel Kechkar Corey Butler Anne Beghin Daniel Choquet and Jean-Baptiste Sibarita 2015 ldquoSR-Tesseler A Method to Segment and Quantify Localization-Based Super-Resolution Microscopy Datardquo Nature Methods 12 (11) 1065ndash71
MacCready Joshua S Joseph L Basalla and Anthony G Vecchiarelli 2020 ldquoOrigin and Evolution of Carboxysome Positioning Systems in Cyanobacteriardquo Molecular Biology and Evolution January httpsdoiorg 101093molbevmsz308
Manley Suliana Jennifer M Gillette George H Patterson Hari Shroff Harald F Hess Eric Betzig and Jennifer Lippincott-Schwartz 2008 ldquoHigh-Density Mapping of Single-Molecule Trajectories with Photoactivated Localization Microscopyrdquo Nature Methods 5 (2) 155ndash57
Marbouty Martial Antoine Le Gall Diego I Cattoni Axel Cournac Alan Koh Jean-Bernard Fiche Julien Mozziconacci Heath Murray Romain Koszul and Marcelo Nollmann 2015 ldquoCondensin- and Replication-Mediated Bacterial Chromosome Folding and Origin Condensation Revealed by Hi-C and Super-Resolution Imagingrdquo Molecular Cell 59 (4) 588ndash602
McGinness Kathleen E Tania A Baker and Robert T Sauer 2006 ldquoEngineering Controllable Protein Degradationrdquo Molecular Cell 22 (5) 701ndash7
Moffitt Jeffrey R Shristi Pandey Alistair N Boettiger Siyuan Wang and Xiaowei Zhuang 2016 ldquoSpatial Organization Shapes the Turnover of a Bacterial Transcriptomerdquo eLife 5 (May) httpsdoiorg 107554eLife13065
Monterroso Begontildea Silvia Zorrilla Marta Sobrinos-Sanguino Miguel A Robles-Ramos Marina Loacutepez-Aacutelvarez William Margolin Christine D Keating and Germaacuten Rivas 2019 ldquoBacterial FtsZ Protein Forms Phase-Separated Condensates with Its Nucleoid-Associated Inhibitor SlmArdquo EMBO Reports 20 (1) httpsdoiorg1015252embr201845946
Murray Heath Henrique Ferreira and Jeff Errington 2006 ldquoThe Bacterial Chromosome Segregation Protein Spo0J Spreads along DNA from parS Nucleation Sitesrdquo Molecular Microbiology 61 (5) 1352ndash61
Niu Lili and Ji Yu 2008 ldquoInvestigating Intracellular Dynamics of FtsZ Cytoskeleton with
Page 30
certified by peer review) is the authorfunder All rights reserved No reuse allowed without permission The copyright holder for this preprint (which was notthis version posted May 4 2020 httpsdoiorg101101791368doi bioRxiv preprint
Photoactivation Single-Molecule Trackingrdquo Biophysical Journal 95 (4) 2009ndash16 Normanno Davide Lydia Boudaregravene Claire Dugast-Darzacq Jiji Chen Christian Richter
Florence Proux Olivier Beacutenichou Raphaeumll Voituriez Xavier Darzacq and Maxime Dahan 2015 ldquoProbing the Target Search of DNA-Binding Proteins in Mammalian Cells Using TetR as Model Searcherrdquo Nature Communications httpsdoiorg101038ncomms8357
Pillet Flavien Aurore Sanchez David Lane Veacuteronique Anton Leberre and Jean-Yves Bouet 2011 ldquoCentromere Binding Specificity in Assembly of the F Plasmid Partition Complexrdquo Nucleic Acids Research httpsdoiorg 101093nargkr457
Racki Lisa R Elitza I Tocheva Michael G Dieterle Meaghan C Sullivan Grant J Jensen and Dianne K Newman 2017 ldquoPolyphosphate Granule Biogenesis Is Temporally and Functionally Tied to Cell Cycle Exit during Starvation in Pseudomonas Aeruginosardquo Proceedings of the National Academy of Sciences of the United States of America 114 (12) E2440ndash49
Ramamurthi Kumaran S and Richard Losick 2009 ldquoNegative Membrane Curvature as a Cue for Subcellular Localization of a Bacterial Proteinrdquo Proceedings of the National Academy of Sciences of the United States of America 106 (32) 13541ndash45
Rodionov O M Lobocka and M Yarmolinsky 1999 ldquoSilencing of Genes Flanking the P1 Plasmid Centromererdquo Science 283 (5401) 546ndash49
Salas Desireacutee Antoine Le Gall Jean-Bernard Fiche Alessandro Valeri Yonggang Ke Patrick Bron Gaetan Bellot and Marcelo Nollmann 2017 ldquoAngular Reconstitution-Based 3D Reconstructions of Nanomolecular Structures from Superresolution Light-Microscopy Imagesrdquo Proceedings of the National Academy of Sciences of the United States of America August httpsdoiorg 101073pnas1704908114
Sanamrad Arash Fredrik Persson Ebba G Lundius David Fange Arvid H Gynnaring and Johan Elf 2014 ldquoSingle-Particle Tracking Reveals That Free Ribosomal Subunits Are Not Excluded from the Escherichia Coli Nucleoidrdquo Proceedings of the National Academy of Sciences of the United States of America 111 (31) 11413ndash18
Sanchez Aurore Diego I Cattoni Jean-Charles Walter Jeacuterocircme Rech Andrea Parmeggiani Marcelo Nollmann and Jean-Yves Bouet 2015 ldquoStochastic Self-Assembly of ParB Proteins Builds the Bacterial DNA Segregation Apparatusrdquo Cell Systems 1 (2) 163ndash73
Sanchez Aurore Jeacuterocircme Rech Cyrielle Gasc and Jean-Yves Bouet 2013 ldquoInsight into Centromere-Binding Properties of ParB Proteins A Secondary Binding Motif Is Essential for Bacterial Genome Maintenancerdquo Nucleic Acids Research 41 (5) 3094ndash3103
Schumacher Maria A Nam K Tonthat Jeehyun Lee Fernando A Rodriguez-Castantildeeda Naga Babu Chinnam Anne K Kalliomaa-Sanford Irene W Ng Madhuri T Barge Porsha L R Shaw and Daniela Barillagrave 2015 ldquoStructures of Archaeal DNA Segregation Machinery Reveal Bacterial and Eukaryotic Linkagesrdquo Science 349 (6252) 1120ndash24
Sengupta Manjistha Henrik Jorck Nielsen Brenda Youngren and Stuart Austin 2010 ldquoP1 Plasmid Segregation Accurate Redistribution by Dynamic Plasmid Pairing and Separationrdquo Journal of Bacteriology 192 (5) 1175ndash83
Sergeacute Arnauld Nicolas Bertaux Herveacute Rigneault and Didier Marguet 2008 ldquoDynamic Multiple-Target Tracing to Probe Spatiotemporal Cartography of Cell Membranesrdquo Nature Methods 5 (8) 687ndash94
Shapiro L H H McAdams and R Losick 2009 ldquoWhy and How Bacteria Localize Proteinsrdquo Science 326 (5957) 1225ndash28
Shin Yongdae and Clifford P Brangwynne 2017 ldquoLiquid Phase Condensation in Cell Physiology and Diseaserdquo Science 357 (6357) httpsdoiorg 101126scienceaaf4382
Page 31
certified by peer review) is the authorfunder All rights reserved No reuse allowed without permission The copyright holder for this preprint (which was notthis version posted May 4 2020 httpsdoiorg101101791368doi bioRxiv preprint
Soumlding Johannes David Zwicker Salma Sohrabi-Jahromi Marc Boehning and Jan Kirschbaum 2019 ldquoMechanisms of Active Regulation of Biomolecular Condensatesrdquo Cell Biology bioRxiv
Stracy Mathew Marcin Jaciuk Stephan Uphoff Achillefs N Kapanidis Marcin Nowotny David J Sherratt and Pawel Zawadzki 2016 ldquoSingle-Molecule Imaging of UvrA and UvrB Recruitment to DNA Lesions in Living Escherichia Colirdquo Nature Communications 7 (August) 12568
Stracy Mathew and Achillefs N Kapanidis 2017 ldquoSingle-Molecule and Super-Resolution Imaging of Transcription in Living Bacteriardquo Methods httpsdoiorg101016jymeth201704001
Stracy Mathew Christian Lesterlin Federico Garza de Leon Stephan Uphoff Pawel Zawadzki and Achillefs N Kapanidis 2015 ldquoLive-Cell Superresolution Microscopy Reveals the Organization of RNA Polymerase in the Bacterial Nucleoidrdquo Proceedings of the National Academy of Sciences of the United States of America 112 (32) E4390ndash99
Strom Amy R Alexander V Emelyanov Mustafa Mir Dmitry V Fyodorov Xavier Darzacq and Gary H Karpen 2017 ldquoPhase Separation Drives Heterochromatin Domain Formationrdquo Nature httpsdoiorg101038nature22989
Surovtsev Ivan V and Christine Jacobs-Wagner 2018 ldquoSubcellular Organization A Critical Feature of Bacterial Cell Replicationrdquo Cell 172 (6) 1271ndash93
Taylor James A Cesar L Pastrana Annika Butterer Christian Pernstich Emma J Gwynn Frank Sobott Fernando Moreno-Herrero and Mark S Dillingham 2015 ldquoSpecific and Non-Specific Interactions of ParB with DNA Implications for Chromosome Segregationrdquo Nucleic Acids Research January httpsdoiorg101093nargku1295
Thrall Elizabeth S James E Kath Seungwoo Chang and Joseph J Loparo 2017 ldquoSingle-Molecule Imaging Reveals Multiple Pathways for the Recruitment of Translesion Polymerases after DNA Damagerdquo Nature Communications 8 (1) 2170
Toro Esteban and Lucy Shapiro 2010 ldquoBacterial Chromosome Organization and Segregationrdquo Cold Spring Harbor Perspectives in Biology 2 (2) a000349
Uphoff Stephan David J Sherratt and Achillefs N Kapanidis 2014 ldquoVisualizing Protein-DNA Interactions in Live Bacterial Cells Using Photoactivated Single-Molecule Trackingrdquo Journal of Visualized Experiments JoVE no 85 (March) httpsdoiorg10379151177
Van Heel M 1987 ldquoAngular Reconstitution A Posteriori Assignment of Projection Directions for 3D Reconstructionrdquo Ultramicroscopy 21 (2) 111ndash23
Visser Bryan J Mohan C Joshi and David Bates 2017 ldquoMultilocus Imaging of the E Coli Chromosome by Fluorescent In Situ Hybridizationrdquo Methods in Molecular Biology 1624 213ndash26
Walter J C and G T Barkema 2015 ldquoAn Introduction to Monte Carlo Methodsrdquo Physica A Statistical Mechanics and Its Applications httpswwwsciencedirectcomsciencearticlepiiS0378437114004798
Wang H X Yan H Aigner A Bracher N D Nguyen W Y Hee B M Long G D Price F U Hartl and M Hayer-Hartl 2019 ldquoRubisco Condensate Formation by CcmM in β-Carboxysome Biogenesisrdquo Nature 566 (7742) 131ndash35
Zawadzki Pawel Mathew Stracy Katarzyna Ginda Katarzyna Zawadzka Christian Lesterlin Achillefs N Kapanidis and David J Sherratt 2015 ldquoThe Localization and Action of Topoisomerase IV in Escherichia Coli Chromosome Segregation Is Coordinated by the SMC Complex MukBEFrdquo Cell Reports 13 (11) 2587ndash96
Zheng J and R D Hryciw 2015 ldquoTraditional Soil Particle Sphericity Roundness and
Page 32
certified by peer review) is the authorfunder All rights reserved No reuse allowed without permission The copyright holder for this preprint (which was notthis version posted May 4 2020 httpsdoiorg101101791368doi bioRxiv preprint
Surface Roughness by Computational Geometryrdquo Geacuteotechnique httpsdoiorg101680geot14p192
Zwicker David Markus Decker Steffen Jaensch Anthony A Hyman and Frank Juumllicher 2014 ldquoCentrosomes Are Autocatalytic Droplets of Pericentriolar Material Organized by Centriolesrdquo Proceedings of the National Academy of Sciences of the United States of America 111 (26) E2636ndash45
Zwicker David Anthony A Hyman and Frank Juumllicher 2015 ldquoSuppression of Ostwald Ripening in Active Emulsionsrdquo Physical Review E Statistical Nonlinear and Soft Matter Physics 92 (1) 012317
Zwicker David Rabea Seyboldt Christoph A Weber Anthony A Hyman and Frank Juumllicher 2016 ldquoGrowth and Division of Active Droplets Provides a Model for Protocellsrdquo Nature Physics 13 (December) 408
Page 33
certified by peer review) is the authorfunder All rights reserved No reuse allowed without permission The copyright holder for this preprint (which was notthis version posted May 4 2020 httpsdoiorg101101791368doi bioRxiv preprint
Figures
Figure 1 ParB is confined into spherical nano-condensates (A) Schematic representation of a ParB partition complex (red circle) ParB is represented by blue spheres the centromeric parS sequence by a red line and non-specific DNA (plasmid and bacterial chromosome) is represented by a grey curved line Three types of interactions have been reported ParB- parS (high affinity 2 nM) ParB-non-specific DNA (low affinity 03-05 microM for DNA fragments of 120-150bp) and ParB-ParB dimer (low affinity 03-1 microM) (Ah-Seng et al 2009 Sanchez et al 2015 Taylor et al 2015) (B) Partition complexes (N=990) were visualized by either widefield microscopy (first panel) or by PALM (second and third panels for raw localizations and reconstruction representations respectively) Magnified views of the two partition complexes are shown for clarity (panel 3) Panel 4 displays representative ParB partition complex reconstructions from other cells to exemplify the heterogeneity in shapes (C) Super-resolved images of ParB partition complexes were classified using single-particle analysis to overcome heterogeneity between single complexes ParB complexes of the most populated classes exhibited spherical shapes (D) A three-dimensional reconstruction of the ParB partition complex was obtained using the most populated classes Diameter was estimated by calculating the full width at half maximum Colors represent reconstruction density (highred lowblue) outer shell is represented in shaded red Right panel schematic representation of the ParB partition complex and estimation of ParB concentration based on the size of the complex and the number of ParB molecules measured experimentally (see Results and Methods) Measurements were performed in different biological replicates
Page 34
certified by peer review) is the authorfunder All rights reserved No reuse allowed without permission The copyright holder for this preprint (which was notthis version posted May 4 2020 httpsdoiorg101101791368doi bioRxiv preprint
Figure 2 Dynamic properties of ParB condensates (A) Representative image of a live cell (cell contour schematized in white) and trajectories of single ParB molecules (low-mobility blue high-mobility red) Right panels show magnified views of each ParB condensate with different low-mobility trajectories shown with different colors The slight spatial shifts between trajectories reflect partition complex movement during acquisition (Sanchez et al 2015) (B) Histogram of apparent diffusion coefficients for low- (blue) and high-mobility (red) trajectories n=156 (number of cells) N = 3205 tracks (C) Pairwise distance analysis of low-mobility trajectories Expectation for a homogeneous distribution is shown as a horizontal dashed line Right panels schematic representations of ParB proteins within (top) and outside (bottom) ParB condensates the grey matrix represents the DNA substrate n=156 (number of cells) (D) Representative example of a Fluorescence Recovery After Photobleaching experiment A single ParB-GFP condensate (red circle) was photobleached in a cell containing two condensates (E) The average intensity of photobleached ParB condensates (orange) increased over time with a concomitant and symmetric decrease in the fluorescence intensity of the unbleached condensate (green) This requires single ParB proteins to exchange between liquid and gas-like phases (right panel) Grayed shade represents standard error of the mean Dashed lines represent the behavior predicted from modeling in Figure S2 n=146 (number of cells) (F) Representative example of a fast time-lapse fluorescence movie Four ParB condensates can be seen to fluctuate and fuse during the movie (white line) Schematic representation of a fusion event is shown in the right panel Measurements were performed in different biological replicates (ngt14 fusion events) In panels A D and F solid white lines are used to represent cell contours
Page 35
certified by peer review) is the authorfunder All rights reserved No reuse allowed without permission The copyright holder for this preprint (which was notthis version posted May 4 2020 httpsdoiorg101101791368doi bioRxiv preprint
Figure 3 Centromeric sequences and ParB-ParB interactions are required for the nucleation and stability of ParB condensates (A) The movement of three hundred ParB dimers (grey disks) within a simulated cell was governed by free diffusion (1 micromsup2s) weak ParB-ParB dimer interactions (J=45 kT) high-affinity ParB- parS interactions and low-affinity interactions with the lattice Regardless of initial conditions ParB dimers formed a condensate in the presence of parS10 (gray blue) In contrast no condensate is formed in the absence of a nucleation sequence (green) Schematic representations are used to show the initial and final configurations (left and right panels) For simplicity parS+ refers to a simulation with parS10 (B) Representative single-molecule tracking experiment of ParB in absence of parS Low-mobility trajectories are shown in blue and high-mobility trajectories in red while the cell contour is schematized as a white line (C) Distribution of apparent diffusion coefficients for low-mobility (blue 50) and high-mobility trajectories (red 50) The distribution for a wild-type strain containing parS (same data as in Figure 2B) is shown as a dashed grey line for comparison n=209 (number of cells) (D) Pairwise distance analysis of low-mobility trajectories in absence of parS (green curve) in a ParB mutant impaired for parS binding (cyan curve) and in a ParB-ParB interaction mutant (blue curve) The expected curve for a homogeneous distribution is shown as a horizontal dashed line The distribution for a wild-type strain containing parS is shown as a dashed grey line for comparison (same data as in Figure 2C) Schematic representations of single-molecule ParB trajectories in the absence (top) and presence of parS (bottom) are shown in the panels on the right n=209 (number of cells) Measurements were performed in different biological replicates
Page 36
certified by peer review) is the authorfunder All rights reserved No reuse allowed without permission The copyright holder for this preprint (which was notthis version posted May 4 2020 httpsdoiorg101101791368doi bioRxiv preprint
Figure 4 The ParA ATPase is required for ParB condensates to remain stably separated during cell-cycle times (A) Representative kymograph displaying the trajectories of ParB condensates over cell-cycle times (white lines) Splitting of condensates is shown by red forks The fluorescence images of ParB condensates at three different times as well as the cell schematized outlines are shown for simplicity (B) Genetic construct used for the targeted degradation of ParA (C) Time course Western blot of ParA and ParB upon induction of ParA-ssra degradation Degradation time course was detected in two different gels using anti-ParA and anti-ParB antibodies (D) Representative time lapse experiment of a ParA-ssra strain without induction of ParA degradation Trajectories of ParB condensates (white dashed line) and a splitting event (white fork) are shown Scalebar represents fluorescence intensity Right panel schematic representation of a splitting event in the presence of ParA (E) Representative time lapse experiment of a ParA-ssrA strain upon induction of ParA-ssra degradation Dashed lines represent the trajectories of two ParB condensates A fork displays a fusion event between two ParB condensates Right panel schematic representation of this process Note that time scales in this assay are different from those in Figure 2D (see explanation in Figure S4) (F) Quantification of the average number of ParB condensates per cell in a ParA-ssra strain with (red circles) or without (blue circles) ParA degradation The induction of ParA degradation was initiated at time 0 Shaded areas represent standard deviation Note that the slight decrease in foci number (~20) without ParA degradation after overnight (ON) culture corresponds to the decrease in cell length (~20) (see Figure S4A) Numbers of cells are shown above plot Measurements were performed in different biological replicates Bottom panels Localization density histograms of ParB condensates along the cell longitudinal axis before (top) and 3 hours after inducing ParA degradation (bottom) (G) Distribution in the number of ParB partition complexes in wild-type versus ParA
Page 37
certified by peer review) is the authorfunder All rights reserved No reuse allowed without permission The copyright holder for this preprint (which was notthis version posted May 4 2020 httpsdoiorg101101791368doi bioRxiv preprint
ATPase deficient cells (ParA_K120Q) The mean number of partition complexes in wild-type cells grown in LB was 30plusmn11 (N = 105 cells) versus 18plusmn09 in the ParA ATPase mutant strain (N = 124 cells) Insets show examples of segmented cells (black) with ParB partition complexes (green) Scale bar is 1microm
Page 38
certified by peer review) is the authorfunder All rights reserved No reuse allowed without permission The copyright holder for this preprint (which was notthis version posted May 4 2020 httpsdoiorg101101791368doi bioRxiv preprint
Supplementary Figures
Figure S1
S1A To control for fixation artifacts we built the histogram of localization of ParB clusters along the main axis of the cell ParB clusters in fixed cells were localized near the quarter positions of the cell axis mirroring the localization pattern of partition complexes from live experiments (Le Gall et al 2016) Only clusters of small cells with a length of less than 27 microm were selected to avoid cells with more than 2 ParB complexes that would confound the overall localization pattern N=990 (number of clusters) S1B Histogram of the standard deviations of the localization positions from single molecules The mean of the standard deviation of localization which provides an estimate of the localization precision is (mean std) N=990 (number of clusters)4 6 nm 1 plusmn plusmn S1C Histogram of single ParB-mEos2 localizations per cluster The average number of localizations per cluster is (mean std) N=990 (number of clusters)4 578 plusmn plusmn
Page 39
certified by peer review) is the authorfunder All rights reserved No reuse allowed without permission The copyright holder for this preprint (which was notthis version posted May 4 2020 httpsdoiorg101101791368doi bioRxiv preprint
S1E Examples of raw clusters for the eight most represented classes which represent more than 50 of the total number of clusters (N=990) S1F Full width at half maxima (reconstruction size) extracted from the 3D reconstructions obtained from each class average The average reconstruction size is (mean 25 nm 94 plusmn 6
std)plusmn S1G-I Quantitative assessment of particles shape Roundness sphericity and aspect ratios parameters of individual raw particles were calculated within each class Particle roundness was computed as the ratio of the average radius of curvature of the corners of the particle to the radius of the maximum inscribed circle while sphericity was computed as the ratio of the projected area of the particle to the area of the minimum circumscribing circle (Zheng and Hryciw 2015) In addition we generated simulated 3D localizations homogeneously distributed within a sphere and reconstructed projected density images to obtain a reference of the shape characteristics we should expect for a perfect sphere taking into account experimental localizations errors The results of these analyses reveal that raw particles display highly symmetric shapes (Panel H) with very little roughness in their contour (Panel G) The residual deviations of some classes from a perfect sphere likely originate from shape fluctuations over time Finally we computed the aspect ratio of each particle in each class (Panel I) In this case raw particles were aligned by using MRAMSA (van Heel Portugal and Schatz 2016) their sizes were estimated in x and y by measuring the full width at half maximum and the aspect ratio was calculated as a ratio between the particle sizes in the x and y dimensions This analysis shows that the aspect ratio was on average close to one as expected for spherical particles
Page 40
certified by peer review) is the authorfunder All rights reserved No reuse allowed without permission The copyright holder for this preprint (which was notthis version posted May 4 2020 httpsdoiorg101101791368doi bioRxiv preprint
Figure S2
S2A Representative images of live cells and single ParB trajectories (low-mobility blue high-mobility red) Processed bright field images are shown in white Bright field images are not drift-corrected thus in some fields of view trajectories may appear shifted with respect to cell masks Low-mobility trajectories tend to cluster while high-mobility trajectories display a dispersed nucleoid localization
S2B Sub-cellular localization of ParB tracks along the long axis of the cell
Apparent diffusion coefficients for high- and low-mobility species
The apparent diffusion coefficient of proteins bound to DNA non-specifically was
reported to range between 03 and 07 μm2s (Garza de Leon et al 2017 Stracy and
Kapanidis 2017 Stracy et al 2016) These values are consistent with the high-mobility
species corresponding to ParB particles interacting non-specifically with chromosomal DNA
The measured apparent diffusion coefficient (D) comprises cell confinement
motion blurring and localization uncertainty (Stracy et al 2016) Thus immobile molecules
have a non-zero D due to the localization uncertainty in each measurement σloc which
manifests itself as a positive offset in the D value of ~σloc2Δt (Δt is the exposure time)
By using the localization uncertainty and exposure times in our experimental conditions
(σloc ~15nm and Δt = 8ms) we estimate a non-zero offset in the apparent diffusion
coefficient of ~002 μm2s exactly our estimation of D for the low-mobility species
Previous studies reported an apparent diffusion coefficient of ~01 μm2s for proteins bound
specifically to DNA (Stracy and Kapanidis 2017 Stracy et al 2016 Zawadzki et al 2015
Thrall et al 2017) This D was similar to that of chromosomal DNA itself (~011 μm2s) as
reported by the D of LacITetR specifically bound to DNA (Garza de Leon et al 2017
Normanno et al 2015) These studies however used different experimental conditions
(σloc~40 nm and Δt = 15ms) leading to a D for immobile particles of ~01 μm2s (Stracy et
al 2016 Zawadzki et al 2015 Garza de Leon et al 2017) Thus we conclude that the D of
Page 41
certified by peer review) is the authorfunder All rights reserved No reuse allowed without permission The copyright holder for this preprint (which was notthis version posted May 4 2020 httpsdoiorg101101791368doi bioRxiv preprint
our low-mobility species is consistent with previous measurements for the apparent
diffusion coefficient of proteins bound specifically to their DNA targets
Calculation of residence time in ParB condensates
In Figure 2E are shown the fluorescence intensity profiles in time from both ParB
condensates after the photo-bleaching of the condensate that we number by 1 We first
notice that the foci intensity curves are symmetric (see Figure S2C below) by doing a simple
manipulation of the data is the symmetric curve of according to the (t) 2I (t)I1 = infin minus I1 I1
asymptotic intensity value I I (t ) I (t ) 07 infin = 1 rarr infin = 2 rarr infin ≃
S2C Fluorescence intensity curves of photo-bleached (orange ) and unbleached (t)I1 condensates (green ) The curve (red) is symmetric to according to the (t)I2 (t)I
1 (t)I1 asymptotic value It shows the symmetrical behavior I I (t ) I (t ) 7 infin = 1 rarr infin = 2 rarr infin ≃ 0 between both condensates which we used in the model developed here
We therefore describe the FRAP experiments by the following simple kinetic model
on the distribution of ParB proteins in both condensates and the rest of the cytoplasm
S2D Schematic representation of the model parameters ( respectively) is the ratio of the(t) S1 (t) S2 average number of fluorescent ParB-GFP proteins in the photo-bleached (un-bleached resp)
condensate is the ratio of the average number of fluorescent ParB-GFP proteins outside of the(t) σ condensates Due to symmetry we consider and k kk1in = 2in = in k kk1out = 2out = out
This model is described by the following equations
Page 42
certified by peer review) is the authorfunder All rights reserved No reuse allowed without permission The copyright holder for this preprint (which was notthis version posted May 4 2020 httpsdoiorg101101791368doi bioRxiv preprint
where and are respectively the ratios of average number of ParB proteins in (t)S1 (t)S2
the condensates (droplets) and after photobleaching and σ(t) the ratio of average F 1 F 2
number of ParB proteins in the cytoplasm after photobleaching All these quantities were
normalized by (see also below) in order to directly compare the experimental (0)S2
normalized intensities and with the model variables and Rates ( (t)I1 (t)I2 (t)S1 (t)S2 kiin
resp) ( ) count for the probability per unit of time to enter (exit resp) the kiout i = 1 2
condensate Note that here we assume that the fluorescence intensity is proportional toF i
the number of ParB proteins and that there are no stericexclusion effects among ParB
Due to the symmetric behavior of the FRAP signals for each condensate (Figure S2C) we
assume that the kinetic rates are the same for each condensate Therefore the F i
equations write
Starting from these assumptions we first study the asymptotic limit of eq 2 where we
notice from Figure S2C that In this case it is simple to (t ) S (t ) S 7S1 rarr infin = 2 rarr infin = infin ≃ 0
notice that
Live data provided an estimation of this ratio (Figure 2C) k 5 S σ kinfin infin = in out ≃ 4
We then write the explicit time dependence of and As intensities have (t)S1 (t)S2 (t) σ
been normalized by the natural photo-bleaching we can first use the conservation of the
total number of proteins just after FRAP photobleaching
Page 43
certified by peer review) is the authorfunder All rights reserved No reuse allowed without permission The copyright holder for this preprint (which was notthis version posted May 4 2020 httpsdoiorg101101791368doi bioRxiv preprint
It is useful to consider that the same condition is valid all over the acquisition (ie we also
assume that degradation of ParB is negligible during the 5min-experiment) therefore at
long times
The conservation of the total particle number (ratio) in eq 4 allows us to eliminate the
equation on the variable σ from the equations 2 and write the new set of equations
General solutions of the systems of equations (6) is as follows
(7)
where equations (6) are still symmetrical for the 1 harr 2 exchange To perform a fit of the
date it is useful to consider the symmetric and antisymmetric variables = (t)Splusmn (t)S1 plusmn (t)S2
and write
The first equation (8) (in accordance with solutions in eq 7) gives the simple exponential
solution
(9)
A simple exponential fit (see Figure S2E below) already provides
s kout = (00100plusmn00004) minus1
Page 44
certified by peer review) is the authorfunder All rights reserved No reuse allowed without permission The copyright holder for this preprint (which was notthis version posted May 4 2020 httpsdoiorg101101791368doi bioRxiv preprint
S2E Anti-symmetric intensity curve (blue) and associated fitted curve(t) (t) S (t)Sminus = S1 minus 2
(red)(t) (0) eSminus = Sminusminusk tout
or reciprocally a residence time in the focus
and
By using the knowledge of the previously estimated parameters and one can kout Sminus (t)
still exploit the solution of (in eq 7) to fit the remaining parameters and S2 (t) kin S+ (t) We fitted the data with the right side of the following rewritten equation (see fit in Figure
S2F)
S2F Intensity curve (purple) and associated fitted curve (see eq 10)(cyan)(t) (t))e(S2 minus Sinfink tout
From this fit we obtain and The reciprocal of s kin = (0044plusmn0012) minus1 97plusmn018 S+ (0) = 0 represents the residence time of ParB in the cytoplasm kin
3 sτ in = ~ 2 Remarkably from this analysis and by using equation 3 we find a ratio of rates
Page 45
certified by peer review) is the authorfunder All rights reserved No reuse allowed without permission The copyright holder for this preprint (which was notthis version posted May 4 2020 httpsdoiorg101101791368doi bioRxiv preprint
kinkout
= (44 3)plusmn 1
which provides an estimate (~90) of the proportion of ParB proteins confined within ParB
condensates in good agreement with experimental results (~95) The agreement between
theoretical and experimental curves can be verified by plotting eqs (7) together with the
experimental datasets (Figure 2F)
G
H
S2G Integrated fluorescence intensity of two ParB condensates before and after fusion Dots represent the integrated ParB condensate intensity before (blue) and after (red) fusion Black line and the shaded regions represent median and one standard deviation respectively The average increase in fluorescence intensity upon fusion was 15plusmn01 S2H Integrated fluorescence intensity of a ParB condensate before and after splitting Dots represent the integrated ParB condensate intensity before (blue) and after (red) Black lines and the shaded regions represent median and one standard deviation respectively The average decrease in fluorescence intensity upon splitting was 07plusmn01
Page 46
certified by peer review) is the authorfunder All rights reserved No reuse allowed without permission The copyright holder for this preprint (which was notthis version posted May 4 2020 httpsdoiorg101101791368doi bioRxiv preprint
Figure S3
The Lattice-Gas model
The ParB proteins in the nucleoid were modeled by a Lattice Gas (LG) which is the
paradigmatic system of particles displaying attractive contact interactions (Binney et al
1992) It is important to note that the LG model presents a first-order phase transition
between a gas phase in which the particles diffuse homogeneously throughout the lattice
and a liquid-gas coexistence phase in which liquid droplets coexist with diffusing particles in
the gas phase An exchange of particles between the two phases maintains a dynamic
equilibrium As we will see below the metastable region of the gas can account for the
experimental observations on ParBS We use the LG as a qualitative model for ParB in the
nucleoid in order to offer a proof of concept of the mechanism of formation of the ParBS
complexes
For 1d 2d square and 3d simple cubic lattices the LG coordination number is q = 2d
Recent work (David et al 2018) shows that a 1D LG model on a fluctuating polymer like DNA
can undergo phase separation and that such a model can after averaging over the polymer
conformational fluctuations be assimilated approximately to a LG with short range
(nearest-neighbor) interactions on a lattice with an effective perhaps fractal coordination
number between 2 and 6 (G David PhD Thesis in preparation) The increase in
coordination number from the value of 2 expected for a linear polymer is due to the
combined effects of nearest-neighbor (spreading) interactions along the polymer and
bridging interactions between proteins widely separated on the polymer but close in space
Here for simplicity and purposes of illustration of the basic mechanism we adopt a simple
cubic (sc) lattice
The ParB proteins were modeled by particles with a diameter which were 5 nma =
located on the nodes of a simple cubic lattice representing segments of the nucleoid on
which ParB is able to bind to or unbind from The distance between nearest-neighbour sites
was as large as the size of a particle ie The lattice was chosen to display the nm5
dimension of a bacterial nucleoid and (equivalent to 5 μmLx = Ly = 0 μmLz = 2
and ) The total number of binding sites in the lattice was then00 aLx = Ly = 1 00 aLz = 4
To match the experimentally determined number of ParB proteins per10N s = 4 6
condensate the particle number was fixed at 300 Thus the particle density was N ρ = N s
very low ( ) placing the LG model in a configuration where only a first-order phase ρ ~ 10minus4
separation transition can occur Particles could interact between each other when they are
at adjacent sites on the sc lattice (nearest neighbour contact interaction) with a magnitude
For the LG model the total energy of the system is where isJ ε ϕε = minus J sum
ltijgtϕi j ϕi
the occupation variable at site i taking the value 1 if the site i is occupied or 0 if not The sum
runs over the pairs of nearest-neighbour sites ltijgt of the latticeΣ
Page 47
certified by peer review) is the authorfunder All rights reserved No reuse allowed without permission The copyright holder for this preprint (which was notthis version posted May 4 2020 httpsdoiorg101101791368doi bioRxiv preprint
The phase diagram of the LG model
The sc LG model displays only 3 parameters the particle density the temperature ρ
(or equivalently ) and the coupling between particles Despite its minimalism aspectT β J
the LG model is a paradigmatic model for phase transitions and displays a rich phase
diagram (Binney et al 1992) The metastable region is bound by the coexistence and the
spinodal curves where the LG can transiently remain in a metastable gas or liquid state
before crossing a free energy barrier to reach a stable coexistence state The time required
to cross this free energy barrier can be very long but their transition rate can also be
considerably increased by a nucleation factor such as a parS site the effect of which can be
modeled within the LG model by particles fixed on the lattice by a strong binding potential
The phenomenology observed in the metastable region is the same as that observed
experimentally for a ParB condensate without a parS site ParBs were homogeneously
distributed in the cell while with parS sites we observed formation of ParB droplets The
parS sites catalyzed the condensation of ParB droplets
Before presenting MC simulations for a finite size system representing the DNA in
the bacterial volume it is instructive to present the thermodynamics of liquid-gas phase
separation (infinite volume limit) Although no analytical solution exists for the sc LG with
nearest-neighbour interactions mean field theory provides an approximate analytical
solution that gives a global perspective For a fixed value of the coexistence and
spinodal curves are usually presented in the density-temperature plane ( ρ T) In the present
case it is more useful to fix the temperature at its room value T r then plot the coexistence
and spinodal curves in the ( ρ J ) plane with J measured in units of the thermal energy kBT r
The mean field phase diagram is presented in Fig S3A For the LG model we note the exact
(particle-hole) symmetry about the critical density where the coexistence and
spinodal curves coincide
Page 48
certified by peer review) is the authorfunder All rights reserved No reuse allowed without permission The copyright holder for this preprint (which was notthis version posted May 4 2020 httpsdoiorg101101791368doi bioRxiv preprint
Fig S3A The mean field coexistence and spinodal curves are presented in the
density-coupling plane (ρ J) with the homogeneous fluid metastable and unstable regions
indicated
At biological density and room temperature the homogeneous (possibly ρ ~ 10minus4
meta or unstable) system is in the extreme low-density regime Although the mean field
prediction for the coexistence curve is asymptotically exact in this regime the same is not
true for the mean field spinodal curve In this limit it is possible however to perform an
asymptotically exact low density (virial) expansion that leads to a simple expression for the
system free energy from which the pressure and chemical potential can be obtained The
coexistence curve is found by equating the pressure and chemical potential in the gas and
liquid phases which are in equilibrium The spinodal curve is determined by the divergence
of the isothermal compressibility At low density the gas branch coexistence (coex) ρ≪ 1
and spinodal (sp) curves are given by (G David in preparation 2019)
We present in Fig S3B the asymptotically exact low-density results for the
coexistence and spinodal curves in the density-coupling plane ( ρ J) The above limiting low
density forms indicate that the coexistence and spinodal curves become straight lines in a
log-linear plot
Fig S3B The asymptotically exact low-density results for the coexistence (red) and spinodal
(blue) curves in the density-coupling plane (ρ J) The upper and lower limits of metastability
in (black horizontal lines) at are shown ( ) The07J low = 3 42Jup = 7
homogeneous fluid phase is stable below the coexistence curve metastable between the
coexistence and spinodal curves and unstable above the spinodal curve
Page 49
certified by peer review) is the authorfunder All rights reserved No reuse allowed without permission The copyright holder for this preprint (which was notthis version posted May 4 2020 httpsdoiorg101101791368doi bioRxiv preprint
A system prepared above the coexistence curve will at equilibrium show phase
separation between a low density gas phase with and a high density liquid
phase with (by particle-hole symmetry) If the system is prepared
in a metastable gas state the time needed to nucleate the phase transition depends on the
distance from the coexistence and spinodal curves since the nucleation barrier decreases as
the spinodal curve is approached where it vanishes
We performed Monte Carlo simulations of the LG in contact with a thermal bath
using the standard Metropolis algorithm (Walter and Barkema 2015) In the following
is the inverse of thermal energy where T is the absolute temperature and(k T ) β = 1 b kbthe Boltzmann constant (in the following all energies are expressed in units of the thermal
energy thus ) The Monte Carlo procedure corresponding to a unit time step is T kb β = 1
the following
1 Choose a particle at random
2 Propose a move to a random empty site of the lattice
3 Calculate the energy difference between the initial and final stateϵ Δ = εf minus ε0
4 If the displacement is accepted otherwise the displacement is accepted ϵ Δ lt 0
with a probability P = eminusβΔϵ
5 Return N times to step 1
The particle relocation of the step 2 defines the order of the time unit of the Monte Carlo
simulation as approximately one second ParB proteins diffusing at (Figure sim1 μm sD 2 minus1
2B) can move at any point on a nucleoid after one second μm1 2
We first used simulations to estimate the range of the interaction term for which J
the LG model is found in the metastable region ie between the coexistence and the
spinodal lines (see Figure S3B and S3C below) To find these lines and define a we J
calculated the energy of the system at equilibrium as a function of with increasing and J
decreasing variations Thus the signature of the first-order transition was visible with a
hysteresis cycle and the range of for which the LG was metastable was bound by the two J
jumps of energy the jump at low corresponding to the coexistence curve and the jump J
at large corresponding to the distance from the spinodal curve at which the nucleation J
time in the presence of a free energy barrier becomes comparable to the simulation time
To identify the hysteresis cycle we increased and decreased by steps of J
After incrementing by (or depending on initial conditions) theJ 005Δ = 0 J JΔ J minus Δ
system was first thermalized to the new coupling value The sampling of the energy was
subsequently performed at intervals long enough to consider that the sampling was not
correlated After 8104 independent samplings was increased to its new valueJ
We observed different regimes (see Figure S3C below)
I In the case of a weak initial the system was first in a gas phase (the interactions J
are too weak to maintain a cohesive phase) In such a configuration the system
favors a homogeneous distribution of particles to maximize entropy with very few
Page 50
certified by peer review) is the authorfunder All rights reserved No reuse allowed without permission The copyright holder for this preprint (which was notthis version posted May 4 2020 httpsdoiorg101101791368doi bioRxiv preprint
interactions between the particles Then by crossing the coexistence line the gas
state became metastable but the system remained in that state until it reached the
point before the spinodal line where nucleation time became comparable to the
simulation one and the gas phase was depleted in favour of the liquid-gas
coexistence phase
II In the case of a high initial the system was first in the liquid-gas coexistence J
phase the particles condensed locally in a droplet and increased the number of
nearest-neighbour interactions The droplet coexisted with a small fraction of freely
diffusing particles Then by approaching and then crossing the coexistence line the
system switched smoothly to a gaseous phase state This protocol defines a
hysteresis cycle determined by simulations for a finite system that delimits the value
of J for which the LG is effectively in the metastable phase Because of the protocol
this range depends on the time scale of the simulations We note furthermore that
fluctuations in finite size systems are more important than in an infinite one
(thermodynamic limit) and therefore the range of effective metastability determined
by simulations should lie within the true thermodynamic range as is the case
S3C Variation of the energy at the equilibrium of the Lattice-Gas model according to the
magnitude of the interaction between particles ( ) in the presence of parS For weak s J J
the system is in the gaseous state while for high s the system is in the liquid state The J
transition from one state to another takes place in a metastable region delimited by
coexistence and spinodal lines In this region the state of the system depends on the initial
state either gaseous (blue curve) or liquid (red curve) We observed a hysteresis cycle which
is characteristic of a first-order phase transition of the LG model between the two states For
the simulations shown on Figure 3A we used =45J
The coupling range for setting the LG in the metastable regime was estimated as
This range falls as it should in the thermodynamic range9 73 lt J lt 4
Page 51
certified by peer review) is the authorfunder All rights reserved No reuse allowed without permission The copyright holder for this preprint (which was notthis version posted May 4 2020 httpsdoiorg101101791368doi bioRxiv preprint
computed above (see Fig S3B) In the dynamic simulations of the main text we chose the
value close to the estimated upper limit in order to be as close as possible to the 5J = 4
experimental value of 90 of ParB inside the droplets ( (Sanchez et al 2015) and here) This
value is in semi-quantitative agreement with other simulation works on ParB-ParB
(Broedersz et al 2014 David et al 2018) At the gas density on the thermodynamic
coexistence curve is very low (see Fig S3A) and the liquid density was very
close to 1 which leads to 98 of ParB inside the droplets We expect however simulations
on finite size systems to show quantitative differences with respect to the thermodynamic
limit because of boundary effects and enhanced fluctuations
Effect of parS on the nucleation
The LG provides a proof of concept of the physical mechanisms at work in the
formation of ParB droplets in the metastable region of the liquid-gas coexistence phase the
nucleation factor parS site catalyzes the formation of a ParB droplet To show this effect we
first thermalized the system from a random distribution of ParB on the nucleoid
(corresponding to the absence of coupling ie ) to the coupling of the simulation J = 0
At time we monitored the time evolution of and the number of ParB in5 J = 4 t = 0 ε
the droplet (Figure 3A) The parameters were the same as before and we averaged over
250 different thermal histories
We checked two different conditions (i) without a parS sequence (ii) with a parS
sequence which were modeled by 10 lattice sites with high affinity for ParB proteins (in
practice 10 ParB were always fixed on these sites after a short transitional time) As a
control we also performed a simulation (iii) with an initial start where all the particles
packed in a single droplet centered on a parS sequence Convergence towards the
equilibrium state was achieved in this case by simple relaxation and not by nucleation
The gas phase is characterized by small values of the energy (the particles are 0 ε ~
dispersed in the lattice) while in the liquid-gas coexistence phase the condensation of the
particles increases the number of interactions and therefore the energy ltε lt 0
In the case (i) without parS the system remained at a small equilibrium value
until the final moment of the simulations ie theminus 4 10ε asymp 2 3 10 MC stepstf = 3 7
condensation into a droplet was not observed In the case (ii) the system was initially at the
small value of as in case (i) but was followed by another plateau between minus 4 10ε = 2 3
and corresponding to the binding of ParB to the 10 parS sites Thet = 104 MC steps105
energy decreased from to which corresponds to the interactions minus 4ε asymp 2 0 10minus 8 3
between the ten ParB fixed side by side on the parS At the time the 10 MC stepst ~ 3 5
system switched from a high energy value to a low value corresponding to the formation of
a droplet around parS At larger times the signal saturated at 10 MC stepst gt 3 5
indicating that the droplet is stable Thus the addition of parS reduced theminus 650 10ε ~ 2 3
nucleation time by at least two orders of magnitude These observations correspond to
Page 52
certified by peer review) is the authorfunder All rights reserved No reuse allowed without permission The copyright holder for this preprint (which was notthis version posted May 4 2020 httpsdoiorg101101791368doi bioRxiv preprint
experimental phenomenology without parS ParB is homogeneously distributed throughout
the cell whereas with parS ParB forms protein condensates
Case (iii) is the control simulation with the fully packed droplet It took at large
times the same value of as case (ii) after a slight decrease corresponding to the escape ε
from the cluster of particles in the gas phase coexisting with the droplet We also monitored
the number of particles inside the droplet (Figure 3A) We observed ~80 of the particles in
the droplet which is in semi-quantitative agreement with experiments (~90 in (Sanchez et
al 2015) and 95 from Figure 2B) In conclusion the ParB complex behaves similarly to a
system in the metastable region of the liquid-gas coexistence phase (Figure S3A) The
addition of parS acting as a nucleator for ParB condensation significantly reduces the time it
takes to form a ParB droplet
To assess the effect of interaction strengths of ParB particles on their nucleation we
performed additional simulations with lower or higher values of J for our two initial
conditions (a gas-like and liquid-like state) When the system was first in a gas phase with
weak interaction strengths (J = 35 kT Figure S3D) particles were unable to form
condensates regardless of the presence of parS sites Without parS sites particles favored a
homogeneous distribution while in presence of parS sites particles equilibrated to a state
with only ParB particles bound specifically to the centromeric sequence In the initial
conditions where ParB particles were released from a liquid-like state the system
equilibrated to a final state where we did not observe nucleation but rather ParB particles
specifically bound to the centromeric sequence
In the case of strong interaction strengths (J = 6 kT Figure S3E) with or without parS
sites particles initially in a gas-like state immediately started forming small droplets (hence
low energy values at initial conditions) until a single large droplet prevailed over the others
In presence of centromeric sequences no binding of ParB to parS was visible due to the fast
local aggregation of ParBs at short timescales giving rise to energy variations of the same
order of magnitude In the case where ParB particles were released from a liquid-like state
particles remained in this state throughout the simulation timescales used here Overall
these simulations highlight the range of interaction strengths required for ParB to nucleate
specifically at parS For weak ParB-ParB interactions (low J) ParB particles are unable to
form a condensate regardless of the presence of centromeric sequences For strong
ParB-ParB interactions (high J) ParB particles nucleate spontaneously independently of the
presence of parS sequences and therefore of the plasmid to segregate A balance of
ParB-ParB interactions strengths and the presence of the centromeric sequence are
therefore both essential for the partition complex to form and to function in plasmid
partitioning
The minimalist model presented in this section explains the basic phenomenology of
our system however it may fail to explain more complex scenarios for which new more
complex models will need to be devised
Page 53
certified by peer review) is the authorfunder All rights reserved No reuse allowed without permission The copyright holder for this preprint (which was notthis version posted May 4 2020 httpsdoiorg101101791368doi bioRxiv preprint
S3D-E Monte-Carlo simulations of the Lattice-Gas model for weak (left panel) and strong (right panel) interaction strengths between ParB particles (D) Weak ParB-ParB interactions (J=35 kT) and high-affinity ParB-parS interactions are considered here Regardless of initial conditions (gas or liquid-like state) ParB proteins are unable to form a condensate in the presence of parS10 (gray blue) and the system equilibrates to a state where only ParBs bind specifically to the centromeric sequences (E) In contrast when strong ParB-ParB interactions (J=6 kT) are considered small droplets immediately appear and nucleate into a single larger condensate independently of the presence or absence of a nucleation sequence (blue and green curves respectively)
Page 54
certified by peer review) is the authorfunder All rights reserved No reuse allowed without permission The copyright holder for this preprint (which was notthis version posted May 4 2020 httpsdoiorg101101791368doi bioRxiv preprint
Nucleation of the partition complex with decreasing number of parS sites
To study the influence of the number of parS sites in the speed of nucleation we
performed simulations with a variable number of parS sites ( nparS= 1 to 10) We observe
nucleation for all values of n parS with n parS = 1 and nparS = 2 displaying nucleation times (τ)
exceeding the range of MC times reported in the Main Text (see Figure S3F below)
However the nucleation time τ( nparS) follows a power law such thatτ( nparS) ~ 1n parS sup2 (see
inset) that can be used to extrapolate the nucleation times for n parS = 1 and n parS = 2 Overall
these data support the finding of Broedersz et al (Broedersz et al 2014) that a single parS
site is sufficient to nucleate a ParB condensate and additionally indicate that the nucleation
of ParB condensates is accelerated by the number of parS sequences per plasmid
S3F Energy as a function of Monte Carlo time for Lattice-gas simulations using different numbers of parS sites (nparS) Nucleation can be detected by a terminal decrease in the energy Inset Nucleation time (τ) versus n parS Red dashed line shows a fit to τ(n parS) = An parSsup2 where A is a constant
Low-mobility ParB trajectories in the absence of parS In spt-PALM experiments we observed an unexpected low-mobility ParB population
with the strain lacking natural parS sequences The simplest explanation for this result is
that in the absence of parS low-mobility ParB tracks correspond to ParB dimers bound to
chromosomal sequences mimicking parS (hereby parS) This interpretation suggests that in
wild-type strains ParB molecules can be in either of three states (1) in a lsquogas-likersquo state
where they move through the nucleoid with low-affinity interactions with non-specific DNA
(2) in a condensed state where they interact specifically with parS and with other ParB
dimers (3) in a transient DNA bound state where they can remain bound to other
chromosomal sequences (such as cryptic parS ) but without interacting with other ParB
dimers
Page 55
certified by peer review) is the authorfunder All rights reserved No reuse allowed without permission The copyright holder for this preprint (which was notthis version posted May 4 2020 httpsdoiorg101101791368doi bioRxiv preprint
To test this hypothesis we searched the Ecoli chromosome for sequences displaying
homology to the parS motif (TGGGACCACGGTCCCA (Pillet et al 2011)) using FIMO
(httpmeme-suiteorgtoolsfimo)
S3G Results of the FIMO analysis for parS mimicking sequences in the Ecoli MG1655
genome
This analysis shows that there are indeed tens of sequences displaying only 2 or 3
mutations in the consensus parS sequence ParB binds nonspecific DNA with an affinity of
250nM and parS with an affinity of 25nM Introduction of 2-3 mutations in the consensus
parS sequence changes the affinity of ParB from 6 and 250nM depending on the position of
the nucleotide change (Pillet et al 2011) Thus tens of cryptic parS sequences exist that
could be populated when the population of ParB in the gas-like state is abundant
Next we performed simulations to explore whether cryptic parS sequences could
get occupied in the absence of the ten natural copies of parS in the F-plasmid For this we
used our Lattice-gas model to measure the occupancy of single copies of parS and varied the
the energy of interaction between ParB and parS (see below)
S3H Occupation of single parS sites for different interaction energies as a function of
Page 56
certified by peer review) is the authorfunder All rights reserved No reuse allowed without permission The copyright holder for this preprint (which was notthis version posted May 4 2020 httpsdoiorg101101791368doi bioRxiv preprint
Monte-Carlo time
ParB-parS interactions with affinities between 6-200nM would have energies
between 46 and 02 kT in our simulations (0 kT representing the baseline for nsDNA
interactions) Thus these simulations show that cryptic parS sites would be occupied
(0-50) in absence of the 10 wildtype high-affinity parS sequences explaining the
persistence of low-mobility unclustered trajectories under these conditions
Finally we performed sptPALM experiments on a ParB mutant with reduced
parS -binding ability to test whether low-mobility trajectories corresponded to ParB
molecules bound to cryptic chromosomal parS sequences We observed a reduction in the
low-mobility population from 50 in the strain lacking parS to 30 in the mutant with
reduced parS binding ability (Figure S3I) Importantly residual low-mobility trajectories in
this ParB mutant failed to cluster (Figure 3D)
S3I Distribution of apparent diffusion coefficients for low- (blue 30) and high-mobility
trajectories (red 70) for a ParB mutant impaired in parS binding (pJYB224DLT3997) The
distribution for a wild-type strain (same data as in Figure 2B) is shown as a dashed grey line
for comparison N=7453 tracks
This new interpretation explains all our experimental observations (1) in wild-type
cells ParB dimers in the gas-like fraction can stably bind and nucleate at the F-plasmid
because it harbours multiple high-affinity contiguous parS sequences This gives rise to
low-mobility clustered tracks observed by spt-PALM In these conditions the proportion of
ParB dimers in the gas-like state is extremely small therefore lower-affinity sparsely
distributed parS sequences do not get populated (2) In contrast in the absence of the 10
wildtype parS sequences a large number of ParB dimers in the gas-like phase can occupy
the lower-affinity sparsely-distributed parS chromosomal sites giving rise to low-mobility
unclustered tracks
Page 57
certified by peer review) is the authorfunder All rights reserved No reuse allowed without permission The copyright holder for this preprint (which was notthis version posted May 4 2020 httpsdoiorg101101791368doi bioRxiv preprint
Figure S4
B
S4A Average cell length and average number of ParB condensates per cell during time-lapse
imaging of the ParA-ssrA strain (pCMD6DLT3469) without induction of ParA degradation
The decrease in the average number of foci per cell observed after one night is due to a
change in cellular metabolism as reflected by the decrease in the average cell length
presumably due to entrance into stationary phase Shaded areas represent standard
deviation
S4B Distribution of partition complex mean intensities at t = 0h (top panel mean intensity
29plusmn09) and 3h after ParA degradation in cells where fusion occurred (bottom panel mean
intensity 49plusmn23) Insets show a typical field of view Cells are shown in black and white
and ParB partition complexes in green Scale bar is 1microm
Time-scales for the observation of ParB condensate fusion in Figures 2 and 4
Data presented in Figures 2 and 4 were acquired under very different experimental conditions
In Figure 2 we used fast time-lapse microscopy (50 ms between frames) to observe fusion of ParB condensates in single cells From these observations we found that fusion events occur rapidly (~5plusmn3 s) and perhaps more critically were in all cases reversible (Ngt14) With wildtype levels of ParA the subcellular position of ParB condensates fluctuates rapidly (~few seconds timescale) (Sanchez et al 2015) Thus in wildtype cells the random encounter of rapidly fluctuating ParB condensates leads to condensate fusion and the presence of endogenous levels of ParA ensures their subsequent separation
In Figure 4 we show that the average number of ParB condensates per cell decreases slowly (over tens of minutes) and irreversibly when ParA is gradually degraded These measurements were performed every 30 minutes thus transient and rapid fusion events (as observed in Figure 2) could not be detected due to the sparse and ensemble
Page 58
certified by peer review) is the authorfunder All rights reserved No reuse allowed without permission The copyright holder for this preprint (which was notthis version posted May 4 2020 httpsdoiorg101101791368doi bioRxiv preprint
sampling In these experiments ParA degradation is never complete as it competes with ParA expression therefore a minimal cellular concentration of ParA may be required to maintain ParB condensates separated at long time-scales
Page 59
certified by peer review) is the authorfunder All rights reserved No reuse allowed without permission The copyright holder for this preprint (which was notthis version posted May 4 2020 httpsdoiorg101101791368doi bioRxiv preprint