atropisomerization of di-para-substituted propyl- bridged ... · 1 atropisomerization of...
TRANSCRIPT

1
Atropisomerization of di-para-substituted propyl-
bridged biphenyl cyclophanes
Jürgen Rotzler†a, Heiko Gsellinger†a, Angela Bihlmeier†b,c, Markus Gantenbeina, David
Vonlanthena, Daniel Häussinger*a, Wim Klopper*b,c,d, Marcel Mayor*a,c,d
† All authors contributed equally to this publication.
aDepartment of Chemistry, University of Basel, St. Johannsring 19, 4056 Basel, Switzerland
bInstitute of Physical Chemistry, Karlsruhe Institute of Technology (KIT), Fritz-Haber-Weg 2,
76131 Karlsruhe, Germany
cCenter for Functional Nanostructures (CFN), Karlsruhe Institute of Technology (KIT), Wolfgang-
Gaede-Str. 1a, 76131 Karlsruhe, Germany
dInstitute of Nanotechnology, Karlsruhe Institute of Technology (KIT), P. O. Box 3640, 76021
Karlsruhe, Germany
Supporting Information
Contents:
Synthesis of 1a, 1l, 1g and 1h S2–S4
NMR temperature calibration S5
Variable temperature NMR spectra S6–8
Calculation of coalescence temperatures Tc-lineshape S9
Rate constants S10
Overview of Eyring plots S11
Determination of the Standard Deviation for HEyring‡, SEyring
‡, GEyring‡
S12–13
Hammett correlations of ∆HEyring‡ and ∆SEyring
‡ S14–15
Solvent influence on NMR spectra S16–18
Electronic Supplementary Material (ESI) for Organic & Biomolecular ChemistryThis journal is © The Royal Society of Chemistry 2012

2
Synthesis of 1a, 1l, 1g and 1h
3,9-Dinitro-6,7-dihydro-5H-dibenzo[a,c][7]annulene (1a): Diamine 1k (133 mg, 0.590 mmol,
1.00 equiv.) and KI (4.97 mg, 30.0 μmol, 5 mol%) were dissolved in 2 mL
acetonitrile. To this solution 70% aq. TBHP (0.620 ml, 4.50 mmol, 7.60 equiv.)
was added dropwise at 0°C. The black solution was stirred at 80°C overnight. After cooling the
reaction mixture to rt, it was quenched with Na2S2O3, washed with brine, extracted with ethyl acetate
(3 x 20 mL) and dried with MgSO4. The solvent was removed in vacuo and the residual crude was
purified by column chromatography (SiO2; cylohexane:CH2Cl2; 5:1, 1% MeOH) yielding 1a as a
white solid (31.5%).
Rf = 0.71 (SiO2; cyclohexane:CH2Cl2; 5:1, 1% MeOH); 1H-NMR (400 MHz, CDCl3): δ = 8.25 (dd,
3J(H,H) = 8.4 Hz, 4J(H,H) = 2.3 Hz, 2H, Ar-H), 8.18 (d, 4J(H,H) = 2.3 Hz, 2H, Ar-H), 7.57 (d,
3J(H,H) = 8.4 Hz, 2H, Ar-H), 2.62 (br. s, 4H), 2.32 (q, 3J(H,H) = 7.0 Hz, 2H) ppm; 13C-NMR (400
MHz, CDCl3): δ = 148.1 (Cq, 2C), 145.6 (Cq, 2C), 141.3 (Cq, 2C), 129.5 (Ct, 2C), 123.9 (Ct, 2C),
122.3 (Ct, 2C), 32.7 (Cs, 2C), 31.2 (Cs, 1C); MS (EI +, 70 eV): m/z (%) = 284 (100), 267 (3), 237
(9), 191 (32), 165 (16), 152 (8); elemental analysis calcd (%) for C15H12N2O4: C 63.38, H 4.25, N
9.85; found: C 63.94, H 4.64, N 9.76.
3,9-Di(piperidin-1-yl)-6,7-dihydro-5H-dibenzo[a,c][7]annulene (1l): Diamine 1k (177 mg,
0.789 mmol, 1.00 equiv.) was suspended in 3 mL water. To this suspension
was added SDS (4.55 mg, 20.0 μmol, 2 mol%), NaHCO3 (292 mg, 3.47 mmol,
4.40 equiv.) and 1,5-dibromopentane (798 mg, 3.47 mmol, 4.40 equiv.). The reaction mixture was
then heated at 80°C for 2 h. After cooling to room temperature, 1 m NaOH was added to the mixture
and extracted with 3 x 50 mL dichloromethane. The combined organic layers were dried with
MgSO4 and filtered. The solvent was removed under reduced pressure. Purification by column
chromatography (SiO2; cyclohexane:EtOAc; 3:1, 5% NEt3) yielded 1l as white solid (52%). For
further analysis the product was recrystallized from pure ethyl acetate.
Rf = 0.89 (SiO2; cyclohexane:ethyl acetate; 3:1, 5% NEt3); 1H-NMR (400 MHz, CDCl3): δ = 7.22 (d,
3J(H,H) = 8.3 Hz, 2H, Ar-H), 6.87 (dd, 3J(H,H) = 8.3 Hz, 4J(H,H) = 2.5 Hz, 2H, Ar-H), 6.82 (d,
Electronic Supplementary Material (ESI) for Organic & Biomolecular ChemistryThis journal is © The Royal Society of Chemistry 2012

3
4J(H,H) = 2.5 Hz, 2H, Ar-H), 3.20-3.18 (m, 8H), 2.46 (t, 3J(H,H) = 7.0 Hz, 4H), 2.14 (q, 3J(H,H) =
7.0 Hz, 2H), 1.76-1.70 (m, 8H), 1.61-1.56 (m, 4H); 13C-NMR (101 MHz, CDCl3): δ = 151.1 (Cq,
2C), 140.2 (Cq, 2C), 132.3 (Cq, 2C), 128.5 (Ct, 2C), 116.7 (Ct, 2C), 114.24 (Ct, 2C), 50.8 (Cs, 2C),
33.1 (Cs, 2C), 32.2 (Cs, 1C), 26.0 (Cs, 2C), 24.4 (Cs, 2C); MS (ESI, positive ion mode, MeCN): m/z
= 360 ([M+]), 303, 180; elemental analysis calcd (%) for C25H32N2: C 83.28, H 8.95, N 7.77; found:
C 83.37, H 9.24, N 7.71.
3,9-Difluoro-6,7-dihydro-5H-dibenzo[a,c][7]annulene (1g):1 To a suspension of diamine 1k (110
mg, 1.00 equiv., 0.490 mmol) in 20 mL 48% tetrafluoroboric acid sodium nitrite
(71.0 mg, 2.10 equiv., 1.03 mmol) dissolved in 4 mL H2O was added dropwise at
0°C. 20 mL dichloromethane was added to completely dissolve the starting materials. After stirring
at 0°C for 10 min the brown reaction mixture was irradiated with a mercury vapor lamp at 0°C
overnight. Then 40% aqueous NaOH was added at 0°C for neutralization. The mixture was extracted
three times with ethyl acetate. The combined organic layers where washed once with brine and dried
with MgSO4. After evaporation of the solvent, the crude was purified by column chromatography
(SiO2; cyclohexane) to achieve 100 mg (88%) of 1g as a white solid. For further analysis difluoride
1g was recrystallized from a mixture of methanol and water (25:1).
Rf = 0.49 (SiO2; cyclohexane); 1H-NMR (400 MHz, CDCl3): δ = 7.28 (dd, 3J(H,H) = 8.4 Hz, 4J(H,F)
= 5.7 Hz, 2H, Ar-H), 7.01 (td, 3J(H,H) = 8.4 Hz, 3J(H,F) = 2.7 Hz, 2H, Ar-H), 6.95 (dd, 3J(H,H) =
9.3 Hz, 3J(H,F) = 2.7 Hz, 2H, Ar-H), 2.46 (t, 3J(H,H) = 7.1 Hz, 4H), 2.17 (q, 3J(H,H) = 7.1 Hz, 2H)
ppm; 13C-NMR (101 MHz, CDCl3): δ = 162.3 (d, 1J(C,F) = 245.9 Hz, Cq, 2C), 141.7 (d, 3J(C,F) =
7.4 Hz, Cq, 2C), 136.2 (d, 4J(C,F) = 3.1 Hz, Cq, 2C), 129.8 (d, 3J(C,F) = 8.3 Hz, Ct, 2C), 115.4 (d,
2J(C,F) = 21.1 Hz, Ct, 2C), 113.4 (d, 2J(C,F) = 21.2 Hz, Ct, 2C), 32.9 (Cs, 2C), 31.5 (Cs, 1C) ppm;
MS (EI +, 70 eV): m/z (%) = 230.1 (100), 215.1 (41), 201.0 (24), 195.1 (12), 183.1 (6); elemental
analysis calcd (%) for C15H12F2: C 78.24, H 5.25; found: C 77.86, H 5.57.
6,7-Dihydro-5H-dibenzo[a,c][7]annulene (1h): The dibromide 1e (50.0 mg, 1.00 equiv.,
0.142 mmol) was dissolved in 2 mL THF (abs., crown-cap) under argon
Electronic Supplementary Material (ESI) for Organic & Biomolecular ChemistryThis journal is © The Royal Society of Chemistry 2012

4
atmosphere and cooled to −78°C. Then t-BuLi (0.373 mL, 246 mg, 4.20 equiv., 0.596 mmol) was
added dropwise. The reaction mixture (green) was stirred at the elevated temperature for 1.5 h. Then
2 mL sat. aq. ammonium chloride solution was added and after stirring for 30 min at rt the phases
were separated. The aqueous one was extracted twice with cyclohexane. The combined organic
layers were washed with brine, dried with sodium sulfate, filtered and concentrated. The crude was
purified by column chromatography (SiO2; cyclohexane). According to the described procedure the
desired target compound was obtained as a colorless liquid.
Rf = 0.41 (SiO2; cyclohexane); 1H-NMR (400 MHz, CDCl3): δ = 7.39 (dd, 3J(H,H) = 7.2 Hz,
4J(H,H) = 1.6 Hz, 2H, Ar-H), 7.35 (dt, 3J(H,H) = 7.2 Hz, 4J(H,H) = 1.6 Hz, 2H, Ar-H), 7.30 (dt,
3J(H,H) = 7.2 Hz, 4J(H,H) = 1.6 Hz, 2H, Ar-H), 7.25 (dd, 3J(H,H) = 7.2 Hz, 4J(H,H) = 1.6 Hz,
2H, Ar-H), 2.51 (t, 3J(H,H) = 7.1 Hz, 4H), 2.20 (quint, 3J(H,H) = 7.1 Hz, 2H) ppm. The analytic data
is according to literature.2
Electronic Supplementary Material (ESI) for Organic & Biomolecular ChemistryThis journal is © The Royal Society of Chemistry 2012

5
NMR temperature calibration
Temperature calibration is needed for variable temperature NMR spectroscopy as the temperature
unit is placed below the sample and therefore gives only a hint of the stability and absolute value of
the temperature. For temperature calibration a CH3OH (4 %) in CD3OD (96 %) sample was used.
The temperature calibration was performed using equation (1) for temperatures between 200 –
265 K and equation (2) for temperatures between 265 – 300 K.
T = (3.92 − Δδ) / 0.008 (1)
T = (4.109 − Δδ) / 0.008708 (2)
T = absolute temperature [K], Δδ = chemical shift difference between CH3 and OH resonance in
MeOH [ppm].3
Each temperature was measured three times to prove the stability of the system. The temperature
variation during the experiment is less than 0.05 K and therefore much smaller than the estimated
calibration error of 1 K. In Figure S1 the calibration curve with its statistical errors is depicted. All
temperatures used for the calculation of thermodynamic data were normalized to the calibrated
temperature data.
Figure S1: Temperature calibration for low temperature NMR experiments with a CH3OH (4 %) in
CD3OD (96 %) sample.
Electronic Supplementary Material (ESI) for Organic & Biomolecular ChemistryThis journal is © The Royal Society of Chemistry 2012

6
Variable temperature NMR spectra
All samples were prepared in deuterated solvents (> 99.8 % D, Cambridge Isotope Laboratories,
Burgdorf, CH). The NMR experiments were performed on a Bruker Avance III – 600 MHz NMR
spectrometer, equipped with a self-shielded z-axis pulsed field gradient dual channel broadband
inverse probe-head. For thermodynamic investigations three different states have to be accessible.
The slow exchange where the signals of the two protons are obtained as well separated resonances,
the coalescence where the signal reaches a plateau and the line width is extremely broadened, and
finally the fast exchange where the signals are obtained as an averaged signal.
Figure S2: Experimental NMR spectra of 1a, 1b and 1c at variable temperatures.
Electronic Supplementary Material (ESI) for Organic & Biomolecular ChemistryThis journal is © The Royal Society of Chemistry 2012

7
Figure S3: Experimental NMR spectra of 1d, 1e and 1f at variable temperatures.
Figure S4: Experimental NMR spectra of 1g, 1h and 1i at variable temperatures.
Electronic Supplementary Material (ESI) for Organic & Biomolecular ChemistryThis journal is © The Royal Society of Chemistry 2012

8
Figure S5: Experimental NMR spectra of 1j, 1k and 1l at variable temperatures.
Electronic Supplementary Material (ESI) for Organic & Biomolecular ChemistryThis journal is © The Royal Society of Chemistry 2012

9
Calculation of coalescence temperatures Tc-lineshape
The coalescence temperatures were calculated from the line width of the coalescent peak. The line
width was therefore plotted against the temperature and the resulting points were fitted with a
Lorentzian shaped curve. A good agreement with the experimental coalescence temperatures Tc was
obtained except for the dipiperidinyl substituted biphenyl 1l. Limiting factor was the freezing point
of CDCl3. An example for the determination of the coalescence temperature is shown in figure S6.
The maximum of the calculated curve delivers directly the coalescence temperature.
Figure S6: Calculation of the coalescence temperature from the line width of the coalescent peak.
Electronic Supplementary Material (ESI) for Organic & Biomolecular ChemistryThis journal is © The Royal Society of Chemistry 2012

10
Rate constants
Experimental rate constants were obtained from lineshape analysis.
1a fitted 1b fitted 1c fitted T k T k T k
299.1 2000 299.1 3050 299.1 3800 292.6 1200 286.5 1200 286.5 1450 286.5 760 280.6 705 280.6 900 280.6 450 274.7 415 274.7 560 274.7 290 269.2 260 269.2 340 263.4 97 257.8 90 263.4 200 251.0 35 251.0 65
239.6 21
1d fitted 1e fitted 1f fitted T k T k T k
299.1 4200 274.7 850 299.1 4800 286.5 1900 269.2 515 286.6 2050 274.7 820 263.4 295 274.7 810 269.2 500 257.8 172 269.2 500 263.4 320 245.3 55 263.4 325 257.8 180 257.8 185 251.0 105 251.0 105 239.6 35 239.6 38
229.0 13
1g fitted 1h fitted 1i fitted T k T k T k
299.1 3100 299.1 3200 299.1 10200 280.6 840 280.6 1000 281.6 4200 274.7 530 269.2 395 257.8 820 269.2 315 263.4 195 245.3 345 263.4 186 257.8 128 234.0 130 251.0 63 251.0 72 224.1 50 239.6 22 239.6 25
1j fitted 1k fitted 1l fitted T k T k T k
274.7 1500 251.0 550 274.7 1500 263.4 950 239.6 230 263.4 900 251.0 380 234.0 160 251.0 600 245.3 180 229.0 100 239.6 400 239.6 104 224.0 50 229.0 175 229.0 37 219.2 32 224.1 120 219.2 16 214.2 20 219.2 54
209.2 21
Electronic Supplementary Material (ESI) for Organic & Biomolecular ChemistryThis journal is © The Royal Society of Chemistry 2012

11
Overview of Eyring plots
All experimental NMR spectra were fitted to obtain rate constants for the rotation process. These
rate constants were then further analyzed with Eyring plots (R2 ≥ 0.99, except for Pip) to get deeper
insight into thermodynamic data.
Figure S7: Eyring plots of the investigated propyl-bridged biphenyls 1a – 1l.
Electronic Supplementary Material (ESI) for Organic & Biomolecular ChemistryThis journal is © The Royal Society of Chemistry 2012

12
Determination of the Standard Deviation for HEyring‡, SEyring
‡, GEyring‡
The standard deviations for the enthalpy, entropy, and Gibbs free energy values given in Table 2
of the main paper were obtained from the following procedure: firstly, the experimental reaction rate
constants ln(k/T) were plotted against 1/T in a single Eyring plot and fitted by linear regression.
From this fit, the values HEyring‡, SEyring
‡, and GEyring‡ given in Table 2 of the main paper were
obtained. Secondly, at the experimental temperatures Ti, i = 1, …, n, the corresponding reaction rate
constants ki were computed from the equation
ki = kBTi exp{(HEyring‡ TiSEyring
‡)/(RTi)} / h , i = 1, …, n .
Obviously, these computed points lie on a perfect straight line. Thirdly, a total number of j = 1, …,
2500 individual simulations were performed. In each of these simulations, n data points (Ti+T,
ki+k) were generated using a random number generator, taking random numbers T and k from a
Gaussian distribution about the temperature Ti and about the reaction rate constant ki. The Gaussian
distributions were chosen according to the standard deviations of T = 1 K and k = 5%,
respectively. An Eyring plot for these n data points yielded HEyring‡(j), SEyring
‡(j), and GEyring‡(j).
Finally, the standard deviations for the enthalpy, entropy, and Gibbs free energy values given in
Table 2 were obtained from the distribution of the 2500 values obtained in the simulations. As an
illustration, Figure S8 shows all of the 2500 data points used in the above procedure for 1b, which
involved 2 6 2500 = 30000 random numbers in total.
Electronic Supplementary Material (ESI) for Organic & Biomolecular ChemistryThis journal is © The Royal Society of Chemistry 2012

13
Figure S8. Data points for 1b from 2500 simulations (n = 6).
Electronic Supplementary Material (ESI) for Organic & Biomolecular ChemistryThis journal is © The Royal Society of Chemistry 2012

14
Hammett correlations of ∆HEyring‡ and ∆SEyring
‡
Figure S9. Correlation of the entropies ∆HEyring‡ with the Hammett-parameter σp (top), the resonance
parameter R (bottom left), and the field effect parameter F (bottom right).
Electronic Supplementary Material (ESI) for Organic & Biomolecular ChemistryThis journal is © The Royal Society of Chemistry 2012
15
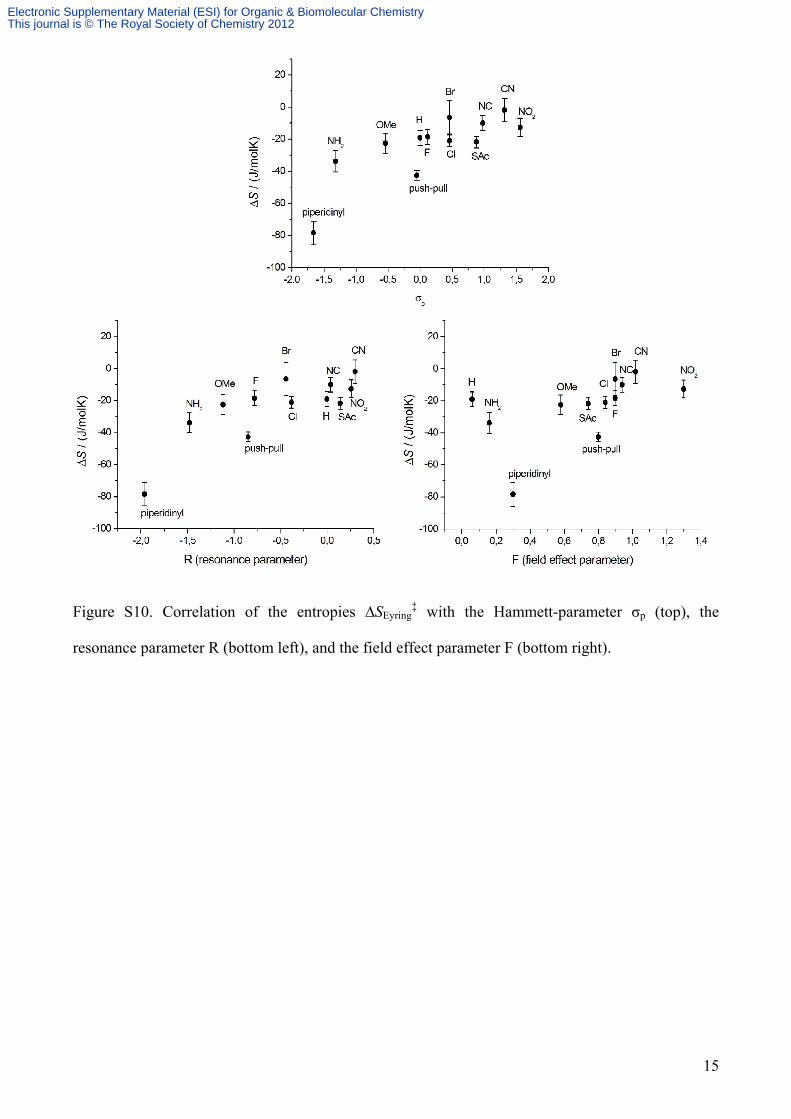
Figure S10. Correlation of the entropies ∆SEyring‡ with the Hammett-parameter σp (top), the
resonance parameter R (bottom left), and the field effect parameter F (bottom right).
Electronic Supplementary Material (ESI) for Organic & Biomolecular ChemistryThis journal is © The Royal Society of Chemistry 2012

16
Solvent influence on NMR spectra
Figure S11. Solvent dependent NMR spectra of 1e at variable temperatures.
The solvent dependent NMR spectra showed different coalescence temperatures (Tc) and different
shift differences (Δν). ∆G‡(T) is dependent on both as shown in eqn (3).4 Our investigations show
that ∆G‡(T) remains constant for all investigated solvents. The solvent effect on the thermodynamic
data obtained by line shape analyses of 1H-NMR coalescence measurements in different solvents is
summarized in the following table.
1e (CDCl3) 1e (MeOD) 1e (toluene)
∆SEyring‡ / J/(mol K) −6.4 ± 10.4 −8.0 ± 4.6 −18.0 ± 5.5
∆HEyring‡ / kJ/mol 50.0 ± 2.7 49.0 ± 1.3 45.9 ± 1.4
∆GEyring‡ / kJ/mol 51.7 ± 0.1 51.1 ± 0.1 50.4 ± 0.1
∆G‡ / kJ/mol 51.3 ± 0.5 51.0 ± 0.5 50.5 ± 0.5
1b (CDCl3) 1b (MeOD) 1b (toluene)
Electronic Supplementary Material (ESI) for Organic & Biomolecular ChemistryThis journal is © The Royal Society of Chemistry 2012

17
∆SEyring‡ / J/(mol K) −1.9 ± 7.3 −8.3 ± 4.2 −39.9 ± 3.5
∆HEyring‡ / kJ/mol 52.7 ± 2.0 50.1 ± 1.2 41.7 ± 0.9
∆GEyring‡ / kJ/mol 53.2 ± 0.1 52.3 ± 0.1 51.9 ± 0.1
∆G‡ / kJ/mol 53.3 ± 0.5 52.4 ± 0.5 52.0 ± 0.5
1j (CDCl3) 1j (MeOD) 1j (toluene)
∆SEyring‡ / J/(mol K) −22.5 ± 6.2 −12.8 ± 4.0 −5.0 ± 4.9
∆HEyring‡ / kJ/mol 43.4 ± 1.5 45.6 ± 1.0 47.9 ± 1.3
∆GEyring‡ / kJ/mol 48.8 ± 0.1 48.7 ± 0.1 49.1 ± 0.1
∆G‡ / kJ/mol 48.4 ± 0.5 48.5 ± 0.5 48.9 ± 0.5
In this study, methanol as a polar protic solvent and toluene as a π-donating solvent were chosen to
gain insight into the stabilizing effect on the transition state. Therefore a donor-substituted (1j), a
neutral (1e) and an acceptor-substituted biphenyl (1b) were measured in both solvents and then
compared to the thermodynamic data obtained in chloroform. In all cases the free energy ∆G‡(T)
remained similar in all solvents, whereas the enthalpies ∆H‡ and the entropies ∆S‡ significantly
changed when measured in different solvents. It seems that the transition state of the
atropisomerization process gets stabilized by protic solvents in the case of dimethoxy substituted
propyl bridged biphenyls (1j). The opposite was observed for dicyano (1b) and dibromo (1e)
substituted biphenyls where the transition state is most stabilized in toluene, a π-donating solvent.
The reason for this remains unclear, especially because the entropy follows the opposite trend, and
the free energy remains unchanged. It is hypothesized that a partial positive charge in the acceptor-
substituted cases is stabilized by the electron rich toluene. Thus the energy needed to access the
transition state in the atropisomerization process is lowered. On the contrary this solute-solvent
complex results in a higher order in the ensemble in the transition state leading to negative entropies.
The stabilization by protic solvents of the partial negative charge in donor substituted biphenyl 1j
would explain the opposed trend observed in this limited series of solvent depended coalescence
Electronic Supplementary Material (ESI) for Organic & Biomolecular ChemistryThis journal is © The Royal Society of Chemistry 2012

18
measurements. Nevertheless, the values obtained by lineshape analysis have to be regarded with
caution due to the susceptibility of the Eyring analysis to errors in such a narrow temperature region.
(1) Dolensky, B. J. Fluorine Chem. 2001, 107, 147. (2) Müllen, K.; Heinz, W.; Klärner, F.; Roth, W. R.; Kindermann, I.; Adamczak, O.; Wette, M.; Lex, J.
Chem. Ber. 1990, 123, 2349–2371. (3) Berger, S.; Braun, S. 200 and More NMR Experiments: A Practical Course; 1. Aufl.; Wiley-VCH
Verlag GmbH & Co. KGaA, 2004. (4) Hesse, M.; Meier, H.; Zeeh, B. Spektroskopische Methoden in der organischen Chemie; 7., überarb.
Aufl.; Thieme, Stuttgart, 2005.
Electronic Supplementary Material (ESI) for Organic & Biomolecular ChemistryThis journal is © The Royal Society of Chemistry 2012