attachment 1 cost estimate (mii v4.4.2)/tpcs/csra
TRANSCRIPT

HSC-ECIP Engineering Appendix C
ATTACHMENT 1
COST ESTIMATE (MII V4.4.2)/TPCS/CSRA
Estimated by Chester Hedderman, GBA Designed by GBA/AECOM/POH Prepared by G. Dale Williams, USACE Preparation Date 12/4/2019 Effective Date of Pricing 12/4/2019 Estimated Construction Time 1,363 Days Labor ID: NLS2016 EQ ID: EP16R06 Currency in US dollars TRACES MII Version 4.4
Print Date Tue 10 December 2019 U.S. Army Corps of Engineers Time 08:42:53 Eff. Date 12/4/2019 Project HSC-ECIP: Houston Ship Channel - Expansion Channel Improvements Project COE Standard Report Selections Title Page Proposed Modifications to Houston Ship Channel

Print Date Tue 10 December 2019 U.S. Army Corps of Engineers Time 08:42:53 Eff. Date 12/4/2019 Project HSC-ECIP: Houston Ship Channel - Expansion Channel Improvements Project COE Standard Report Selections Table of Contents
Labor ID: NLS2016 EQ ID: EP16R06 Currency in US dollars TRACES MII Version 4.4
Project Cost Summary Report ......................................................................................................................................................................................................................................................................................................... 1
Construction General - NED ........................................................................................................................................................................................................................................................................................................ 1
Segment 1 ................................................................................................................................................................................................................................................................................................................................... 1
01 Construction Year 01-02 .................................................................................................................................................................................................................................................................................................. 1
02 Construction Year 02-03 .................................................................................................................................................................................................................................................................................................. 1
Segment 2 ................................................................................................................................................................................................................................................................................................................................... 1
02 Construction Year 02-03 .................................................................................................................................................................................................................................................................................................. 1
Segment 3 ................................................................................................................................................................................................................................................................................................................................... 1
03 Construction Year 03-04 .................................................................................................................................................................................................................................................................................................. 1
Segment 4 ................................................................................................................................................................................................................................................................................................................................... 1
01 Construction Year 01-02 .................................................................................................................................................................................................................................................................................................. 1
Segment 5 ................................................................................................................................................................................................................................................................................................................................... 1
04 Construction Year 04-05 .................................................................................................................................................................................................................................................................................................. 1
Segment 6 ................................................................................................................................................................................................................................................................................................................................... 1
04 Construction Year 04-05 .................................................................................................................................................................................................................................................................................................. 1

Print Date Tue 10 December 2019 U.S. Army Corps of Engineers Time 08:42:53 Eff. Date 12/4/2019 Project HSC-ECIP: Houston Ship Channel - Expansion Channel Improvements Project COE Standard Report Selections Project Cost Summary Report Page 1
Description Quantity UOM DirectCost ContractCost ProjectCost
Labor ID: NLS2016 EQ ID: EP16R06 Currency in US dollars TRACES MII Version 4.4
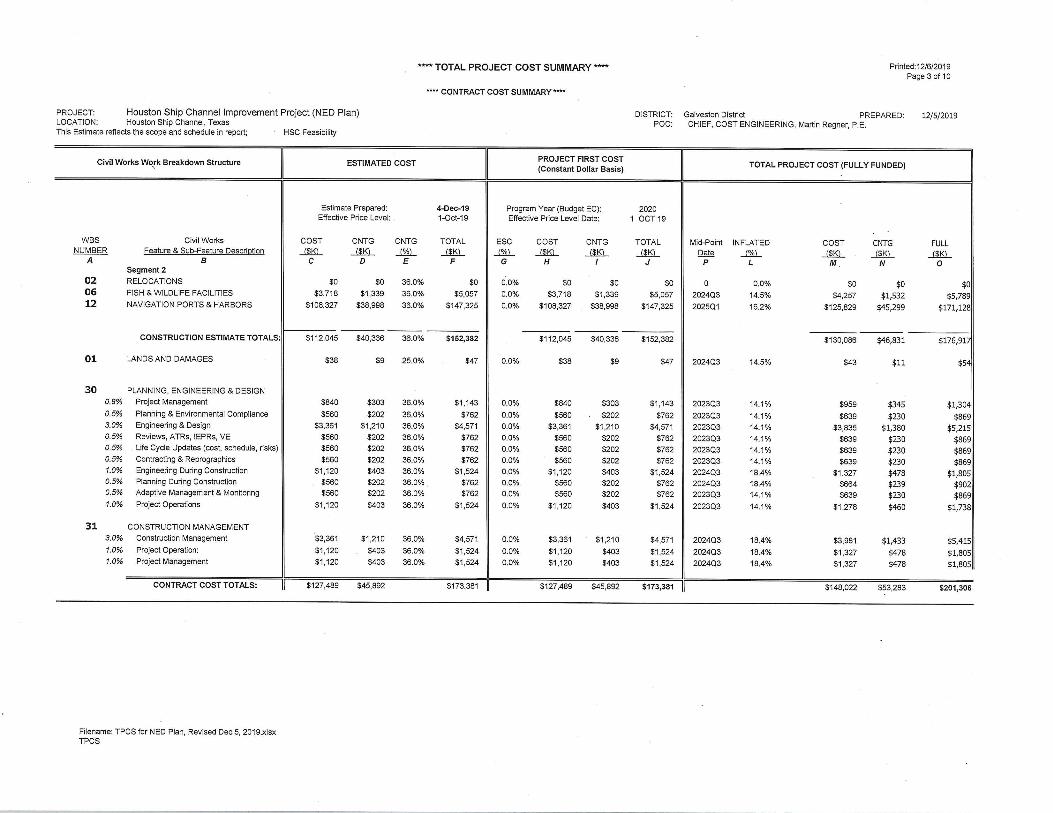
Project Cost Summary Report 414,300,046 432,928,241 432,928,241 Construction General - NED 1.00 EA 414,300,046 432,928,241 432,928,241 Segment 1 1.00 EA 87,325,320 90,171,471 90,171,471 01 Construction Year 01-02 1.00 EA 75,565,813 78,180,986 78,180,986 02 Construction Year 02-03 1.00 EA 11,759,507 11,990,485 11,990,485 Segment 2 1.00 EA 104,936,094 112,082,953 112,082,953 02 Construction Year 02-03 1.00 EA 104,936,094 112,082,953 112,082,953 Segment 3 1.00 EA 97,414,396 99,743,251 99,743,251 03 Construction Year 03-04 1.00 EA 97,414,396 99,743,251 99,743,251 Segment 4 1.00 EA 91,295,165 95,415,294 95,415,294 01 Construction Year 01-02 1.00 EA 91,295,165 95,415,294 95,415,294 Segment 5 1.00 EA 3,981,995 4,216,305 4,216,305 04 Construction Year 04-05 1.00 EA 3,981,995 4,216,305 4,216,305 Segment 6 1.00 EA 29,347,076 31,298,967 31,298,967 04 Construction Year 04-05 1.00 EA 29,347,076 31,298,967 31,298,967

Estimated by Chester Hedderman, GBA Designed by GBA/AECOM/POH Prepared by G. Dale Williams, USACE Preparation Date 12/5/2019 Effective Date of Pricing 10/1/2019 Estimated Construction Time 1,830 Days Labor ID: NLS2016 EQ ID: EP16R06 Currency in US dollars TRACES MII Version 4.4
Print Date Thu 5 December 2019 U.S. Army Corps of Engineers Time 16:28:03 Eff. Date 10/1/2019 Project HSC-ECIP: Houston Ship Channel - Expansion Channel Improvements Project COE Standard Report Selections Title Page Proposed Modifications to Houston Ship Channel

Print Date Thu 5 December 2019 U.S. Army Corps of Engineers Time 16:28:03 Eff. Date 10/1/2019 Project HSC-ECIP: Houston Ship Channel - Expansion Channel Improvements Project COE Standard Report Selections Table of Contents
Labor ID: NLS2016 EQ ID: EP16R06 Currency in US dollars TRACES MII Version 4.4
Project Cost Summary Report ......................................................................................................................................................................................................................................................................................................... 1
Construction General - LPP ......................................................................................................................................................................................................................................................................................................... 1
Segment 1 ................................................................................................................................................................................................................................................................................................................................... 1
01 Construction Year 01-02 .................................................................................................................................................................................................................................................................................................. 1
02 Construction Year 02-03 .................................................................................................................................................................................................................................................................................................. 1
03 Construction Year 03-05 .................................................................................................................................................................................................................................................................................................. 1
Segment 2 ................................................................................................................................................................................................................................................................................................................................... 1
02 Construction Year 02-03 .................................................................................................................................................................................................................................................................................................. 1
Segment 3 ................................................................................................................................................................................................................................................................................................................................... 1
03 Construction Year 03-05 .................................................................................................................................................................................................................................................................................................. 1
Segment 4 ................................................................................................................................................................................................................................................................................................................................... 1
01 Construction Year 01-02 .................................................................................................................................................................................................................................................................................................. 1
Segment 5 ................................................................................................................................................................................................................................................................................................................................... 1
04 Construction Year 05-06 .................................................................................................................................................................................................................................................................................................. 1
Segment 6 ................................................................................................................................................................................................................................................................................................................................... 1
04 Construction Year 05-06 .................................................................................................................................................................................................................................................................................................. 1

Print Date Thu 5 December 2019 U.S. Army Corps of Engineers Time 16:28:03 Eff. Date 10/1/2019 Project HSC-ECIP: Houston Ship Channel - Expansion Channel Improvements Project COE Standard Report Selections Project Cost Summary Report Page 1
Description Quantity UOM DirectCost ContractCost ProjectCost
Labor ID: NLS2016 EQ ID: EP16R06 Currency in US dollars TRACES MII Version 4.4
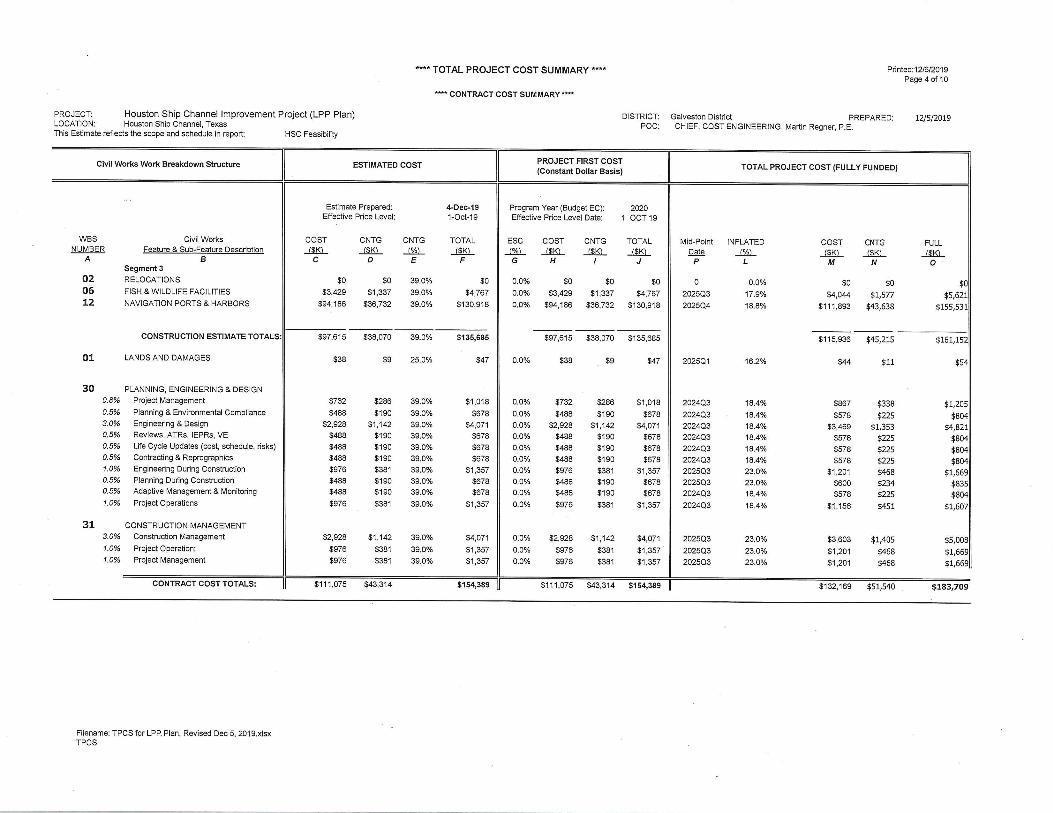
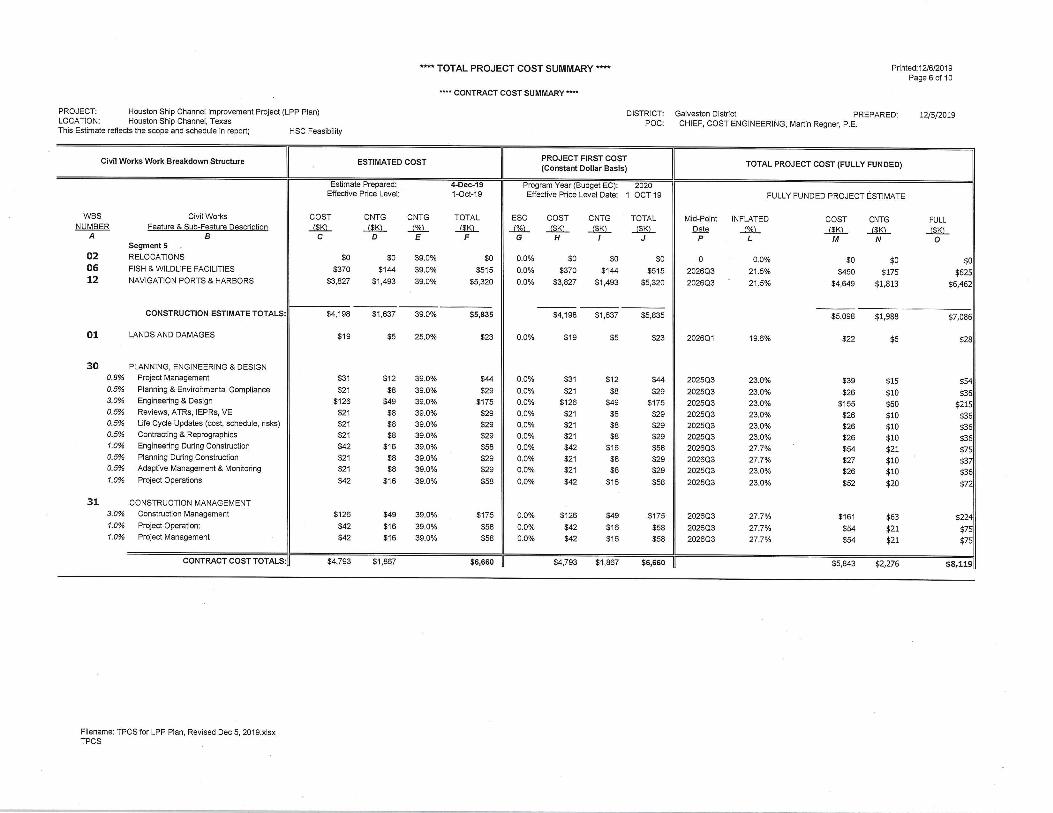
Project Cost Summary Report 532,842,750 557,028,037 557,028,037 Construction General - LPP 1.00 EA 532,842,750 557,028,037 557,028,037 Segment 1 1.00 EA 261,176,466 274,487,624 274,487,624 01 Construction Year 01-02 1.00 EA 77,132,593 79,747,766 79,747,766 02 Construction Year 02-03 1.00 EA 102,841,061 106,131,096 106,131,096 03 Construction Year 03-05 1.00 EA 81,202,813 88,608,762 88,608,762 Segment 2 1.00 EA 51,709,961 53,948,906 53,948,906 02 Construction Year 02-03 1.00 EA 51,709,961 53,948,906 53,948,906 Segment 3 1.00 EA 95,323,718 97,652,572 97,652,572 03 Construction Year 03-05 1.00 EA 95,323,718 97,652,572 97,652,572 Segment 4 1.00 EA 91,303,533 95,423,662 95,423,662 01 Construction Year 01-02 1.00 EA 91,303,533 95,423,662 95,423,662 Segment 5 1.00 EA 3,981,996 4,216,305 4,216,305 04 Construction Year 05-06 1.00 EA 3,981,996 4,216,305 4,216,305 Segment 6 1.00 EA 29,347,076 31,298,967 31,298,967 04 Construction Year 05-06 1.00 EA 29,347,076 31,298,967 31,298,967


Houston Ship Channel DMMP
45’ Expansion Channel Improvement Project Cost and Schedule Risk Analysis Report
NED Plan
Prepared for:
U.S. Army Corps of Engineers, Galveston District
Prepared by:
U.S. Army Corps of Engineers, Walla Walla District Engineering and Construction Division, Cost Engineering Branch
November 20, 2019
US Army Corps of Engineers®

i
TABLE OF CONTENTS
MAIN REPORT ..................................................................................................... 4
1.0 PURPOSE ...................................................................................................... 4
2.0 BACKGROUND .............................................................................................. 4
3.0 REPORT SCOPE ........................................................................................... 4
3.1 Project Scope .............................................................................................. 5
3.2 USACE Risk Analysis Process .................................................................... 5
4.0 METHODOLOGY / PROCESS ....................................................................... 6
4.1 Identify and Assess Risk Factors ................................................................ 7
4.2 Quantify Risk Factor Impacts ...................................................................... 8
4.3 Analyze Cost Estimate and Schedule Contingency ..................................... 9
5.0 PROJECT ASSUMPTIONS ............................................................................ 9
6.0 RESULTS ..................................................................................................... 10
6.1 Risk Register ............................................................................................. 10
6.2 Cost Contingency and Sensitivity Analysis ................................................ 11
6.2.1 Sensitivity Analysis ............................................................................. 11
6.2.2 Sensitivity Analysis Results ................................................................ 11
6.3 Schedule Risk Analysis ............................................................................. 12
7.0 MAJOR FINDINGS/OBSERVATIONS/RECOMMENDATIONS .................... 13
7.1 Major Findings/Observations ..................................................................... 14
7.2 Recommendations .................................................................................... 16
ii
LIST OF TABLES
Table ES-1. Construction Contingency Results ............................................. ES-1
Table 1. Construction Cost Contingency Summary ........................................... 12
Table 2. Project Cost Comparison Summary (Uncertainty Analysis) ................. 13
LIST OF FIGURES
Figure 1. Cost Sensitivity Analysis ..................................................................... 12
LIST OF APPENDICES
Risk Register .................................................................................... APPENDIX A

ES-1
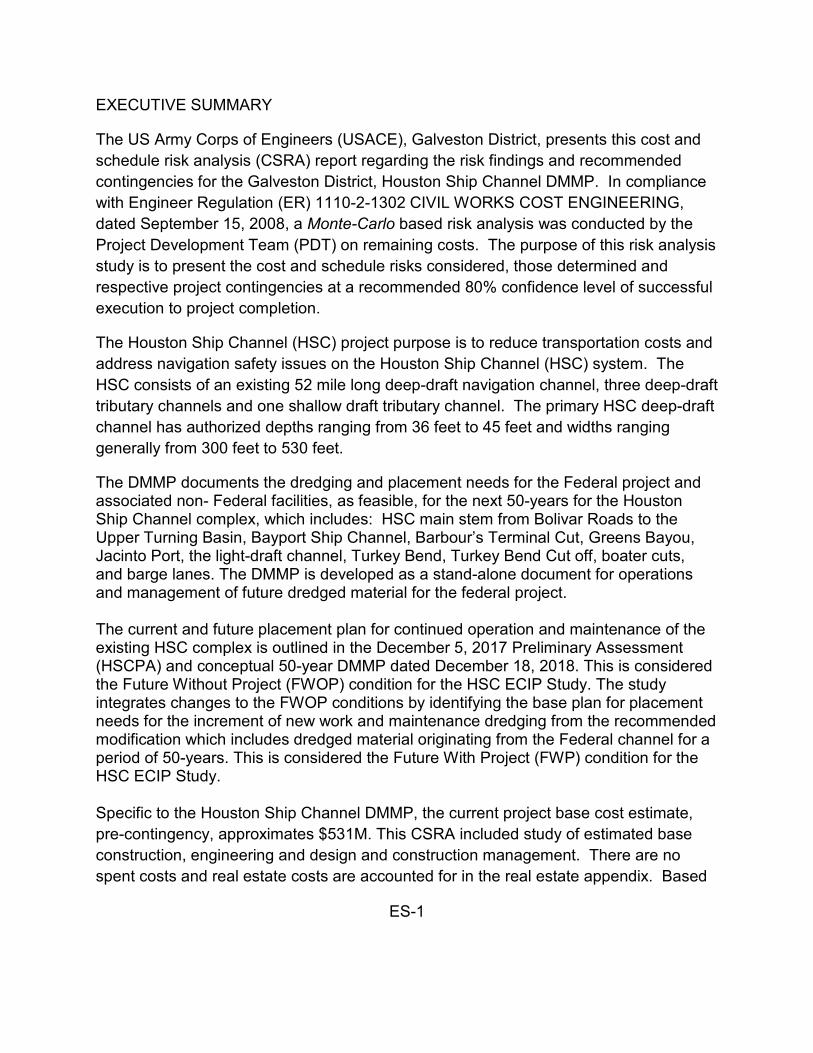
EXECUTIVE SUMMARY
The US Army Corps of Engineers (USACE), Galveston District, presents this cost and schedule risk analysis (CSRA) report regarding the risk findings and recommended contingencies for the Galveston District, Houston Ship Channel DMMP. In compliance with Engineer Regulation (ER) 1110-2-1302 CIVIL WORKS COST ENGINEERING, dated September 15, 2008, a Monte-Carlo based risk analysis was conducted by the Project Development Team (PDT) on remaining costs. The purpose of this risk analysis study is to present the cost and schedule risks considered, those determined and respective project contingencies at a recommended 80% confidence level of successful execution to project completion.
The Houston Ship Channel (HSC) project purpose is to reduce transportation costs and address navigation safety issues on the Houston Ship Channel (HSC) system. The HSC consists of an existing 52 mile long deep-draft navigation channel, three deep-draft tributary channels and one shallow draft tributary channel. The primary HSC deep-draft channel has authorized depths ranging from 36 feet to 45 feet and widths ranging generally from 300 feet to 530 feet.
The DMMP documents the dredging and placement needs for the Federal project and associated non- Federal facilities, as feasible, for the next 50-years for the Houston Ship Channel complex, which includes: HSC main stem from Bolivar Roads to the Upper Turning Basin, Bayport Ship Channel, Barbour’s Terminal Cut, Greens Bayou, Jacintoport, the light-draft channel, Turkey Bend, Turkey Bend Cut off, boater cuts, and barge lanes. The DMMP is developed as a stand-alone document for operations and management of future dredged material for the federal project. The current and future placement plan for continued operation and maintenance of the existing HSC complex is outlined in the December 5, 2017 Preliminary Assessment (HSCPA) and conceptual 50-year DMMP dated December 18, 2018. This is considered the Future Without Project (FWOP) condition for the HSC ECIP Study. The study integrates changes to the FWOP conditions by identifying the base plan for placement needs for the increment of new work and maintenance dredging from the recommended modification which includes dredged material originating from the Federal channel for a period of 50-years. This is considered the Future With Project (FWP) condition for the HSC ECIP Study. Specific to the Houston Ship Channel DMMP, the current project base cost estimate, pre-contingency, approximates $411M. This CSRA included study of estimated base construction, engineering and design and construction management. There are no spent costs and real estate costs are accounted for in the real estate appendix. Based

ES-2
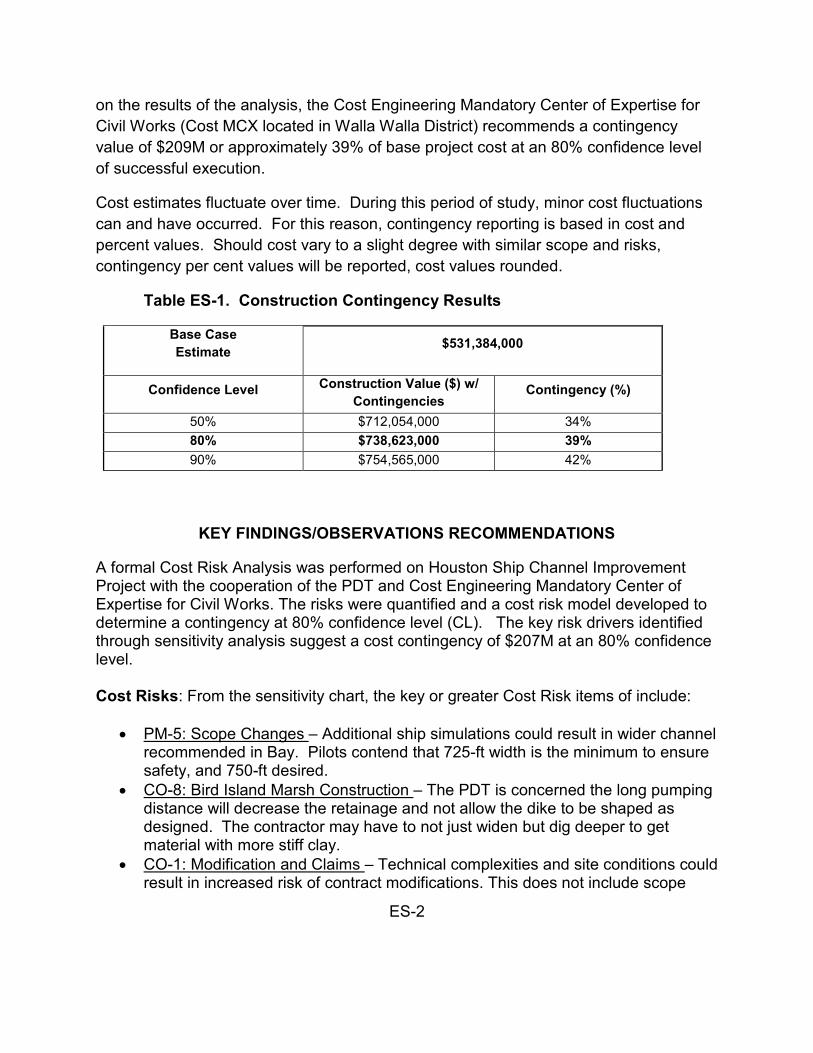
on the results of the analysis, the Cost Engineering Mandatory Center of Expertise for Civil Works (Cost MCX located in Walla Walla District) recommends a contingency value of $148M or approximately 36% of base project cost at an 80% confidence level of successful execution.
Cost estimates fluctuate over time. During this period of study, minor cost fluctuations can and have occurred. For this reason, contingency reporting is based in cost and percent values. Should cost vary to a slight degree with similar scope and risks, contingency per cent values will be reported, cost values rounded.
Table ES-1. Construction Contingency Results
Base Case Estimate $410,607,000
Confidence Level Construction Value ($) w/ Contingencies
Contingency (%)
50% $542,001,000
32%
80% $558,425,000
36%
90% $570,744,000
39%
KEY FINDINGS/OBSERVATIONS RECOMMENDATIONS
A formal Cost Risk Analysis was performed on Houston Ship Channel Improvement Project with the cooperation of the PDT and Cost Engineering Mandatory Center of Expertise for Civil Works. The risks were quantified and a cost risk model developed to determine a contingency at 80% confidence level (CL). The key risk drivers identified through sensitivity analysis suggest a cost contingency of $148M at an 80% confidence level. Cost Risks: From the sensitivity chart, the key or greater Cost Risk items of include:
• CO-8: Bird Island Marsh Construction – The PDT is concerned the long pumping distance will decrease the retainage and not allow the dike to be shaped as designed. The contractor may have to not just widen but dig deeper to get material with more stiff clay.
• CA-2: Market Conditions and Bidding Competition – Corps studies have resulted in an expected dredge shortage as compared to the many anticipated projects in the Gulf region. Generally there are 2 bidders for the 30” hydraulic dredges. A third hydraulic dredge is anticipated to be ready at the time of this construction.
ES-3
There is the possibility of many dredging projects and less competition is possible, resulting in higher bids.
• PM-5: Scope Changes – Scope changes could add cost and delay the project. Moderate scope changes could occur during ship simulations in PED. Additional pipelines could be identified and be added at the time of construction.
• CO-1: Modification and Claims – Technical complexities and site conditions could result in increased risk of contract modifications. This does not include scope growth and cover the "Unknown-Unknowns" for items such as plan omissions, delays, etc.
• TR-11: Sheetpile Wall Design – Quantity of steel required could change with final design. Length is conservative and the quantity is possible to change. This is likely a design/build scope of work and the costs are possible to change,
• EX-2: Fuel Price – Fuel could increase or decrease altering the cost. Estimate assumes $3/gallon and the current price is $2.25/gallon for fuel and is conservative. We assume an increase of $.50/gal based on price fluctuations in the past years.
Lesser project risks can be referenced in the cost sensitivity forecast data. Schedule Risks: The high value of schedule risk indicates a significant uncertainty of key risk items that can translate into added costs within the schedule. From the sensitivity chart, the key or greater Cost Risk items of include:
• PM-4: BCR Delays – Multiple separable elements that need to compete. The PDT feels the BCR will be competitive. Lengthy delays would require an economic update.
• CO-7: Inefficient Contractor – Inefficient contractor may delay the project and affect the quantities.
• PM-1: Federal Funding – Due to the priority of the project it is likely that the project may not receive adequate funding annually. The PHA (Port of Houston Authority) could advance funds which would mitigate the cost and schedule risk.
• PM-5: Scope Changes – Scope changes could add cost and delay the project. • ES-5: Schedule Detail – Estimate and schedule assume 12 separate contracts
and likely to change.
Recommendations: The PDT must include the recommended cost and schedule contingencies and incorporate risk monitoring and mitigation on those identified risks. Further iterative study and update of the risk analysis throughout the project life-cycle is important in support of the remaining project work within an approved budget and appropriation.

4
MAIN REPORT
1.0 PURPOSE
Within the authority of the US Army Corps of Engineers (USACE), Galveston District, this report presents the efforts and results of the cost and schedule risk analysis for the Houston Ship Channel DMMP. The report includes risk methodology, discussions, findings and recommendations regarding the identified risks and the necessary contingencies to confidently administer the project, presenting a cost contingency value with an 80% confidence level of successful execution. 2.0 BACKGROUND
The NED cost estimate of the project is divided into six segments, or reaches, each with a separate placement plan and placement areas. All dredging was assumed to be performed by a 30-inch cutter-head pipeline dredge, except for portions of Bolivar Roads to Redfish Reef segment and Redfish to BSC, for which a mechanical dredge will be used. Reaches include: The NED plan includes widening the channel from 530 feet wide to 700 feet wide from Bolivar Roads to Redfish, four bend easings, and easing the Bayport Flare from a 4,000 foot to a 5,300 foot radius in Segment 1; widening the Bayport Ship Channel from 350 and 400 feet to 455 feet in Segment 2; widening the Barbour’s Cut Ship Channel from 300 to 455 feet wide and extending the turning radius flare to 1,800 feet in Segment 3; widening from 400 to 530 feet and deepening from 41.5 to 46.5 feet Boggy Bayou to Greens Bayou and deepening from 41.5 to 46.5 from Greens Bayou to the Washburn Tunnel in Segment 4; deepening from Sims to 610 from 37.5 to 41.5 in Segment 5; and deepening from 37.5 to 41.5 from 610 to the Turning Basin in Segment 6.
Detailed descriptions of the various HSC segments and tributary channels included in this DMMP are presented in the Integrated Dredged Material Management Plan and Environmental Assessment Report. 3.0 REPORT SCOPE
The scope of the risk analysis report is to identify cost and schedule risks with a resulting recommendation for contingencies at the 80 percent confidence level using the risk analysis processes, as mandated by U.S. Army Corps of Engineers (USACE) Engineer Regulation (ER) 1110-2-1150, Engineering and Design for Civil Works, ER 1110-2-1302, Civil Works Cost Engineering, and Engineer Technical Letter 1110-2-573,

5
Construction Cost Estimating Guide for Civil Works. The report presents the contingency results for cost risks for construction features. The CSRA excludes Real Estate costs and does not include consideration for life cycle costs. 3.1 Project Scope The formal process included extensive involvement of the PDT for risk identification and the development of the risk register. The analysis process evaluated the Micro Computer Aided Cost Estimating System (MCACES) cost estimate, project schedule, and funding profiles using Crystal Ball software to conduct a Monte Carlo simulation and statistical sensitivity analysis, per the guidance in Engineer Technical Letter (ETL) CONSTRUCTION COST ESTIMATING GUIDE FOR CIVIL WORKS, dated September 30, 2008.
The project technical scope, estimates and schedules were developed and presented by the District. Consequently, these documents serve as the basis for the risk analysis.
The scope of this study addresses the identification of concerns, needs, opportunities and potential solutions that are viable from an economic, environmental, and engineering viewpoint.
3.2 USACE Risk Analysis Process The risk analysis process for this study follows the USACE Headquarters requirements as well as the guidance provided by the Cost Engineering MCX. The risk analysis process reflected within this report uses probabilistic cost and schedule risk analysis methods within the framework of the Crystal Ball software. Furthermore, the scope of the report includes the identification and communication of important steps, logic, key assumptions, limitations, and decisions to help ensure that risk analysis results can be appropriately interpreted. Risk analysis results are also intended to provide project leadership with contingency information for scheduling, budgeting, and project control purposes, as well as to provide tools to support decision making and risk management as the project progresses through planning and implementation. To fully recognize its benefits, cost and schedule risk analysis should be considered as an ongoing process conducted concurrent to, and iteratively with, other important project processes such as scope and execution plan development, resource planning, procurement planning, cost estimating, budgeting and scheduling. In addition to broadly defined risk analysis standards and recommended practices, this risk analysis was performed to meet the requirements and recommendations of the following documents and sources:

6
• Cost and Schedule Risk Analysis Process guidance prepared by the USACE
Cost Engineering MCX. • Engineer Regulation (ER) 1110-2-1302 CIVIL WORKS COST ENGINEERING,
dated September 15, 2008.
• Engineer Technical Letter (ETL) CONSTRUCTION COST ESTIMATING GUIDE FOR CIVIL WORKS, dated September 30, 2008.
4.0 METHODOLOGY / PROCESS
The Cost Engineering MCX performed the Cost and Schedule Risk Analysis, relying on local Galveston District staff to provide expertise and information gathering. The Galveston PDT conducted initial risk identification in March 2015. The initial risk identification meeting also included qualitative analysis to produce a risk register that served as the draft framework for the risk analysis. A Risk meeting occurred in March 2015 with an update in December of 2015, resulting in a revision of the identified risks and the current known impacts. The cost and schedule risk analysis and cost certification was completed in January 2016. The project scope was changed and a cost and schedule risk analysis update was again completed in June 2019. Key PDT members included:
Attendance Name Office RepresentingFull Dale Williams CESWG-ECE-P Cost Engineering
Full T. Cheryl Jaynes CESWF-PEC-PF Plan Formulation
Full Nancy C. Young CESWF-EC-G Civil Engineer
Full David B. Boothby CESWF-EC-S Geotech Engineer
Full Harmon Brown CESWF-PEC-CC Environmental
Full Kenny Pablo CESWG-RE Real Estate
Full Nichole Schlund CESWG-RE Real Estate
Full A. Rashid Ali CESWG-ECE-P Cost Engineering
Full Chester Hedderman GBA/JV PHA
Full Richard Ruchoeft PHA PHA
Full Ryan Harbor CESWG-ECE-P Cost Engineering
Full Stephanie Nieves CESWG-ECE-P Cost Engineering
Full Dana Cheney GBA/JV PHA
Full Carl Sepulveda AECOM/JV Environmental

7
The risk analysis process for this study is intended to determine the probability of various cost outcomes and quantify the required contingency needed in the cost estimate to achieve the desired level of cost confidence. Per regulation and guidance, the P80 confidence level (80% confidence level) is the normal and accepted cost confidence level. District Management has the prerogative to select different confidence levels, pending approval from Headquarters, USACE. In simple terms, contingency is an amount added to an estimate to allow for items, conditions or events for which the occurrence or impact is uncertain and that experience suggests will likely result in additional costs being incurred or additional time being required. The amount of contingency included in project control plans depends, at least in part, on the project leadership’s willingness to accept risk of project overruns. The less risk that project leadership is willing to accept the more contingency should be applied in the project control plans. The risk of overrun is expressed, in a probabilistic context, using confidence levels. The Cost MCX guidance for cost and schedule risk analysis generally focuses on the 80-percent level of confidence (P80) for cost contingency calculation. It should be noted that use of P80 as a decision criteria is a risk averse approach (whereas the use of P50 would be a risk neutral approach, and use of levels less than 50 percent would be risk seeking). Thus, a P80 confidence level results in greater contingency as compared to a P50 confidence level. The selection of contingency at a particular confidence level is ultimately the decision and responsibility of the project’s District and/or Division management. The risk analysis process uses Monte Carlo techniques to determine probabilities and contingency. The Monte Carlo techniques are facilitated computationally by a commercially available risk analysis software package (Crystal Ball) that is an add-in to Microsoft Excel. Cost estimates are packaged into an Excel format and used directly for cost risk analysis purposes. The level of detail recreated in the Excel-format schedule is sufficient for risk analysis purposes that reflect the established risk register, but generally less than that of the native format. The primary steps, in functional terms, of the risk analysis process are described in the following subsections. Risk analysis results are provided in Section 6. 4.1 Identify and Assess Risk Factors
Identifying the risk factors via the PDT is considered a qualitative process that results in establishing a risk register that serves as the document for the quantitative study using the Crystal Ball risk software. Risk factors are events and conditions that may influence or drive uncertainty in project performance. They may be inherent characteristics or conditions of the project or external influences, events, or conditions such as weather or

8
economic conditions. Risk factors may have either favorable or unfavorable impacts on project cost and schedule.
A formal PDT meeting was held with the Galveston District office for the purposes of identifying and assessing risk factors. The meeting conducted June 2019 included capable and qualified representatives from multiple project team disciplines and functions, including project management, cost engineering, design, environmental compliance, and real estate.
The initial formal meetings focused primarily on risk factor identification using brainstorming techniques, but also included some facilitated discussions based on risk factors common to projects of similar scope and geographic location. Additionally, numerous conference calls and informal meetings were conducted throughout the risk analysis process on an as-needed basis to further facilitate risk factor identification, market analysis, and risk assessment. 4.2 Quantify Risk Factor Impacts The quantitative impacts (putting it to numbers of cost and time) of risk factors on project plans were analyzed using a combination of professional judgment, empirical data and analytical techniques. Risk factor impacts were quantified using probability distributions (density functions) because risk factors are entered into the Crystal Ball software in the form of probability density functions. Similar to the identification and assessment process, risk factor quantification involved multiple project team disciplines and functions. However, the quantification process relied more extensively on collaboration between cost engineering and risk analysis team members with lesser inputs from other functions and disciplines. This process used an iterative approach to estimate the following elements of each risk factor:
• Maximum possible value for the risk factor • Minimum possible value for the risk factor • Most likely value (the statistical mode), if applicable • Nature of the probability density function used to approximate risk factor
uncertainty • Mathematical correlations between risk factors • Affected cost estimate and schedule elements
The resulting product from the PDT discussions is captured within a risk register as presented in section 6 for cost risk concerns. Note that the risk register records the PDT’s risk concerns, discussions related to those concerns, and potential impacts to the current cost and schedule estimates. The concerns and discussions support the team’s

9
decisions related to event likelihood, impact, and the resulting risk levels for each risk event.
4.3 Analyze Cost Estimate and Schedule Contingency
Contingency is analyzed using the Crystal Ball software, an add-in to the Microsoft Excel format of the cost estimate and schedule. Monte Carlo simulations are performed by applying the risk factors (quantified as probability density functions) to the appropriate estimated cost and schedule elements identified by the PDT. Contingencies are calculated by applying only the moderate and high level risks identified for each option (i.e., low-level risks are typically not considered, but remain within the risk register to serve historical purposes as well as support follow-on risk studies as the project and risks evolve).
For the cost estimate, the contingency is calculated as the difference between the P80 cost forecast and the baseline cost estimate. Each option-specific contingency is then allocated on a civil works feature level based on the dollar-weighted relative risk of each feature as quantified by Monte Carlo simulation. Standard deviation is used as the feature-specific measure of risk for contingency allocation purposes. This approach results in a relatively larger portion of all the project feature cost contingency being allocated to features with relatively higher estimated cost uncertainty.
5.0 PROJECT ASSUMPTIONS
The following data sources and assumptions were used in quantifying the costs associated with the project.
a. The Galveston District provided MII MCACES (Micro-Computer Aided Cost Estimating Software) and CEDEP (Corps of Engineers Dredge Estimating Program) files electronically. The MII files transmitted and downloaded June 2019 were the basis for the initial cost and schedule risk analyses. These files were again updated in November 2019.
b. The cost comparisons and risk analyses performed and reflected within this report are based on design scope and estimates that are at the feasibility level.
c. Schedules are analyzed for impact to the project cost in terms of delayed funding, uncaptured escalation (variance from OMB factors and the local market) and unavoidable fixed contract costs and/or languishing federal administration costs incurred throughout delay.
d. Per the CWCCIS Historical State Adjustment Factors in EM 1110-2-1304. The risk analyses accounted for no escalation over and above the national average; however,

10
recent experience in the past five years does indicate a construction inflation above the standard OMB rates published. This risk was considered with the delay impacts.
e. The Cost Engineering MCX guidance generally focuses on the eighty-percent level of confidence (P80) for cost contingency calculation. For this risk analysis, the eighty-percent level of confidence (P80) was used. It should be noted that the use of P80 as a decision criteria is a moderately risk averse approach, generally resulting in higher cost contingencies. However, the P80 level of confidence also assumes a small degree of risk that the recommended contingencies may be inadequate to capture actual project costs.
f. Only high and moderate risk level impacts, as identified in the risk register, were considered for the purposes of calculating cost contingency. Low level risk impacts should be maintained in project management documentation, and reviewed at each project milestone to determine if they should be placed on the risk “watch list”.
6.0 RESULTS
The cost and schedule risk analysis results are provided in the following sections. In addition to contingency calculation results, sensitivity analyses are presented to provide decision makers with an understanding of variability and the key contributors to the cause of this variability. 6.1 Risk Register
A risk register is a tool commonly used in project planning and risk analysis. The actual risk register is provided in Appendix A. The complete risk register includes low level risks, as well as additional information regarding the nature and impacts of each risk.
It is important to note that a risk register can be an effective tool for managing identified risks throughout the project life cycle. As such, it is generally recommended that risk registers be updated as the designs, cost estimates, and schedule are further refined, especially on large projects with extended schedules. Recommended uses of the risk register going forward include:
• Documenting risk mitigation strategies being pursued in response to the identified risks and their assessment in terms of probability and impact.
• Providing project sponsors, stakeholders, and leadership/management with a documented framework from which risk status can be reported in the context of project controls.
• Communicating risk management issues. • Providing a mechanism for eliciting feedback and project control input. • Identifying risk transfer, elimination, or mitigation actions required for

11
implementation of risk management plans.
6.2 Cost Contingency and Sensitivity Analysis
The result of risk or uncertainty analysis is quantification of the cumulative impact of all analyzed risks or uncertainties as compared to probability of occurrence. These results, as applied to the analysis herein, depict the overall project cost at intervals of confidence (probability).
Table 1 provides the construction cost contingencies calculated for the P80 confidence level and rounded to the nearest thousand. The construction cost contingencies for the P50 and P90 confidence levels are also provided for illustrative purposes only.
Cost contingency for the Construction risks was quantified as approximately $148 Million at the P80 confidence. Table 1. Construction Cost Contingency Summary
Base Case Estimate $411,070,000
Confidence Level Construction Value ($) w/ Contingencies
Contingency (%)
50% $542,001,000
32%
80% $558,425,000
36%
90% $570,744,000
39%
6.2.1 Sensitivity Analysis Sensitivity analysis generally ranks the relative impact of each risk/opportunity as a percentage of total cost uncertainty. The Crystal Ball software uses a statistical measure (contribution to variance) that approximates the impact of each risk/opportunity contributing to variability of cost outcomes during Monte Carlo simulation. Key cost drivers identified in the sensitivity analysis can be used to support development of a risk management plan that will facilitate control of risk factors and their potential impacts throughout the project lifecycle. Together with the risk register, sensitivity analysis results can also be used to support development of strategies to eliminate, mitigate, accept or transfer key risks. 6.2.2 Sensitivity Analysis Results

12
The risks/opportunities considered as key or primary cost drivers and the respective value variance are ranked in order of importance in contribution to variance bar charts. Opportunities that have a potential to reduce project cost and are shown with a negative sign; risks are shown with a positive sign to reflect the potential to increase project cost. A longer bar in the sensitivity analysis chart represents a greater potential impact to project cost. Figure 1 presents a sensitivity analysis for cost growth risk from the high level cost risks identified in the risk register. Figure 1. Cost Sensitivity Analysis
6.3 Schedule Risk Analysis The result of risk or uncertainty analysis is quantification of the cumulative impact of all analyzed risks or uncertainties as compared to probability of occurrence. These results, as applied to the analysis herein, depict the overall project duration at intervals of confidence (probability). Table 2 provides the schedule duration contingencies calculated for the P80 confidence level. The schedule duration contingencies for the P50 and P90 confidence levels are also provided for illustrative purposes.

13
Schedule duration contingency was quantified as 22 months based on the P80 level of confidence. The schedule contingencies were calculated by applying the high level schedule risks identified in the risk register for each option to the durations of critical path and near critical path tasks. The schedule was not resource loaded and contained open-ended tasks and non-zero lags (gaps in the logic between tasks) that limit the overall utility of the schedule risk analysis. These issues should be considered as limitations in the utility of the schedule contingency data presented. Table 2. Schedule Duration Contingency Summary
Risk Analysis Forecast (base schedule of 40 months)
Duration w/ Contingencies
(months) Contingency1
(months)
50% Confidence 58 18 80% Confidence 62 22 90% Confidence 64 24
Figure 2. Schedule Sensitivity Analysis
7.0 MAJOR FINDINGS/OBSERVATIONS/RECOMMENDATIONS
This section provides a summary of significant risk analysis results that are identified in the preceding sections of the report. Risk analysis results are intended to provide project leadership with contingency information for scheduling, budgeting, and project

14
control purposes, as well as to provide tools to support decision making and risk management as projects progress through planning and implementation. Because of the potential for use of risk analysis results for such diverse purposes, this section also reiterates and highlights important steps, logic, key assumptions, limitations, and decisions to help ensure that the risk analysis results are appropriately interpreted. 7.1 Major Findings/Observations Project cost comparison summaries are provided in Table 1. Additional major findings and observations of the risk analysis are listed below. The Cost Engineering MCX performed the Cost and Schedule Risk Analysis, relying on local Galveston District staff to provide expertise and information gathering. The Galveston PDT conducted initial risk identification in 2015. The cost and schedule risk analysis and cost certification was completed January 2016 and updated in August 2019. The key risk drivers identified through sensitivity analysis suggest a cost contingency of $148M at an 80% confidence level. Cost Risks: From the sensitivity chart, the key or greater Cost Risk items of include:
• CO-8: Bird Island Marsh Construction – The PDT is concerned the long pumping distance will decrease the retainage and not allow the dike to be shaped as designed. The contractor may have to not just widen but dig deeper to get material with more stiff clay.
• CA-2: Market Conditions and Bidding Competition – Corps studies have resulted in an expected dredge shortage as compared to the many anticipated projects in the Gulf region. Generally there are 2 bidders for the 30” hydraulic dredges. A third hydraulic dredge is anticipated to be ready at the time of this construction. There is the possibility of many dredging projects and less competition is possible, resulting in higher bids.
• PM-5: Scope Changes – Scope changes could add cost and delay the project. Moderate scope changes could occur during ship simulations in PED. Additional pipelines could be identified and be added at the time of construction.
• CO-1: Modification and Claims – Technical complexities and site conditions could result in increased risk of contract modifications. This does not include scope growth and cover the "Unknown-Unknowns" for items such as plan omissions, delays, etc.
• TR-11: Sheetpile Wall Design – Quantity of steel required could change with final design. Length is conservative and the quantity is possible to change. This is likely a design/build scope of work and the costs are possible to change,
• EX-2: Fuel Price – Fuel could increase or decrease altering the cost. Estimate assumes $3/gallon and the current price is $2.25/gallon for fuel and is

15
conservative. We assume an increase of $.50/gal based on price fluctuations in the past years.
Lesser project risks can be referenced in the cost sensitivity forecast data. Schedule Risks: The high value of schedule risk indicates a significant uncertainty of key risk items that can translate into added costs within the schedule. From the sensitivity chart, the key or greater Cost Risk items of include:
• PM-4: BCR Delays – Multiple separable elements that need to compete. The PDT feels the BCR will be competitive. Lengthy delays would require an economic update.
• CO-7: Inefficient Contractor – Inefficient contractor may delay the project and affect the quantities.
• PM-1: Federal Funding – Due to the priority of the project it is likely that the project may not receive adequate funding annually. The PHA (Port of Houston Authority) could advance funds which would mitigate the cost and schedule risk.
• PM-5: Scope Changes – Scope changes could add cost and delay the project. • ES-5: Schedule Detail – Estimate and schedule assume 12 separate contracts
and likely to change.
Table 2. Construction Cost Comparison Summary (Uncertainty Analysis)
PROJECT CONTINGENCY
(BASELINE ESTIMATE)
Percentile Baseline TPC
Baseline w/ Contingency
Contingency %
0% $410,606,921 $476,304,028 16% 10% $410,606,921 $509,152,582 24%
20% $410,606,921 $521,470,789 27%
30% $410,606,921 $529,682,928 29% 40% $410,606,921 $533,788,997 30% 50% $410,606,921 $542,001,135 32% 60% $410,606,921 $546,107,205 33%
70% $410,606,921 $554,319,343 35% 80% $410,606,921 $558,425,412 36% 90% $410,606,921 $570,743,620 39% 100% $410,606,921 $632,334,658 54%
16
7.2 Recommendations Risk Management is an all-encompassing, iterative, and life-cycle process of project management. The Project Management Institute’s (PMI) A Guide to the Project Management Body of Knowledge (PMBOK® Guide), 4th edition, states that “project risk management includes the processes concerned with conducting risk management planning, identification, analysis, responses, and monitoring and control on a project.” Risk identification and analysis are processes within the knowledge area of risk management. Its outputs pertinent to this effort include the risk register, risk quantification (risk analysis model), contingency report, and the sensitivity analysis. The intended use of these outputs is implementation by the project leadership with respect to risk responses (such as mitigation) and risk monitoring and control. In short, the effectiveness of the project risk management effort requires that the proactive management of risks not conclude with the study completed in this report. The Cost and Schedule Risk Analysis (CSRA) produced by the PDT identifies issues that require the development of subsequent risk response and mitigation plans. This section provides a list of recommendations for continued management of the risks identified and analyzed in this study. Note that this list is not all inclusive and should not substitute a formal risk management and response plan. The CSRA study serves as a “road map” towards project improvements and reduced risks over time. Timely coordination and risk resolution between the Sponsor, Railroad, and USACE is needed in areas of ROW, mobile home relocations, site access and staging, and funding needs and updates as applicable. The PDT must include the recommended cost and schedule contingencies and incorporate risk monitoring and mitigation on those identified risks. Further iterative study and update of the risk analysis throughout the project life-cycle is important in support of remaining within an approved budget and appropriation. Risk Management: Project leadership should use of the outputs created during the risk analysis effort as tools in future risk management processes. The risk register should be updated at each major project milestone. The results of the sensitivity analysis may also be used for response planning strategy and development. These tools should be used in conjunction with regular risk review meetings. Risk Analysis Updates: Project leadership should review risk items identified in the original risk register and add others, as required, throughout the project life-cycle. Risks should be reviewed for status and reevaluation (using qualitative measure, at a minimum) and placed on risk management watch lists if any risk’s likelihood or impact significantly increases. Project leadership should also be mindful of the potential for secondary (new risks created specifically by the response to an original risk) and residual risks (risks that remain and have unintended impact following response).

A-1
APPENDIX A C
REF
Risk/Opportunity Event Risk Event Description PDT Discussions on Impact and Likelihood
Like
lihoo
d ©
Impa
ct ©
Ris
k Le
vel ©
Like
lihoo
d (S
)
Impa
ct (S
)
Ris
k Le
vel
(S)
Organizational and Project Management Risks (PM)
PM1 Federal Funding Annual appropriations for Design and Construction could be delayed.
Due to the priority of the project it is likely that the project may not receive adequate funding annually. The PHA (Port of Houston Authority) could advance funds which would mitigate the cost and schedule risk.
Possible Negligible Low Possible Significant Medium
PM2 Non Federal Funding Non federal sponsor may not have the funds to cost share.
The port if committed to having the funding. The PPA is anticipated to be signed and the funding will be in place.
Unlikely Negligible Low Unlikely Marginal Low
PM3 Labor Availability There may be a shortage of manpower for the design of this project.
We expect to have enough people to work on this project with the Galveston district. The PHA will supplement any shortages with work in kind.
Unlikely Negligible Low Unlikely Negligible Low
PM4 BCR Delays A low BCR ratio may delay a new start decision.
Multiple separable elements that need to compete. The PDT feels the BCR will be competitive. Lengthy delays would require an economic update.
Unlikely Negligible Low Likely Marginal Medium
PM5 Scope Changes. Scope changes could add cost and delay the project.
Moderate scope changes could occur during ship simulations in PED. Additional pipelines could be identified and be added at the time of construction.
Possible Moderate Medium Possible Marginal Low
PM6 Coordination between Construction and Operations
O&M needs could impact new work dredging schedule.
O&M dredging could cause individual contract schedule coordination between construction and operations. This coordination could cause new work schedule changes. The total duration is not expected to change.
Possible Marginal Low Unlikely Negligible Low
Contract Acquisition Risks (CA)

A-2
CA1 Acquisition Strategy Acquisition Strategy could change.
Contracts are generally separated by contract year and the team does not feel there is a risk of the acquisition changing. The order of the contracts could change but would not add to cost or delay the overall construction schedule.
Unlikely Marginal Low Unlikely Negligible Low
CA2 Market Condition and Bidding Competition (All)
There is the possibility of having a limited number of contractors bid which would increase the cost.
Having limited competition would likely increase the cost. Corps studies have resulted in an expected dredge shortage as compared to the many anticipated projects in the Gulf region. Generally there are 2 bidders for the hydraulic dredging. A third hydraulic dredge is anticipated to be ready at the time of this construction. There is the possibility of many dredging projects and less competition is possible, resulting in higher bids.
Likely Moderate Medium Unlikely Negligible Low
CA3 Small Business Goals Small Business goals could add subcontracting costs.
Majority of dredging and placement area work is assumed for IFB large business. Small business could be added for PA site prep at Segment 4 , 5 and 6 adding marginal cost and schedule delays.
Possible Marginal Low Unlikely Marginal Low
General Technical Risks (TR)
TR1 Mechanical Dredging Quantities
If dredging quantities increase it could lead to additional costs.
Quantities are conservative and not likely to change. Quantities included over depth dredging and advanced maintenance. The design assumes 3:1 slopes and the existing slopes are "flatter" and will require less dredging quantity due to the soft material. (Sta 57+000 to 100+000)
Unlikely Negligible Low Unlikely Negligible Low
TR2 Hydraulic Dredging Quantities - Bay
If dredging quantities increase it could lead to additional costs.
Quantities are conservative and not likely to change. Quantities included over depth dredging and advanced maintenance. The design assumes advanced and over depth with 3:1 side slopes but does not include additional over depth of side slopes due to hard material. Additional side slopes quantities may be required. Final geo data during PED will allow final quantity determination.
Likely Moderate Medium Likely Marginal Medium

A-3
TR3 Hydraulic Dredging Quantities - Bayou
If dredging quantities increase it could lead to additional costs.
Quantities are conservative and not likely to change. There is less Geo information for the Bayou than the bay. Quantities included over depth dredging and advanced maintenance. The design assumes advanced and over depth with 3:1 side slopes but does not include additional over depth of side slopes due to hard material. Additional side slopes quantities may be required. Final geo data during PED will allow final quantity determination.
Very Likely Marginal Medium Very
Likely Marginal Medium
TR4 Long bird Island and 8 Acre Bird Island PA Retainage
Conceptual Level Design and could change.
If less material is retained the island decreases and your costs decrease. If you have an overrun the island increases in size and increases the shaping, grading and rock costs.
Possible Marginal Low Possible Marginal Low
TR5 3 Bird Island Marsh PA Design
Conceptual Level Design and could change.
There is potential for a soft foundation and could require additional material. If less material is retained the island decreases and your costs decrease. If you have an overrun the island increases in size and increases the shaping, grading and rock costs.
Likely Marginal Medium Possible Marginal Low
TR7 M12 PA (NED) Design Conceptual Level Design and could change.
There is potential for a soft foundation and could require additional material. (M12 is significantly better foundation than M11) If less material is retained the island decreases and your costs decrease. If you have an overrun the island increases in size and increases the shaping, grading and rock costs. Sweeping of Cedar Bayou navigation channel material could increase.
Possible Marginal Low Possible Marginal Low
TR9 Oyster Mitigation Design (NED)
Conceptual Level Design and could change.
NED design is an established practice. 31.7 acre oyster reef mitigation for Boliver Roads to Redfish does not rely on berm. 30-inch layer of cultch is sufficient to account for settling.
Unlikely Negligible Low Unlikely Negligible Low

A-4
TR11 Sheetpile Wall Design Initial Sheetpile Wall Design and could change.
Quantity of steel required could change with final design. Length is conservative and the quantity is possible to change. This is likely a design/build scope of work and the costs are possible to change,
Possible Moderate Medium Possible Negligible Low
TR12 Beltway 8 Upland PA Design
The Beltway 8 Design could change.
Exact parameters of onsite borrow material have been estimated and likely to change during PED.
Possible Negligible Low Possible Marginal Low
TR13 E2 Clinton Upland PA Design
The E2 Clinton Design could change.
Exact parameters of onsite borrow material have been estimated and likely to change during PED.
Possible Negligible Low Possible Marginal Low
TR14 Glendale and Filter bed Upland PA Design
Conceptual Level Design and could change.
The estimate assumes onsite borrow but may require offsite import material.
Likely Moderate Medium Possible Marginal Low
TR15 Revetment Rock Sizing Revetment Rock Sizing could change.
Revetment rock sizing could change during PED. Sizing currently to 1500# stone and is conservative. If stone sizing decreased the total tonnage could increase. This risk is independent of the shoaling attenuation feature.
Possible Marginal Low Possible Marginal Low
Lands and Damages (LD)
LD1 LERRDS Additional LERRDS may be required.
ALL upland PA's owned by the Port of Houston. Bay PA's are on submerged lands. Oyster Mitigation reefs avoid tracts under 3rd party leases.
Unlikely Negligible Low Unlikely Negligible Low
LD2 Pipeline Relocations Utility Relocation numbers and construction may change.
8 assumed in estimate and quantities could change. Actual depth are unknown.
Likely Negligible Low Possible Negligible Low
Regulatory Environmental Risks (RG)
RG1 Historical/Cultural Significance
Historical/Cultural Significance No historical or cultural sites expected. Unlikely Negligible Low Unlikely Negligible Low

A-5
RG2 Endangered Species Bird avoidance and minimization
There is no beach disposal on this project. No endangered species concerns with the new work.
Unlikely Negligible Low Unlikely Negligible Low
RG3 Unexploded Ordinance Beltway 8 was former army munitions depot facility.
Sweeps did not find any UXO's with 95% confidence.
Unlikely Marginal Low Unlikely Moderate Low
RG4 Sea Level Rise
The implementation of estimating sea level rise in the design life of all ACOE projects could affect the project cost.
This risk could be eliminated during the design phase. This could decrease the project cost due to less required dredging. Less dredging would also decrease the project schedule.
Unlikely Negligible Low Unlikely Negligible Low
RG5 Oyster Mitigation Oyster mitigation quantity could change.
Oyster mitigation based on updated survey. The Bird island size cannot change and therefore the oyster mitigation acreage not anticipated to change. Additional quantity changes are captured in the technical risks (ADD Risk #). There could be a schedule delay to coordinate with other agencies.
Unlikely Negligible Low Possible Marginal Low
RG6 Air Quality Construction could be delayed to minimize air quality impacts.
Do not foresee having any issue with EPA. Could require Tier 2 equipment and lower fuel efficiency but it is possible.
Unlikely Marginal Low Possible Marginal Low
RG7 Contaminated Dredge Material
Contamination could lead to changing disposal location.
Segment 5 and 6 has the potential for contaminated material. Sediment testing has been done and no contamination was present in levels of significant concern. Current sediment sampling indicates this is a very low risk but if it occurred it could be a moderate cost. The design may require drainage of dredge effluent with onsite management. This would reduce the dredge production requiring the dredge to reduce time for 14 hours/day to 12 hours/day. The PDT feels this a possible risk for the project but has moderate cost risks.
Possible Significant Medium Possible Marginal Low
RG8 Agency Reviews Agency reviews could lead to delays.
There has been ongoing coordination with beneficial use group (BUG) and there are no delays anticipated. Sediment sampling and section 103 has been coordinated with the EPA.
Unlikely Negligible Low Unlikely Negligible Low
A-6
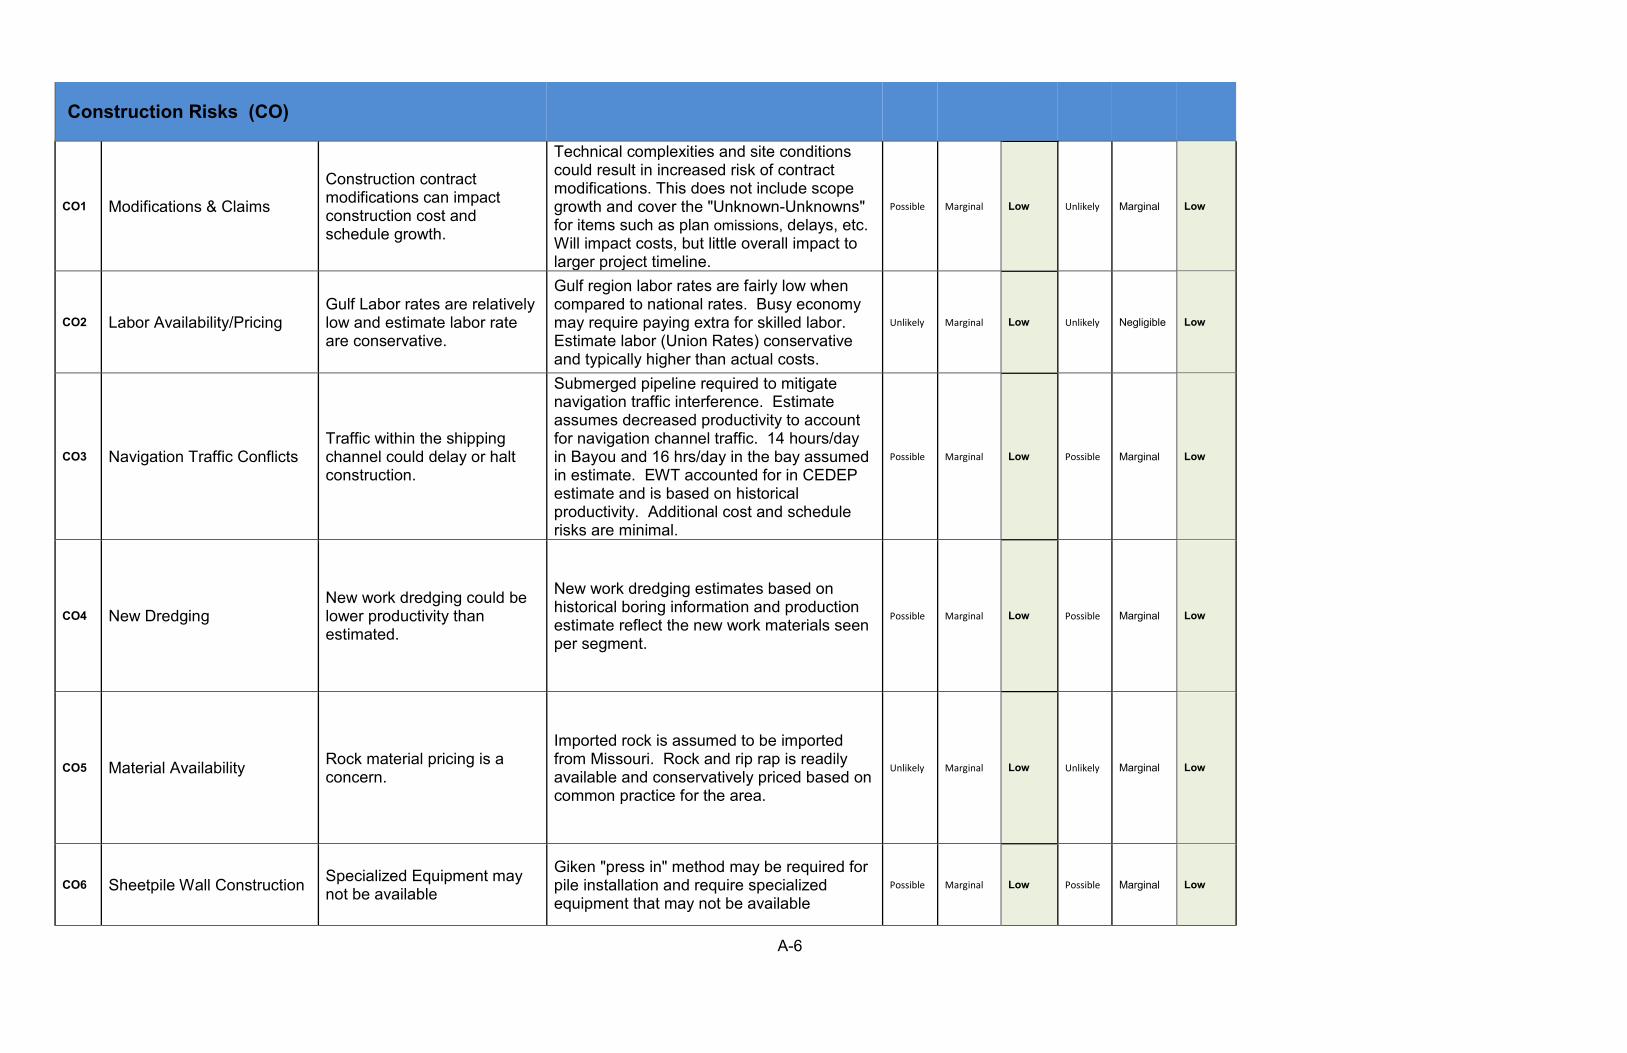
Construction Risks (CO)
CO1 Modifications & Claims
Construction contract modifications can impact construction cost and schedule growth.
Technical complexities and site conditions could result in increased risk of contract modifications. This does not include scope growth and cover the "Unknown-Unknowns" for items such as plan omissions, delays, etc. Will impact costs, but little overall impact to larger project timeline.
Possible Marginal Low Unlikely Marginal Low
CO2 Labor Availability/Pricing Gulf Labor rates are relatively low and estimate labor rate are conservative.
Gulf region labor rates are fairly low when compared to national rates. Busy economy may require paying extra for skilled labor. Estimate labor (Union Rates) conservative and typically higher than actual costs.
Unlikely Marginal Low Unlikely Negligible Low
CO3 Navigation Traffic Conflicts Traffic within the shipping channel could delay or halt construction.
Submerged pipeline required to mitigate navigation traffic interference. Estimate assumes decreased productivity to account for navigation channel traffic. 14 hours/day in Bayou and 16 hrs/day in the bay assumed in estimate. EWT accounted for in CEDEP estimate and is based on historical productivity. Additional cost and schedule risks are minimal.
Possible Marginal Low Possible Marginal Low
CO4 New Dredging New work dredging could be lower productivity than estimated.
New work dredging estimates based on historical boring information and production estimate reflect the new work materials seen per segment.
Possible Marginal Low Possible Marginal Low
CO5 Material Availability Rock material pricing is a concern.
Imported rock is assumed to be imported from Missouri. Rock and rip rap is readily available and conservatively priced based on common practice for the area.
Unlikely Marginal Low Unlikely Marginal Low
CO6 Sheetpile Wall Construction Specialized Equipment may not be available
Giken "press in" method may be required for pile installation and require specialized equipment that may not be available
Possible Marginal Low Possible Marginal Low
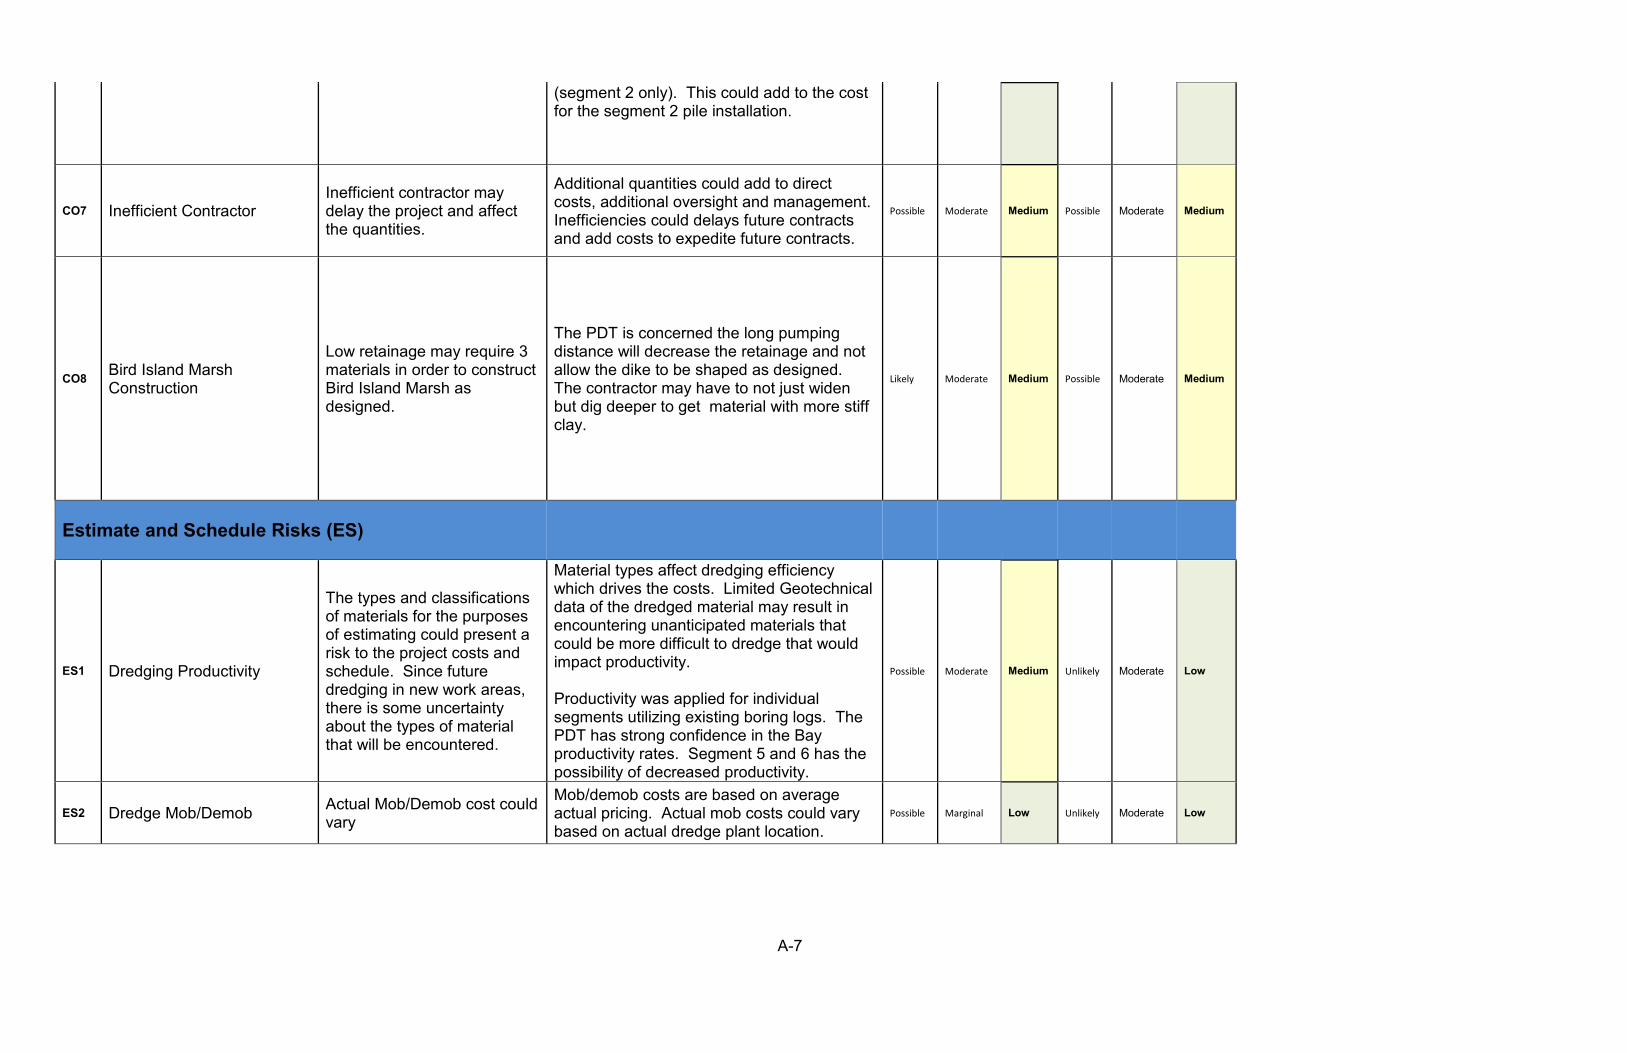
A-7
(segment 2 only). This could add to the cost for the segment 2 pile installation.
CO7 Inefficient Contractor Inefficient contractor may delay the project and affect the quantities.
Additional quantities could add to direct costs, additional oversight and management. Inefficiencies could delays future contracts and add costs to expedite future contracts.
Possible Moderate Medium Possible Moderate Medium
CO8 Bird Island Marsh Construction
Low retainage may require 3 materials in order to construct Bird Island Marsh as designed.
The PDT is concerned the long pumping distance will decrease the retainage and not allow the dike to be shaped as designed. The contractor may have to not just widen but dig deeper to get material with more stiff clay.
Likely Moderate Medium Possible Moderate Medium
Estimate and Schedule Risks (ES)
ES1 Dredging Productivity
The types and classifications of materials for the purposes of estimating could present a risk to the project costs and schedule. Since future dredging in new work areas, there is some uncertainty about the types of material that will be encountered.
Material types affect dredging efficiency which drives the costs. Limited Geotechnical data of the dredged material may result in encountering unanticipated materials that could be more difficult to dredge that would impact productivity. Productivity was applied for individual segments utilizing existing boring logs. The PDT has strong confidence in the Bay productivity rates. Segment 5 and 6 has the possibility of decreased productivity.
Possible Moderate Medium Unlikely Moderate Low
ES2 Dredge Mob/Demob Actual Mob/Demob cost could vary
Mob/demob costs are based on average actual pricing. Actual mob costs could vary based on actual dredge plant location.
Possible Marginal Low Unlikely Moderate Low

A-8
ES3 Relocation Pricing Relocation costs may change.
Relocation costs based on historical costs. Actual costs may vary from escalated price included in estimate. Relocations based on land based equipment. Relocations need to be completed prior to work and could delay the contract. Relocation pricing modeled in LD2.
Unlikely Negligible Low Unlikely Negligible Low
ES4 Equip rates The equipment rates are outdated
Equipment pricing is outdated in the properties but the rates were manually updated based on current data.
Unlikely Negligible Low Unlikely Negligible Low
ES5 Schedule Detail Construction Schedule could change.
Estimate and schedule assume 12 separate contracts. Total dredging time, based on quantities, is 40 months. Schedule based on fiscal years but total schedule is unlikely to extend more than 3-6 months.
Unlikely Marginal Low Possible Marginal Low
ES6 Sheetpile Pricing Sheetpile Pricing Parametric and may change.
Sheetpile pricing is parametric and could vary from the actual pricing. There is updated material pricing but the labor and equipment is likely to change. The labor and equipment risk is modeled in TR11.
Unlikely Marginal Low Possible Marginal Low
External Risks (EX)
EX1 Adverse Weather Location is subject to hurricanes.
Storms/hurricanes in other regions could limit number of dredges available close to project site during performance period, increasing distance to mobilize. This would be paid by another contract but could cause a schedule delay. A local storm could bring additional dredging quantities. Storms could damage existing placement area work.
Possible Marginal Low Likely Negligible Low

A-9
EX2 Fuel Fuel is a volatile cost and can greatly affect the cost of this project.
Fuel could increase or decrease altering the cost. Estimate assumes $3/gallon and the current price is $2.25/gallon for fuel and is conservative. We assume an increase of $.50/gal based on price fluctuations in the past years.
Possible Moderate Medium Unlikely Negligible Low
EX3 Dredge Availability
The availability and number of quality dredges for this particular project is a potential concern.
There is concern in needing more dredges to complete dredging in a required timeframe. Dredges must be spaced a minimum distance, as per USCG (5 nautical miles). PDT feels this is not likely to be an issue. There is always a chance of a disaster response that would occupy the available dredge fleet. Historically this has not been a problem.
Unlikely Moderate Low Possible Marginal Low
EX4 Inflation Inflation could exceed CWCCIS
Project is for 2023-2027 (2028 for LPP) and inflation could exceed CWCCIS tables. Since this is dredging the risks for fuel and labor have already been accounted and therefore this risk is not modeled.
Possible Marginal Low Unlikely Marginal Low
EX5 Upland Mitigation Upland Mitigation
Bank credits are being used and if the project is delayed the credits could change (37 ac assumed). Bank credit cost could change. The bank credit costs covered in the estimate is conservative and therefore the cost risk has not been modeled.
Likely Negligible Low Unlikely Marginal Low
EX6 Ship Accident/Oil Spill Possible accident or oil spill in the channel.
A ship accident or oil spill within the channel could lead to standby costs and schedule delays.
Possible Marginal Low Possible Marginal Low

Houston Ship Channel DMMP
45’ Expansion Channel Improvement Project Cost and Schedule Risk Analysis Report
LPP Plan
Prepared for:
U.S. Army Corps of Engineers, Galveston District
Prepared by:
U.S. Army Corps of Engineers, Walla Walla District Engineering and Construction Division, Cost Engineering Branch
November 20, 2019
US Army Corps of Engineers®

i
TABLE OF CONTENTS
MAIN REPORT ..................................................................................................... 5
1.0 PURPOSE ...................................................................................................... 5
2.0 BACKGROUND .............................................................................................. 5
3.0 REPORT SCOPE ........................................................................................... 5
3.1 Project Scope .............................................................................................. 6
3.2 USACE Risk Analysis Process .................................................................... 6
4.0 METHODOLOGY / PROCESS ....................................................................... 7
4.1 Identify and Assess Risk Factors ................................................................ 9
4.2 Quantify Risk Factor Impacts ...................................................................... 9
4.3 Analyze Cost Estimate and Schedule Contingency ................................... 10
5.0 PROJECT ASSUMPTIONS .......................................................................... 10
6.0 RESULTS ..................................................................................................... 11
6.1 Risk Register ............................................................................................. 11
6.2 Cost Contingency and Sensitivity Analysis ................................................ 12
6.2.1 Sensitivity Analysis ............................................................................. 13
6.2.2 Sensitivity Analysis Results ................................................................ 13
6.3 Schedule Risk Analysis ............................................................................. 14
7.0 MAJOR FINDINGS/OBSERVATIONS/RECOMMENDATIONS .................... 15
7.1 Major Findings/Observations ..................................................................... 15
7.2 Recommendations .................................................................................... 18

ii
LIST OF TABLES
Table ES-1. Construction Contingency Results ............................................. ES-1
Table 1. Construction Cost Contingency Summary ........................................... 12
Table 2. Project Cost Comparison Summary (Uncertainty Analysis) ................. 14
LIST OF FIGURES
Figure 1. Cost Sensitivity Analysis ..................................................................... 13
LIST OF APPENDICES
Risk Register .................................................................................... APPENDIX A
ES-1
EXECUTIVE SUMMARY
The US Army Corps of Engineers (USACE), Galveston District, presents this cost and schedule risk analysis (CSRA) report regarding the risk findings and recommended contingencies for the Galveston District, Houston Ship Channel DMMP. In compliance with Engineer Regulation (ER) 1110-2-1302 CIVIL WORKS COST ENGINEERING, dated September 15, 2008, a Monte-Carlo based risk analysis was conducted by the Project Development Team (PDT) on remaining costs. The purpose of this risk analysis study is to present the cost and schedule risks considered, those determined and respective project contingencies at a recommended 80% confidence level of successful execution to project completion.
The Houston Ship Channel (HSC) project purpose is to reduce transportation costs and address navigation safety issues on the Houston Ship Channel (HSC) system. The HSC consists of an existing 52 mile long deep-draft navigation channel, three deep-draft tributary channels and one shallow draft tributary channel. The primary HSC deep-draft channel has authorized depths ranging from 36 feet to 45 feet and widths ranging generally from 300 feet to 530 feet.
The DMMP documents the dredging and placement needs for the Federal project and associated non- Federal facilities, as feasible, for the next 50-years for the Houston Ship Channel complex, which includes: HSC main stem from Bolivar Roads to the Upper Turning Basin, Bayport Ship Channel, Barbour’s Terminal Cut, Greens Bayou, Jacinto Port, the light-draft channel, Turkey Bend, Turkey Bend Cut off, boater cuts, and barge lanes. The DMMP is developed as a stand-alone document for operations and management of future dredged material for the federal project. The current and future placement plan for continued operation and maintenance of the existing HSC complex is outlined in the December 5, 2017 Preliminary Assessment (HSCPA) and conceptual 50-year DMMP dated December 18, 2018. This is considered the Future Without Project (FWOP) condition for the HSC ECIP Study. The study integrates changes to the FWOP conditions by identifying the base plan for placement needs for the increment of new work and maintenance dredging from the recommended modification which includes dredged material originating from the Federal channel for a period of 50-years. This is considered the Future With Project (FWP) condition for the HSC ECIP Study. Specific to the Houston Ship Channel DMMP, the current project base cost estimate, pre-contingency, approximates $531M. This CSRA included study of estimated base construction, engineering and design and construction management. There are no spent costs and real estate costs are accounted for in the real estate appendix. Based
ES-2
on the results of the analysis, the Cost Engineering Mandatory Center of Expertise for Civil Works (Cost MCX located in Walla Walla District) recommends a contingency value of $209M or approximately 39% of base project cost at an 80% confidence level of successful execution.
Cost estimates fluctuate over time. During this period of study, minor cost fluctuations can and have occurred. For this reason, contingency reporting is based in cost and percent values. Should cost vary to a slight degree with similar scope and risks, contingency per cent values will be reported, cost values rounded.
Table ES-1. Construction Contingency Results
Base Case Estimate $531,384,000
Confidence Level Construction Value ($) w/ Contingencies
Contingency (%)
50% $712,054,000
34%
80% $738,623,000
39%
90% $754,565,000
42%
KEY FINDINGS/OBSERVATIONS RECOMMENDATIONS
A formal Cost Risk Analysis was performed on Houston Ship Channel Improvement Project with the cooperation of the PDT and Cost Engineering Mandatory Center of Expertise for Civil Works. The risks were quantified and a cost risk model developed to determine a contingency at 80% confidence level (CL). The key risk drivers identified through sensitivity analysis suggest a cost contingency of $207M at an 80% confidence level. Cost Risks: From the sensitivity chart, the key or greater Cost Risk items of include:
• PM-5: Scope Changes – Additional ship simulations could result in wider channel recommended in Bay. Pilots contend that 725-ft width is the minimum to ensure safety, and 750-ft desired.
• CO-8: Bird Island Marsh Construction – The PDT is concerned the long pumping distance will decrease the retainage and not allow the dike to be shaped as designed. The contractor may have to not just widen but dig deeper to get material with more stiff clay.
• CO-1: Modification and Claims – Technical complexities and site conditions could result in increased risk of contract modifications. This does not include scope

ES-3
growth and cover the "Unknown-Unknowns" for items such as plan omissions, delays, etc.
• CA-2: Market Conditions and Bidding Competition – Corps studies have resulted in an expected dredge shortage as compared to the many anticipated projects in the Gulf region. Generally there are 2 bidders for the 30” hydraulic dredges. A third hydraulic dredge is anticipated to be ready at the time of this construction. There is the possibility of many dredging projects and less competition is possible, resulting in higher bids.
• EX-2: Fuel Price – Fuel could increase or decrease altering the cost. Estimate assumes $3/gallon and the current price is $2.25/gallon for fuel and is conservative. We assume an increase of $.50/gal based on price fluctuations in the past years.
• TR-11: Sheetpile Wall Design – Quantity of steel required could change with final design. Length is conservative and the quantity is possible to change. This is likely a design/build scope of work and the costs are possible to change,
• ES-1: Dredging Productivity – Material types affect dredging efficiency which drives the costs. Limited Geotechnical data of the dredged material may result in encountering unanticipated materials that could be more difficult to dredge that would impact productivity. Productivity was applied for individual segments utilizing existing boring logs. The PDT has strong confidence in the Bay productivity rates. Segment 5 and 6 has the possibility of decreased productivity. Lesser project risks can be referenced in the cost sensitivity forecast data.
Schedule Risks: The high value of schedule risk indicates a significant uncertainty of key risk items that can translate into added costs within the schedule. From the sensitivity chart, the key or greater Cost Risk items of include:
• CO-8: Bird Island Marsh Construction – Low retainage may require additional time in order to construct Bird Island Marsh as designed.
• PM-4: BCR Delays – Multiple separable elements that need to compete. The PDT feels the BCR will be competitive. Lengthy delays would require an economic update.
• CO-7: Inefficient Contractor - Additional quantities could add to direct costs, additional oversight and management. Inefficiencies could delays future contracts and add costs to expedite future contracts.
• PM-5: Scope Changes – Additional ship simulations could result in wider channel recommended in Bay with a longer construction schedule. Pilots contend that 725-ft width is the minimum to ensure safety, and 750-ft desired
• ES-6: Schedule Detail: Estimate and schedule assume 12 separate contracts and likely to change.
• PM-1: Federal Funding – Due to the priority of the project it is likely that the project may not receive adequate funding annually. The PHA (Port of Houston Authority) could advance funds which would mitigate the cost and schedule risk.

ES-4
Recommendations: The PDT must include the recommended cost and schedule contingencies and incorporate risk monitoring and mitigation on those identified risks. Further iterative study and update of the risk analysis throughout the project life-cycle is important in support of the remaining project work within an approved budget and appropriation.

5
MAIN REPORT
1.0 PURPOSE
Within the authority of the US Army Corps of Engineers (USACE), Galveston District, this report presents the efforts and results of the cost and schedule risk analysis for the Houston Ship Channel DMMP. The report includes risk methodology, discussions, findings and recommendations regarding the identified risks and the necessary contingencies to confidently administer the project, presenting a cost contingency value with an 80% confidence level of successful execution. 2.0 BACKGROUND
The LPP cost estimate of the project is divided into six segments, or reaches, each with a separate placement plan and placement areas. All dredging was assumed to be performed by a 30-inch cutter-head pipeline dredge, except for portions of Boliver Roads to Redfish Reef segment and Redfish to BSC, for which a mechanical dredge will be used. The NED plan includes widening the channel from 530 feet wide to 700 feet wide from Bolivar Roads to Redfish, four bend easings, and easing the Bayport Flare from a 4,000 foot to a 5,300 foot radius in Segment 1; widening the Bayport Ship Channel from 350 and 400 feet to 455 feet in Segment 2; widening the Barbour’s Cut Ship Channel from 300 to 455 feet wide and extending the turning radius flare to 1,800 feet in Segment 3; widening from 400 to 530 feet and deepening from 41.5 to 46.5 feet Boggy Bayou to Greens Bayou and deepening from 41.5 to 46.5 from Greens Bayou to the Washburn Tunnel in Segment 4; deepening from Sims to 610 from 37.5 to 41.5 in Segment 5; and deepening from 37.5 to 41.5 from 610 to the Turning Basin in Segment 6.
The apparent LPP includes widening the channel from 530 feet to 700 feet wide from Redfish to Bayport and from Bayport to Barbour’s Cut. Detailed descriptions of the various HSC segments and tributary channels included in this DMMP are presented in the Integrated Dredged Material Management Plan and Environmental Assessment Report. 3.0 REPORT SCOPE

6
The scope of the risk analysis report is to identify cost and schedule risks with a resulting recommendation for contingencies at the 80 percent confidence level using the risk analysis processes, as mandated by U.S. Army Corps of Engineers (USACE) Engineer Regulation (ER) 1110-2-1150, Engineering and Design for Civil Works, ER 1110-2-1302, Civil Works Cost Engineering, and Engineer Technical Letter 1110-2-573, Construction Cost Estimating Guide for Civil Works. The report presents the contingency results for cost risks for construction features. The CSRA excludes Real Estate costs and does not include consideration for life cycle costs. 3.1 Project Scope The formal process included extensive involvement of the PDT for risk identification and the development of the risk register. The analysis process evaluated the Micro Computer Aided Cost Estimating System (MCACES) cost estimate, project schedule, and funding profiles using Crystal Ball software to conduct a Monte Carlo simulation and statistical sensitivity analysis, per the guidance in Engineer Technical Letter (ETL) CONSTRUCTION COST ESTIMATING GUIDE FOR CIVIL WORKS, dated September 30, 2008.
The project technical scope, estimates and schedules were developed and presented by the District. Consequently, these documents serve as the basis for the risk analysis.
The scope of this study addresses the identification of concerns, needs, opportunities and potential solutions that are viable from an economic, environmental, and engineering viewpoint.
3.2 USACE Risk Analysis Process The risk analysis process for this study follows the USACE Headquarters requirements as well as the guidance provided by the Cost Engineering MCX. The risk analysis process reflected within this report uses probabilistic cost and schedule risk analysis methods within the framework of the Crystal Ball software. Furthermore, the scope of the report includes the identification and communication of important steps, logic, key assumptions, limitations, and decisions to help ensure that risk analysis results can be appropriately interpreted. Risk analysis results are also intended to provide project leadership with contingency information for scheduling, budgeting, and project control purposes, as well as to provide tools to support decision making and risk management as the project progresses through planning and implementation. To fully recognize its benefits, cost and schedule risk analysis should be considered as an ongoing process conducted concurrent to, and iteratively with, other important project processes such as scope and

7
execution plan development, resource planning, procurement planning, cost estimating, budgeting and scheduling. In addition to broadly defined risk analysis standards and recommended practices, this risk analysis was performed to meet the requirements and recommendations of the following documents and sources:
• Cost and Schedule Risk Analysis Process guidance prepared by the USACE Cost Engineering MCX.
• Engineer Regulation (ER) 1110-2-1302 CIVIL WORKS COST ENGINEERING,
dated September 15, 2008.
• Engineer Technical Letter (ETL) CONSTRUCTION COST ESTIMATING GUIDE FOR CIVIL WORKS, dated September 30, 2008.
4.0 METHODOLOGY / PROCESS
The Cost Engineering MCX performed the Cost and Schedule Risk Analysis, relying on local Galveston District staff to provide expertise and information gathering. The Galveston PDT conducted initial risk identification in March 2015. The initial risk identification meeting also included qualitative analysis to produce a risk register that served as the draft framework for the risk analysis. A Risk meeting occurred in March 2015 with an update in December of 2015, resulting in a revision of the identified risks and the current known impacts. The cost and schedule risk analysis and cost certification was completed in January 2016. The project scope was changed and a cost and schedule risk analysis update was again completed in June 2019. Key PDT members included:

8
The risk analysis process for this study is intended to determine the probability of various cost outcomes and quantify the required contingency needed in the cost estimate to achieve the desired level of cost confidence. Per regulation and guidance, the P80 confidence level (80% confidence level) is the normal and accepted cost confidence level. District Management has the prerogative to select different confidence levels, pending approval from Headquarters, USACE. In simple terms, contingency is an amount added to an estimate to allow for items, conditions or events for which the occurrence or impact is uncertain and that experience suggests will likely result in additional costs being incurred or additional time being required. The amount of contingency included in project control plans depends, at least in part, on the project leadership’s willingness to accept risk of project overruns. The less risk that project leadership is willing to accept the more contingency should be applied in the project control plans. The risk of overrun is expressed, in a probabilistic context, using confidence levels. The Cost MCX guidance for cost and schedule risk analysis generally focuses on the 80-percent level of confidence (P80) for cost contingency calculation. It should be noted that use of P80 as a decision criteria is a risk averse approach (whereas the use of P50 would be a risk neutral approach, and use of levels less than 50 percent would be risk seeking). Thus, a P80 confidence level results in greater contingency as compared to a P50 confidence level. The selection of contingency at a particular confidence level is ultimately the decision and responsibility of the project’s District and/or Division management.
Attendance Name Office RepresentingFull Dale Williams CESWG-ECE-P Cost Engineering
Full T. Cheryl Jaynes CESWF-PEC-PF Plan Formulation
Full Nancy C. Young CESWF-EC-G Civil Engineer
Full David B. Boothby CESWF-EC-S Geotech Engineer
Full Harmon Brown CESWF-PEC-CC Environmental
Full Kenny Pablo CESWG-RE Real Estate
Full Nichole Schlund CESWG-RE Real Estate
Full A. Rashid Ali CESWG-ECE-P Cost Engineering
Full Chester Hedderman GBA/JV PHA
Full Richard Ruchoeft PHA PHA
Full Ryan Harbor CESWG-ECE-P Cost Engineering
Full Stephanie Nieves CESWG-ECE-P Cost Engineering
Full Dana Cheney GBA/JV PHA
Full Carl Sepulveda AECOM/JV Environmental
9
The risk analysis process uses Monte Carlo techniques to determine probabilities and contingency. The Monte Carlo techniques are facilitated computationally by a commercially available risk analysis software package (Crystal Ball) that is an add-in to Microsoft Excel. Cost estimates are packaged into an Excel format and used directly for cost risk analysis purposes. The level of detail recreated in the Excel-format schedule is sufficient for risk analysis purposes that reflect the established risk register, but generally less than that of the native format. The primary steps, in functional terms, of the risk analysis process are described in the following subsections. Risk analysis results are provided in Section 6. 4.1 Identify and Assess Risk Factors
Identifying the risk factors via the PDT is considered a qualitative process that results in establishing a risk register that serves as the document for the quantitative study using the Crystal Ball risk software. Risk factors are events and conditions that may influence or drive uncertainty in project performance. They may be inherent characteristics or conditions of the project or external influences, events, or conditions such as weather or economic conditions. Risk factors may have either favorable or unfavorable impacts on project cost and schedule.
A formal PDT meeting was held with the Galveston District office for the purposes of identifying and assessing risk factors. The meeting conducted June 2019 included capable and qualified representatives from multiple project team disciplines and functions, including project management, cost engineering, design, environmental compliance, and real estate.
The initial formal meetings focused primarily on risk factor identification using brainstorming techniques, but also included some facilitated discussions based on risk factors common to projects of similar scope and geographic location. Additionally, numerous conference calls and informal meetings were conducted throughout the risk analysis process on an as-needed basis to further facilitate risk factor identification, market analysis, and risk assessment. 4.2 Quantify Risk Factor Impacts The quantitative impacts (putting it to numbers of cost and time) of risk factors on project plans were analyzed using a combination of professional judgment, empirical data and analytical techniques. Risk factor impacts were quantified using probability distributions (density functions) because risk factors are entered into the Crystal Ball software in the form of probability density functions.

10
Similar to the identification and assessment process, risk factor quantification involved multiple project team disciplines and functions. However, the quantification process relied more extensively on collaboration between cost engineering and risk analysis team members with lesser inputs from other functions and disciplines. This process used an iterative approach to estimate the following elements of each risk factor:
• Maximum possible value for the risk factor • Minimum possible value for the risk factor • Most likely value (the statistical mode), if applicable • Nature of the probability density function used to approximate risk factor
uncertainty • Mathematical correlations between risk factors • Affected cost estimate and schedule elements
The resulting product from the PDT discussions is captured within a risk register as presented in section 6 for cost risk concerns. Note that the risk register records the PDT’s risk concerns, discussions related to those concerns, and potential impacts to the current cost and schedule estimates. The concerns and discussions support the team’s decisions related to event likelihood, impact, and the resulting risk levels for each risk event.
4.3 Analyze Cost Estimate and Schedule Contingency
Contingency is analyzed using the Crystal Ball software, an add-in to the Microsoft Excel format of the cost estimate and schedule. Monte Carlo simulations are performed by applying the risk factors (quantified as probability density functions) to the appropriate estimated cost and schedule elements identified by the PDT. Contingencies are calculated by applying only the moderate and high level risks identified for each option (i.e., low-level risks are typically not considered, but remain within the risk register to serve historical purposes as well as support follow-on risk studies as the project and risks evolve).
For the cost estimate, the contingency is calculated as the difference between the P80 cost forecast and the baseline cost estimate. Each option-specific contingency is then allocated on a civil works feature level based on the dollar-weighted relative risk of each feature as quantified by Monte Carlo simulation. Standard deviation is used as the feature-specific measure of risk for contingency allocation purposes. This approach results in a relatively larger portion of all the project feature cost contingency being allocated to features with relatively higher estimated cost uncertainty.
5.0 PROJECT ASSUMPTIONS

11
The following data sources and assumptions were used in quantifying the costs associated with the project.
a. The Galveston District provided MII MCACES (Micro-Computer Aided Cost Estimating Software) and CEDEP (Corps of Engineers Dredge Estimating Program) files electronically. The MII files transmitted and downloaded June 2019 were the basis for the initial cost and schedule risk analyses. These files were again updated in November 2019.
b. The cost comparisons and risk analyses performed and reflected within this report are based on design scope and estimates that are at the feasibility level.
c. Schedules are analyzed for impact to the project cost in terms of delayed funding, uncaptured escalation (variance from OMB factors and the local market) and unavoidable fixed contract costs and/or languishing federal administration costs incurred throughout delay.
d. Per the CWCCIS Historical State Adjustment Factors in EM 1110-2-1304. The risk analyses accounted for no escalation over and above the national average; however, recent experience in the past five years does indicate a construction inflation above the standard OMB rates published. This risk was considered with the delay impacts.
e. The Cost Engineering MCX guidance generally focuses on the eighty-percent level of confidence (P80) for cost contingency calculation. For this risk analysis, the eighty-percent level of confidence (P80) was used. It should be noted that the use of P80 as a decision criteria is a moderately risk averse approach, generally resulting in higher cost contingencies. However, the P80 level of confidence also assumes a small degree of risk that the recommended contingencies may be inadequate to capture actual project costs.
f. Only high and moderate risk level impacts, as identified in the risk register, were considered for the purposes of calculating cost contingency. Low level risk impacts should be maintained in project management documentation, and reviewed at each project milestone to determine if they should be placed on the risk “watch list”.
6.0 RESULTS
The cost and schedule risk analysis results are provided in the following sections. In addition to contingency calculation results, sensitivity analyses are presented to provide decision makers with an understanding of variability and the key contributors to the cause of this variability. 6.1 Risk Register

12
A risk register is a tool commonly used in project planning and risk analysis. The actual risk register is provided in Appendix A. The complete risk register includes low level risks, as well as additional information regarding the nature and impacts of each risk.
It is important to note that a risk register can be an effective tool for managing identified risks throughout the project life cycle. As such, it is generally recommended that risk registers be updated as the designs, cost estimates, and schedule are further refined, especially on large projects with extended schedules. Recommended uses of the risk register going forward include:
• Documenting risk mitigation strategies being pursued in response to the identified risks and their assessment in terms of probability and impact.
• Providing project sponsors, stakeholders, and leadership/management with a documented framework from which risk status can be reported in the context of project controls.
• Communicating risk management issues. • Providing a mechanism for eliciting feedback and project control input. • Identifying risk transfer, elimination, or mitigation actions required for
implementation of risk management plans.
6.2 Cost Contingency and Sensitivity Analysis
The result of risk or uncertainty analysis is quantification of the cumulative impact of all analyzed risks or uncertainties as compared to probability of occurrence. These results, as applied to the analysis herein, depict the overall project cost at intervals of confidence (probability).
Table 1 provides the construction cost contingencies calculated for the P80 confidence level and rounded to the nearest thousand. The construction cost contingencies for the P50 and P90 confidence levels are also provided for illustrative purposes only.
Cost contingency for the Construction risks was quantified as approximately $93.5 Million at the P80 confidence. Table 1. Construction Cost Contingency Summary
Base Case Estimate $531,384,000
Confidence Level Construction Value ($) w/ Contingencies
Contingency (%)
50% $712,054,000
34%
80% $738,623,000
39%
90% $754,565,000
42%
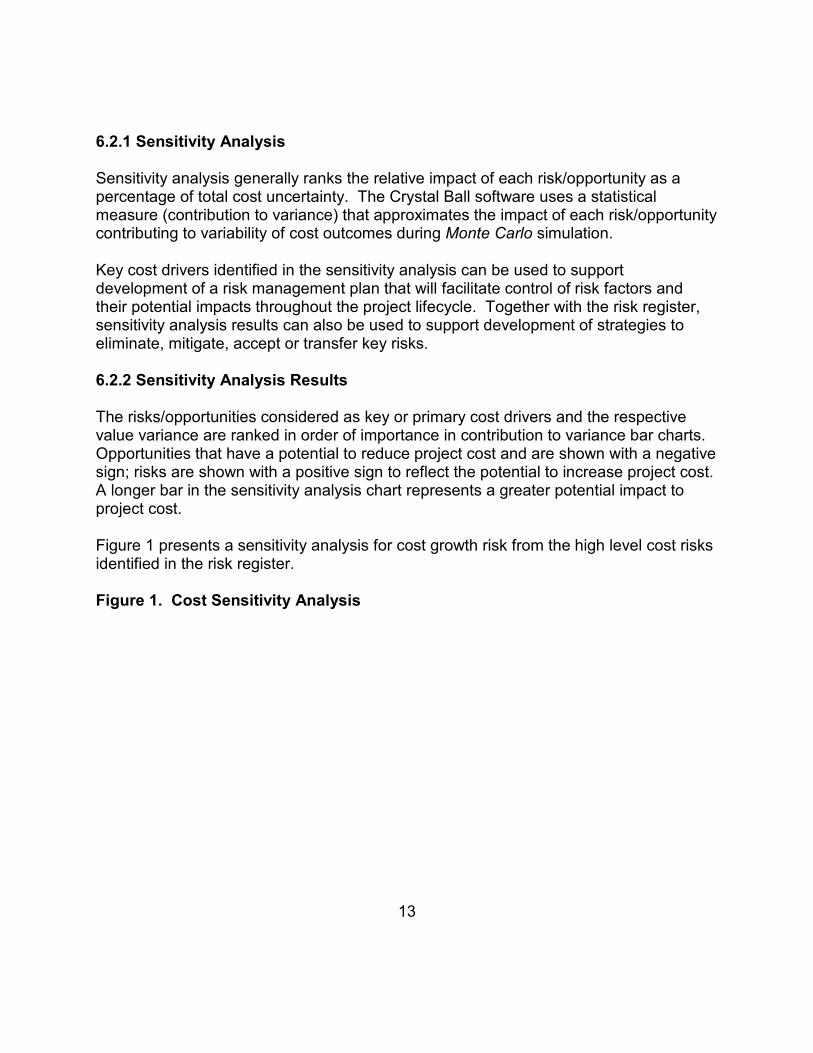
13
6.2.1 Sensitivity Analysis Sensitivity analysis generally ranks the relative impact of each risk/opportunity as a percentage of total cost uncertainty. The Crystal Ball software uses a statistical measure (contribution to variance) that approximates the impact of each risk/opportunity contributing to variability of cost outcomes during Monte Carlo simulation. Key cost drivers identified in the sensitivity analysis can be used to support development of a risk management plan that will facilitate control of risk factors and their potential impacts throughout the project lifecycle. Together with the risk register, sensitivity analysis results can also be used to support development of strategies to eliminate, mitigate, accept or transfer key risks. 6.2.2 Sensitivity Analysis Results The risks/opportunities considered as key or primary cost drivers and the respective value variance are ranked in order of importance in contribution to variance bar charts. Opportunities that have a potential to reduce project cost and are shown with a negative sign; risks are shown with a positive sign to reflect the potential to increase project cost. A longer bar in the sensitivity analysis chart represents a greater potential impact to project cost. Figure 1 presents a sensitivity analysis for cost growth risk from the high level cost risks identified in the risk register. Figure 1. Cost Sensitivity Analysis

14
6.3 Schedule Risk Analysis The result of risk or uncertainty analysis is quantification of the cumulative impact of all analyzed risks or uncertainties as compared to probability of occurrence. These results, as applied to the analysis herein, depict the overall project duration at intervals of confidence (probability). Table 2 provides the schedule duration contingencies calculated for the P80 confidence level. The schedule duration contingencies for the P50 and P90 confidence levels are also provided for illustrative purposes. Schedule duration contingency was quantified as 23 months based on the P80 level of confidence. The schedule contingencies were calculated by applying the high level schedule risks identified in the risk register for each option to the durations of critical path and near critical path tasks. The schedule was not resource loaded and contained open-ended tasks and non-zero lags (gaps in the logic between tasks) that limit the overall utility of the schedule risk analysis. These issues should be considered as limitations in the utility of the schedule contingency data presented.

15
Table 2. Schedule Duration Contingency Summary
Risk Analysis Forecast (base schedule of 52 months)
Duration w/ Contingencies
(months) Contingency1
(months)
50% Confidence 71 19 80% Confidence 75 23 90% Confidence 78 26
Figure 2. Schedule Sensitivity Analysis
7.0 MAJOR FINDINGS/OBSERVATIONS/RECOMMENDATIONS
This section provides a summary of significant risk analysis results that are identified in the preceding sections of the report. Risk analysis results are intended to provide project leadership with contingency information for scheduling, budgeting, and project control purposes, as well as to provide tools to support decision making and risk management as projects progress through planning and implementation. Because of the potential for use of risk analysis results for such diverse purposes, this section also reiterates and highlights important steps, logic, key assumptions, limitations, and decisions to help ensure that the risk analysis results are appropriately interpreted. 7.1 Major Findings/Observations Project cost comparison summaries are provided in Table 1. Additional major findings and observations of the risk analysis are listed below.
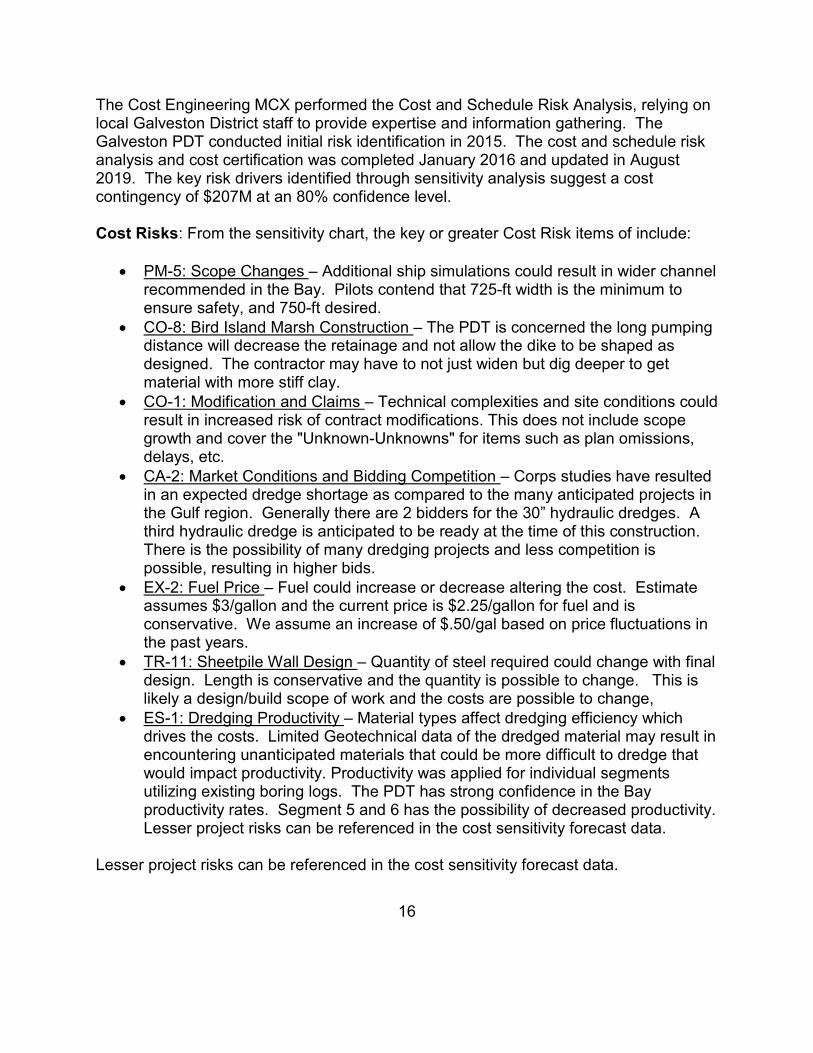
16
The Cost Engineering MCX performed the Cost and Schedule Risk Analysis, relying on local Galveston District staff to provide expertise and information gathering. The Galveston PDT conducted initial risk identification in 2015. The cost and schedule risk analysis and cost certification was completed January 2016 and updated in August 2019. The key risk drivers identified through sensitivity analysis suggest a cost contingency of $207M at an 80% confidence level. Cost Risks: From the sensitivity chart, the key or greater Cost Risk items of include:
• PM-5: Scope Changes – Additional ship simulations could result in wider channel recommended in the Bay. Pilots contend that 725-ft width is the minimum to ensure safety, and 750-ft desired.
• CO-8: Bird Island Marsh Construction – The PDT is concerned the long pumping distance will decrease the retainage and not allow the dike to be shaped as designed. The contractor may have to not just widen but dig deeper to get material with more stiff clay.
• CO-1: Modification and Claims – Technical complexities and site conditions could result in increased risk of contract modifications. This does not include scope growth and cover the "Unknown-Unknowns" for items such as plan omissions, delays, etc.
• CA-2: Market Conditions and Bidding Competition – Corps studies have resulted in an expected dredge shortage as compared to the many anticipated projects in the Gulf region. Generally there are 2 bidders for the 30” hydraulic dredges. A third hydraulic dredge is anticipated to be ready at the time of this construction. There is the possibility of many dredging projects and less competition is possible, resulting in higher bids.
• EX-2: Fuel Price – Fuel could increase or decrease altering the cost. Estimate assumes $3/gallon and the current price is $2.25/gallon for fuel and is conservative. We assume an increase of $.50/gal based on price fluctuations in the past years.
• TR-11: Sheetpile Wall Design – Quantity of steel required could change with final design. Length is conservative and the quantity is possible to change. This is likely a design/build scope of work and the costs are possible to change,
• ES-1: Dredging Productivity – Material types affect dredging efficiency which drives the costs. Limited Geotechnical data of the dredged material may result in encountering unanticipated materials that could be more difficult to dredge that would impact productivity. Productivity was applied for individual segments utilizing existing boring logs. The PDT has strong confidence in the Bay productivity rates. Segment 5 and 6 has the possibility of decreased productivity. Lesser project risks can be referenced in the cost sensitivity forecast data.
Lesser project risks can be referenced in the cost sensitivity forecast data.
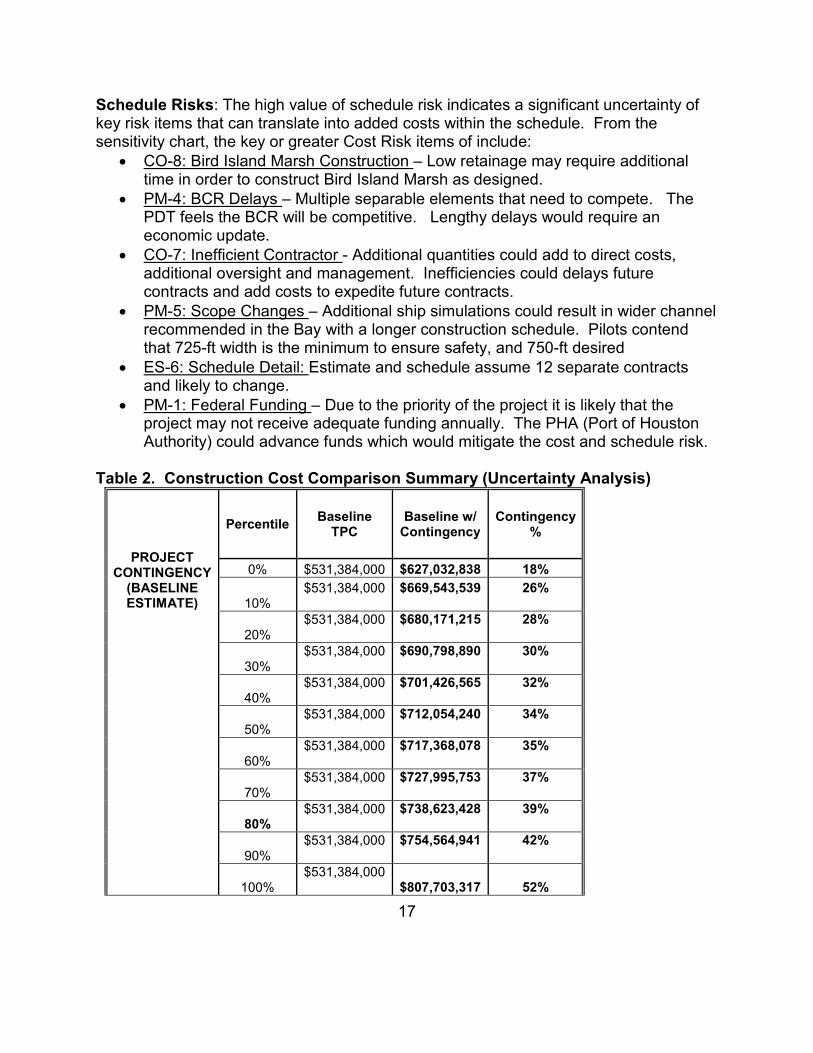
17
Schedule Risks: The high value of schedule risk indicates a significant uncertainty of key risk items that can translate into added costs within the schedule. From the sensitivity chart, the key or greater Cost Risk items of include:
• CO-8: Bird Island Marsh Construction – Low retainage may require additional time in order to construct Bird Island Marsh as designed.
• PM-4: BCR Delays – Multiple separable elements that need to compete. The PDT feels the BCR will be competitive. Lengthy delays would require an economic update.
• CO-7: Inefficient Contractor - Additional quantities could add to direct costs, additional oversight and management. Inefficiencies could delays future contracts and add costs to expedite future contracts.
• PM-5: Scope Changes – Additional ship simulations could result in wider channel recommended in the Bay with a longer construction schedule. Pilots contend that 725-ft width is the minimum to ensure safety, and 750-ft desired
• ES-6: Schedule Detail: Estimate and schedule assume 12 separate contracts and likely to change.
• PM-1: Federal Funding – Due to the priority of the project it is likely that the project may not receive adequate funding annually. The PHA (Port of Houston Authority) could advance funds which would mitigate the cost and schedule risk.
Table 2. Construction Cost Comparison Summary (Uncertainty Analysis)
PROJECT CONTINGENCY
(BASELINE ESTIMATE)
Percentile Baseline TPC
Baseline w/ Contingency
Contingency %
0% $531,384,000 $627,032,838 18%
10% $531,384,000 $669,543,539 26%
20% $531,384,000 $680,171,215 28%
30% $531,384,000 $690,798,890 30%
40% $531,384,000 $701,426,565 32%
50% $531,384,000 $712,054,240 34%
60% $531,384,000 $717,368,078 35%
70% $531,384,000 $727,995,753 37%
80% $531,384,000 $738,623,428 39%
90% $531,384,000 $754,564,941 42%
100% $531,384,000
$807,703,317 52%

18
7.2 Recommendations Risk Management is an all-encompassing, iterative, and life-cycle process of project management. The Project Management Institute’s (PMI) A Guide to the Project Management Body of Knowledge (PMBOK® Guide), 4th edition, states that “project risk management includes the processes concerned with conducting risk management planning, identification, analysis, responses, and monitoring and control on a project.” Risk identification and analysis are processes within the knowledge area of risk management. Its outputs pertinent to this effort include the risk register, risk quantification (risk analysis model), contingency report, and the sensitivity analysis. The intended use of these outputs is implementation by the project leadership with respect to risk responses (such as mitigation) and risk monitoring and control. In short, the effectiveness of the project risk management effort requires that the proactive management of risks not conclude with the study completed in this report. The Cost and Schedule Risk Analysis (CSRA) produced by the PDT identifies issues that require the development of subsequent risk response and mitigation plans. This section provides a list of recommendations for continued management of the risks identified and analyzed in this study. Note that this list is not all inclusive and should not substitute a formal risk management and response plan. The CSRA study serves as a “road map” towards project improvements and reduced risks over time. Timely coordination and risk resolution between the Sponsor, Railroad, and USACE is needed in areas of ROW, mobile home relocations, site access and staging, and funding needs and updates as applicable. The PDT must include the recommended cost and schedule contingencies and incorporate risk monitoring and mitigation on those identified risks. Further iterative study and update of the risk analysis throughout the project life-cycle is important in support of remaining within an approved budget and appropriation. Risk Management: Project leadership should use of the outputs created during the risk analysis effort as tools in future risk management processes. The risk register should be updated at each major project milestone. The results of the sensitivity analysis may also be used for response planning strategy and development. These tools should be used in conjunction with regular risk review meetings. Risk Analysis Updates: Project leadership should review risk items identified in the original risk register and add others, as required, throughout the project life-cycle. Risks should be reviewed for status and reevaluation (using qualitative measure, at a minimum) and placed on risk management watch lists if any risk’s likelihood or impact significantly increases. Project leadership should also be mindful of the potential for secondary (new risks created specifically by the response to an original risk) and residual risks (risks that remain and have unintended impact following response).

A-1
APPENDIX A
CR
EF
Risk/Opportunity Event Risk Event Description PDT Discussions on Impact and Likelihood
Like
lihoo
d ©
Impa
ct ©
Ris
k Le
vel ©
Like
lihoo
d (S
)
Impa
ct (S
)
Ris
k Le
vel
(S)
Organizational and Project Management Risks (PM)
PM1 Federal Funding Annual appropriations for Design and Construction could be delayed.
Due to the priority of the project it is likely that the project may not receive adequate funding annually. The PHA (Port of Houston Authority) could advance funds which would mitigate the cost and schedule risk.
Possible Negligible Low Possible Significant Medium
PM2 Non Federal Funding Non federal sponsor may not have the funds to cost share.
The port if committed to having the funding. The PPA is anticipated to be signed and the funding will be in place.
Unlikely Negligible Low Unlikely Marginal Low
PM3 Labor Availability There may be a shortage of manpower for the design of this project.
We expect to have enough people to work on this project with the Galveston district. The PHA will supplement any shortages with work in kind.
Unlikely Negligible Low Unlikely Negligible Low
PM4 BCR Delays A low BCR ratio may delay a new start decision.
Multiple separable element that need to compete. The PDT feels the BCR will be competitive. Lengthy delays would require an economic update.
Unlikely Negligible Low Likely Marginal Medium
PM5 Scope Changes. Scope changes could add cost and delay the project.
Additional ship simulations could result in wider channel recommended in Bay. Pilots contend that 725-ft width is the minimum to ensure safety, and 750-ft desired. Additional pipelines could be identified and be added at the time of construction.
Possible Significant Medium Unlikely Negligible Low
PM6 Coordination between Construction and Operations
O&M needs could impact new work dredging schedule.
O&M dredging could cause individual contract schedule coordination between construction and operations. This coordination could cause new work schedule changes. The total duration is not expected to change.
Possible Marginal Low Unlikely Negligible Low
Contract Acquisition Risks (CA)

A-2
CA1 Acquisition Strategy Acquisition Strategy could change.
Contracts are generally separated by contract year and the team does not feel there is a risk of the acquisition changing. The order of the contracts could change but would not add to cost or delay the overall construction schedule.
Unlikely Marginal Low Unlikely Negligible Low
CA2 Market Condition and Bidding Competition (All)
There is the possibility of having a limited number of contractors bid, due to increased work advertised, which would increase the cost.
Having limited competition would likely increase the cost. Corps studies have resulted in an expected dredge shortage as compared to the many anticipated projects in the Gulf region. Generally there are 2 bidders for the hydraulic dredging. A third hydraulic dredge is anticipated to be ready at the time of this construction. There is the possibility of many dredging projects and less competition is possible, resulting in higher bids.
Likely Moderate Medium Unlikely Negligible Low
CA3 Small Business Goals Small Business goals could add subcontracting costs.
Majority of dredging and placement area work is assumed for IFB large business. Small business could be added for PA site prep at Segment 4 , 5 and 6 adding marginal cost and schedule delays.
Possible Marginal Low Unlikely Marginal Low
General Technical Risks (TR)
TR1 Mechanical Dredging Quantities
If dredging quantities increase it could lead to additional costs.
Quantities are conservative and not likely to change. Quantities included over depth dredging and advanced maintenance. The design assumes 3:1 slopes and the existing slopes are "flatter" and will require less dredging quantity due to the soft material. (Sta 57+000 to 100+000)
Unlikely Negligible Low Unlikely Negligible Low
TR2 Hydraulic Dredging Quantities - Bay
If dredging quantities increase it could lead to additional costs.
Quantities are conservative and not likely to change. Quantities included over depth dredging and advanced maintenance. The design assumes advanced and over depth with 3:1 side slopes but does not include additional over depth of side slopes due to hard material. Additional side slopes quantities may be required. Final geo data during PED will allow final quantity determination.
Likely Moderate Medium Likely Marginal Medium
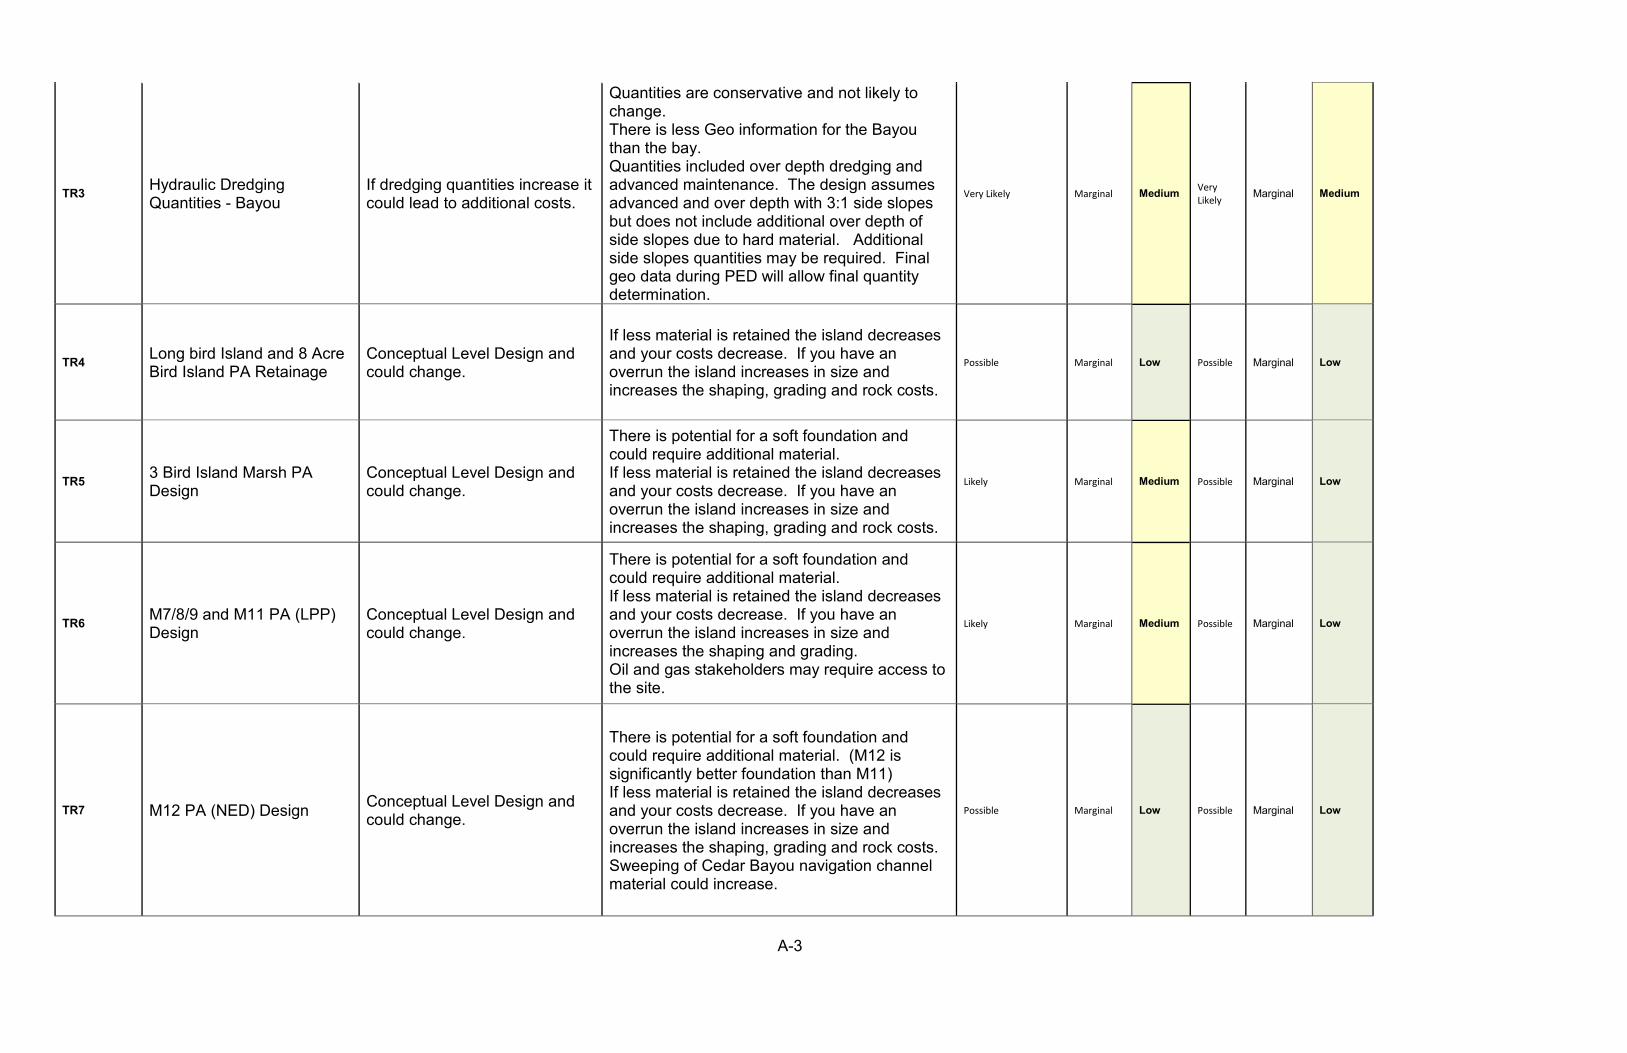
A-3
TR3 Hydraulic Dredging Quantities - Bayou
If dredging quantities increase it could lead to additional costs.
Quantities are conservative and not likely to change. There is less Geo information for the Bayou than the bay. Quantities included over depth dredging and advanced maintenance. The design assumes advanced and over depth with 3:1 side slopes but does not include additional over depth of side slopes due to hard material. Additional side slopes quantities may be required. Final geo data during PED will allow final quantity determination.
Very Likely Marginal Medium Very Likely Marginal Medium
TR4 Long bird Island and 8 Acre Bird Island PA Retainage
Conceptual Level Design and could change.
If less material is retained the island decreases and your costs decrease. If you have an overrun the island increases in size and increases the shaping, grading and rock costs.
Possible Marginal Low Possible Marginal Low
TR5 3 Bird Island Marsh PA Design
Conceptual Level Design and could change.
There is potential for a soft foundation and could require additional material. If less material is retained the island decreases and your costs decrease. If you have an overrun the island increases in size and increases the shaping, grading and rock costs.
Likely Marginal Medium Possible Marginal Low
TR6 M7/8/9 and M11 PA (LPP) Design
Conceptual Level Design and could change.
There is potential for a soft foundation and could require additional material. If less material is retained the island decreases and your costs decrease. If you have an overrun the island increases in size and increases the shaping and grading. Oil and gas stakeholders may require access to the site.
Likely Marginal Medium Possible Marginal Low
TR7 M12 PA (NED) Design Conceptual Level Design and could change.
There is potential for a soft foundation and could require additional material. (M12 is significantly better foundation than M11) If less material is retained the island decreases and your costs decrease. If you have an overrun the island increases in size and increases the shaping, grading and rock costs. Sweeping of Cedar Bayou navigation channel material could increase.
Possible Marginal Low Possible Marginal Low

A-4
TR8 Shoaling Attenuation Feature Design (LPP Only)
Conceptual Level Design and could change.
Highly conceptual level design will change after hydrodynamic modeling in PED. Size, length, position and orientation anticipated to change.
Very Likely Moderate High Possible Marginal Low
TR9 Oyster Mitigation Design (NED)
Conceptual Level Design and could change. NED design is an established practice. Unlikely Negligible Low Unlikely Negligible Low
TR10 Oyster Mitigation Design (LPP)
Conceptual Level Design and could change.
LPP Oyster design is new in Galveston Bay (357.9 AC for the LPP vs. 88 AC for the NED). Berm for San Leon oyster reef may require additional cultch if berm does not provide firm foundation. 2,030,000 CY hydraulically dredged to San Leon oyster reef (177 acres) to construct berm. If berm aborted, some material would be mechanically dredged.
Likely Moderate Medium Possible Marginal Low
TR11 Sheetpile Wall Design Initial Sheetpile Wall Design and could change.
Quantity of steel required could change with final design. Length is conservative and the quantity is possible to change. This is likely a design/build scope of work and the costs are possible to change,
Possible Moderate Medium Possible Negligible Low
TR12 Beltway 8 Upland PA Design
The Beltway 8 Design could change.
Exact parameters of onsite borrow material have been estimated and likely to change during PED.
Possible Negligible Low Possible Marginal Low
TR13 E2 Clinton Upland PA Design
The E2 Clinton Design could change.
Exact parameters of onsite borrow material have been estimated and likely to change during PED.
Possible Negligible Low Possible Marginal Low
TR14 Glendale and Filter bed Upland PA Design
Conceptual Level Design and could change.
The estimate assumes onsite borrow but may require offsite import material.
Likely Moderate Medium Possible Marginal Low
TR15 Revetment Rock Sizing Revetment Rock Sizing could change.
Revetment rock sizing could change during PED. Sizing currently to 1500# stone and is conservative. If stone sizing decreased the total tonnage could increase. This risk is independent of the shoaling attenuation feature.
Possible Marginal Low Possible Marginal Low
Lands and Damages (LD)

A-5
LD1 LERRDS Additional LERRDS may be required.
ALL upland PA's owned by the Port of Houston. Bay PA's are on submerged lands. Oyster Mitigation reefs avoid tracts under 3rd party leases.
Unlikely Negligible Low Unlikely Negligible Low
LD2 Pipeline Relocations Utility Relocation numbers and construction may change.
8 assumed in estimate and quantities could change. Actual depth are unknown.
Likely Negligible Low Possible Negligible Low
Regulatory Environmental Risks (RG)
RG1 Historical/Cultural Significance Historical/Cultural Significance No historical or cultural sites expected. Unlikely Negligible Low Unlikely Negligible Low
RG2 Endangered Species Bird avoidance and minimization
There is no beach disposal on this project. No endangered species concerns with the new work.
Unlikely Negligible Low Unlikely Negligible Low
RG3 Unexploded Ordinance Beltway 8 was former army munitions depot facility.
Sweeps did not find any UXO's with 95% confidence.
Unlikely Marginal Low Unlikely Moderate Low
RG4 Sea Level Rise
The implementation of estimating sea level rise in the design life of all ACOE projects could affect the project cost.
This risk could be eliminated during the design phase. This could decrease the project cost due to less required dredging. Less dredging would also decrease the project schedule.
Unlikely Negligible Low Unlikely Negligible Low
RG5 Oyster Mitigation Oyster mitigation quantity could change.
Oyster mitigation based on updated survey. The Bird island size cannot change and therefore the oyster mitigation acreage not anticipated to change. Additional quantity changes are captured in the technical risks (ADD Risk #). There could be a schedule delay to coordinate with other agencies.
Unlikely Negligible Low Possible Marginal Low
RG6 Air Quality Construction could be delayed to minimize air quality impacts.
Do not foresee having any issue with EPA. Could require Tier 2 equipment and lower fuel efficiency but it is possible.
Unlikely Marginal Low Possible Marginal Low
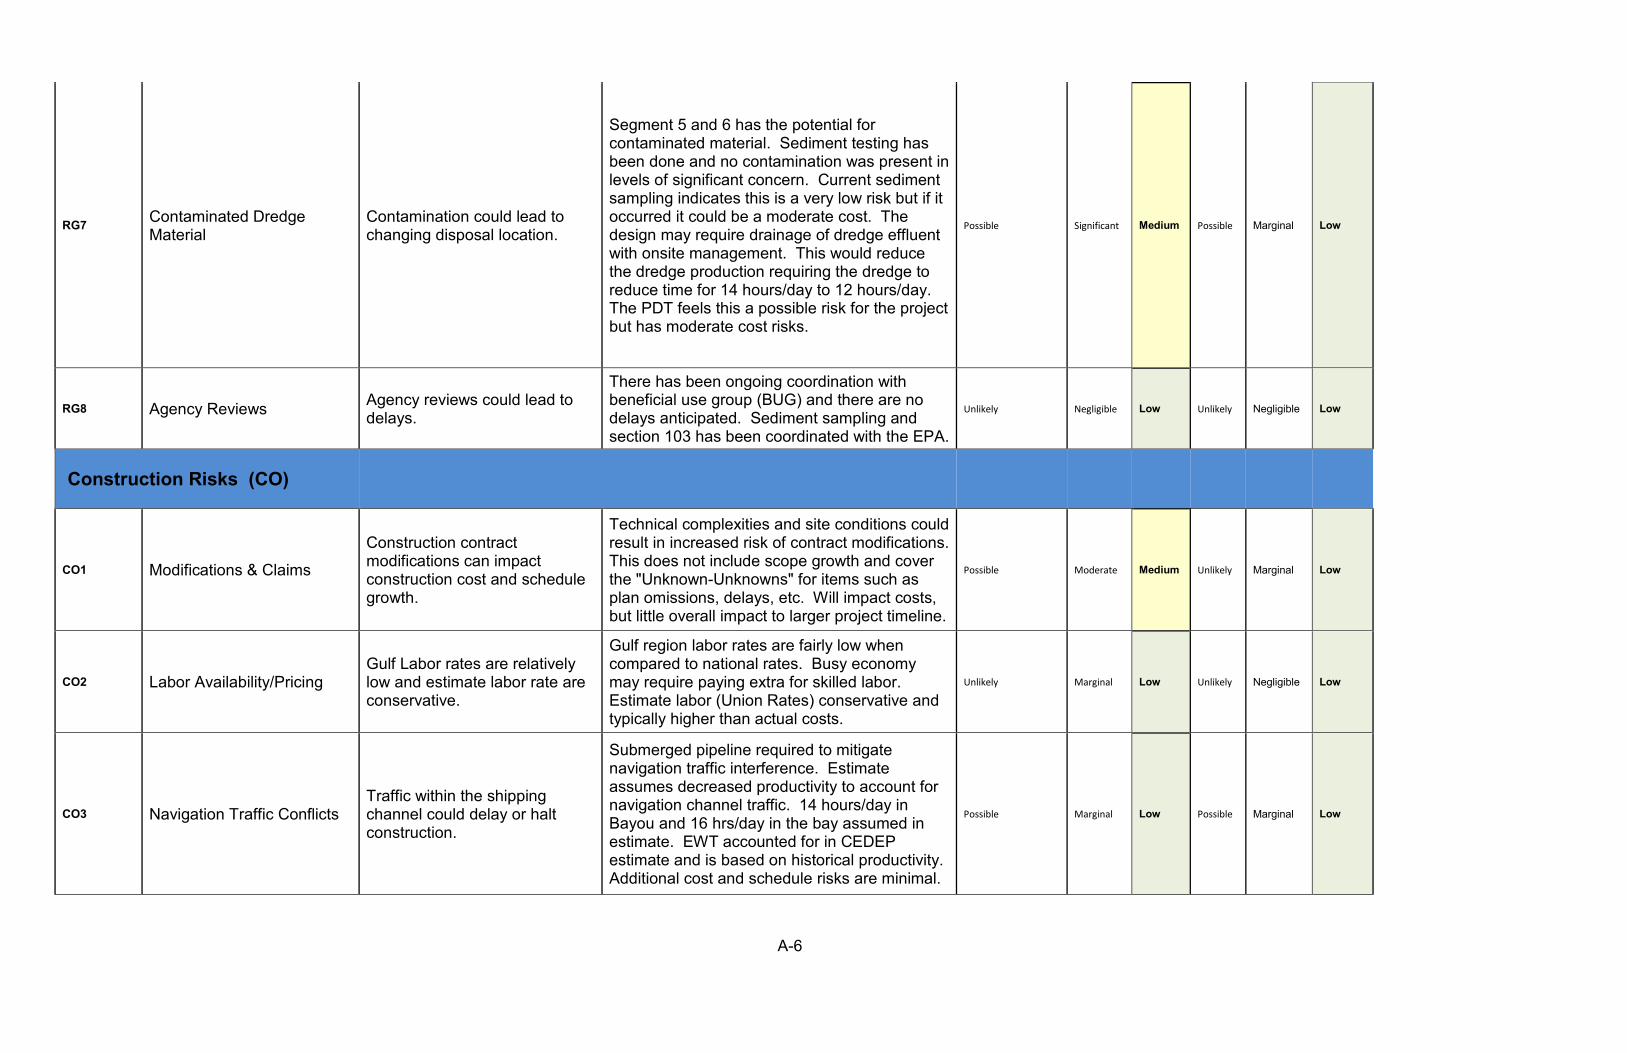
A-6
RG7 Contaminated Dredge Material
Contamination could lead to changing disposal location.
Segment 5 and 6 has the potential for contaminated material. Sediment testing has been done and no contamination was present in levels of significant concern. Current sediment sampling indicates this is a very low risk but if it occurred it could be a moderate cost. The design may require drainage of dredge effluent with onsite management. This would reduce the dredge production requiring the dredge to reduce time for 14 hours/day to 12 hours/day. The PDT feels this a possible risk for the project but has moderate cost risks.
Possible Significant Medium Possible Marginal Low
RG8 Agency Reviews Agency reviews could lead to delays.
There has been ongoing coordination with beneficial use group (BUG) and there are no delays anticipated. Sediment sampling and section 103 has been coordinated with the EPA.
Unlikely Negligible Low Unlikely Negligible Low
Construction Risks (CO)
CO1 Modifications & Claims
Construction contract modifications can impact construction cost and schedule growth.
Technical complexities and site conditions could result in increased risk of contract modifications. This does not include scope growth and cover the "Unknown-Unknowns" for items such as plan omissions, delays, etc. Will impact costs, but little overall impact to larger project timeline.
Possible Moderate Medium Unlikely Marginal Low
CO2 Labor Availability/Pricing Gulf Labor rates are relatively low and estimate labor rate are conservative.
Gulf region labor rates are fairly low when compared to national rates. Busy economy may require paying extra for skilled labor. Estimate labor (Union Rates) conservative and typically higher than actual costs.
Unlikely Marginal Low Unlikely Negligible Low
CO3 Navigation Traffic Conflicts Traffic within the shipping channel could delay or halt construction.
Submerged pipeline required to mitigate navigation traffic interference. Estimate assumes decreased productivity to account for navigation channel traffic. 14 hours/day in Bayou and 16 hrs/day in the bay assumed in estimate. EWT accounted for in CEDEP estimate and is based on historical productivity. Additional cost and schedule risks are minimal.
Possible Marginal Low Possible Marginal Low
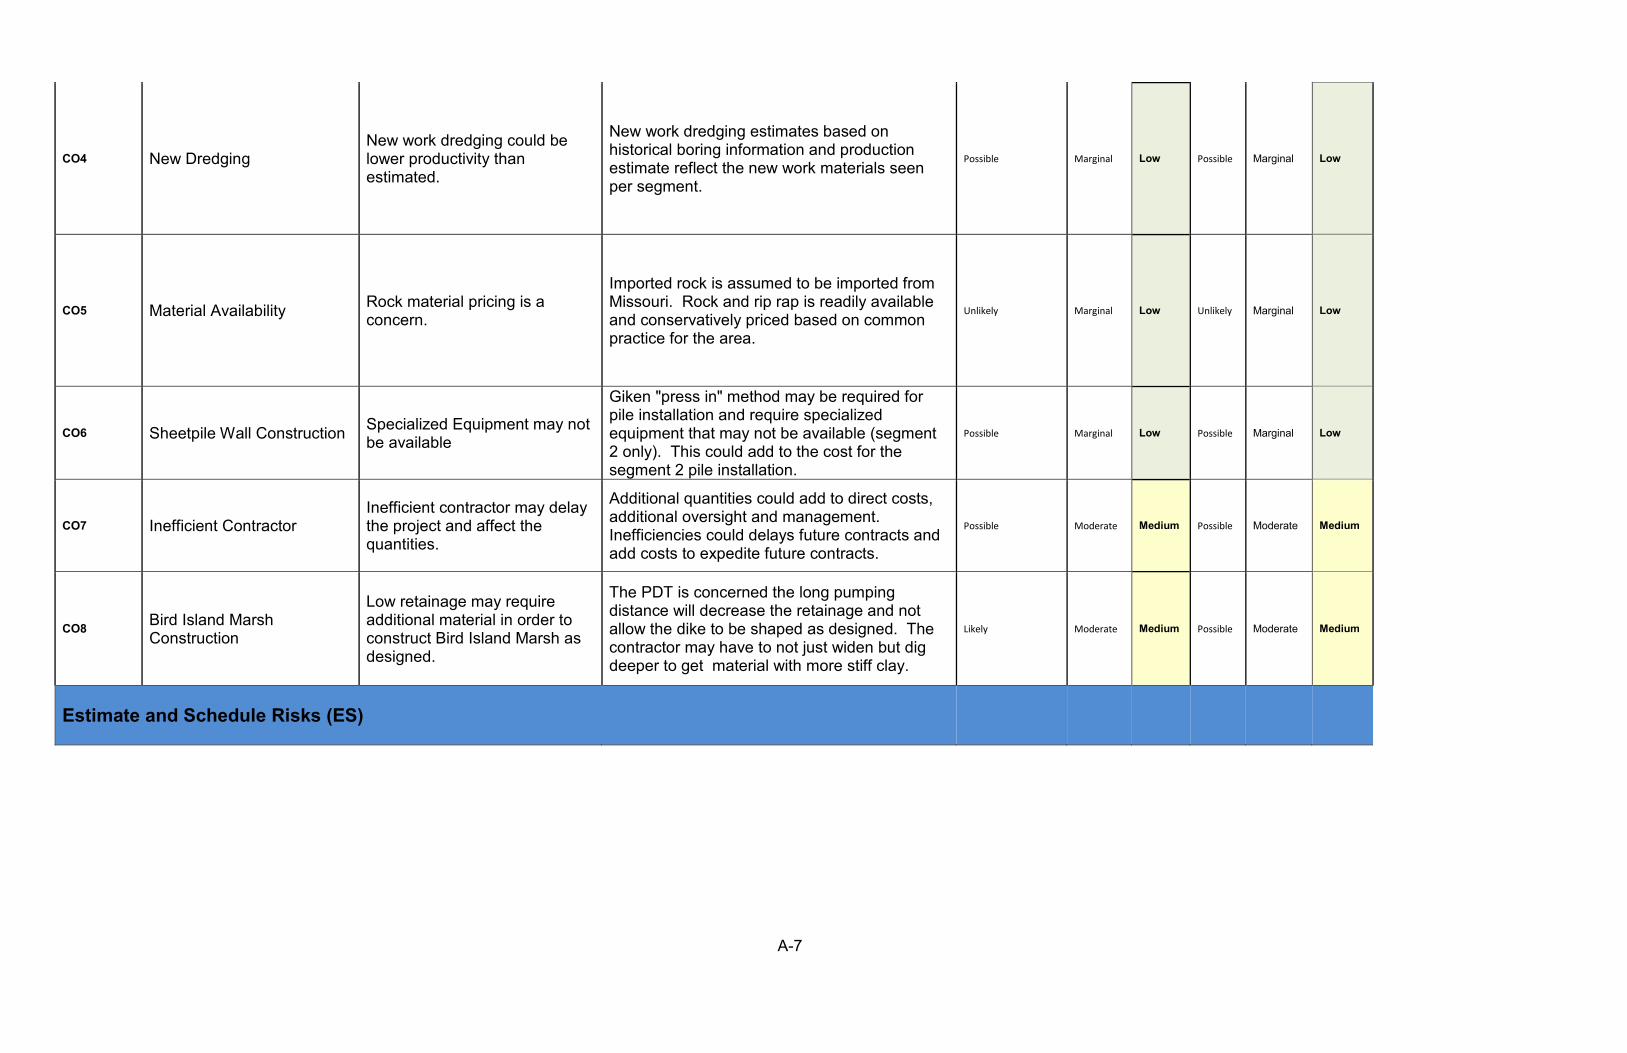
A-7
CO4 New Dredging New work dredging could be lower productivity than estimated.
New work dredging estimates based on historical boring information and production estimate reflect the new work materials seen per segment.
Possible Marginal Low Possible Marginal Low
CO5 Material Availability Rock material pricing is a concern.
Imported rock is assumed to be imported from Missouri. Rock and rip rap is readily available and conservatively priced based on common practice for the area.
Unlikely Marginal Low Unlikely Marginal Low
CO6 Sheetpile Wall Construction Specialized Equipment may not be available
Giken "press in" method may be required for pile installation and require specialized equipment that may not be available (segment 2 only). This could add to the cost for the segment 2 pile installation.
Possible Marginal Low Possible Marginal Low
CO7 Inefficient Contractor Inefficient contractor may delay the project and affect the quantities.
Additional quantities could add to direct costs, additional oversight and management. Inefficiencies could delays future contracts and add costs to expedite future contracts.
Possible Moderate Medium Possible Moderate Medium
CO8 Bird Island Marsh Construction
Low retainage may require additional material in order to construct Bird Island Marsh as designed.
The PDT is concerned the long pumping distance will decrease the retainage and not allow the dike to be shaped as designed. The contractor may have to not just widen but dig deeper to get material with more stiff clay.
Likely Moderate Medium Possible Moderate Medium
Estimate and Schedule Risks (ES)
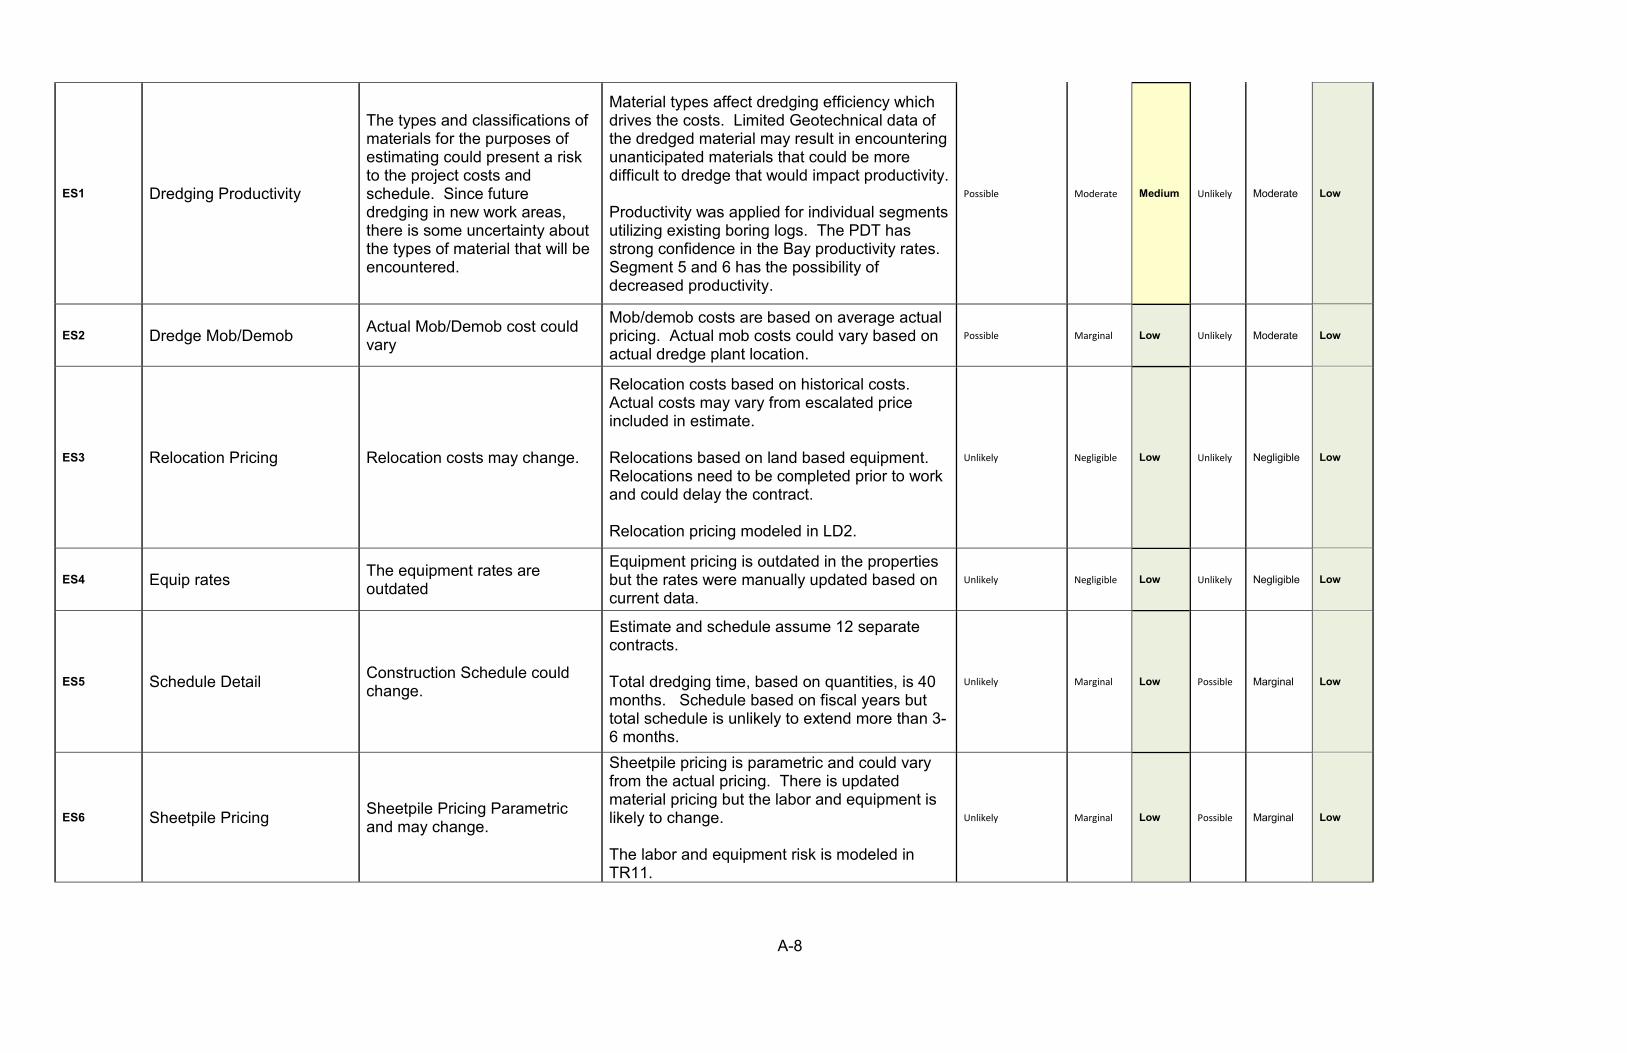
A-8
ES1 Dredging Productivity
The types and classifications of materials for the purposes of estimating could present a risk to the project costs and schedule. Since future dredging in new work areas, there is some uncertainty about the types of material that will be encountered.
Material types affect dredging efficiency which drives the costs. Limited Geotechnical data of the dredged material may result in encountering unanticipated materials that could be more difficult to dredge that would impact productivity. Productivity was applied for individual segments utilizing existing boring logs. The PDT has strong confidence in the Bay productivity rates. Segment 5 and 6 has the possibility of decreased productivity.
Possible Moderate Medium Unlikely Moderate Low
ES2 Dredge Mob/Demob Actual Mob/Demob cost could vary
Mob/demob costs are based on average actual pricing. Actual mob costs could vary based on actual dredge plant location.
Possible Marginal Low Unlikely Moderate Low
ES3 Relocation Pricing Relocation costs may change.
Relocation costs based on historical costs. Actual costs may vary from escalated price included in estimate. Relocations based on land based equipment. Relocations need to be completed prior to work and could delay the contract. Relocation pricing modeled in LD2.
Unlikely Negligible Low Unlikely Negligible Low
ES4 Equip rates The equipment rates are outdated
Equipment pricing is outdated in the properties but the rates were manually updated based on current data.
Unlikely Negligible Low Unlikely Negligible Low
ES5 Schedule Detail Construction Schedule could change.
Estimate and schedule assume 12 separate contracts. Total dredging time, based on quantities, is 40 months. Schedule based on fiscal years but total schedule is unlikely to extend more than 3-6 months.
Unlikely Marginal Low Possible Marginal Low
ES6 Sheetpile Pricing Sheetpile Pricing Parametric and may change.
Sheetpile pricing is parametric and could vary from the actual pricing. There is updated material pricing but the labor and equipment is likely to change. The labor and equipment risk is modeled in TR11.
Unlikely Marginal Low Possible Marginal Low

A-9
External Risks (EX)
EX1 Adverse Weather Location is subject to hurricanes.
Storms/hurricanes in other regions could limit number of dredges available close to project site during performance period, increasing distance to mobilize. This would be paid by another contract but could cause a schedule delay. A local storm could bring additional dredging quantities. Storms could damage existing placement area work.
Possible Marginal Low Likely Negligible Low
EX2 Fuel Fuel is a volatile cost and can greatly affect the cost of this project.
Fuel could increase or decrease altering the cost. Estimate assumes $3/gallon and the current price is $2.25/gallon for fuel and is conservative. We assume an increase of $.50/gal or a decrease of $0.50/gal based price fluctuation in the past years.
Possible Moderate Medium Unlikely Negligible Low
EX3 Dredge Availability
The availability and number of quality dredges for this particular project is a potential concern.
There is concern in needing more dredges to complete dredging in a required timeframe. Dredges must be spaced a minimum distance, as per USCG (5 nautical miles). PDT feels this is not likely to be an issue. There is always a chance of a disaster response that would occupy the available dredge fleet. Historically this has not been a problem.
Unlikely Moderate Low Possible Marginal Low
EX4 Inflation Inflation could exceed CWCCIS
Project is for 2023-2027 (2028 for LPP) and inflation could exceed CWCCIS tables. Since this is dredging the risks for fuel and labor have already been accounted and therefore this risk is not modeled.
Possible Marginal Low Unlikely Marginal Low
EX5 Upland Mitigation Upland Mitigation
Bank credits are being used and if the project is delayed the credits could change (37 ac assumed). Bank credit cost could change. The bank credit costs covered in the estimate is conservative and therefore the cost risk has not been modeled.
Likely Negligible Low Unlikely Marginal Low
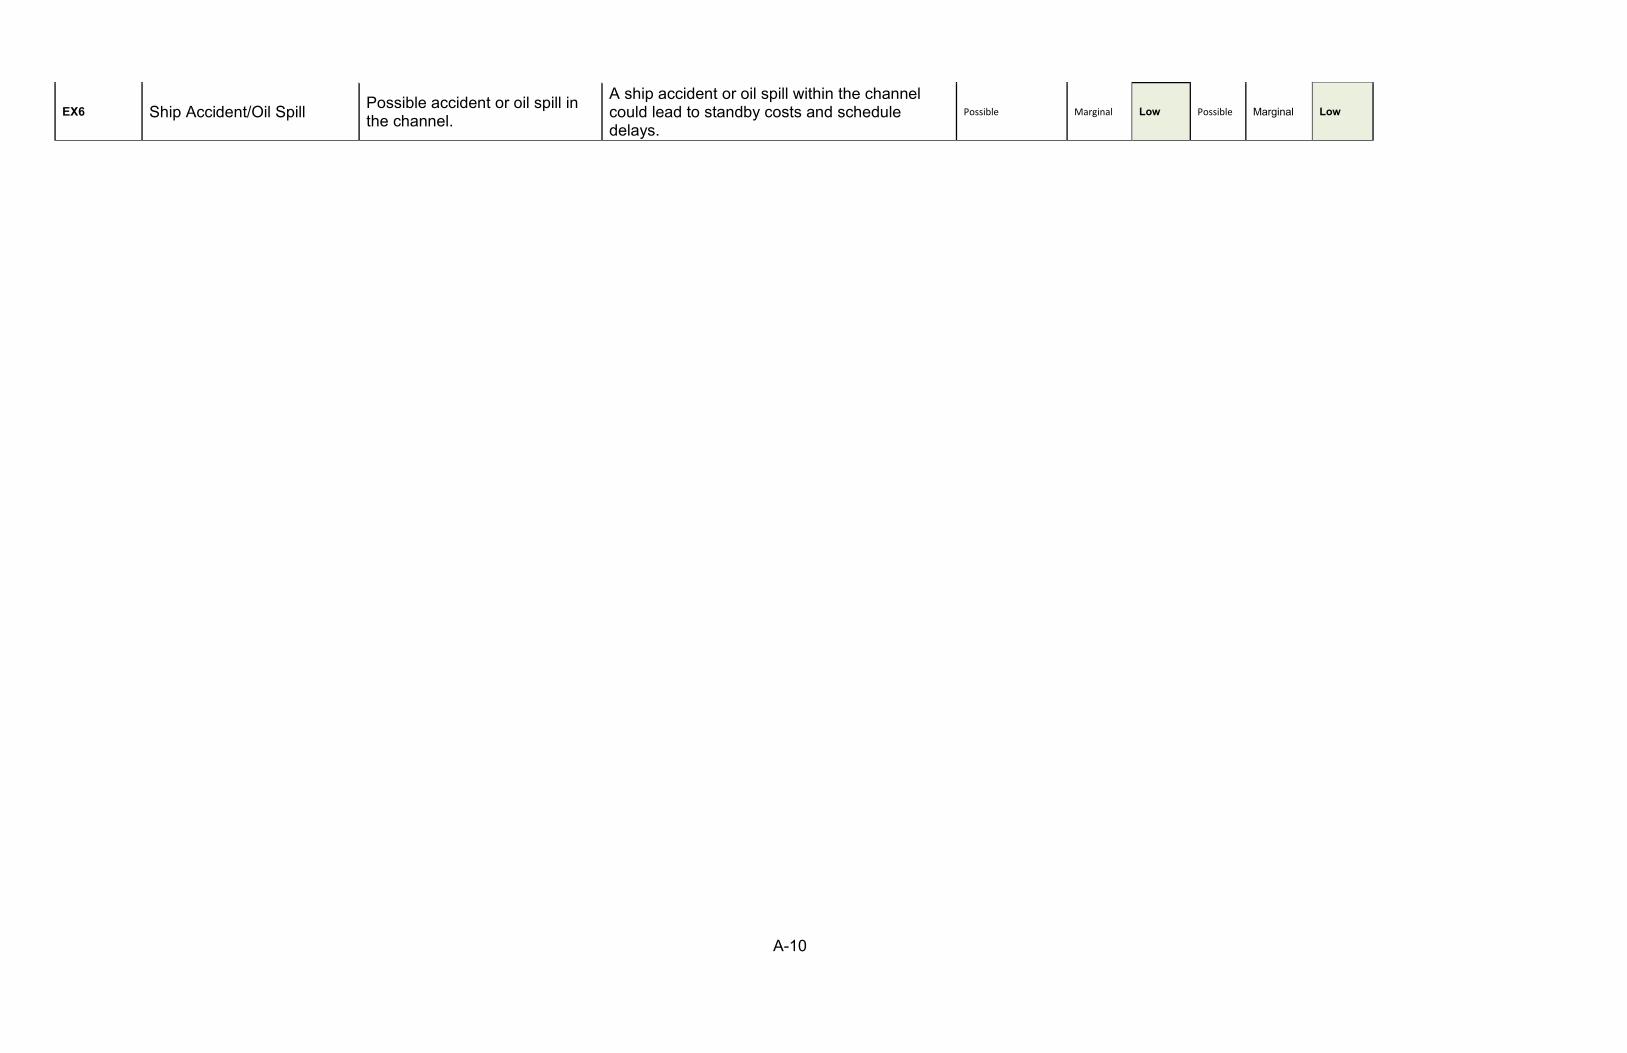
A-10
EX6 Ship Accident/Oil Spill Possible accident or oil spill in the channel.
A ship accident or oil spill within the channel could lead to standby costs and schedule delays.
Possible Marginal Low Possible Marginal Low