attachment 4-5 guidance for developing ecological soil ... · guidance for developing ecological...
TRANSCRIPT

Attachment 4-5Guidance for Developing EcologicalSoil Screening Levels (Eco-SSLs) Eco-SSL Standard Operating Procedure (SOP) # 6: Derivation ofWildlife Toxicity Reference Value (TRV)
OSWER Directive 92857-55
November 2003Revised June 2007

This page left intentionally blank

Attachment 4-5
Ecological Soil Screening Levels (Eco-SSLs)Standard Operating Procedure (SOP) #4: Derivation of Wildlife
Toxicity Reference Value (TRV)
OSWER Directive 92857-55
November 2003Revised June 2007
Prepared for USEPA Region 8
by
Syracuse Research Corporation999 18th Street, Suite 1975, North Tower
Denver, CO 80202

This page left intentionally blank
TABLE OF CONTENTS
1.0 INTRODUCTION . . . . . . . . . . . . . . . . . . . . . . . . . . . . . . . . . . . . . . . . . . . . . . . . . . . . 1 - 11.1 Purpose . . . . . . . . . . . . . . . . . . . . . . . . . . . . . . . . . . . . . . . . . . . . . . . . . . . . . . . . . 1 - 11.2 Scope . . . . . . . . . . . . . . . . . . . . . . . . . . . . . . . . . . . . . . . . . . . . . . . . . . . . . . . . . . 1 - 2
2.0 PRESENTATION AND REVIEW OF THE TOXICOLOGICAL DATA . . . . . . . . . 2 - 12.1 Reporting the Results of the Literature Search . . . . . . . . . . . . . . . . . . . . . . . . . . 2 - 12.2 Reporting the Results of Data Review and Evaluation . . . . . . . . . . . . . . . . . . . . 2 - 12.3 Organizing and Presenting the Data and Data Evaluation Scores . . . . . . . . . . . . 2 - 2
3.0 SUMMARY PLOTS OF TOXICOLOGICAL DATA . . . . . . . . . . . . . . . . . . . . . . . . 3 - 13.1 Sorting by Endpoint . . . . . . . . . . . . . . . . . . . . . . . . . . . . . . . . . . . . . . . . . . . . . . 3 - 13.2 Exclusion of Data Considered Less Applicable for Deriving a TRV . . . . . . . . . 3 - 33.3 Exclusion of Repetitive Values . . . . . . . . . . . . . . . . . . . . . . . . . . . . . . . . . . . . . . 3 - 3
4.0 PROCESS FOR DERIVATION OF WILDLIFE TRVs . . . . . . . . . . . . . . . . . . . . . . . 4 - 14.1 TRV Definition . . . . . . . . . . . . . . . . . . . . . . . . . . . . . . . . . . . . . . . . . . . . . . . . . . 4 - 14.2 Goals and Assumptions . . . . . . . . . . . . . . . . . . . . . . . . . . . . . . . . . . . . . . . . . . . . 4 - 14.3 Methods Considered for TRV Derivation . . . . . . . . . . . . . . . . . . . . . . . . . . . . . 4 - 14.4 Derivation Method Selected . . . . . . . . . . . . . . . . . . . . . . . . . . . . . . . . . . . . . . . . 4 - 4
4.4.1 Minimum Data Set Required to Derive a Wildlife TRV . . . . . . . . . . . . 4 - 64.4.2 Interspecies Sensitivity . . . . . . . . . . . . . . . . . . . . . . . . . . . . . . . . . . . . . 4 - 6
4.5 Specific Procedure for Derivation . . . . . . . . . . . . . . . . . . . . . . . . . . . . . . . . . . . . 4 - 7
5.0 REFERENCES . . . . . . . . . . . . . . . . . . . . . . . . . . . . . . . . . . . . . . . . . . . . . . . . . . . . . . 5 - 1

v
LIST OF FIGURES
Figure 3.1 Example Summary Plot of NOAEL and LOAEL values . . . . . . . . . . . . . . . . 3 - 2
Figure 4.2 NOAEL to LOAEL Ratios in Wildlife TRV Database . . . . . . . . . . . . . . . . . 4 - 10
Figure 4.3 Example of TRV Derivation . . . . . . . . . . . . . . . . . . . . . . . . . . . . . . . . . . . . . 4 - 12
Figure 4.4 Example of TRV Derivation . . . . . . . . . . . . . . . . . . . . . . . . . . . . . . . . . . . . . 4 - 13
Figure 4.5 Example of TRV Derivation . . . . . . . . . . . . . . . . . . . . . . . . . . . . . . . . . . . . . 4 - 14

vi
LIST OF TABLES
Table 2.1 Example of Tabular Output of Toxicological Data from TRV Database . . . . 2 - 3

Guidance for Developing Eco-SSLs Attachment 4-5 June 20071 - 1
1.0 INTRODUCTION
The United States Environmental Protection Agency (USEPA) Office of Emergency andRemedial Response (OERR) with the assistance of a multi-stakeholder workgroup developedrisk-based ecological soil screening levels (Eco-SSLs). Eco-SSLs are concentrations ofcontaminants in soils protective of ecological receptors that commonly come into contact withsoil or ingest biota that live in, or on soil. Eco-SSLs are derived separately for four groups ofecological receptors: plants, soil invertebrates, birds and mammals.
Plant and soil invertebrate Eco-SSLs are developed from available plant and soil invertebratetoxicity data. The mammalian and avian Eco-SSLs are the result of back-calculations from aHazard Quotient (HQ) of 1.0. The HQ is equal to the dose (associated with the contaminantconcentration in soil) divided by a toxicity reference value (TRV). Generic food chain modelsare used to estimate the relationship between the concentration of the contaminant in soil and thedose for the receptor (mg/kg body weight/day). The TRV represents a numerical estimate of ano observable adverse effect level (dose) for the respective contaminant primarily for theendponts of growth, reproduction and survival.
The procedure(s) for deriving the mammalian and avian oral TRVs for calculation of Eco-SSLsare contained within four standard operating procedures (SOPs):
• Eco-SSL SOP #3 Wildlife TRV Literature Search and Retrieval (Attachment4-2)
• Eco-SSL SOP #4 Wildlife TRV Literature Review, Data Extraction and
Coding (Attachment 4-3)
• Eco- SSL SOP #5 Wildlife TRV Data Evaluation (Attachment 4-4)
• Eco-SSL SOP #6 Derivation of the Wildlife TRV (Attachment 4-5)
This document serves as SOP #6 and describes the procedure for derivation of the wildlifeTRVs.
1.1 Purpose
The purpose of the SOP is to provide a clear written description of the procedures for derivationof the wildlife TRVs used for the calculation of the Eco-SSLs. The document is written withtwo primary objectives:
1) To allow the users of the Eco-SSL values to fully understand how the wildlife TRVs arederived including the basis for any assumptions used in the derivation process.
2) To allow users of the guidance to derive wildlife TRVs for additional contaminants for

Guidance for Developing Eco-SSLs Attachment 4-5 June 20071 - 2
which Eco-SSLs are not available at thistime. This provides for reproducible andconsistent results.
1.2 Scope
The second section of this SOP discusseshow the results from the preceding SOPs(literature search, data extraction anddata evaluation) are to be presented. Section 3 describes the process forplotting the toxicological data (NOAELand LOAEL values). Section 4 describesthe process for derivation of the wildlifeTRV based on the results of Sections 2and 3. Section 5 provides references.
This SOP is written as the fourth part ofthe wildlife TRV derivation process andit is assumed that the reader is familiarwith the preceding three portions of theprocess. Some results are used in thisSOP for illustration purposes.
Wildlife TRV Derivation Process
The wildlife TRV derivation process is composed of fourgeneral steps:
• Literature Search and RetrievalEco-SSL SOP #3: Wildlife Literature Search and Retrieval(Attachment 4-2) . A literature search identifies dose-response literature for retrieval.
• Literature Review and Data ExtractionEco-SSL SOP#4: Wildlife TRV Literature Review, DataExtraction and Coding (Attachment 4-3).The retrieved literature studies are reviewed and data areextracted according to an established coding system. Dataare entered into an electronic data base
• Data EvaluationEco-SSL SOP#5: Wildlife TRV Data Evaluation(Attachment 4-4). Each of the results identified in thereviewed literature is scored for quality and applicabilityfor TRV derivation.
• TRV DerivationEco-SSL SOP#6: Wildlife TRV Derivation (Attachment 4-5). This procedure plots the collective dose-responseinformation and establishes the process for estimating theTRV.

Guidance for Developing Eco-SSLs Attachment 4-5 June 20072 - 1
2.0 PRESENTATION AND REVIEW OF THE TOXICOLOGICAL DATA
2.1 Reporting the Results of the Literature Search
The literature search and review results for each contaminant are reported as three separatecategories:
1) Literature from which useful toxicological data is identified and extracted(literature coded);
2) Literature rejected for use; and,
3) Literature that is pending review.
Each of the citations on these lists are identified with a unique record number assigned as part ofthe data extraction process as described in Attachment 4-3. Citations on the “literature rejected”list are labeled with respective literature rejection criteria as described in Attachment 4-3.
2.2 Reporting the Results of Data Review and Evaluation
An electronic database was created to facilitate efficient and accurate data extraction fromindividual reviewed toxicological studies. This database is fully described in Attachment 4-3.Extraction of the data directly into an electronic database facilitates the necessary sorting,searching and presentation of the data for the purposes of TRV derivation. A web-based dataentry system is used allowing remote access by multiple reviewers from any computer withInternet capabilities. Entry to the site is password-protected and limited to only those individualsresponsible for data entry and quality assurance. All information entered is sent directly to themaster database (housed with the ECOTOX database by the EPA Office of Research andDevelopment (ORD) National Health and Ecological Effects Research Laboratory (NHEERL),Mid-Continent Ecology Division-Duluth (MED-Duluth)) avoiding any quality assuranceproblems associated with merging multiple sources of information into one database. The web-based system provides for immediate access to the entered data with any changes to the databaseor data entry process being immediately reflected on the website.
The coding guidelines used for the Eco-SSL Wildlife TRV effort follow the same basic structureas that used by EPA Duluth for ECOTOX. There are, however, some necessary additions andexclusions from the TRV coding system. The TRV database is focused on extracting the noobserved adverse effect level (NOAEL) and lowest observed adverse effect level (LOAEL)doses from each of the toxicological studies while the TERRETOX system is designed to recordall toxicological results from the studies.

Guidance for Developing Eco-SSLs Attachment 4-5 June 20072 - 2
2.3 Organizing and Presenting the Data and Data Evaluation Scores
The toxicity data is downloaded from the database into excel spreadsheet files for eachcontaminant using the tabular format provided in Table 2.1. One table is constructed for aviandata and a second for mammalian data. The tables provide the essential information concerningeach of the toxicity testing results. Table 2.1 provides an example of the output for mammalsand cobalt. The results are numbered sequentially and then sorted by general effect group, effecttype and effect measure.

Guidance for Developing Eco-SSLs Attachment 4-5 June 20072 - 3
Insert Table 2.1 Example of Tabular Output of Toxicological Data from TRV Database

Table 2-1 Example of Mammalian Toxicity Data Extracted and Reviewed for Wildlife Toxicity Reference Value (TRV)
Res
ult #
Ref
#
Che
mic
al F
orm
MW
%
Tes
t Org
anis
m
Phas
e #
# of
Con
c/ D
oses
Con
c or
Dos
es
Study Conc or Dose Units (Units for NOAEL and
LOAEL) Met
hod
of A
naly
ses
Rou
te o
f Exp
osur
e
Exp
osur
e D
urat
ion
Dur
atio
n U
nits
Age
Age
Uni
ts
Life
stag
e
Sex
Eff
ect G
roup
Eff
ect T
ype
Eff
ect M
easu
re
Res
pons
e Si
te
Stud
y N
OA
EL
Stud
y L
OA
EL
bw R
epor
ted
Bod
y W
eigh
t
Bod
y W
eigh
t Uni
ts
Bod
y W
eigh
t (kg
)
Inge
stio
n R
ate
Rep
orte
d?
Inge
stio
n R
ate
Inge
stio
n R
ate
Uni
te
Inge
stio
n R
ate
(kg/
day)
NO
AE
L (m
g/kg
/day
)
LO
AE
L (m
g/kg
/day
)
Dat
a So
urce
Dos
e R
oute
Tes
t Sub
stra
te
Che
mic
al fo
rm
Dos
e Q
uant
ifica
tion
End
poin
t
Dos
e R
ange
Stat
istic
al P
ower
Exp
osur
e D
urat
ion
Tes
t Con
ditio
ns
Tot
al S
core
1 171 Cobalt nitrate 100 Cow (Bos taurus ) 1 2 0/0.3 mg/kg bw/d M FD 45 d 7 mo JV F BIO CHM HMGL BL 0.3 Y 99 kg bw 99 N na na 3.00 0.30 10 10 10 10 10 1 4 1 10 4 702 116 Cobaltous chloride 100 Rat (Rattus norvegicus ) 1 6 0/10/50/100/200/300 ppm in mg/kg U FD 4 w NR NR NR B BIO CHM HMGL BL 200 300 Y 150 g bw 0.15 N na na 0.014 19 29 10 10 5 10 5 1 10 10 10 4 753 19290 Cobalt nitrate 100 Rat (R. norvegicus ) 1 2 0/20 mg/kg bw/d U DR 30 d NR NR JV M BIO ENZ P450 LI 20 Y 175 g bw 0.175 N na na 0.020 20 10 5 5 10 10 1 4 10 10 4 694 129 Cobalt chloride 100 Rat (R. norvegicus ) 1 2 1 mg/ml U DR 35 d NR NR JV M BIO CHM HMCT BL 1 Y 169.7 g bw 0.1697 N na na 0.020 118 10 5 5 10 6 1 4 10 10 4 65
…6 136 Cobalt chloride hexahydrate 24.9 Rat (R. norvegicus ) 1 2 0/75 ppm in mg/kg U FD 80 d 44 d JV M BEH BEH NMVM WO 75 Y 470 g bw 0.47 N na na 0.037 1.5 10 10 5 10 6 4 4 3 10 4 667 86 Cobalt chloride hexahydrate 100 Pig (Sus scrofa) 2 4 0/200/400/600 mg/kg U FD 28 d NR NR NR NR BEH FDB FCNS WO 200 Y 41.58 kg bw 41.58 N 1.896 na 1.47 7.1 10 10 5 10 6 4 4 10 6 4 698 111 Cobalt chloride 100 Rat (R. norvegicus ) 1 2 0/20 mg/kg bw/d M DR 57 d 80 d JV M BEH BEH ACTP WO 20 Y 347 g bw 0.347 Y 34.96 g/d 0.035 20 10 5 10 10 10 4 4 10 10 4 77
10 105 Cobalt sulfate heptahydrate 21.91 Rat (R. norvegicus ) 1 2 0/40 mg/kg bw/d U FD 16 w NR NR NR M PHY PHY Other HE 40 Y 0.387 kg bw 0.387 N na na 0.031 8.8 10 10 5 10 10 4 4 10 10 4 77
12 136 Cobalt chloride hexahydrate 24.9 Rat (R. norvegicus ) 1 2 0/75 ppm in mg/kg U FD 80 d 44 d JV M PTH HIS GHIS NR 75 Y 470 g bw 0.47 N na na 0.037 1.5 10 10 5 10 6 4 4 10 10 4 7313 116 Cobaltous chloride 100 Rat (R. norvegicus ) 1 6 0/10/50/100/200/300 ppm in mg/kg U FD 4 w NR NR NR B PTH ORW SMIX TS 50 100 Y 150 g bw 0.15 N na na 0.014 4.8 9.6 10 10 5 10 5 4 10 10 10 4 7814 105 Cobalt sulfate heptahydrate 21.91 Rat (R. norvegicus ) 1 2 0/40 mg/kg bw/d U FD 16 w NR NR NR M PTH GRS BDWT WO 40 Y 0.387 kg bw 0.387 N na na 0.031 8.8 10 10 5 10 10 4 4 10 10 4 7715 149 Cobalt chloride 100 Pig (S. scrofa) 1 2 0/500 ppm in mg/kg U FD 10 w NR NR JV M PTH HIS GLSN HE 500 Y 25.8 kg bw 25.8 N na na 0.99 19 10 10 5 10 6 4 4 10 10 4 7316 113 Cobalt chloride 45.39 Mouse (Mus musculus ) 1 2 0/180 mg/kg bw/d U GV 5 d NR NR GE F PTH GRS BDWT WO 180 N 36 g bw 0.036 N na na 0.0045 82 10 8 5 10 10 4 4 10 10 4 7517 129 Cobalt chloride 100 Rat (R. norvegicus ) 1 2 1 mg/ml U DR 35 d NR NR JV M PTH ORW SMIX HE 1 N 169.7 g bw 0.1697 N na na 0.020 118 10 5 5 10 5 4 4 10 10 4 67
19 126 Cobalt chloride 100 Rat (R. norvegicus ) 1 3 0/5/20 mg/kg bw/d U FD 69 d 80 d MA M REP REP TEWT TE 5 20 N 0.21 g bw 0.00021 N na na 0.000065 5.0 20 10 10 5 10 10 10 8 10 6 4 8320 124 Cobalt chloride 45.39 Rat (R. norvegicus ) 1 4 0/12/24/48 mg/kg bw/d U GV 28 d NR NR MA F REP REP PRWT WO 12 24 Y 0.3 kg bw 0.3 N na na 0.026 5.4 11 10 8 5 10 10 10 10 10 10 4 8721 109 Cobalt chloride hexahydrate 24.9 Rat (R. norvegicus ) 1 4 0/25/50/100 mg/kg bw/d U GV 9 d NR NR GE F REP REP PRWT WO 100 Y 280 g bw 0.28 N na na 0.024 25 10 8 5 10 10 10 4 10 10 4 8122 113 Cobalt chloride 45.39 Mouse (M. musculus ) 1 2 0/180 mg/kg bw/d U GV 5 d NR NR GE F REP REP PROG WO 180 Y 36 g bw 0.036 N na na 0.0045 82 10 8 5 10 10 10 4 1 10 4 7223 121 Cobalt chloride hexahydrate 45.39 Mouse (M. musculus ) 1 4 0/23/42/72 mg/kg bw/d U DR 13 w 12 w SM M REP REP RSUC WO 23 Y 0.0375 kg bw 0.0375 N 6.32 na 0.0052 10 10 5 5 10 10 10 4 10 10 4 7824 120 Cobalt chloride hexahydrate 24.9 Mouse (M. musculus ) 1 2 0/400 mg/l U DR 9 w 12 w MA M REP REP TEWT TE 400 N 0.037 kg bw 0.037 N na na 0.0051 14 10 5 5 10 5 10 4 10 10 4 7325 123 Cobalt chloride hexahydrate 100 Rat (R. norvegicus ) 1 2 0/20 mg/kg bw/d U FD 70 d 100 d SM M REP REP TEDG TE 20 N 0.523 kg bw 0.523 N na na 0.040 20 10 10 5 10 10 4 4 10 10 4 7726 119 Cobalt 100 Rat (R. norvegicus ) 1 2 0/265 ppm in mg/kg U FD 98 d 100 d MA M REP REP TEWT TE 265 Y 200 g bw 0.2 N na na 0.018 24 10 10 5 4 6 10 4 10 10 4 7327 139 Cobalt chloride hexahydrate 100 Mouse (M. musculus ) 1 2 0/43.4 mg/kg bw/d U DR 13 w 12 w MA M REP REP TEWT TE 43.4 Y 0.045 kg bw 0.045 N na na 0.0061 43 10 5 5 10 10 10 4 10 10 4 7828 187 Cobalt chloride hexahydrate 100 Mouse (M. musculus ) 1 2 0/400 mg/l U DR 10 w 8 to 10 w JV M REP REP PRFM WO 400 N 0.0316 kg bw 0.0316 N na na 0.0044 56 10 5 5 10 5 10 4 10 10 4 73
30 171 Cobalt nitrate 100 Cow (Bos taurus ) 1 2 0/0.3 mg/kg bw/d M FD 45 d 7 mo JV F GRO GRO BDWT WO 0.3 Y 99 kg bw 99 N na na 3.00 0.30 10 10 10 10 10 8 4 1 10 4 7731 136 Cobalt chloride hexahydrate 24.9 Rat (R. norvegicus ) 1 2 0/75 ppm in mg/kg U FD 80 d 44 d JV M GRO GRO BDWT WO 75 Y 470 g bw 0.47 N na na 0.037 1.5 10 10 5 10 6 8 4 1 10 4 6832 86 Cobalt chloride hexahydrate 100 Pig (S. scrofa) 1 4 0/25/50/100 mg/kg U FD 16 w NR NR NR NR GRO GRO BDWT WO 100 Y 97.5 kg bw 97.5 Y 2.35 kg/d 2.35 2.4 10 10 5 10 7 8 4 10 6 4 7433 121 Cobalt chloride hexahydrate 45.39 Mouse (M. musculus ) 1 4 0/23/42/72 mg/kg bw/d U DR 5 w 12 w SM M GRO GRO BDWT WO 42 72 Y 0.0375 kg bw 0.0375 Y 7.8 g/d 0.0078 19 33 10 5 5 10 10 8 10 10 10 4 8234 132 Cobalt sulfate 100 Guinea pig (Cavia porcellus ) 1 2 0/20 mg/kg bw/d U OR 5 w NR NR MA M GRO GRO BDWT WO 20 Y 0.478 kg bw 0.478 N na na 0.037 20 10 8 5 10 10 8 4 10 3 4 7235 111 Cobalt chloride 100 Rat (R. norvegicus ) 1 2 0/20 mg/kg bw/d M DR 57 d 80 d JV M GRO GRO BDWT WO 20 Y 347 g bw 0.347 Y 34.96 g/d 0.035 20 10 5 10 10 10 8 4 1 10 4 7236 116 Cobaltous chloride 100 Rat (R. norvegicus ) 1 6 0/10/50/100/200/300 ppm in mg/kg U FD 4 w NR NR NR B GRO GRO BDWT WO 10 Y 150 g bw 0.15 N na na 0.014 0.96 10 10 5 10 6 8 4 10 10 4 7737 109 Cobalt chloride hexahydrate 24.9 Rat (R. norvegicus ) 1 4 0/25/50/100 mg/kg bw/d U GV 9 d NR NR GE F GRO GRO BDWT WO 25 Y 280 g bw 0.28 N na na 0.024 6.2 10 8 5 10 10 8 4 10 10 4 7938 149 Cobalt chloride 100 Pig (Sus scrofa) 1 2 0/500 ppm in mg/kg U FD 5 w NR NR JV M GRO GRO BDWT WO 500 Y 19.8 kg bw 19.8 N na na 0.80 20 10 10 5 10 6 8 4 10 10 4 7739 139 Cobaltous chloride hexahydrate 100 Mouse (M. musculus ) 1 2 0/43.4 mg/kg bw/d U DR 13 w 12 w MA M GRO GRO BDWT WO 43.4 Y 0.045 kg bw 0.045 N na na 0.0061 43 10 5 5 10 10 8 4 10 10 4 7640 129 Cobalt chloride 100 Rat (R. norvegicus ) 1 2 1 mg/ml U DR 24 d NR NR JV M GRO GRO BDWT WO 1 Y 126.2 g bw 0.1262 N na na 0.015 122 10 5 5 10 6 8 4 10 10 4 72
42 149 Cobalt chloride 100 Pig (S. scrofa) 1 2 0/500 ppm in mg/kg U FD 10 w NR NR JV M MOR MOR MORT NR 500 Y 25.8 kg bw 25.8 N na na 0.99 19 10 10 5 10 6 9 4 10 10 4 7843 113 Cobalt chloride 45.39 Mouse (M. musculus ) 1 2 0/180 mg/kg bw/d U GV 5 d NR NR GE F MOR MOR MORT NR 180 Y 36 g bw 0.036 N na na 0.0045 82 10 8 5 10 10 9 4 10 10 4 8044 132 Cobalt sulfate 100 Guinea pig (Cavia porcellus ) 1 2 0/20 mg/kg bw/d U OR 5 w NR NR MA M MOR MOR SURV WO 20 Y 0.478 kg bw 0.478 N na na 0.037 20 10 8 5 10 10 9 4 10 3 4 73
Data Not Used to Derive TRV86 Cobalt chloride hexahydrate 100 Pig (S. scrofa) 1 4 0/25/50/100 mg/kg U FD 16 w NR NR NR M BIO CHM HMGL BL 100 Y 97.5 kg bw 97.5 Y 2.35 kg/d 2.35 2.4 10 10 5 10 7 1 4 3 6 4 60149 Cobalt chloride 100 Pig (S. scrofa) 1 2 0/500 ppm in mg/kg U FD 10 w NR NR JV M BIO ENZ GLPX BL 500 Y 25.8 kg bw 25.8 N na na 0.99 19 10 10 5 10 6 1 4 3 10 4 63121 Cobalt chloride hexahydrate 45.39 Mouse (M. musculus ) 1 4 0/23/42/72 mg/kg bw/d U DR 12 w 12 w SM M BIO CHM HMCT BL 72 Y 0.038 kg bw 0.038 Y 6.4 g/d 0.0064 31 10 5 5 10 7 1 4 1 10 4 6086 Cobalt chloride hexahydrate 100 Pig (S. scrofa) 3 2 0/400 mg/kg U FD 2 w NR NR NR NR BIO CHM HMGL BL 400 Y 23.62 kg bw 23.62 Y 0.968 kg/d 0.97 16 10 10 5 10 7 1 4 10 3 4 64
ACTP = activity level; B = both; BIO = biochemical; BL = blood; d = days; BDWT = body weight changes; BEH = behavior; bw = body weight; CHM = chemical changes; DR = Drinking water; ENZ = enyzme level changes; F = female; FCNS = food consumption; FD = food; FDB = feeding behavior; g = grams; GE = gestation; GRO = growth; GRS = gross body weight changes; GLPglutathione peroxidase; GLSN = gross lesions; GV = gavage; HE = heart; HIS = histological changes; HMCT = hematocrit; HMGL = hemoglobin; JV = juvenile; kg = kilograms; LI = liver; LOAEL = lowest observed adverse effect level; m = months; M = male; M = measured; MA = mature; mg = milligrams; MOR = effects on mortality and survival; MORT = mortality; na = not applicable; NMVM = number of movements; NOAEL = No Observed Advese Effect Level; NR = Not reported; OR = other oral; ORW = organ weight changes; P450 = changes in cytochrome P450; PHY = physiology; PRFM = sexual performance; PROG = progeny numbers/counts; PRWT = progeny weight; PTH = pathology; REP = reproduction; RSUC = resorbed embryos; SM = sexually mature; SMIX = weight relative to body weight; SURV = survival; TE = testes; TEDG = testes degeneration; TEWT = testes weight; U = unmeasured; w = weeks; WO = whole organism.
Ref Effects Conversion to mg/kg bw/day Dose Data Evaluation ScoreResultExposure
Guidance for Developing Eco-SSLs Attachment 4-5 2 - 3 June 2007
Guidance for Developing Eco-SSLs Attachment 4-5 June 20073 - 1
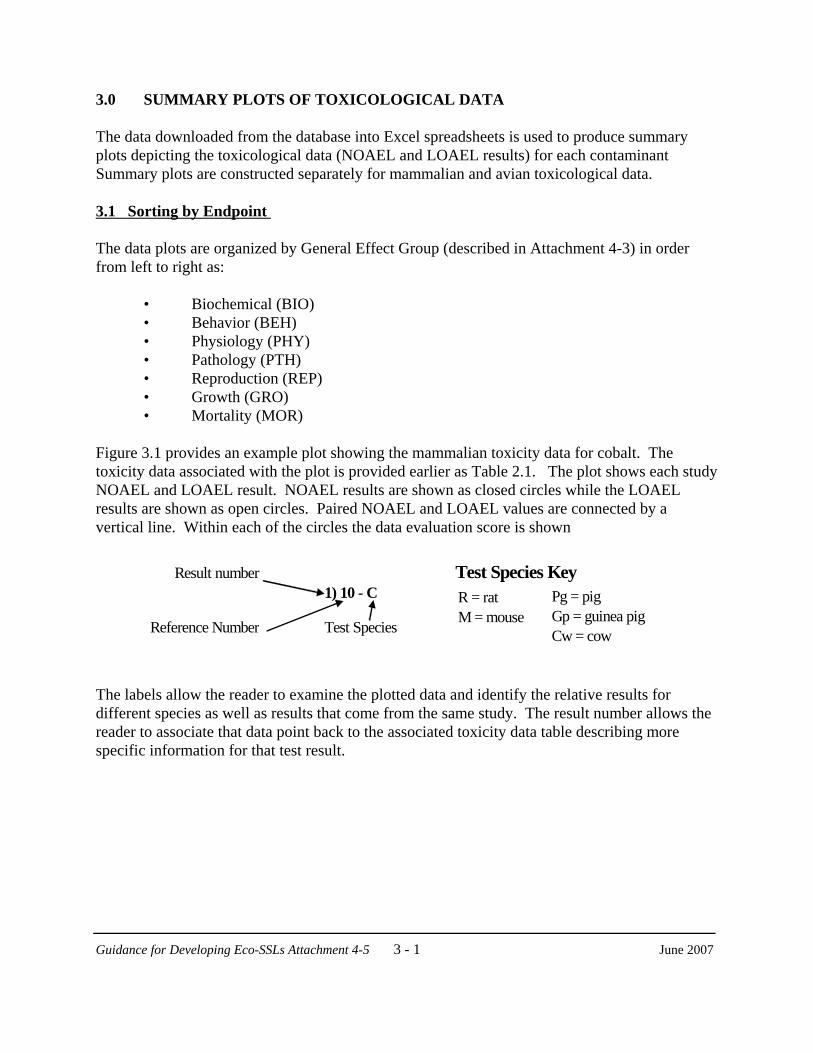
3.0 SUMMARY PLOTS OF TOXICOLOGICAL DATA
The data downloaded from the database into Excel spreadsheets is used to produce summaryplots depicting the toxicological data (NOAEL and LOAEL results) for each contaminantSummary plots are constructed separately for mammalian and avian toxicological data.
3.1 Sorting by Endpoint
The data plots are organized by General Effect Group (described in Attachment 4-3) in orderfrom left to right as:
• Biochemical (BIO)• Behavior (BEH)• Physiology (PHY)• Pathology (PTH)• Reproduction (REP)• Growth (GRO)• Mortality (MOR)
Figure 3.1 provides an example plot showing the mammalian toxicity data for cobalt. Thetoxicity data associated with the plot is provided earlier as Table 2.1. The plot shows each studyNOAEL and LOAEL result. NOAEL results are shown as closed circles while the LOAELresults are shown as open circles. Paired NOAEL and LOAEL values are connected by avertical line. Within each of the circles the data evaluation score is shown
The labels allow the reader to examine the plotted data and identify the relative results fordifferent species as well as results that come from the same study. The result number allows thereader to associate that data point back to the associated toxicity data table describing morespecific information for that test result.
Result number Test Species Key1) 10 - C
Reference Number Test Species
R = ratM = mouse
Pg = pigGp = guinea pigCw = cow

Result number Test Species Key1) 10 - C Lowest Observed Adverse Effect Dose
Reference Number Test Species Paired values from same study when joined by line
No Observed Adverse Effect Dose
Figure 3.1 Example Summary Plot of NOAEL and LOAEL Values
70
75
75
69
65
66
69
77
77 78 77
73
75
87
81
72
83
87 7873
7773
7873
77
68
74
72 72
82
77
79
72
78
80
73
78
67
83
82
76
77 73
0
1
10
100
1000
Dos
e (m
g C
o/kg
BW
/day
)
BIO-NOAEL BIO-LOAEL BEH-NOAEL BEH-LOAEL PHY-NOAEL PHY-LOAEL PTH-NOAELPTH-LOAEL REP-NOAEL REP-LOAEL GRO-NOAEL GRO-LOAEL MOR-NOAEL MOR-LOAEL
10) 1
16-R8) 1
05-R
6) 8
6-Pg
5) 1
36-R
9) 1
36-R
Biochemical (BIO) Reproduction (REP) Growth (GRO)Behavior (BEH) Pathology (PTH) Mortality (MOR)
2) 1
16-R
4) 1
29-R
1) 1
71-C
w
7) 1
11-R
11) 1
05-R 12
) 149
-Pg
13) 1
13-M
14) 1
29-R
15) 1
26-R
16) 1
24-R
17) 1
09-R
18) 1
13-M
19) 1
21-M
20) 1
20-M 22
) 119
-R23
) 139
-M
24) 1
87-M
25) 1
71-C
w26
) 136
-R
27)
86-P
g28
) 121
-M
29) 1
32-G
p30
) 111
-R
31) 1
16-R
32) 1
09-R
33)
149-
Pg
34) 1
39-M
35) 1
29-R
36) 1
49-P
g37
) 113
-M
38) 1
32-G
p
21) 1
23-R
3) 1
9290
-R
R = ratM = mouse
Pg = pigGp = guinea pigCw = cow
83
Guidance for Developing Eco-SSLs Attachment 4-5 3 - 2 June 2007

Guidance for Developing Eco-SSLs Attachment 4-5 June 20073 - 3
3.2 Exclusion of Data Considered Less Applicable for Deriving a TRV
Each test result extracted during the literature review process is scored for quality andapplicability for TRV derivation according to a data evaluation process as described inAttachment 4-4. In instances where more than one “experiment” (i.e., different combinations ofreceptor, dose, exposure route, exposure duration, and endpoint) are reported in a study, theindividual "experiments" are scored separately. In cases of more than one experiment, thescoring system is applied independently to each experimental result. The scoring system is based on evaluation of ten attributes of the toxicological study and assignsa score for each attribute, ranging from zero (no merit in setting a TRV) to 10 (extremelyvaluable and relevant to setting a TRV). Note that a low score does not necessarily imply thestudy itself is poor, only that the study design is not optimal for the narrow goal of deriving anoral TRV. The total score is calculated by adding the results of the evaluation of each attribute. Data not used for TRV derivation are defined as study endpoints receiving a Total DataEvaluation Score of 65 or less. These data points are excluded from the plots. The purpose ofthe exclusion is to ensure that TRV derivation uses the most suitable data. The data evaluationprocess and rationale is provided as Attachment 4-4.
3.3 Exclusion of Repetitive Values
Within each toxicological study there may be several effect measures reported that have thesame NOAEL and/or LOAEL values. Inclusion of the NOAEL and LOAEL results for allendpoint measures may result in repetitive values. To avoid the inclusion of repetitive andduplicative data, the results for only one Effect Measure per Effect Group are recorded in theplots. As described previously there are seven possible General Effect Groups so a unique studymay yield up to seven results each that are extracted and plotted.
For example a study provides the following results:
General EffectGroup
Effect Type Effect Measure NOAEL LOAEL
BIO CHM TRIG 5 10
BIO CHM GLUC 5
BIO ENZ ACHE 5 10
There are results for three effect measures reported within the general effect group biochemical(BIO). In this instance, the most conservative result is recorded for BIO/CHM/GLUC with aLOAEL of 5 and the other effects are noted in the comment fields of the TRV database asinstruction in Attachment 4-3.

Guidance for Developing Eco-SSLs Attachment 4-5 June 20074 - 1
4.0 PROCESS FOR DERIVATION OF WILDLIFE TRVs
4.1 TRV Definition
For the purposes of establishing the Eco-SSLs, the wildlife TRVs are defined by the workgroupas:
Doses above which ecologically relevant effects (growth, reproduction or survival) mightoccur to wildlife species following chronic dietary exposure and below which it isreasonably expected that such effects will not occur.
4.2 Goals and Assumptions
The following underlying goals and assumptions guided the development of the TRV derivationprocess.
Use Chronic Exposure Data
The Wildlife TRV should be based on chronic effects data and not acute or subacute toxicityinformation (exposures of 3 days or less in duration). The purpose for exclusion of acutetoxicity data was to focus efforts on establishing a dose protective of most species from adverseeffects associated with long term exposures and sublethal reproductive and growth effects. Achronic exposure duration is that of sufficient length to reveal most adverse effects that willoccur, or would be expected to occur, over the lifetime of an exposed organism (NAS, 1980;USEPA, 1985).
Consider All Toxicological Information.
The TRV should be based on the examination of all toxicological data extracted. These data areplotted and examined in a weight-of-evidence fashion as described in Section 4.4. The TRVsshould not be based on the selection of a single “critical” study.
Consider Only Results for Dietary or Other Oral Exposures.
The wildlife TRVs should consider only oral dose response data. These data are considered themost relevant to establishing soil screening levels that are protective of potential oral exposures(ingestion of soil or food). Toxicological data for non-oral exposure routes are excluded fromthe literature search and literature evaluation processes as described in Attachments 4-2 and 4-3.
4.3 Methods Considered for TRV Derivation
The task group responsible for derivation of wildlife TRVs considered many differentapproaches for establishing these values. Some, but not all, of the methods considered arediscussed here to provide context for the method developed for TRV derivation.

Guidance for Developing Eco-SSLs Attachment 4-5 June 20074 - 2
Critical Study Approach
One method considered was the selection of a critical study result for each contaminant formammals and birds. The study result would then be used as the TRV or a series of extrapolationand/or uncertainty factors would be applied to the critical study result to achieve the TRV. Factors are typically applied for “normalization” of the data such as approximating the chronicresult from either acute or subchronic exposure data or approximating the NOAEL from theLOAEL. Other factors can be applied to the critical study result to account for “uncertainty” andensure the protectiveness of the value and this would include factors for interspecies sensitivity. The critical study approach is currently used by EPA for human health risk assessments withtoxicity values made available in the Integrated Risk Information System (IRIS). The criticalstudy approach was also used in the derivation of wildlife criteria for the Great Lakes WaterQuality Initiative (GLI) (USEPA, 1995); by Sample et al. (1996) for the derivation of wildlifescreening benchmarks for the Oak Ridge National Laboratory Reservation; and by the CanadianCouncil of Ministers of the Environment (CCME) for soil quality guidelines for livestock andwildlife (CCME, 1997).
The Eco-SSL task group chose to use a broader “weight-of-evidence approach”(furtherdescribed in Sections 4.4 and 4.5) that considered all of the extracted toxicological data in placeof the selection of one critical study. The use of the critical study approach would requireconsiderable professional judgement thereby decreasing the transparency and reproducibility ofthe wildlife TRV derivation process. To avoid foreseen conflicts over selection of “one” result;to prevent the need for “committee” selection and to attain transparency and reproducibility thismethod was not selected.
Benchmark Dose Approach
In recent years, the benchmark dose approach has been examined for use in human health riskassessments in place of NOAEL and LOAEL approaches (Rees and Hattis, 1994; USEPA,1995). The benchmark dose is defined by EPA as the statistical lower confidence limit for adose that produces a predetermined change in response rate of an adverse effect (calledbenchmark response) compared to background (USEPA, 1995).
Use of a benchmark dose method requires not only the selection of a critical study but also thecritical or benchmark response within that study that would be modeled. It is also necessary toselect the appropriate model or model(s) for the experimental data to derive the benchmark dose. The benchmark dose approach has not been adopted for use by the ecological risk communityand a margin of safety or the acceptable “predetermined change in response rate”has not beenidentified by the regulatory community. With these limitations as well as those discussed for thecritical study approach, the benchmark dose approach was not selected for derivation of thewildlife TRVs for Eco-SSLs.

Guidance for Developing Eco-SSLs Attachment 4-5 June 20074 - 3
Distribution Approaches
Using distributions to represent the species sensitivities to contaminants is commonly used. Theapproach assumes that “...sensitivity of species is a stochastic variable that can be characterizedby fitting a probability density function to test endpoints (e.g., LD50's LC50's for several species(Suter, 1993). This approach is used to establish soil standards in the Netherlands (Van Straalenand Denneman, 1989). Uncertainty is incorporated in the determination of confidence limits forthresholds protective of a fixed percentage of species (Van Straalen and Denneman, 1989;Aldenberg and Slob, 1993). As the sample size of the number of species tested increases, theprotection threshold also increases.
Forbes and Forbes (1993) provides a review of the limitations of the distribution-basedextrapolation models. The authors question the underlying assumptions of these modelsincluding: 1)”the distribution of species sensitivities in natural ecosystems closely approximatesthe threshold distribution”; 2) “the sensitivity of species used in laboratory tests provide anunbiased measure of the variance and mean of the sensitivity distribution of species in naturalcommunities”; 3) “by protecting species composition, community function is also protected”;and 4) “interactions among species in communities and ecosystems can be ignored”.
Within the Ecological Committee on Federal Insecticide, Fungicide, and Rodenticide Act(FIFRA) Risk Assessment Methods (ECOFRAM) guidelines a distribution based approach isused to predict the 5th percentile of the species sensitivity distribution based on the oral LD50 orLC50. With birds the minimum number of species required to use the distributional approachfor species sensitivity is established by Luttik and Aldenberg (1995) at four. When N is equal to4 or more species the parameters of the distribution are determined by the use of extrapolationfactors from Aldenberg and Slob (1993). In cases, where n is less than four, then the 5th
percentile is predicted based on pre-determined extrapolation constants that compensate forsmall sample size (ECOFRAM, 1999).
The distributional methods recommended for use in ECOFRAM are not however recommendedfor use with the avian reproduction study (a 14 day exposure) as the toxic mechanisms aredifferent from the ones involved with acute toxicity. In a review of reproduction studies donewith the Mallard and Bobwhite Quail by Mineau, Boersma and Collins (1994) the developmentaleffects differed significantly between the two species and there was greater similarity betweenthe rat and bird results than between that of the two bird species. This suggests a limited abilityto extend the results of the avian reproductive test or any other chronic test that identifies no-effect and low-effect values to other bird species.
The use of distributional approaches is also limited by the non-comparability of the resultsreported for chronic exposures in the literature. The literature available reporting chronictoxicity of contaminants to laboratory test animals and wildlife reflects a wide range ofendpoints, exposure durations, test species, exposure routes, test conditions and all (most) usingdifferent non standardized testing protocols. The chronic testing results are consequently non-comparable and inappropriate for plotting as a distribution. The distributional approach

Guidance for Developing Eco-SSLs Attachment 4-5 June 20074 - 4
advocated for use within ECOFRAM and others is dependant upon the availability ofcomparable results (LD50 values) from a standard toxicity testing protocol with the same toxicityendpoint, exposure duration, test species, exposure route and test conditions.
As a result of the earlier stated deficiencies and concerns with distributional approaches, andprimarily the lack of an adequate toxicological database, the distributional approach was notselected for use.
Weight-of-Evidence Approach
In a weight-of-evidence approach the TRV is selected based on the preponderance of the data. With this approach, all toxicological data (NOAELs and LOAELs) extracted (Attachment 4-3)from the studies identified in the literature review (Attachment 4-1) and determined to beappropriate in establishing a TRV (as described in Attachment 4-4) would be plotted and therelative magnitude of the results examined to identify a threshold that would be protective. Examination of the dose-response data replaces the use of extrapolation factors as recommendedby Chapman et al. (1998). The use of this method avoids the problems previously discussedwith regard to the critical study approach.
4.4 Derivation Method Selected
The specific method selected for use in the derivation of TRVs is a “weight-of-evidence”approach that includes the use of some factors (adjustments) to account for uncertainties. AllNOAEL and LOAEL values extracted (Attachment 4-3) from studies identified in the literaturereview (Attachment 4-2) and scored according to the data evaluation scoring procedure(Attachment 4-4) are plotted as described in Section 3.0. The resulting relative magnitude of theNOAEL and LOAEL values by effect type (biochemical, behavioral, physiological, pathology,growth, reproduction and mortality) are examined in a relative manner to identify or calculate athreshold value as the TRV according to the specific procedure described in Section 4.5. In mostcases the TRV is equal to the geometric mean of NOAELs for GRO and REP effects. The use ofNOAEL and LOAEL values as the basis of the wildlife TRV derivation process is deemed areasonable and effective approach when these values are presented across multiple studies,species, and endpoints as depicted in the toxicological plots (Figure 3.1).
The LOAEL is defined as the lowest concentration (or dose) at which statistically significantadverse effects are observed in the test organism compared to controls. The NOAEL is definedas the highest experimental dose that is not associated with significant adverse effects in the testorganism compared to controls.
The process developed for derivation of the wildlife TRVs is designed specifically to addresssome of the stated limitations and concerns in using NOAEL and LOAEL results for establishingthreshold dose-response values. These limitations and concerns are previously discussed inseveral publications (Chapman et al., 1998; USEPA, 1995; Hoekstra and Van Ewijk, 1993;Chapman et al., 1996; Dhaliwal et al., 1997; and Chapman and Chapman, 1997). Some of the
Guidance for Developing Eco-SSLs Attachment 4-5 June 20074 - 5
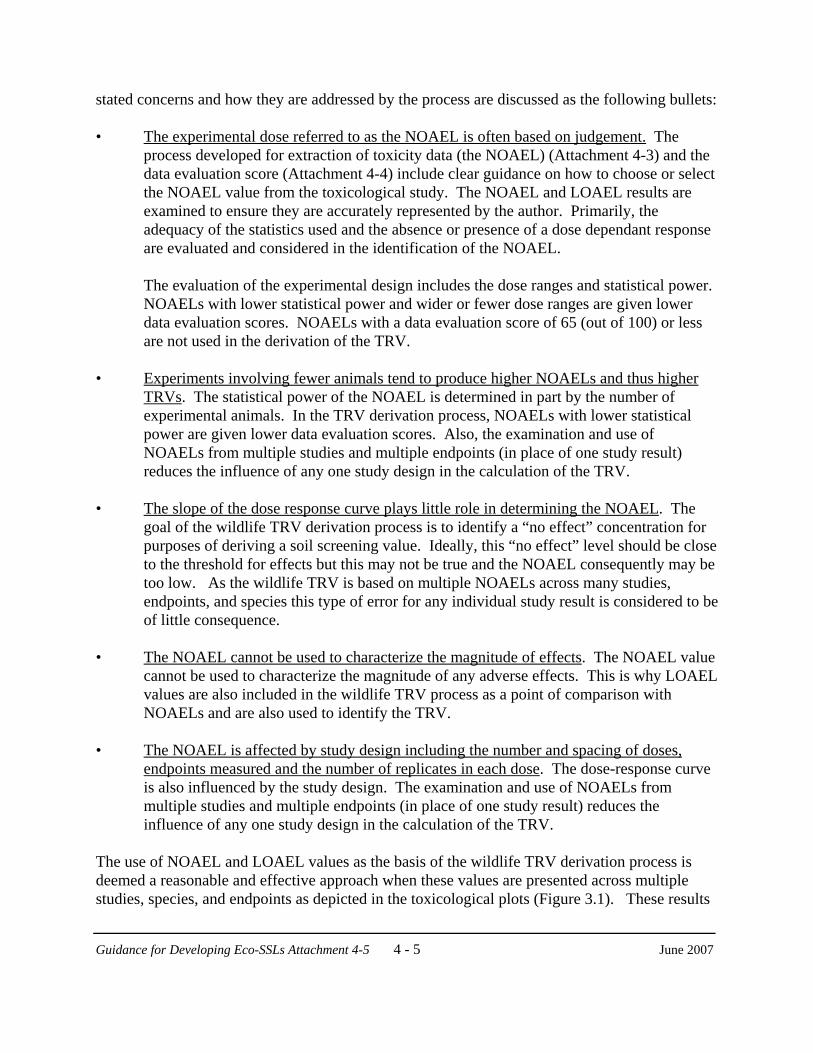
stated concerns and how they are addressed by the process are discussed as the following bullets:
• The experimental dose referred to as the NOAEL is often based on judgement. Theprocess developed for extraction of toxicity data (the NOAEL) (Attachment 4-3) and thedata evaluation score (Attachment 4-4) include clear guidance on how to choose or selectthe NOAEL value from the toxicological study. The NOAEL and LOAEL results areexamined to ensure they are accurately represented by the author. Primarily, theadequacy of the statistics used and the absence or presence of a dose dependant responseare evaluated and considered in the identification of the NOAEL.
The evaluation of the experimental design includes the dose ranges and statistical power. NOAELs with lower statistical power and wider or fewer dose ranges are given lowerdata evaluation scores. NOAELs with a data evaluation score of 65 (out of 100) or lessare not used in the derivation of the TRV.
• Experiments involving fewer animals tend to produce higher NOAELs and thus higherTRVs. The statistical power of the NOAEL is determined in part by the number ofexperimental animals. In the TRV derivation process, NOAELs with lower statisticalpower are given lower data evaluation scores. Also, the examination and use ofNOAELs from multiple studies and multiple endpoints (in place of one study result)reduces the influence of any one study design in the calculation of the TRV.
• The slope of the dose response curve plays little role in determining the NOAEL. Thegoal of the wildlife TRV derivation process is to identify a “no effect” concentration forpurposes of deriving a soil screening value. Ideally, this “no effect” level should be closeto the threshold for effects but this may not be true and the NOAEL consequently may betoo low. As the wildlife TRV is based on multiple NOAELs across many studies, endpoints, and species this type of error for any individual study result is considered to beof little consequence.
• The NOAEL cannot be used to characterize the magnitude of effects. The NOAEL valuecannot be used to characterize the magnitude of any adverse effects. This is why LOAELvalues are also included in the wildlife TRV process as a point of comparison withNOAELs and are also used to identify the TRV.
• The NOAEL is affected by study design including the number and spacing of doses,endpoints measured and the number of replicates in each dose. The dose-response curveis also influenced by the study design. The examination and use of NOAELs frommultiple studies and multiple endpoints (in place of one study result) reduces theinfluence of any one study design in the calculation of the TRV.
The use of NOAEL and LOAEL values as the basis of the wildlife TRV derivation process isdeemed a reasonable and effective approach when these values are presented across multiplestudies, species, and endpoints as depicted in the toxicological plots (Figure 3.1). These results
Guidance for Developing Eco-SSLs Attachment 4-5 June 20074 - 6
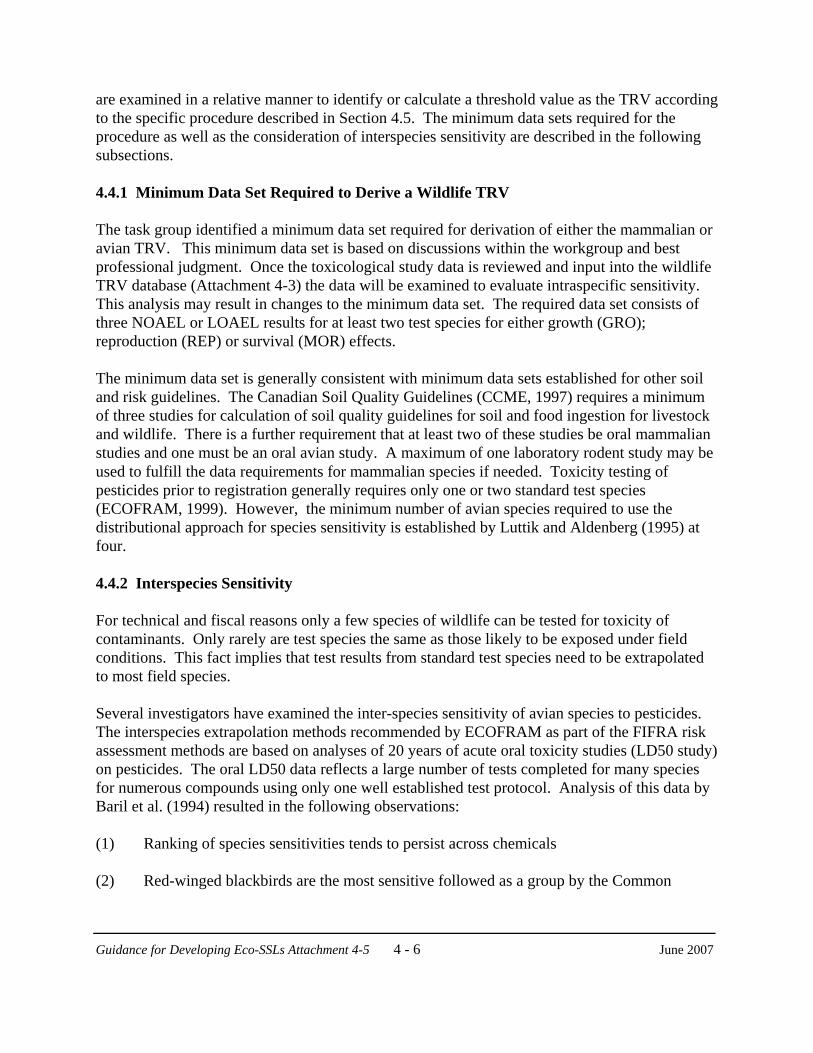
are examined in a relative manner to identify or calculate a threshold value as the TRV accordingto the specific procedure described in Section 4.5. The minimum data sets required for theprocedure as well as the consideration of interspecies sensitivity are described in the followingsubsections.
4.4.1 Minimum Data Set Required to Derive a Wildlife TRV
The task group identified a minimum data set required for derivation of either the mammalian oravian TRV. This minimum data set is based on discussions within the workgroup and bestprofessional judgment. Once the toxicological study data is reviewed and input into the wildlifeTRV database (Attachment 4-3) the data will be examined to evaluate intraspecific sensitivity. This analysis may result in changes to the minimum data set. The required data set consists ofthree NOAEL or LOAEL results for at least two test species for either growth (GRO);reproduction (REP) or survival (MOR) effects.
The minimum data set is generally consistent with minimum data sets established for other soiland risk guidelines. The Canadian Soil Quality Guidelines (CCME, 1997) requires a minimumof three studies for calculation of soil quality guidelines for soil and food ingestion for livestockand wildlife. There is a further requirement that at least two of these studies be oral mammalianstudies and one must be an oral avian study. A maximum of one laboratory rodent study may beused to fulfill the data requirements for mammalian species if needed. Toxicity testing ofpesticides prior to registration generally requires only one or two standard test species(ECOFRAM, 1999). However, the minimum number of avian species required to use thedistributional approach for species sensitivity is established by Luttik and Aldenberg (1995) atfour.
4.4.2 Interspecies Sensitivity
For technical and fiscal reasons only a few species of wildlife can be tested for toxicity ofcontaminants. Only rarely are test species the same as those likely to be exposed under fieldconditions. This fact implies that test results from standard test species need to be extrapolatedto most field species.
Several investigators have examined the inter-species sensitivity of avian species to pesticides. The interspecies extrapolation methods recommended by ECOFRAM as part of the FIFRA riskassessment methods are based on analyses of 20 years of acute oral toxicity studies (LD50 study)on pesticides. The oral LD50 data reflects a large number of tests completed for many speciesfor numerous compounds using only one well established test protocol. Analysis of this data byBaril et al. (1994) resulted in the following observations:
(1) Ranking of species sensitivities tends to persist across chemicals
(2) Red-winged blackbirds are the most sensitive followed as a group by the Common

Guidance for Developing Eco-SSLs Attachment 4-5 June 20074 - 7
Grackle, the House Sparrow, the Mallard and the Rock Dove. A second group includingthe Pheasant, Japanese Quail and the Starling are the least sensitive.
Other authors (Joermann, 1991; Schafer and Brunton, 1979; and Tucker and Haegele, 1971)have also evaluated phylogenetic patterns in sensitivity of avian species to pesticides. Thesestudies have demonstrated some patterns of sensitivity between some families of birds acrosspesticides. However, each species shows a wide range of sensitivity among the same pesticides. ECOFRAM concludes that there are probably enough exceptions to prevent the development ofa predictive approach based on phylogenetic relationships. They did conclude that twogroupings of species (based on taxonomic relationships) could be separated according tosensitivity (acute) to cholinesterase-inhibiting chemicals (ECOFRAM, 1999).
As more data becomes available in the Wildlife TRV database, interspecies sensitivity will befurther examined by comparison of bounded LOAEL values between species by contaminant. This approach is similar to that used to examine the use of uncertainty factors for wildlife criteriain the GLWQI. If the current minimum data set is deemed underprotective then the minimumdata set and the use of additional uncertainty factors will be re-evaluated.
4.5 Specific Procedure for Derivation
The general steps and conditional statements of the derivation process are outlined in Figure 4.1.These steps are an a priori framework for selection or calculation of the TRV value based on theresults of the NOAEL and LOAEL data plots. The flow chart is used with the toxicological dataplots to derive the TRV according to the following described steps.
Step 1: Are there at least 3 results and 2 species tested for reproduction (REP),growth (GRO) or mortality (MOR) general effect groups?
The minimum data set required to derive either a mammalian or avian TRV consists of threeresults (NOAEL or LOAEL values) for REP, GRO or MOR for at least two mammalian or avianspecies. If these minimum results are not available then a TRV is not derived.
Step 2: Are there 3 or More NOAELs in REP or GRO Effect Groups?
Calculation of the geometric mean NOAEL for REP and GRO requires at least three NOAELresults from either of the REP or GRO effect groups. If three or more NOAEL results areavailable then the user proceeds to Step 4. If there are less than three NOAEL results, then theuser proceeds to Step 3.
Step 3: Is there at least one NOAEL for REP or GRO?
If there is at least one NOAEL result available for the REP or GRO effect groups, then the TRVis equal to the lowest reported NOAEL for either effect group (GRO or REP). In cases wherethis NOAEL is higher than the lowest LOAEL for the MOR effect group then the TRV is equal

Guidance for Developing Eco-SSLs Attachment 4-5 June 20074 - 8
to the highest NOAEL below the lowest LOAEL for the MOR effect group or the lowest
LOAEL which ever is lower.
NO
NO
YES
YES
NO
YES
YES
NO
YESNO
YESNO
YESNO
Step 2:Are there 3 or more NOAELs in REP or
GRO?
Step 4:
Calculate the geometric mean of NOAELs for REP and GRO
Step 3:At Least one NOAEL
for REP or GRO?
Step 5:
At least 3 LOAELs for
GRO or REP?TRV = lowest LOAEL / 10
YES
Step 6:
At least 6 NOAELs or LOAELs for all
endpoints?
TRV = Highest bounded NOAEL below lowest bounded LOAEL for
all endpoints or lowest value (NOAEL or LOAEL) if paired
values not available
No TRV can be derived
Is NOAEL < lowest bounded
LOAEL for REP, GRO or MOR?
TRV = Lowest NOAEL for GRO, REP
or MOR
TRV = Highest bounded NOAEL below lowest bounded LOAEL for REP, GRO or MOR
Is geometric mean NOAEL < lowest
bounded LOAEL for REP, GRO or MOR?
TRV = geometric mean of NOAELs for REP
and GRO
Is Mechanism of Toxicity Addressed?
NO
TRV = Highest bounded NOAEL below lowest bounded LOAEL for
appropriate effect group
Step 1:
Are there at least 3 toxicity values for 2
species for REP, GRO or MOR?
Figure 4.1. TRV Derivation Procedure

Guidance for Developing Eco-SSLs Attachment 4-5 June 20074 - 9
Step 4: Calculate a geometric mean of NOAELs for GRO and REP Effect groups.
The TRV is equal to the geometric mean of the NOAEL values in the REP and GRO EffectGroups with the following exceptions.
Is the Geometric Mean NOAEL greater than the highest bounded NOAEL below theLowest bounded LOAEL for REP, GRO or MOR?
In some cases the geometric mean NOAEL (REP and GRO) may be higher than the highestbound NOAEL (paired NOAEL and LOAEL values) below the lowest bound LOAEL value forresults within the REP, GRO or MOR effect groups. In other words, the geometric meanNOAEL value may not be sufficiently protective of all tested species and represent the thresholdof REP, GRO, and MOR effects. In these instances, the TRV is equal to the highest boundNOAEL below the lowest bound LOAEL value for results within the GRO, REP and MOReffect groups.
Is the mechanism or mode-of action of toxicity addressed by the Effect Measures in theGRO, REP and MOR Effect Groups?
If the mechanism, or mode-of-action of toxicity, is not addressed by the Effect Measures in theGRO, REP and MOR Effect Groups then the TRV is equal to the highest bound NOAEL belowthe lowest bound LOAEL for the appropriate effect group. This possible pathway for TRVderivation is included to allow the toxicologist to set a TRV based on the data most appropriatefor the particular contaminant.
Step 5: Are there at least 3 LOAELs for GRO or REP?
If there are at least 3 LOAELs for GRO or REP then the TRV is equal to the lowest LOAELdivided by an uncertainty factor. If there are less than 3 LOAELs then the user goes to Step 6.
The uncertainty factor is intended to extrapolate from the LOAEL (lowest observed effect) to aNOAEL (no observed effect) value. In order to derive an UF to approximate the NOAEL fromthe LOAEL, the LOAEL to NOAEL ratios (bounded) in the Wildlife TRV database wereexamined (Figure 4.2). To date there are 456 paired LOAEL/NOAEL values in the database foravian species and 745 for mammalian species. With this data the ratios of bounded LOAELsNOAELs are described in Figure 4.2.
Approximately 84.3% of the LOAEL values for mammals and 88.6% for birds are within afactor of 5 of the respective paired NOAEL value (Figure 4.2). Approximately 96% and 95% ofthe values are within a factor of 10 for mammals and birds, respectively. As the purpose of theTRV is for calculation of (conservative) soil screening values, a value of 10 was chosen as theUF as 97% of the cases within the wildlife TRV database, the NOAEL is within a factor of 10 ofthe LOAEL. This quantitative result is not surprising. Dosing studies are commonly designedwith order of magnitude increased in dose (e.g., 1, 10, 100, 1000).

LOAEL to NOAEL Ratios in Wildlife TRV DatabaseFigure 4.2
Mammalian Data
0
50
100
150
200
250
300
350
400
2 4 6 8 10 20 30 40 50 60 > 60LOAEL:NOAEL Ratio
Freq
uenc
y
(43.2%)
(71.8%)
(84.3%)
(85.4%)
(95.6%)
(97.0%) (98.3%) (98.7%) (99.1%) (100%)
Summary Statistics:N = 745Mean = 6.7Maximum = 500Cumulative Frequency presented above each bar (%).
Avian Data
0
50
100
150
200
250
300
2 4 6 8 10 20 30 40 50 60 > 60LOAEL:NOAEL Ratio
Freq
uenc
y
(52.0%)
(81.4%)
(88.6%)
(88.8%)(95.4%)
(98.0%) (99.3%) (99.8%) (100%)
Summary Statistics:N = 456Mean = 3.6Maximum = 53Cumulative Frequency presented above each bar (%).
Guidance for Developing Eco-SSLs Attachment 4-5 4 - 10 June 2007

Guidance for Developing Eco-SSLs Attachment 4-5 June 20074 - 11
Therefore, threshold approaches will consequently most likely end up with a factor of 10between NOAEL and LOAEL values.
Chapman et al (1998) and e,p&t (1996) criticize the use of the LOAEL in approximating aNOAEL dose. They argue that LOAEL determination is a function of the spacing of dietaryconcentrations and statistical power of the test and that LOAELs are often incorrectly low due tostatistical artifacts and that these uncertainties are compounded when the LOAEL is divided byan uncertainty factor. While it is true that NOAEL and LOAEL determination is function ofstudy design, it is hoped that the NOAEL and LOAEL brackets the threshold. As manyLOAELs may be incorrectly low it is assumed that the use of an UF equal to10 will successfullybracket the lower range of the possible threshold (NOAEL). This UF value will be updated asmore toxicological data becomes available within the TRV wildlife database.
For the contaminants for which TRVs have been derived to date, there has not been an instancewhere this step was used to derive a TRV. All contaminants examined to date have either hadsufficient data to derive a TRV based on NOAEL values or data is not available at all (e.g.,antimony, barium and beryllium for birds).
Step 6: Are there at least 6 LOAEL values available for other endpoints?
In cases where there are less than three LOAEL values available for all GRO or REP Effectgroups, the TRV can be derived based on the available LOAEL values for other Effect Groups(BEH, PTH, BIO, PHY, MOR). As this type of dose-response data is considered to be lessuseful for establishing a TRV twice the number of data points are required as a minimum toderive a TRV (compared to data for GRO, REP and MOR). The highest NOAEL below thelowest bounded LOAEL for all effect Groups are identified and the lowest of these is identifiedas the TRV. If bounded values are not available, then the TRV equals the lowest NOAEL orLOAEL for all endpoints. If less than six total NOAEL or LOAEL values are available then aTRV cannot be derived.

Result number Test Species Key1) 10 - C Lowest-Observed Adverse Effect Dose
Reference Number Test Species Paired values from same study when joined by line
No-Observed Adverse Effect DoseWildlife TRV Derivation Process
1) There are at least three results available for two test species within the growth, reproduction and mortality (survival) effect groups. There is enough data to derive TRV.
2) There are are at least three NOAEL results available for calculation of a geometric mean.
3) The geometric mean of the NOAEL values for growth and reproduction equals 7.3 mg Co/kg BW/day.
4) The geometric mean NOAEL value is less than the lowest bounded LOAEL for reproduction, growth or survival.
5) The mammalian wildlife TRV for cobalt is equal to 7.3 mg Co/kg BW/day.
Figure 4.3 Example of TRV Derivation
70
75
75
69
65
66
69
77
77 78 77
73
75
87
81
72
83
87 7873
7773
7873
77
68
74
72 72
82
77
79
72
78
80
73
78
67
83
82
76
77 73
0
1
10
100
1000
Dos
e (m
g C
o/kg
BW
/day
)
BIO-NOAEL BIO-LOAEL BEH-NOAEL BEH-LOAEL PHY-NOAEL PHY-LOAEL PTH-NOAELPTH-LOAEL REP-NOAEL REP-LOAEL GRO-NOAEL GRO-LOAEL MOR-NOAEL MOR-LOAEL
10) 1
16-R8) 1
05-R
6) 8
6-Pg
5) 1
36-R
9) 1
36-R
Biochemical (BIO) Reproduction (REP) Growth (GRO)Behavior (BEH) Pathology (PTH) Mortality (MOR)
2) 1
16-R
4) 1
29-R
1) 1
71-C
w
7) 1
11-R
11) 1
05-R 12
) 149
-Pg
13) 1
13-M
14) 1
29-R
15) 1
26-R
16) 1
24-R
17) 1
09-R
18) 1
13-M
19) 1
21-M
20) 1
20-M 22
) 119
-R23
) 139
-M
24) 1
87-M
25) 1
71-C
w26
) 136
-R
27)
86-P
g28
) 121
-M
29) 1
32-G
p30
) 111
-R
31) 1
16-R
32) 1
09-R
33)
149-
Pg
34) 1
39-M
35) 1
29-R
36) 1
49-P
g37
) 113
-M
38) 1
32-G
p
21) 1
23-R
3) 1
9290
-R
Geometric Mean of NOAELs for REP and
GRO = 7.3
R = ratM = mouse
Pg = pigGp = guinea pigCw = cow
83
Guidance for Developing Eco-SSLs Attachment 4-5 4 - 12 June 2007

Result number Test Species Key Lowest-Observed Adverse Effect Dose1) 10 - C
Paired values from same study when joined by lineReference Number Test Species
No-Observed Adverse Effect Dose
Wildlife TRV Derivation Process Data Evaluation Score
1) There are at least three results available for two test species within the growth, reproduction and mortality effect groups There is enough data to derive a TRV
2) There are not three NOAEL results available for calculation of a geometric mean
4) There is one NOAEL value for reproduction or growth effects
5) There are no bounded LOAELs for comparison. The TRV is equal to the lowest NOAEL for effects on growth, reproduction or surviv
6) The mammalian wildlife TRV for beryllium is equal to 0.48 mg Be/kg bw/day which is the lowest NOAEL for effects on growth, reproduction and surviv
M = MouseR = Rat
Figure 4.4 Example of TRV Derivation
74 77
71
7272
73
73
0.100
1.000
10.000
Dos
e (m
g Be
/kg
bw/d
ay)
BIO-NOAEL BIO-LOAEL PTH-NOAEL PTH-LOAEL GRO-NOAEL GRO-LOAEL MOR-NOAEL MOR-LOAEL
1) 1
7115
-R
3) 1
7086
-R
5) 1
7086
-R
6) 1
858-
M
4) 1
858-
M
Biochemical (BIO) Pathology (PTH) Growth (GRO) Mortality (MOR)
2) 1
7115
-R
3) 2
640-
R
83
Guidance for Developing Eco-SSLs Attachment 4-5 4 - 13 June 2007

Result number Test Species Key Lowest-Observed Adverse Effect Dose1) 10 - C
Paired values from same study when joined by lineReference Number Test Species
No-Observed Adverse Effect Dose
Wildlife TRV Derivation Process Data Evaluation Score
1) There are at least three results available for two test species within the growth, reproduction and mortality effect groups. There is enough data to derive a TRV.
2) There are are at least three NOAEL results available for calculation of a geometric mean.
3) The geometric mean of the NOAEL values for growth and reproductive effects equals 13 mg Sb/kg BW/day.
4) The geometric mean NOAEL value is higher than the lowest bounded LOAEL for reproduction, growth, or mortality effects
5) The mammalian wildlife TRV for antimony is equal to 0.059 mg Sb/kg BW/day which is the highest bounded NOAEL below the lowest bounded LOAEL for reproduction, growth or mortality effects.
Vo = Short-tailed field voleM = MouseR = Rat
Figure 4.5 Example of TRV Derivation
68
82
68
69
82
73 79
73
79
73
68
85
85
8570
85
70
69 78
79
78 6767
82
7884
85
82
84
72
66
7470 78
84
91 7373
86
74
84
91
68
0.010
0.100
1.000
10.000
100.000
1000.000
10000.000
Dos
e (m
g Sb
/kg
bw/d
ay)
BIO-NOAEL BIO-LOAEL BEH_NOAEL BEH_LOAEL PHY-NOAEL PHY-LOAEL PTH-NOAEL PTH-LOAEL REP-NOAEL REP-LOAEL GRO-NOAEL GRO-LOAEL MOR-NOAEL MOR-LOAEL
1) 2
24-R
2) 1
5506
-R
5) 3
780-
R
4) 2
24-R
6) 3
780-
M
7) 2
31-R
8) 1
89-R
9) 9
32-R
10)
270-
M
13)
225-
R
12)
231-
R
14)
252-
R
15)
3701
-M
16)
224-
R
19) 1
89-R
17)
3780
-R
18) 3
780-
M
20) 2
31-R
22)
224-
R
23)
221-
Vo
25)
3780
-M
24)
3780
-R
26)
225-
M
28)
270-
M
29)
189-
R
Geometric Mean of NOAELs for Reproduction
and Growth = 13
27)
270-
Vo
3) 1
89-R
11)
224-
R
21) 2
38-M
30)
221-
Vo
31)
252-
R
Biochemical (BIO) Behavior (BEH) Physiology (PHY) Pathology (PTH) Reproduction (REP) Growth (GRO) Mortality (MOR)
83
Guidance for Developing Eco-SSLs Attachment 4-5 4 - 14 June 2007

Guidance for Developing Eco-SSLs Attachment 4-5 June 20075 - 1
5.0 REFERENCES
Aldenberg, T. and W. Slob. 1993. Confidence limits for hazardous concentrations based onlogistically distributed NOEC toxicity data. Ecotoxicol. Environ. Safety. 25: 48-63.
Canadian Council of Ministers of the Environment (CCME). 1997. Recommended CanadianSoil Quality Guidelines. March 1997.
Chapman, P.M., A. Fairbrother, and D. Brown. 1998. A Critical Evaluation of Safety(Uncertainty) Factors for Ecological Risk Assessment. Environ. Tox. And Chem. 17(1):99-108.
Chapman, P.F. and P.M. Chapman. 1997. Letter to the Editor: Warning: Replacing NOECswith Point Estimates May Not Solve Regulatory Contradictions. Environ. Tox. andChem. 16(2): 124-126.
Chapman, P.M., R.S. Caldwell, and P.F. Chapman. 1996. Letter to the Editor: A Warning:NOECs are Inappropriate for Regulatory Use. Environ. Tox. and Chem. 15(2): 77-79.
Dhaliwal, B.S., R.J. Dolan, C.W. Batts, and J.M. Kelly. 1997. Letter to the Editor: Warning:Replacing NOECs with Point Estimates May Not Solve Regulatory Contradictions. Environ. Tox. and Chem. 16(2): 124-126.
Dourson, M.L. and J.F. Stara. 1983. Regulatory History and Experimental Support ofUncertainty (Safety) Factors. Regulatory Toxicology and Pharmacology. 3: 224-238.
Ecological Committee on FIFRA Risk Assessment Methods (ECOFRAM). 1999. ECOFRAMTerrestrial Draft Report. May 10, 1999.
e,p&t. 1996. Toxicity Extrapoloations in Terrestrial Systems. Prepared for the Office ofEnvironmental Health, Hazard Assessment, Reproductive and Cancer HazardAssessment Section, California Environmental Protection Agency. July 5, 1996.
Forbes, T.L. and V.E. Forbes. 1993. A Critique of the Use of Distribution-Based ExtrapolationModels in Ecotoxicology. Functional Ecology. 7: 249-254.
Hoekstra, J.A. and P.H. Van Ewijk. 1993. Alternatives for the No-Observed-Effect Level. Environ. Toxic.ol. Chem. 12: 187-194.
Luttik, R. and T. Aldenberg. 1995. Extrapolation factors to be used in case of small samples oftoxicity data (with a special focus on LD50 values for birds and mammals.) Report No.679102029. National Institute of Public Health and Envrionmental Protection. Blithoven, the Netherlands.

Guidance for Developing Eco-SSLs Attachment 4-5 June 20075 - 2
Mineau, P., D.C. Boersma, and B. Collins. 1994. An analysis of avian reproduction studiessubmitted for pesticide registration. Ecotoxicology and Environmental Safety. 29: 304-329.
Rees, D.C., and D. Hattis. 1994. Developing quantitative strategies for animal to humanextrapolation. Pages 275-315. In Hayes, A.W. (ed). Principles and Methods ofToxicology. Third Edition. Raven Press, Ltd., New York.
Sample, B.E., D.M. Opresko, and G.W. Suter II. 1996. Toxicological Benchmarks for Wildlife: 1996 Revision. ES/ER/TM-86/R3. Prepared for the U.S. Department of Energy, Officeof Environmental Management by Lockheed Martin Energy Systems, Inc. managing theactivities at the Oak Ridge National Laboratory (ORNL).
Suter, G.W. II. 1993. (Ed). Ecological Risk Assessment. Lewis Publishers, Chelsea, MI.
U.S. Environmental Protection Agency (USEPA). 1995. The Use of the Benchmark DoseApproach in Health Risk Assessment. Office of Research and Development,Washington, D.C. EPA/630/R-94/007.
U.S. Environmental Protection Agency (USEPA). 1985. Great Lakes Water Quality InitiativeCriteria Documents for the Protection of Wildlife. DDT, Mercury, 2,3,7,8-TCDD andPCBs. EPA-820-B-95-008. Office of Water. March.
Van Straalen, N.M. and C.A. Denneman. 1989. Ecotoxicological evaluation of soil qualitycriteria. Ecotoxicol. Environ. Safety. 18: 241-251.