attracting students through price bundling. a conjoint ... · attracting students through price...
TRANSCRIPT
INFORMATICA, 2001, Vol. 12, No. 4, 519–546 519 2001Institute of Mathematics and Informatics, Vilnius
Attracting Students through Price Bundling.A Conjoint Study of Swedish Students’ Preferencesof Retail Banking Services
Merja MANKILAGothenburg School of Economics and Commercial LawBox 610, 405 30 Gothenburg, Swedene-mail: [email protected]
Received: September 2001
Abstract. The article investigates the Swedish retail banks’ application of price bundling in orderto attract new customers, students. This is done through a customer survey about students’ pref-erences concerning retail banking services, their price sensitiveness and banking behaviour. Theconjoint analysis results showed that the students had relatively heterogeneous preferences, andfour distinguishing segments could be found among them, namely a) plain banking, b) cheapestbanking, c) modern banking, and d) traditional banking. The central factor in attracting students isthe choice of services that are included in the bundle, and not the price. There were only roughly20 percent who currently had a student bundle.
Key words: marketing, banking, strategic planning, price bundling, conjoint analysis.
1. Introduction
Customer acquisition is one of the main strategic aims in price bundling, which is definedas a selling arrangement of two or more services at a special price (Guiltinan, 1987).Price bundling works through homogenising the demand that happens through the sharingof the consumer surplus between the products so that the willingness to buy the totaloffer becomes, in certain circumstances, more likely than when the products are soldindividually (Adams and Yellen, 1976; Schmalensee, 1984). The demand is additionallyfacilitated by a specific price reduction for the bundle compared with the sum of theindividual prices. The strategy, in order to attract new customers, is then most likely tosucceed if the products or services in the bundle are complementary, and if the demandis relatively price elastic (Guiltinan, 1987). The former demand condition enhances thecustomer’s evaluation of the offer and the latter demand condition increases the likelihoodof a customer to respond to the price reduction. Price bundling has then, in principle, twoways of attracting new customers: the services that are included in the bundle are of typethat perform better together than individually, and the price discount.
Students form an important customer segment for retail banks as they are an attractivegroup of customers for their future profitability (Fryet al., 1986; Lewiset al., 1991). Price
520 M. Mankila
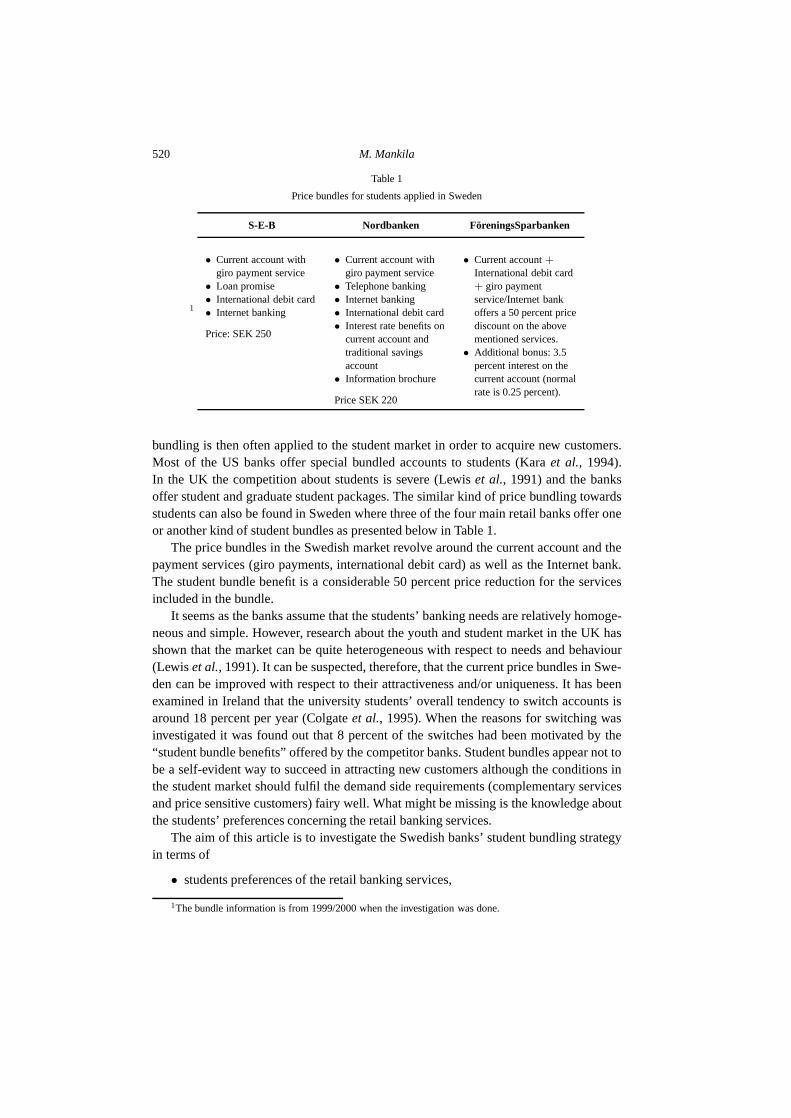
Table 1
Price bundles for students applied in Sweden
1
S-E-B Nordbanken FöreningsSparbanken
• Current account withgiro payment service
• Loan promise• International debit card• Internet banking
Price: SEK 250
• Current account withgiro payment service
• Telephone banking• Internet banking• International debit card• Interest rate benefits on
current account andtraditional savingsaccount
• Information brochure
Price SEK 220
• Current account+International debit card+ giro paymentservice/Internet bankoffers a 50 percent pricediscount on the abovementioned services.
• Additional bonus: 3.5percent interest on thecurrent account (normalrate is 0.25 percent).
bundling is then often applied to the student market in order to acquire new customers.Most of the US banks offer special bundled accounts to students (Karaet al., 1994).In the UK the competition about students is severe (Lewiset al., 1991) and the banksoffer student and graduate student packages. The similar kind of price bundling towardsstudents can also be found in Sweden where three of the four main retail banks offer oneor another kind of student bundles as presented below in Table 1.
The price bundles in the Swedish market revolve around the current account and thepayment services (giro payments, international debit card) as well as the Internet bank.The student bundle benefit is a considerable 50 percent price reduction for the servicesincluded in the bundle.
It seems as the banks assume that the students’ banking needs are relatively homoge-neous and simple. However, research about the youth and student market in the UK hasshown that the market can be quite heterogeneous with respect to needs and behaviour(Lewiset al., 1991). It can be suspected, therefore, that the current price bundles in Swe-den can be improved with respect to their attractiveness and/or uniqueness. It has beenexamined in Ireland that the university students’ overall tendency to switch accounts isaround 18 percent per year (Colgateet al., 1995). When the reasons for switching wasinvestigated it was found out that 8 percent of the switches had been motivated by the“student bundle benefits” offered by the competitor banks. Student bundles appear not tobe a self-evident way to succeed in attracting new customers although the conditions inthe student market should fulfil the demand side requirements (complementary servicesand price sensitive customers) fairy well. What might be missing is the knowledge aboutthe students’ preferences concerning the retail banking services.
The aim of this article is to investigate the Swedish banks’ student bundling strategyin terms of
• students preferences of the retail banking services,
1The bundle information is from 1999/2000 when the investigation was done.
Attracting Students Through Price Bundling 521
• students’ price sensitiveness,• students’ banking behaviour and use of price bundling,
and to make suggestions in order to improve the strategy based on the information ofthe demand side conditions. The article starts with a methodological discussion about thesurvey (Section 2). The results from the survey of students’ preferences investigated byconjoint analysis and cluster analysis are presented next (Sections 3 and 4). Subsequentlyempirical evidence about students banking behaviour is presented in Section 5. The va-lidity and reliability of the results is discussed in Section 6. Lastly follows conclusions(Section 7) and managerial implications (Section 8).
2. Conjoint Analysis
The survey method used in the essay is conjoint analysis. It is a multivariate techniqueused specifically to understand how respondents’ preferences are developed (Greenetal., 1978; Hairet al., 1995). Since 1971, it has been applied to a variety of problemsin consumer research (Greenet al., 1978; Wittinket al., 1989; Wittinket al., 1994). Theunderlying assumption in conjoint analysis is that consumers’ preferences are determinedby trade-offs they must make between different product/service features. The conjointanalysis offers an estimate of a marginal utility for each of the attribute levels, a partworth, as well as it shows the relative importance of each of the attributes. A conjointstudy can be done for the whole sample or individually for each of the respondents. Theindividual part worth’s can then be used as a basis for segmentation (Green and Krieger,1991). The current study is done as a traditional “tandem approach”, which means thatan ordinary conjoint analysis is run first, and the utilities obtained from that analysis arefurther used as an input in a cluster analysis in order to find appropriate segments2.
This way of decision making needed in the conjoint analysis is faced by consumers inreal life when they compare different product/service offerings and therefore, a realisticconsumer choice procedure is one of the advantages with the method. Furthermore, finan-cial services are proposed to be especially suitable to be studied by the conjoint analysisbecause of their multiattribute character (Teaset al., 1985; Zinkhanet al., 1991; Karaetal., 1994; Oppewal and Vriens, 2000). It has been used in previous studies to improve thecash management account features, to measure service quality and to plan appropriatecredit card strategies for the youth market.
2.1. Survey Design
A conjoint design should include all the variables that can be assumed to have an effecton customers’ total utility of the choice situation/alternative. However, the choice of the
2Several integrated conjoint segmentation methods make the estimation of the conjoint utilities and thesegmentation simultaneously, and in many cases they outperform the tandem clustering procedure (DeSarboetal., 1992). However, the research is based on a metric conjoint analysis while the date used in the current studyis categorical rank-order data.
522 M. Mankila
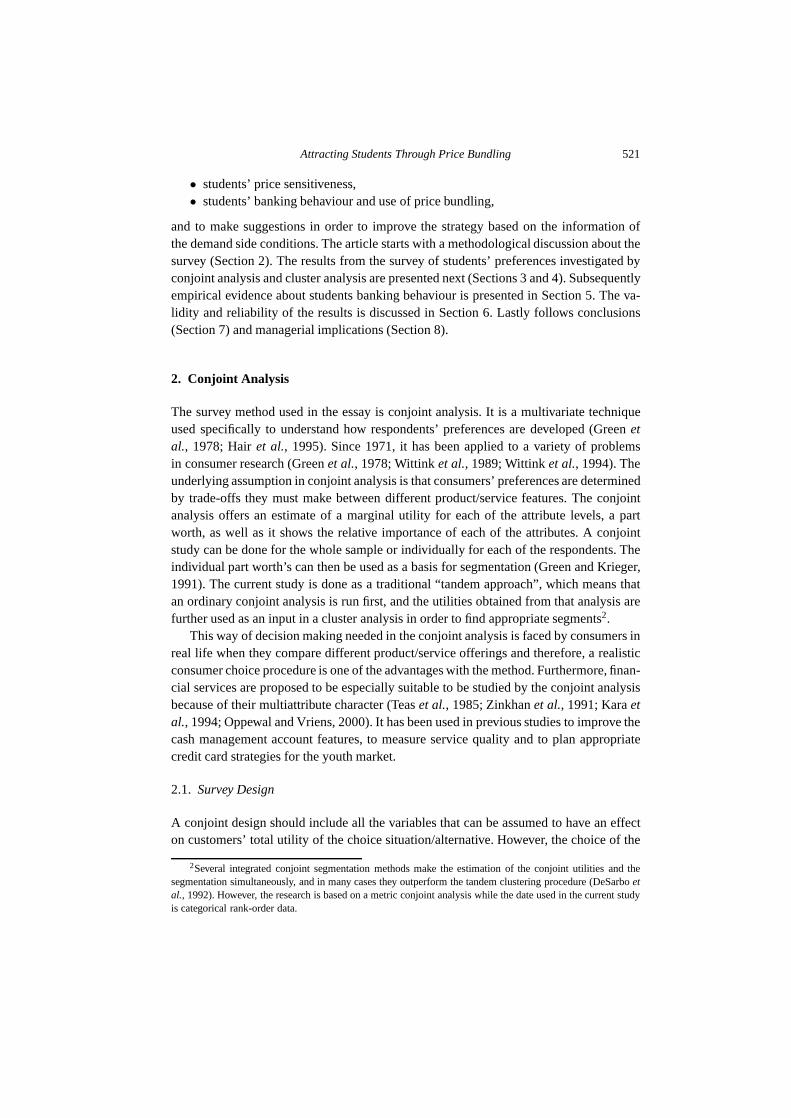
variables needs to be kept relatively low (6–10 attributes) as the risk for information over-load is considerable (Green and Snirivasan, 1978). The current study about the studentbundles was therefore, decided to contain only the main services and the price informa-tion in terms of the bundle price as well as the current account interest rate. Furthermore,the choice of the services to be incorporated in the current study was decided partly tofollow the existing price bundles, and partly the current market trends in the Swedishretail banking market, i.e., the banks’ advertisements about mutual fund/pension insur-ance investments. An interview with S-E-B and Nordbanken was conducted about theirstudent bundling. Since the banks claimed to have based their price bundling decisionson their own customer surveys, a further explorative customer survey was not done inorder to find the attributes to the study. A pre-test of the conjoint study was then done andsome slight changes in the attributes and/or their levels were made based on the students’comments. In Table 2 the attributes and the attribute levels used in the current study arepresented.
The information was chosen to be presented as full profiles. Seven variables withdiffering levels would have lead to 576 (24 ∗ 32 ∗ 4) full profile cards to be evaluated
Table 2
Attributes and attribute levels
Attributes Attribute levels
Current account (including giro payment servicesand ATM card)
0.15%2.50%
International debit card (Visa or Master) YesNo
Distribution channel Internet bankTelephone bankNone (i.e., branch office)
Savings3 Mutual funds or pension insuranceBrokerage servicesNone
Loan promise YesNo
Personal banker YesNo
Yearly fee for the bundle 200260320380
3The savings alternatives were formed as giving further price incentives apart from inclusion in the bundle.For example, students were considering to be saving SEK 200 per month against 20% price reduction for theyearly bundle price. Concerning treasury services students would not have to pay for the yearly fee for such anaccount.
Attracting Students Through Price Bundling 523
by the respondents4. However, a fractional factorial design, using SPSS, eliminated thenumber of cards from 576 to 16. This type of orthogonal creation of full profile cardsmeans that the variables are assumed to be independent from each other. An example ofone of the full profile cards used in the study is given in Appendix A.
Additionally four cards were created as a hold out sample in order to check the internalvalidity of the model. An analysis of the hold out cards shows the conjoint model’s abilityto predict the ranking/rating of the hold out profiles. Consequently, each respondent wasasked to rank 20 alternatives, which is a relatively demanding task.
2.2. Data Collection
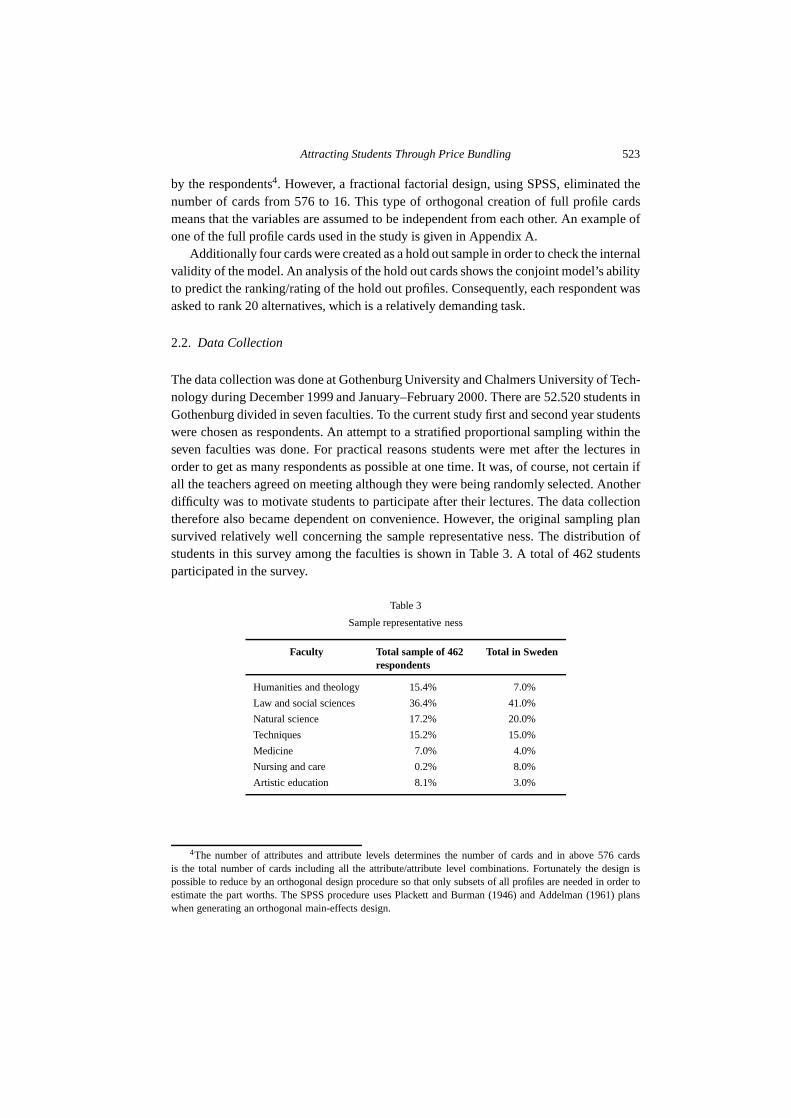
The data collection was done at Gothenburg University and Chalmers University of Tech-nology during December 1999 and January–February 2000. There are 52.520 students inGothenburg divided in seven faculties. To the current study first and second year studentswere chosen as respondents. An attempt to a stratified proportional sampling within theseven faculties was done. For practical reasons students were met after the lectures inorder to get as many respondents as possible at one time. It was, of course, not certain ifall the teachers agreed on meeting although they were being randomly selected. Anotherdifficulty was to motivate students to participate after their lectures. The data collectiontherefore also became dependent on convenience. However, the original sampling plansurvived relatively well concerning the sample representative ness. The distribution ofstudents in this survey among the faculties is shown in Table 3. A total of 462 studentsparticipated in the survey.
Table 3
Sample representative ness
Faculty Total sample of 462respondents
Total in Sweden
Humanities and theology 15.4% 7.0%
Law and social sciences 36.4% 41.0%
Natural science 17.2% 20.0%
Techniques 15.2% 15.0%
Medicine 7.0% 4.0%
Nursing and care 0.2% 8.0%
Artistic education 8.1% 3.0%
4The number of attributes and attribute levels determines the number of cards and in above 576 cardsis the total number of cards including all the attribute/attribute level combinations. Fortunately the design ispossible to reduce by an orthogonal design procedure so that only subsets of all profiles are needed in order toestimate the part worths. The SPSS procedure uses Plackett and Burman (1946) and Addelman (1961) planswhen generating an orthogonal main-effects design.
524 M. Mankila
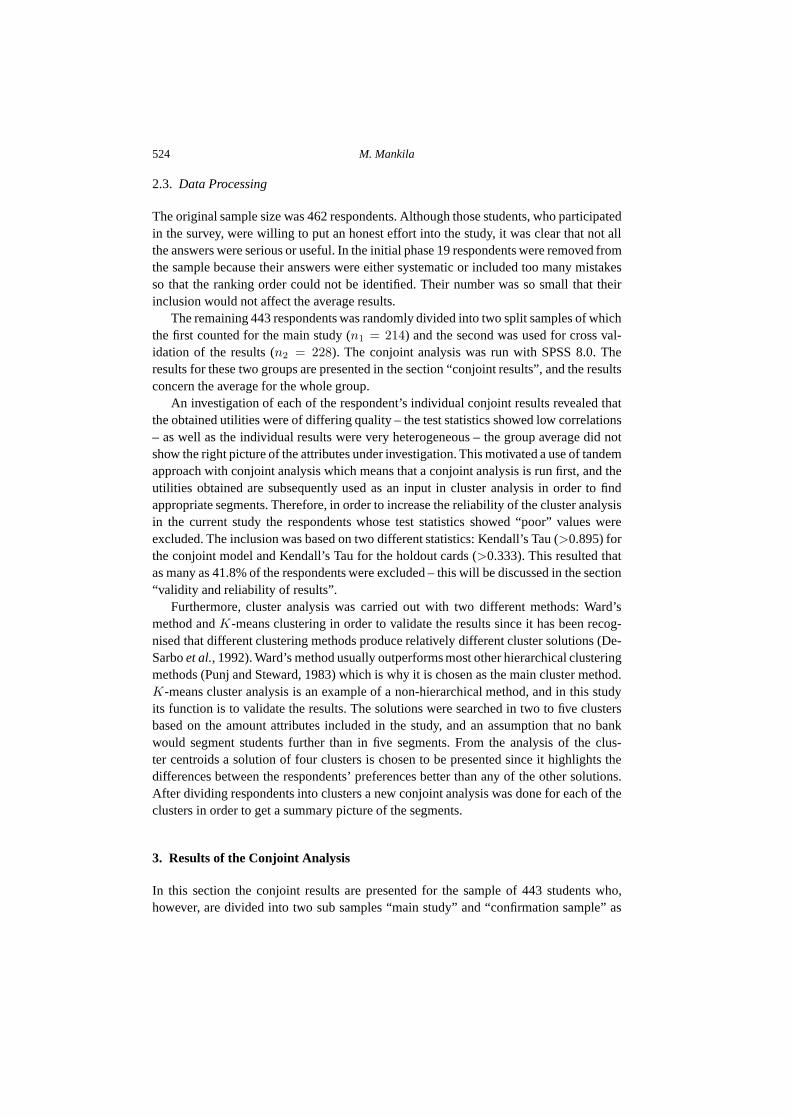
2.3. Data Processing
The original sample size was 462 respondents. Although those students, who participatedin the survey, were willing to put an honest effort into the study, it was clear that not allthe answers were serious or useful. In the initial phase 19 respondents were removed fromthe sample because their answers were either systematic or included too many mistakesso that the ranking order could not be identified. Their number was so small that theirinclusion would not affect the average results.
The remaining 443 respondents was randomly divided into two split samples of whichthe first counted for the main study (n1 = 214) and the second was used for cross val-idation of the results (n2 = 228). The conjoint analysis was run with SPSS 8.0. Theresults for these two groups are presented in the section “conjoint results”, and the resultsconcern the average for the whole group.
An investigation of each of the respondent’s individual conjoint results revealed thatthe obtained utilities were of differing quality – the test statistics showed low correlations– as well as the individual results were very heterogeneous – the group average did notshow the right picture of the attributes under investigation. This motivated a use of tandemapproach with conjoint analysis which means that a conjoint analysis is run first, and theutilities obtained are subsequently used as an input in cluster analysis in order to findappropriate segments. Therefore, in order to increase the reliability of the cluster analysisin the current study the respondents whose test statistics showed “poor” values wereexcluded. The inclusion was based on two different statistics: Kendall’s Tau (>0.895) forthe conjoint model and Kendall’s Tau for the holdout cards (>0.333). This resulted thatas many as 41.8% of the respondents were excluded – this will be discussed in the section“validity and reliability of results”.
Furthermore, cluster analysis was carried out with two different methods: Ward’smethod andK-means clustering in order to validate the results since it has been recog-nised that different clustering methods produce relatively different cluster solutions (De-Sarboet al., 1992). Ward’s method usually outperforms most other hierarchical clusteringmethods (Punj and Steward, 1983) which is why it is chosen as the main cluster method.K-means cluster analysis is an example of a non-hierarchical method, and in this studyits function is to validate the results. The solutions were searched in two to five clustersbased on the amount attributes included in the study, and an assumption that no bankwould segment students further than in five segments. From the analysis of the clus-ter centroids a solution of four clusters is chosen to be presented since it highlights thedifferences between the respondents’ preferences better than any of the other solutions.After dividing respondents into clusters a new conjoint analysis was done for each of theclusters in order to get a summary picture of the segments.
3. Results of the Conjoint Analysis
In this section the conjoint results are presented for the sample of 443 students who,however, are divided into two sub samples “main study” and “confirmation sample” as
Attracting Students Through Price Bundling 525
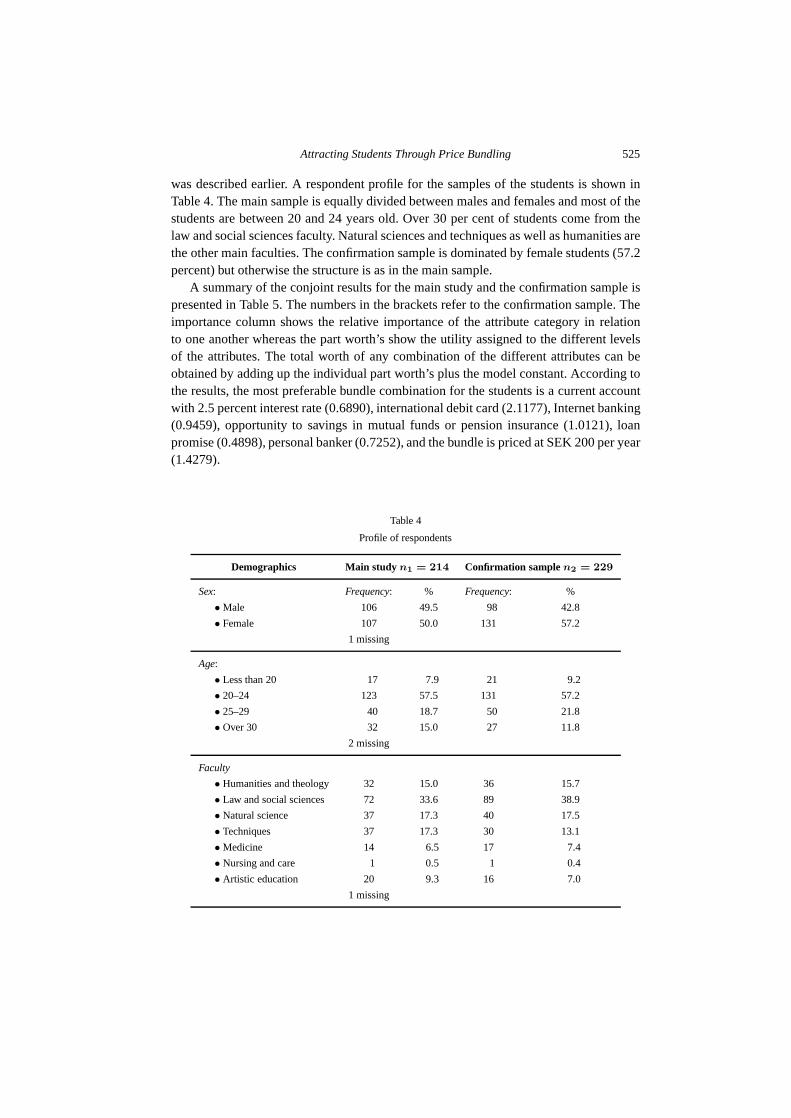
was described earlier. A respondent profile for the samples of the students is shown inTable 4. The main sample is equally divided between males and females and most of thestudents are between 20 and 24 years old. Over 30 per cent of students come from thelaw and social sciences faculty. Natural sciences and techniques as well as humanities arethe other main faculties. The confirmation sample is dominated by female students (57.2percent) but otherwise the structure is as in the main sample.
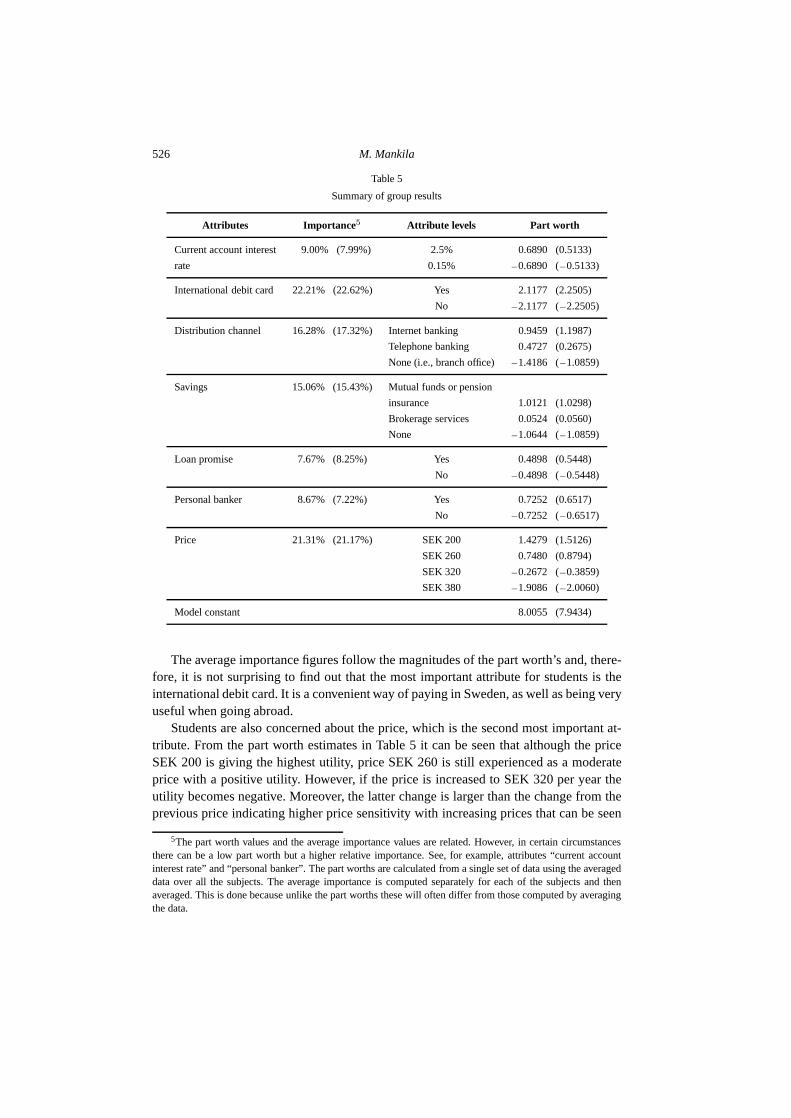
A summary of the conjoint results for the main study and the confirmation sample ispresented in Table 5. The numbers in the brackets refer to the confirmation sample. Theimportance column shows the relative importance of the attribute category in relationto one another whereas the part worth’s show the utility assigned to the different levelsof the attributes. The total worth of any combination of the different attributes can beobtained by adding up the individual part worth’s plus the model constant. According tothe results, the most preferable bundle combination for the students is a current accountwith 2.5 percent interest rate (0.6890), international debit card (2.1177), Internet banking(0.9459), opportunity to savings in mutual funds or pension insurance (1.0121), loanpromise (0.4898), personal banker (0.7252), and the bundle is priced at SEK 200 per year(1.4279).
Table 4
Profile of respondents
Demographics Main studyn1 = 214 Confirmation samplen2 = 229
Sex: Frequency: % Frequency: %
• Male 106 49.5 98 42.8
• Female 107 50.0 131 57.2
1 missing
Age:
• Less than 20 17 7.9 21 9.2
• 20–24 123 57.5 131 57.2
• 25–29 40 18.7 50 21.8
• Over 30 32 15.0 27 11.8
2 missing
Faculty
• Humanities and theology 32 15.0 36 15.7
• Law and social sciences 72 33.6 89 38.9
• Natural science 37 17.3 40 17.5
• Techniques 37 17.3 30 13.1
• Medicine 14 6.5 17 7.4
• Nursing and care 1 0.5 1 0.4
• Artistic education 20 9.3 16 7.0
1 missing
526 M. Mankila
Table 5
Summary of group results
Attributes Importance 5 Attribute levels Part worth
Current account interest 9.00% (7.99%) 2.5% 0.6890 (0.5133)
rate 0.15% −0.6890 (−0.5133)
International debit card 22.21% (22.62%) Yes 2.1177 (2.2505)
No −2.1177 (−2.2505)
Distribution channel 16.28% (17.32%) Internet banking 0.9459 (1.1987)
Telephone banking 0.4727 (0.2675)
None (i.e., branch office) −1.4186 (−1.0859)
Savings 15.06% (15.43%) Mutual funds or pension
insurance 1.0121 (1.0298)
Brokerage services 0.0524 (0.0560)
None −1.0644 (−1.0859)
Loan promise 7.67% (8.25%) Yes 0.4898 (0.5448)
No −0.4898 (−0.5448)
Personal banker 8.67% (7.22%) Yes 0.7252 (0.6517)
No −0.7252 (−0.6517)
Price 21.31% (21.17%) SEK 200 1.4279 (1.5126)
SEK 260 0.7480 (0.8794)
SEK 320 −0.2672 (−0.3859)
SEK 380 −1.9086 (−2.0060)
Model constant 8.0055 (7.9434)
The average importance figures follow the magnitudes of the part worth’s and, there-fore, it is not surprising to find out that the most important attribute for students is theinternational debit card. It is a convenient way of paying in Sweden, as well as being veryuseful when going abroad.
Students are also concerned about the price, which is the second most important at-tribute. From the part worth estimates in Table 5 it can be seen that although the priceSEK 200 is giving the highest utility, price SEK 260 is still experienced as a moderateprice with a positive utility. However, if the price is increased to SEK 320 per year theutility becomes negative. Moreover, the latter change is larger than the change from theprevious price indicating higher price sensitivity with increasing prices that can be seen
5The part worth values and the average importance values are related. However, in certain circumstancesthere can be a low part worth but a higher relative importance. See, for example, attributes “current accountinterest rate” and “personal banker”. The part worths are calculated from a single set of data using the averageddata over all the subjects. The average importance is computed separately for each of the subjects and thenaveraged. This is done because unlike the part worths these will often differ from those computed by averagingthe data.
Attracting Students Through Price Bundling 527
even more clearly when the price is changed from SEK 320 to SEK 380. It can be con-cluded that, in general, students are relatively price sensitive since the price is consideredas the second most important factor.
The delivery channel attribute is the third most important factor for the students, andtheir most preferable delivery channel is the Internet bank. Telephone banking also givesa positive utility value, and a bundle without any of these services forcing the student togo to a branch office would reduce the utility considerably.
The most surprising result seems to be the fact that students are willing to save SEK200 each month on a long term savings alternative, i.e., mutual funds or pension insur-ance. Savings during the student time was not a priori assumed to be interesting for thestudents since they are living on relatively low incomes and were supposed to make onlyshorter term consumption decisions. However, the result is conditioned by the formu-lation of the opportunity that by so doing they would get a 20% price discount on theyearly fee for the bundle. This fact also shows another example of the students’ pricesensitiveness at the same time as it indicates regarding the preference to save.
The three attributes that are the least important for the students are the interest rateon current account + giro payment service and ATM-card, the promise of a loan and thepersonal banker. It seems reasonable that the interest rate on the current account is notvery important factor for the average students on average since it is unlikely that theyhave high balances on their transaction accounts. Moreover, that attribute is coupled withgiro payment services that become unnecessary if the students use the Internet bank.The opportunity to get a loan in order to purchase a computer does not seem to be apriority for the average student. In many universities computing facilities are very good,and parents also tend to help their children when bying a computer, why this might be thecase. However, if the promise of getting a loan is included in the bundle it gives a slightutility increase for the student.
The result that the personal banker is not a very important factor is not unexpectedsince students prefer to take care of their banking businesses through the Internet bank orthe telephone bank and dislike visiting a branch office. Students’ banking affairs are alsolikely to be of a relatively simple character, which is why an own personal banker is notneeded. This result may also give an indication of independent and highly sophisticatedcustomers who do not usually need or want personal assistance.
4. Results of the Segmentation Analysis
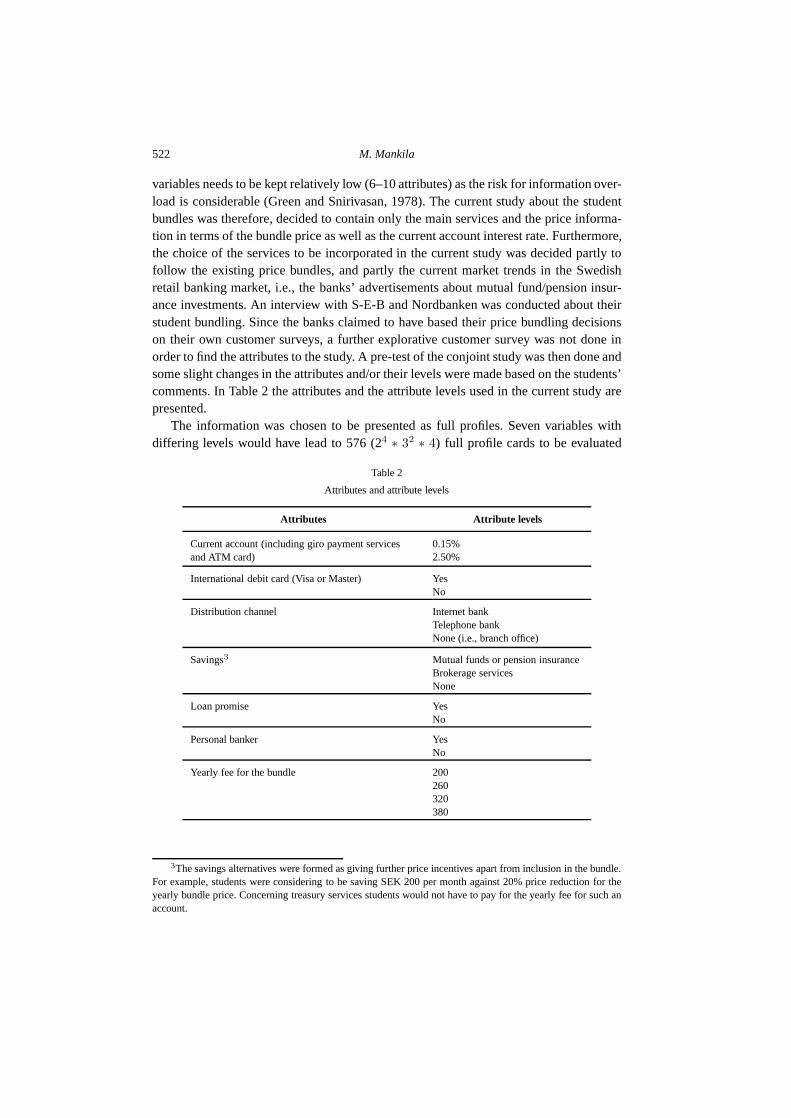
The main results presented in the previous section showed some variety in the utilityfunctions on the respondent level suggesting that students’ preferences are heterogeneous.This result could be expected based on the previous research about the youth market(Lewis et al., 1991). Four different customer groups were found in the cluster analysisthat are portrayed in Fig. 1.
The first group of students value the international debit card highest, and these stu-dents are only moderately interested in the other banking services. Price comes as the
528 M. Mankila
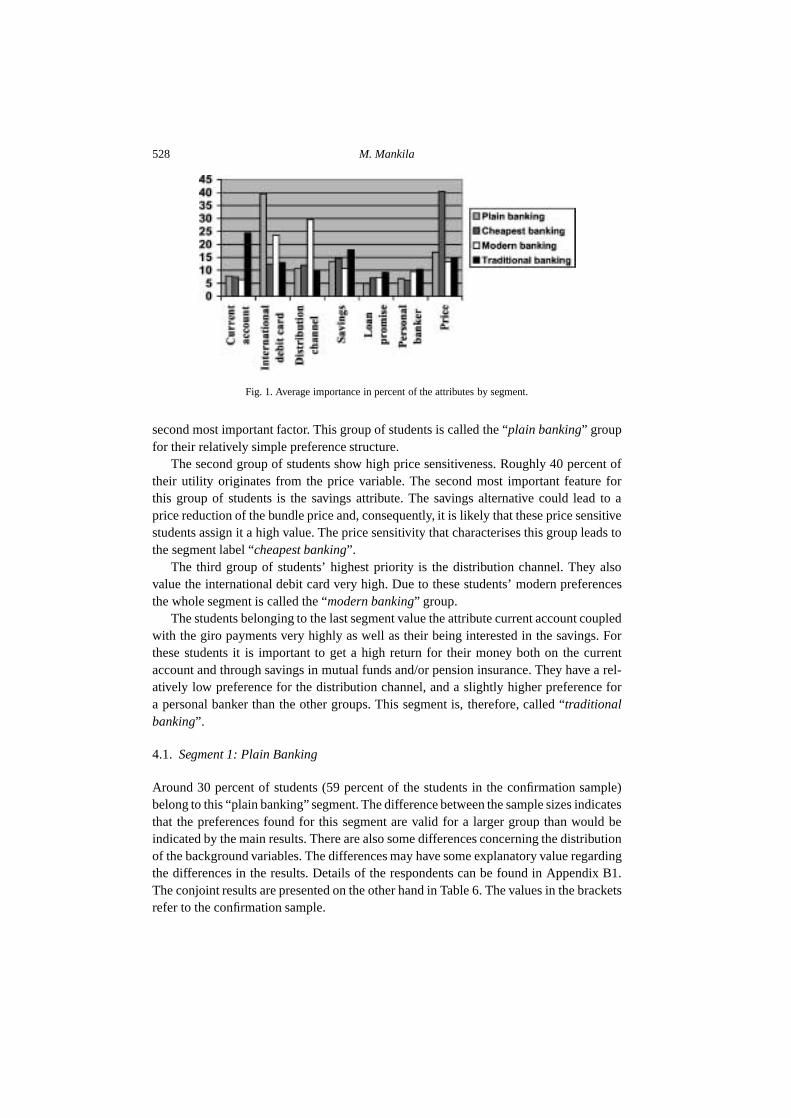
Fig. 1. Average importance in percent of the attributes by segment.
second most important factor. This group of students is called the “plain banking” groupfor their relatively simple preference structure.
The second group of students show high price sensitiveness. Roughly 40 percent oftheir utility originates from the price variable. The second most important feature forthis group of students is the savings attribute. The savings alternative could lead to aprice reduction of the bundle price and, consequently, it is likely that these price sensitivestudents assign it a high value. The price sensitivity that characterises this group leads tothe segment label “cheapest banking”.
The third group of students’ highest priority is the distribution channel. They alsovalue the international debit card very high. Due to these students’ modern preferencesthe whole segment is called the “modern banking” group.
The students belonging to the last segment value the attribute current account coupledwith the giro payments very highly as well as their being interested in the savings. Forthese students it is important to get a high return for their money both on the currentaccount and through savings in mutual funds and/or pension insurance. They have a rel-atively low preference for the distribution channel, and a slightly higher preference fora personal banker than the other groups. This segment is, therefore, called “traditionalbanking”.
4.1. Segment 1: Plain Banking
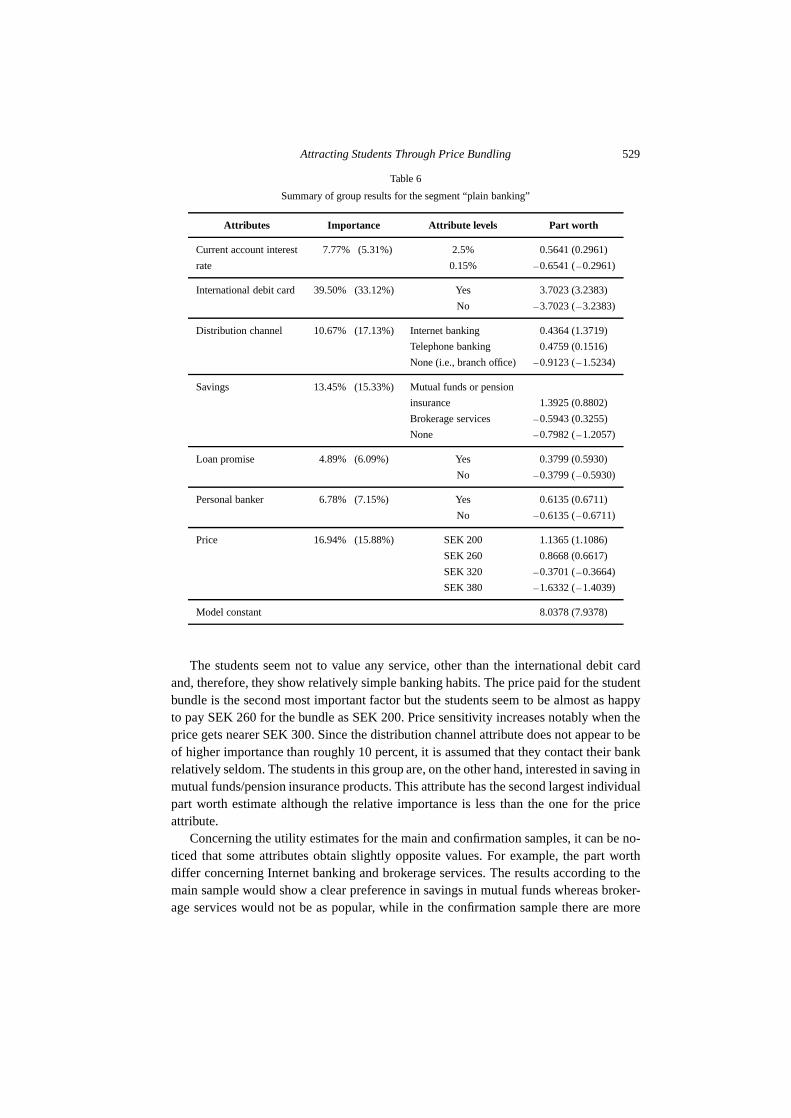
Around 30 percent of students (59 percent of the students in the confirmation sample)belong to this “plain banking” segment. The difference between the sample sizes indicatesthat the preferences found for this segment are valid for a larger group than would beindicated by the main results. There are also some differences concerning the distributionof the background variables. The differences may have some explanatory value regardingthe differences in the results. Details of the respondents can be found in Appendix B1.The conjoint results are presented on the other hand in Table 6. The values in the bracketsrefer to the confirmation sample.
Attracting Students Through Price Bundling 529
Table 6
Summary of group results for the segment “plain banking”
Attributes Importance Attribute levels Part worth
Current account interest 7.77% (5.31%) 2.5% 0.5641 (0.2961)
rate 0.15% −0.6541 (−0.2961)
International debit card 39.50% (33.12%) Yes 3.7023 (3.2383)
No −3.7023 (−3.2383)
Distribution channel 10.67% (17.13%) Internet banking 0.4364 (1.3719)
Telephone banking 0.4759 (0.1516)
None (i.e., branch office) −0.9123 (−1.5234)
Savings 13.45% (15.33%) Mutual funds or pension
insurance 1.3925 (0.8802)
Brokerage services −0.5943 (0.3255)
None −0.7982 (−1.2057)
Loan promise 4.89% (6.09%) Yes 0.3799 (0.5930)
No −0.3799 (−0.5930)
Personal banker 6.78% (7.15%) Yes 0.6135 (0.6711)
No −0.6135 (−0.6711)
Price 16.94% (15.88%) SEK 200 1.1365 (1.1086)
SEK 260 0.8668 (0.6617)
SEK 320 −0.3701 (−0.3664)
SEK 380 −1.6332 (−1.4039)
Model constant 8.0378 (7.9378)
The students seem not to value any service, other than the international debit cardand, therefore, they show relatively simple banking habits. The price paid for the studentbundle is the second most important factor but the students seem to be almost as happyto pay SEK 260 for the bundle as SEK 200. Price sensitivity increases notably when theprice gets nearer SEK 300. Since the distribution channel attribute does not appear to beof higher importance than roughly 10 percent, it is assumed that they contact their bankrelatively seldom. The students in this group are, on the other hand, interested in saving inmutual funds/pension insurance products. This attribute has the second largest individualpart worth estimate although the relative importance is less than the one for the priceattribute.
Concerning the utility estimates for the main and confirmation samples, it can be no-ticed that some attributes obtain slightly opposite values. For example, the part worthdiffer concerning Internet banking and brokerage services. The results according to themain sample would show a clear preference in savings in mutual funds whereas broker-age services would not be as popular, while in the confirmation sample there are more

530 M. Mankila
students preferring brokerage services than mutual funds. There are also differences inthe marginal utility figures for the distribution channel attribute. The main results suggestthat Internet banking and telephone banking are equally interesting whereas according tothe confirmation sample Internet banking is clearly preferred to that of telephone banking.
These differences might be due to the differences in the distribution of the backgroundvariables between the samples. In the confirmation sample 45 percent of students comefrom law and social sciences as opposed to 29 percent in the main study sample. It couldbe assumed that business students, who formed a large group of social scientists, are moreinterested in the brokerage services. The same factor can also affect the stronger prefer-ence for Internet banking. Other possible explanations can be derived from the variablessex or age. In the confirmation sample there are more males than in the main study, andthey could probably be more interested in brokerage services while females, on average,might prefer ‘securer’ mutual funds or pension insurance products. Internet banking alsoseems to be more preferred by males (compare these results also with the segment “mod-ern banking” later on). Concerning the age of students it can be seen that the confirmationsample has got an older age structure than is the case for the main sample. These olderstudents may have better finances and are therefore willing to take higher risks. In spite ofthese differences between the two groups, other preference values, or at least their signs,follow the same pattern.
4.2. Segment 2: Cheapest Banking
The second customer segment is called the “cheapest banking” group for their price sen-sitiveness as measured by the relative importance for the price attribute. Approximatelyone third of the students (25 percent for the confirmation sample) have preferences thatsuit the utility pattern presented in Table 7. The distribution between males and femalesis approximately 40 to 60 (30 to 70 for the confirmation sample) percent which pointsout that female students may, on average, be more price sensitive than male students.Law and social science students dominate the main study group while the largest facultyconcerning the confirmation sample are natural scientists. The age distribution is rela-tively equal between the samples. The details for the respondent profile can be found inAppendix B2.
As the name implies, price is the most important factor and to pay the lowest possibleprice yields the highest utility for the students in this group. From the part worths it isseen that the students are very price sensitive throughout all the price levels as the utilitydrops significantly along the higher prices. The higher interest rate attribute level alsoshows a reasonably high individual part worth value but its relative importance is only7.5 percent. It is the fifth most important factor.
As regards banking services, the price sensitive students value the international debitcard highest. However, the average importance for the savings attribute is higher. Accord-ing to the main results this group of students prefers the brokerage services to saving inmutual funds/pension insurance. This result is contradicted by the confirmation samplewhere mutual funds type of saving is preferred while brokerage services yield a negative

Attracting Students Through Price Bundling 531
Table 7
Summary of group results for the segment “cheapest banking”
Attributes Importance Attribute levels Part worth
Current account interest 7.47% (6.92%) 2.5% 0.7743 (0.6066)
rate 0.15% −0.7743 (−0.6066)
International debit card 12.42% (11.30%) Yes 1.2986 (1.1360)
No −1.2986 (−1.1360)
Distribution channel 11.92% (13.07%) Internet banking 0.4028 (0.4167)
Telephone banking 0.8160 (0.8100)
None (i.e., branch office) −1.2188 (−1.2267)
Savings 14.65% (14.40%) Mutual funds or pension
insurance −0.0185 (1.4853)
Brokerage services 0.9815 (−0.8419)
None −0.9630 (−0.6434)
Loan promise 7.05% (6.73%) Yes 0.6389 (0.0478)
No −0.6389 (−0.0478)
Personal banker 6.11% (5.48%) Yes 0.5243 (0.4191)
No −0.5243 (−0.4191)
Price 40.38% (42.10%) SEK 200 3.3958 (3.6029)
SEK 260 1.8611 (2.0441)
SEK 320 −1.0278 (−0.9559)
SEK 380 −4.2292 (−4.6912)
Model constant 8.4039 (8.0319)
marginal utility. However, when the respondent profile variables are taken into consider-ation these results may again be explained by the different compositions between malesand females as well as by the faculty. In the main sample there are more males than in theconfirmation sample, and a large share of these students study business and other socialsciences. This would lead to exactly the same explanation as was previously offered forthe segment “plain banking” for similar differences: males studying business could beexpected to be less risk averse and, therefore, to prefer brokerage services.
It can also be noticed that the price sensitive group of students would prefer telephonebanking to Internet banking. This result is consistent with both of the samples, and itdisagrees with the average results for the whole student sample. However, the interest forthe banking services seems not to be generally pronounced in this group, based on the lowvalues for the individual part worths for the different service attributes. Consequently, theresults indicate that for this group of students banking may be merely a necessary evil,and they want to bank as cheaply as possible.
532 M. Mankila
4.3. Segment 3: Modern Banking
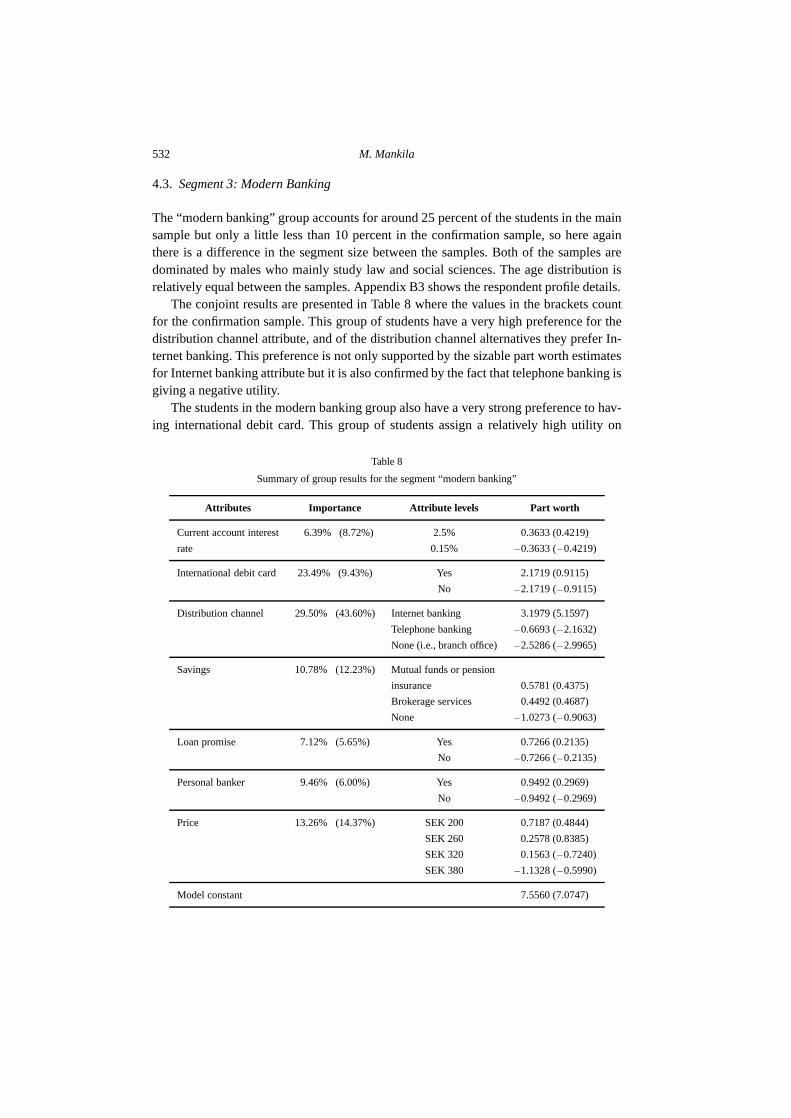
The “modern banking” group accounts for around 25 percent of the students in the mainsample but only a little less than 10 percent in the confirmation sample, so here againthere is a difference in the segment size between the samples. Both of the samples aredominated by males who mainly study law and social sciences. The age distribution isrelatively equal between the samples. Appendix B3 shows the respondent profile details.
The conjoint results are presented in Table 8 where the values in the brackets countfor the confirmation sample. This group of students have a very high preference for thedistribution channel attribute, and of the distribution channel alternatives they prefer In-ternet banking. This preference is not only supported by the sizable part worth estimatesfor Internet banking attribute but it is also confirmed by the fact that telephone banking isgiving a negative utility.
The students in the modern banking group also have a very strong preference to hav-ing international debit card. This group of students assign a relatively high utility on
Table 8
Summary of group results for the segment “modern banking”
Attributes Importance Attribute levels Part worth
Current account interest 6.39% (8.72%) 2.5% 0.3633 (0.4219)
rate 0.15% −0.3633 (−0.4219)
International debit card 23.49% (9.43%) Yes 2.1719 (0.9115)
No −2.1719 (−0.9115)
Distribution channel 29.50% (43.60%) Internet banking 3.1979 (5.1597)
Telephone banking −0.6693 (−2.1632)
None (i.e., branch office) −2.5286 (−2.9965)
Savings 10.78% (12.23%) Mutual funds or pension
insurance 0.5781 (0.4375)
Brokerage services 0.4492 (0.4687)
None −1.0273 (−0.9063)
Loan promise 7.12% (5.65%) Yes 0.7266 (0.2135)
No −0.7266 (−0.2135)
Personal banker 9.46% (6.00%) Yes 0.9492 (0.2969)
No −0.9492 (−0.2969)
Price 13.26% (14.37%) SEK 200 0.7187 (0.4844)
SEK 260 0.2578 (0.8385)
SEK 320 0.1563 (−0.7240)
SEK 380 −1.1328 (−0.5990)
Model constant 7.5560 (7.0747)
Attracting Students Through Price Bundling 533
having a contact person in a bank when looking at the main results, but this attribute is, incomparison with the other attributes, not very important. Moreover, the values accordingto the confirmation sample show slightly vague preference for a personal banker.
Savings is also, for this group of students, of some interest and the interest is dividedequally between mutual funds and brokerage services. Concerning the price variable itis very interesting to notice that even the price level of SEK 320 per year is assigned apositive utility. However, the price sensitivity increases considerably if the price is in-creased to SEK 380. The result for the confirmation sample, on the other hand, showssomewhat irrational price behaviour. The most preferred price level is SEK 260, and thehighest price SEK 380 has acquired a less negative utility than the previous price level.This could also be a sign of the lesser importance of the price attribute in general and,therefore, it would result in ad hoc choices concerning the price attribute. This, in turn,would confirm the conclusion about a relatively low price sensitivity for this group ofstudents. However, the size of the confirmation sample segment may have an effect onthe results. One further indication of a low price sensitivity may be obtained from theutility values for the current account interest rate attribute since that attribute is the leastimportant for these students.
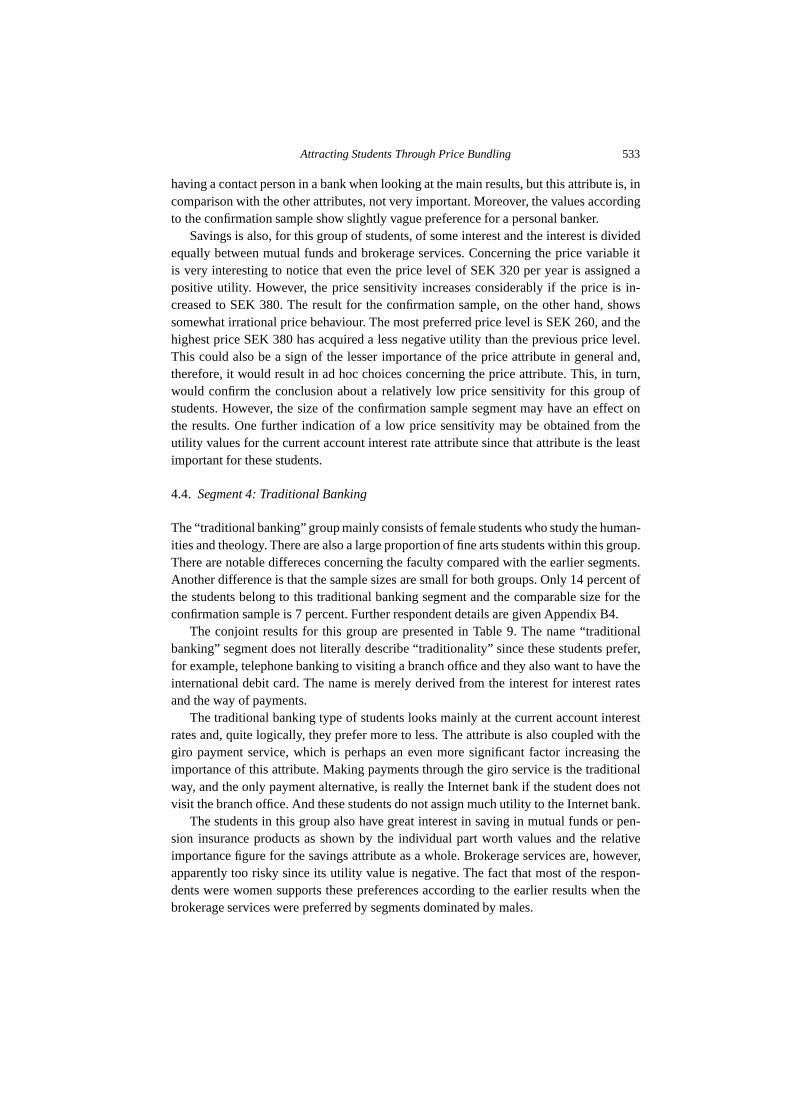
4.4. Segment 4: Traditional Banking
The “traditional banking” group mainly consists of female students who study the human-ities and theology. There are also a large proportion of fine arts students within this group.There are notable differeces concerning the faculty compared with the earlier segments.Another difference is that the sample sizes are small for both groups. Only 14 percent ofthe students belong to this traditional banking segment and the comparable size for theconfirmation sample is 7 percent. Further respondent details are given Appendix B4.
The conjoint results for this group are presented in Table 9. The name “traditionalbanking” segment does not literally describe “traditionality” since these students prefer,for example, telephone banking to visiting a branch office and they also want to have theinternational debit card. The name is merely derived from the interest for interest ratesand the way of payments.
The traditional banking type of students looks mainly at the current account interestrates and, quite logically, they prefer more to less. The attribute is also coupled with thegiro payment service, which is perhaps an even more significant factor increasing theimportance of this attribute. Making payments through the giro service is the traditionalway, and the only payment alternative, is really the Internet bank if the student does notvisit the branch office. And these students do not assign much utility to the Internet bank.
The students in this group also have great interest in saving in mutual funds or pen-sion insurance products as shown by the individual part worth values and the relativeimportance figure for the savings attribute as a whole. Brokerage services are, however,apparently too risky since its utility value is negative. The fact that most of the respon-dents were women supports these preferences according to the earlier results when thebrokerage services were preferred by segments dominated by males.
534 M. Mankila
Table 9
Summary of group results for the “traditional banking” group
Attributes Importance Attribute levels Part worth
Current account interest 24.43% (27.80%) 2.5% 2.3750 (2.7917)
rate 0.15% −2.3750 (−2.7917)
International debit card 13.01% (8.21%) Yes 1.1618 (0.7361)
No −1.1618 (−0.7361)
Distribution channel 10.04% (14.51%) Internet banking −0.1078 (0.2037)
Telephone banking 0.6422 (1.1898)
None (i.e., branch office) −0.5343 (−1.3935)
Savings 17.95% (13.74%) Mutual funds or pension
insurance 1.7941 (1.2963)
Brokerage services −0.7353 (0.0463)
None −1.0588 (−1.3426)
Loan promise 9.21% (15.90%) Yes −0.0368 (1.3056)
No 0.0368 (−1.3056)
Personal banker 10.48% (6.25%) Yes 0.1029 (0.6667)
No −0.1029 (−0.6667)
Price 14.88% (21.17%) SEK 200 0.6838 (0.7778)
SEK 260 0.4779 (0.1389)
SEK 320 −0.3162 (0.3056)
SEK 380 −0.8456 (−1.2222)
Model constant 8.0270 (8.1250)
Price is the third most important factor for this segment, and the results seem to befollowing the same pattern as for the segment “plain banking”. The price SEK 260 ap-pears as a normal price, and whether the bundle costs SEK 200 or SEK 260 seems not toaffect the students’ utility level very much. These students are, therefore, not very pricesensitive at the price level below SEK 300.
The results regarding the loan promise demonstrate how preferences differ largelybetween the individuals in this segment. This is true for the attributes that are not soimportant whereas the most important factors are evaluated similarly. However, it is sur-prising to notice that a loan promise can also be experienced as a negative factor if it isincluded in the bundle. It is possible that if these students are careful and cautious abouttheir money, as is indicated by their interest for interest rates and savings, an incentive totake a loan may be too aggressive an offer. However, once again, the result is quite thecontradictory for the confirmation sample concerning this variable why there is not muchsupport for this finding – other than that it demonstrates the remaining heterogeneity ofstudents’ preferences even after clustering them into the “homogeneous” segments.
Attracting Students Through Price Bundling 535
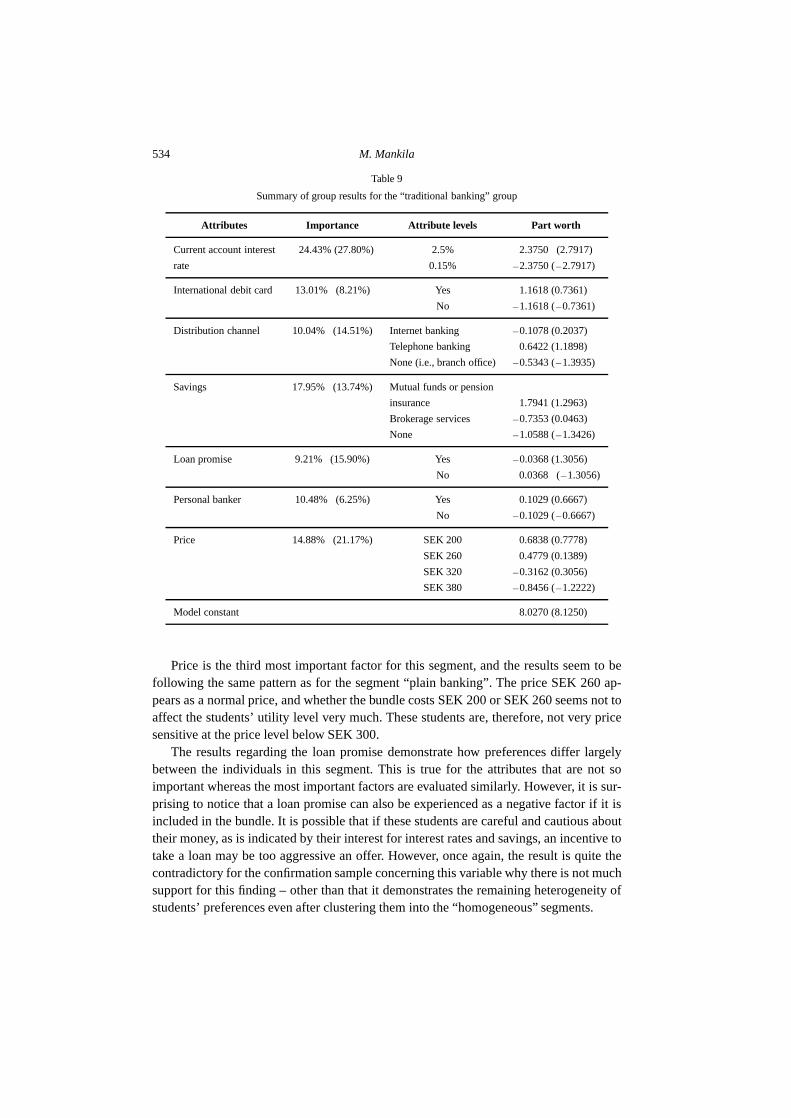
5. Students Banking Behaviour in Sweden
In addition to the ranking assignment in conjoint analysis, students were asked to give an-swers to some questions about their prevous and future banking behaviour. Their repliesare shown in Table 10 now joining the split samples from the cluster analysis together,i.e., the figures are based on 258 respondents’ answers.
There are not any dramatic differences in the banking behaviour between students inthe different segments. However, several numbers, for example, concerning the cheapestbanking segment show that these students’ profound price sensitiveness is to a certaindegree confirmed by their behaviour. 67.1 percent of these customers only use one bank,
Table 10
Statistics about students’ banking behaviour
Simple Cheapest Modern Traditional
banking: 46% banking: 27% banking: 17% banking: 10%
of students of students of students of students
How many banks
do you bank with currently?
1. One bank 73.7% 67.1% 72.7% 80.8%
2. Two banks 22.0% 27.1% 20.5% 15.4%
3. More than two banks 4.2% 5.7% 6.8% 3.8%
Which banks?
1. FöreningsSparbanken 36.9% 48.3% 33.3% 50.0%
2. Handelsbanken 17.4% 10.1% 14.0% 10.7%
3. Nordbanken 18.8% 16.9% 17.5% 25.0%
4. S-E-B 21.5% 14.6% 29.8% 10.7%
5. Niche bank 5.4% 10.1% 5.3% 3.6%
How many times have you
changed banks?
1. Never 64.4% 67.1% 68.2% 65.4%
2. Once 25.4% 21.4% 22.7% 26.9%
3. More than once 8.5% 11.4% 9.1% 3.8%
Do you intend to change
banks?
1. Yes 7.6% 10.0% 6.8% –
2. No 54.2% 45.7% 70.5% 65.4%
3. I am not sure 38.1% 44.3% 22.7% 34.6%
Do you have a student
bundle currently?
1. Yes 22.9% 11.4% 25.0% –
2. No 77.1% 88.6% 75.0% 100%
536 M. Mankila
which is the lowest figure compared with the other segments. 10.1 percent of the cheapestbanking students use niche banks that profile as a cheap alternative to the existing largebanks and that share is twice as big as the other segments’. The students in this segmenthave larger intentions to switch banks in the future than any of the other segments: 10percent are sure about switching and 44.3 percent are not sure whether to stay or toswitch. Based on these numbers they can be assumed to have shopped for price in the pastand they seem to continue shopping for better deals in the future. However, the absolutenumbers show that even the most price sensitive students are relatively inert to switchbanks, after all 67.1 percent of them have never changed banks which is in line with theother segments. Only 11.4 percent of price sensitive customers have a student bundlewhich indicates that the price sensitive customers’ demand is not very much affected bythe considerable price discounts shown in the bundles.
“Modern banking” group, in turn, shows a higher use of student bundles. 25 percent ofthem use it. They seem also to be satisfied with their current banks since their intentionsto switch banks are the lowest of all the segments. Although students’ use of banks isrelatively well distributed within the segments it is notable that nearly 30 percent of thesestudents use S-E-B which has been the most aggressive bank with its student bundling,and it was the first to start in Sweden.
Students in the “traditional banking” segment seem to be the most “loyal” customersif the loyalty is measured as a concentration of the banking business to only one bank:80.8 percent of these customers bank only with one bank. In addition, none of the studentshave definite intentions to switch banks in the future and 65.4 percent are sure of staying.It is perhaps not surprising that not any of these students use the price bundles bankscurrently offer since, as illustrated in Table 1, the bundles circle around Internet bankingwhereas the “traditional banking” customers prefer the telephone bank and they weremost interested in savings in mutual funds.
Concerning the “plain banking” segment, which is the largest segment, 22.9 percentuse price bundles. This figure is high compared with the other segments although theshare is not large in the absolute terms.
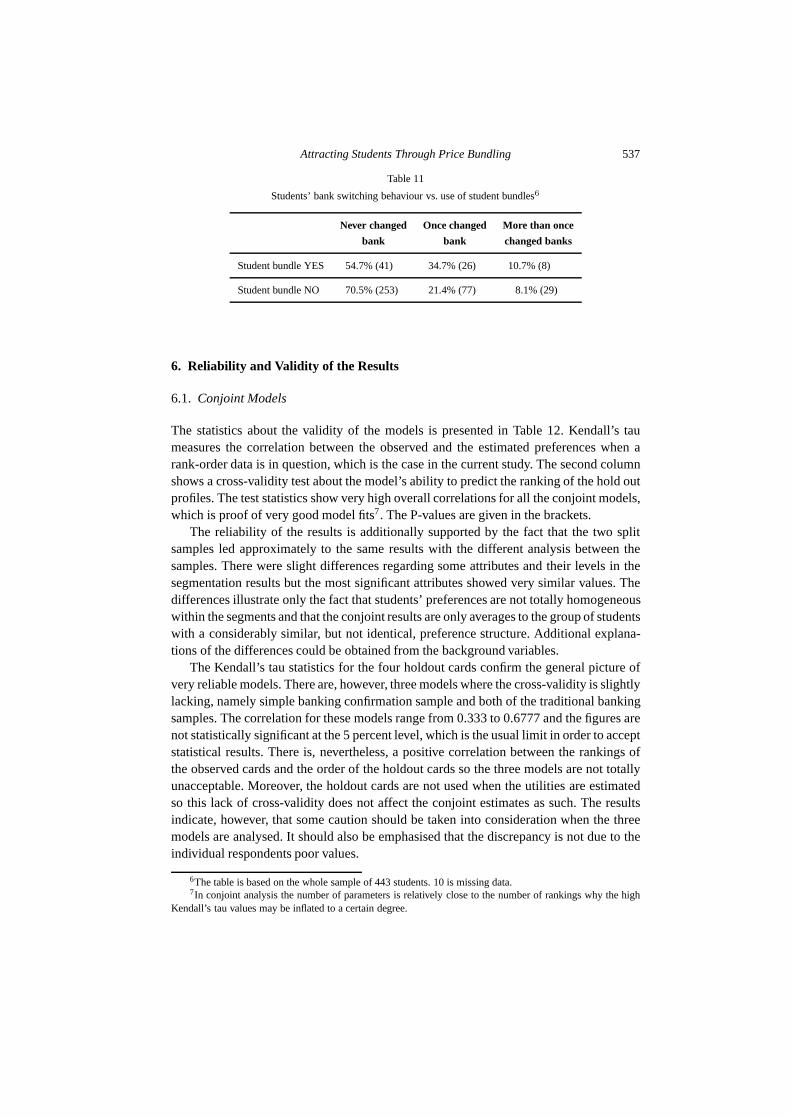
It is noteworthy that student bundling is not more popular among the students thanthe figures point out. It leads easily to a conclusion that price bundling has not beenvery efficient way of attracting customers in Sweden. More insight into this question isobtained when the use of student bundles is compared with the students’ overall bankswitching behaviour. Table 11 illustrates a situation when the students have been dividedinto two groups: those having a student bundle and those not having a student bundle.The numbers in the brackets in Table 11 refer to the number of students.
Chi-Square test statistics for group differences shows a statistically significant effectof student bundling to bank switching behaviour. Pearson Chi-Square value is 7.373. Theconclusion is that the retail banks’ student bundling strategy has had an effect on bankswitching.
Attracting Students Through Price Bundling 537
Table 11
Students’ bank switching behaviour vs. use of student bundles6
Never changed Once changed More than once
bank bank changed banks
Student bundle YES 54.7% (41) 34.7% (26) 10.7% (8)
Student bundle NO 70.5% (253) 21.4% (77) 8.1% (29)
6. Reliability and Validity of the Results
6.1. Conjoint Models
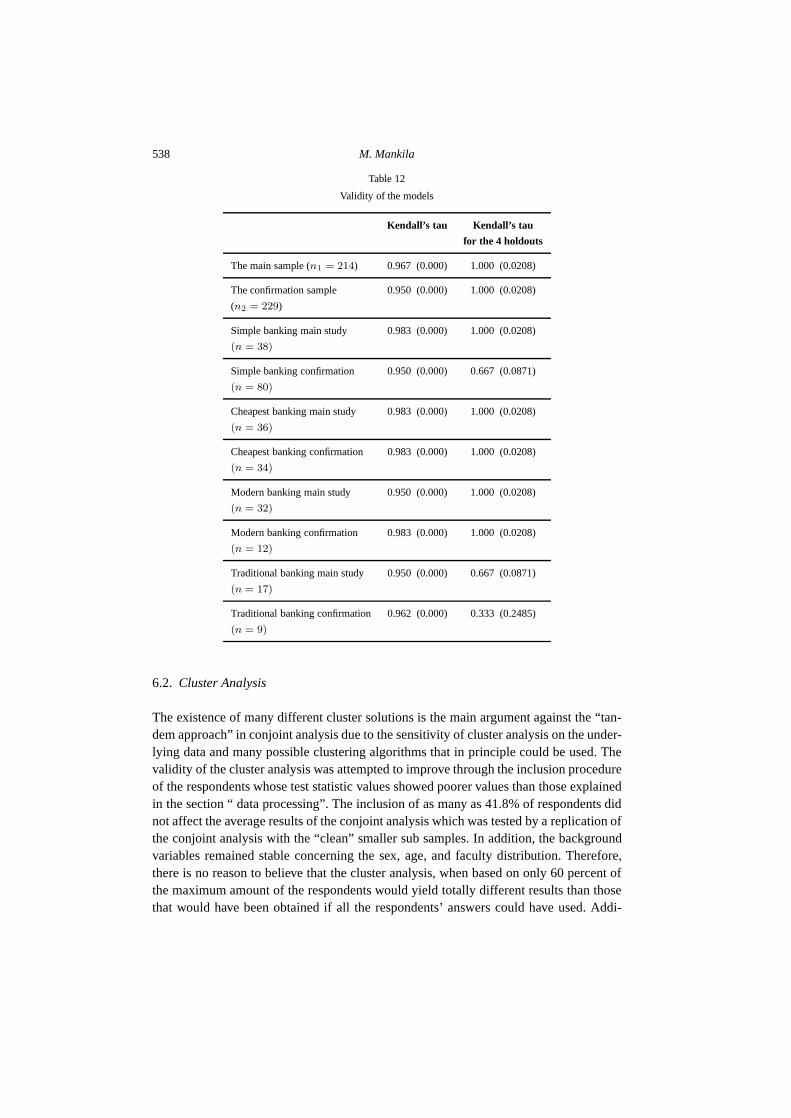
The statistics about the validity of the models is presented in Table 12. Kendall’s taumeasures the correlation between the observed and the estimated preferences when arank-order data is in question, which is the case in the current study. The second columnshows a cross-validity test about the model’s ability to predict the ranking of the hold outprofiles. The test statistics show very high overall correlations for all the conjoint models,which is proof of very good model fits7. The P-values are given in the brackets.
The reliability of the results is additionally supported by the fact that the two splitsamples led approximately to the same results with the different analysis between thesamples. There were slight differences regarding some attributes and their levels in thesegmentation results but the most significant attributes showed very similar values. Thedifferences illustrate only the fact that students’ preferences are not totally homogeneouswithin the segments and that the conjoint results are only averages to the group of studentswith a considerably similar, but not identical, preference structure. Additional explana-tions of the differences could be obtained from the background variables.
The Kendall’s tau statistics for the four holdout cards confirm the general picture ofvery reliable models. There are, however, three models where the cross-validity is slightlylacking, namely simple banking confirmation sample and both of the traditional bankingsamples. The correlation for these models range from 0.333 to 0.6777 and the figures arenot statistically significant at the 5 percent level, which is the usual limit in order to acceptstatistical results. There is, nevertheless, a positive correlation between the rankings ofthe observed cards and the order of the holdout cards so the three models are not totallyunacceptable. Moreover, the holdout cards are not used when the utilities are estimatedso this lack of cross-validity does not affect the conjoint estimates as such. The resultsindicate, however, that some caution should be taken into consideration when the threemodels are analysed. It should also be emphasised that the discrepancy is not due to theindividual respondents poor values.
6The table is based on the whole sample of 443 students. 10 is missing data.7In conjoint analysis the number of parameters is relatively close to the number of rankings why the high
Kendall’s tau values may be inflated to a certain degree.
538 M. Mankila
Table 12
Validity of the models
Kendall’s tau Kendall’s tau
for the 4 holdouts
The main sample (n1 = 214) 0.967 (0.000) 1.000 (0.0208)
The confirmation sample 0.950 (0.000) 1.000 (0.0208)
(n2 = 229)
Simple banking main study 0.983 (0.000) 1.000 (0.0208)
(n = 38)
Simple banking confirmation 0.950 (0.000) 0.667 (0.0871)
(n = 80)
Cheapest banking main study 0.983 (0.000) 1.000 (0.0208)
(n = 36)
Cheapest banking confirmation 0.983 (0.000) 1.000 (0.0208)
(n = 34)
Modern banking main study 0.950 (0.000) 1.000 (0.0208)
(n = 32)
Modern banking confirmation 0.983 (0.000) 1.000 (0.0208)
(n = 12)
Traditional banking main study 0.950 (0.000) 0.667 (0.0871)
(n = 17)
Traditional banking confirmation 0.962 (0.000) 0.333 (0.2485)
(n = 9)
6.2. Cluster Analysis
The existence of many different cluster solutions is the main argument against the “tan-dem approach” in conjoint analysis due to the sensitivity of cluster analysis on the under-lying data and many possible clustering algorithms that in principle could be used. Thevalidity of the cluster analysis was attempted to improve through the inclusion procedureof the respondents whose test statistic values showed poorer values than those explainedin the section “ data processing”. The inclusion of as many as 41.8% of respondents didnot affect the average results of the conjoint analysis which was tested by a replication ofthe conjoint analysis with the “clean” smaller sub samples. In addition, the backgroundvariables remained stable concerning the sex, age, and faculty distribution. Therefore,there is no reason to believe that the cluster analysis, when based on only 60 percent ofthe maximum amount of the respondents would yield totally different results than thosethat would have been obtained if all the respondents’ answers could have used. Addi-
Attracting Students Through Price Bundling 539
tionally, the cluster analysis was done with tow different methods in order to test thereliability of the results. They produced reasonably similar cluster sizes and cluster cen-troids for the two samples. Because the cluster analysis is never an exact science, it wasjudged that the obtained cluster solutions were satisfactorily similar. Therefore, the pre-sented cluster solution is determined to be reliable especially since the results have beenable to confirm with the split sampling procedure.
6.3. Respondents
Together with the conjoint analysis the respondents were also asked several questionsabout their opinion of the survey, if something was missing, how they had done the rank-ing, what they felt during the survey, and how they evaluated the difficultness of thesurvey. This information was considered as an important check for the trustworthinessof the use of conjoint method since no study becomes better than the input it is basedon. It seems confident to notice that the respondents have had all kinds of feelings, evennegative. Most of the respondents felt helpful, interested, rational, motivated and usefulwhen doing the ranking. This is natural since the students who participated in the surveydid it voluntarily. Still many respondents in the group were also irritated and confused.Only a small fraction of students have felt used or been suspicious.
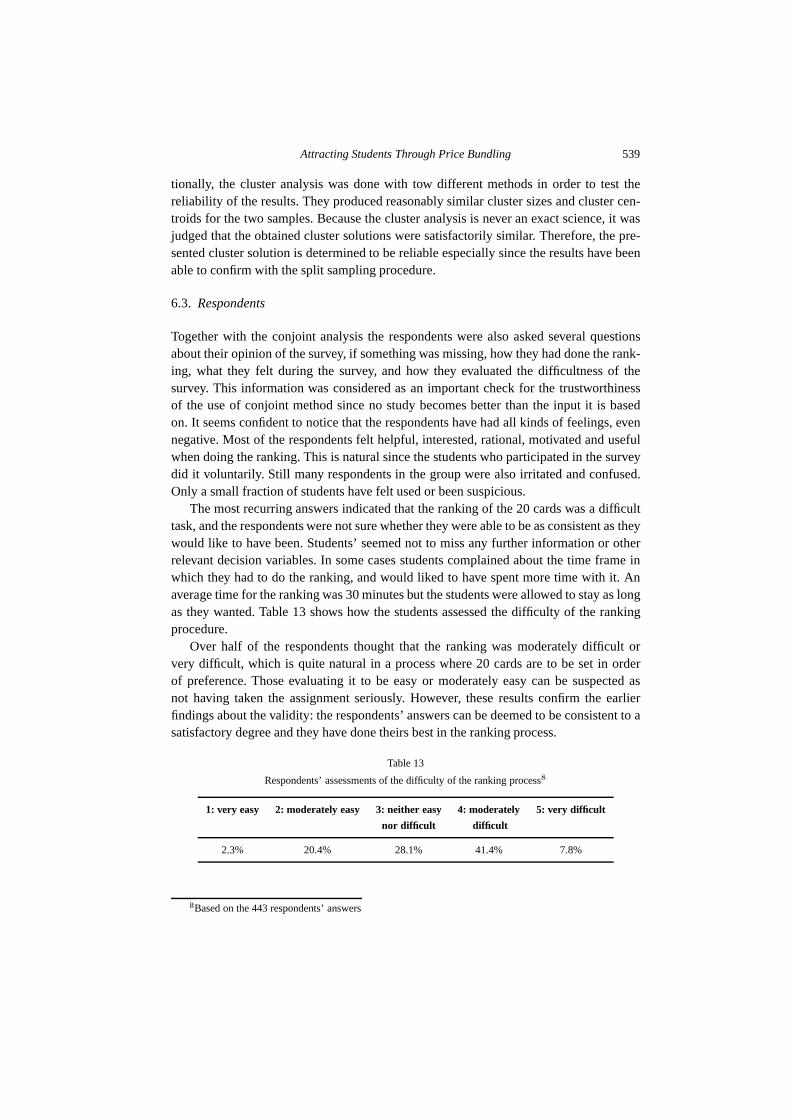
The most recurring answers indicated that the ranking of the 20 cards was a difficulttask, and the respondents were not sure whether they were able to be as consistent as theywould like to have been. Students’ seemed not to miss any further information or otherrelevant decision variables. In some cases students complained about the time frame inwhich they had to do the ranking, and would liked to have spent more time with it. Anaverage time for the ranking was 30 minutes but the students were allowed to stay as longas they wanted. Table 13 shows how the students assessed the difficulty of the rankingprocedure.
Over half of the respondents thought that the ranking was moderately difficult orvery difficult, which is quite natural in a process where 20 cards are to be set in orderof preference. Those evaluating it to be easy or moderately easy can be suspected asnot having taken the assignment seriously. However, these results confirm the earlierfindings about the validity: the respondents’ answers can be deemed to be consistent to asatisfactory degree and they have done theirs best in the ranking process.
Table 13
Respondents’ assessments of the difficulty of the ranking process8
1: very easy 2: moderately easy 3: neither easy 4: moderately 5: very difficult
nor difficult difficult
2.3% 20.4% 28.1% 41.4% 7.8%
8Based on the 443 respondents’ answers
540 M. Mankila
The lottery ticket that was given to the students as a reward (worth SEK 10) is notassumed to have affected the conjoint results as students did not have the possibility ofbeing able to figure out what kind of results the researcher may have wanted. The lotteryticket was necessary to get the students to participate in the study.
6.4. Sampling Method and Generalisability of the Results
Yet another point worth mentioning concerns the data gathering method. Since the sam-pling procedure could not, for practical reasons, be totally random and have those whowere chosen not all chose to take part in the study. It could be estimated that around 25percent of the students stayed on average. There is a question whether the graduatingstudents who left would have had totally different preferences than the ones taking partin the study. It seems more likely that the “missing” students were less interested in retailbanking services, or were in a hurry etc in general than that their preferences would betotally different from the ones obtained in this study. Of course this cannot be arguedwith full confidence but there would not be any way to force a person to do the conjointevaluations, if they did not want to, which is why this is impossible to test empirically.
The last point concerns the generalisability of the results. The data was collected atGothenburg University and Chalmers University of Technology in Sweden. The studentsin the sample come from different faculties and that distribution follows relatively wellthe situation in Sweden as a whole. The graduating students use of the different banksis almost proportionally equal in all the samples. Since many students move to a largestudent town such as Gotenburg, from nay parts of Sweden, it is likely that the resultsobtained in this study would not only apply to students, in general, in Gotenburg but alsoto a considerable degree for the whole country. Internationally the results could be mostvalid in the retail banking markets that have similar characteristics to Sweden. However,the results are valid only for the student market and they would not be generalisable toother customer groups in retail banking.
Sometimes the segments were dominated by one faculty or another. There were alsodifferences between the segments in the distribution of the variable sex. Such back-ground factors offer further depth in the analysis of the obtained results. Although somegeneral conclusions were drawn, suvh as females being more interested in the mutualfunds/pension insurance products than men, whereas men were more into brokerage ser-vices, these differences are not proved to be statistically significant. In all the groups therewere always both female and male students, as well as their coming from all the facul-ties. The results concerning the background variables should, therefore, be taken more ashypotheses and studied more carefully in the subsequent projects.
7. Conclusions
The survey results indicated that the customer attraction has not been very successfulthrough the Swedish retail banks’ price bundling strategy if measured in absolute terms. Itwas found out that only approximately 20 percent of the students use the student bundles
Attracting Students Through Price Bundling 541
that are offered to them. On the other hand, a closer look at the students’ actual switchingbehaviour between the groups having a student bundle and not having the student bundleshowed a statistically significant difference between the groups. The conclusion is thatstudents who have the student bundle have been more active in bank switching. This is asign of some success of price bundling with respect to customer acquisition.
The low use of price bundles by the students could be caused by a combination of thefollowing reasons:
• not attractive price bundle offers in terms of the bundle contents and the price;• similarity between the banks’ price bundles;• unsatisfactory marketing and selling efforts by the banks combined with lack of
interest among the students.
The bundle contents and price discount. The conjoint analysis showed that the stu-dents’ preferences concerning the retail banking services are heterogeneous and fourdistinctive preference patterns could be identified. This diversity is not captured in thecurrent student bundles offered by the Swedish banks. Firstly, only one price bundle isoffered to the whole market by each of the banks. Secondly, some services that werehighly valued by the students such as mutual funds or brokerage services are not cur-rently offered in the student bundles. On the other hand, promise of a loan is offered byS-E-B and Nordbanken but that attribute was one of the least preferred by the studentsacross the segments. Thirdly, the current price level is seen as a “normal” price whichdoes not attract the students in any particular way.
The “modern banking” group of students used the student bundles most. Their pref-erences concerning the banking services compares best with S-E-B’s price bundle. In the“modern banking” group the share of students banking with S-E-B was highest. Basedon the fact that the students in the modern banking group were the least price sensitive itis concluded that the student bundle that matches the students’ preference pattern of theservices will be the success factor in student bundling. The price discount is of secondaryimportance. This conclusion is additionally supported by the behaviour of the “cheapestbanking” segment whose use of the student bundles is proportionally smaller in spite oftheir profound price sensitiveness.
Similarity between the retail banks’ price bundles. The low use of student bundles isalso likely to be due to the non-uniqueness of the student offers which does not give manyincentives for the students to change banks.
Unsatisfactory marketing and selling effort. The results may also imply that theSwedish retail banks’ marketing and selling efforts may need to be improved. Althoughthe student bundles are similar between the banks, which would not motivate to changebanks, it could be assumed that the students enjoyed the 50 percent price discount offeredin the student bundle at their own bank. This is obviously not the case currently becauseonly around 20 percent of the students use the student bundle. Some problems that thefinancial services consumers face are lack of understanding and lack of interest (Ennewand McKechnie, 1998). These factors could also play a major role of the low possessionof student bundles. The use of conjoint analysis as a survey method showed the impor-tance of a clear bundle offer that shows the benefits in a simple and understandable way
542 M. Mankila
for the students so that the offers can be compared in order to make a decision. At thesame time the participation rate indicated about the lack of interest.
8. Managerial Implications
The results also offer some managerial implications in order to improve the price bundlingstrategy to attract student customers in Sweden. Two principal suggestions are advocated:1) to offer several price bundles to the specific segments or 2) to offer one flexible bundlestructure that allows for individual differences.
1) Several Price Bundles to Different SegmentsThe international debit card was the most preferred service according to the studentsand its inclusion in any student bundle is given. The conjoint results showed severalpossibilities to differentiate the student bundle:
• delivery channel: Internet bank – telephone bank;• saving: mutual funds/pension insurance – brokerage services;• interest rate on the current account: 2.5%–0.15%;• price.
Two of the segments preferred the Internet bank, namely the “plain banking” andthe “modern banking” groups. The remaining two segments, “cheapest banking” and“traditional banking”, preferred the telephone bank. The delivery channel attribute wouldoffer a possibility to make two different price bundles starting from the choice of thepreferred delivery channel.
Savings were preferred by all the segments but the preference varied between themutual funds/pension insurance and the brokerage services. Due to these differences theresults imply that the savings alternative is to be included in the price bundle but thesavings form should be left open. It is also emphasised that the savings alternative wascombined with additional price reductions for the bundle price, which is a likely factorto have affected the popularity to save although both types of savings are also popular ontheir own right. This in turn is an apparent example of how price bundling works in orderto enhance the demand when the price discount is directed to a specific purpose.
The interest rate for the current account is another possibility to differentiate the stu-dent bundles. However, the interest rate (+giro payment service + ATM-card) was onlyclearly significant for the “traditional banking” segment and moderately significant forthe “cheapest banking” segment. A difference in the interest rate could, nevertheless,motivate a dissimilarity in the total price for the bundle.
Concerning the price attribute it was observed that also the price sensitiveness variedbetween the students. If the price is used as a differentiator it is necessary that the bundlecontents are adequately dissimilar to motivate the price differences. Only about 30 percentof the students revealed a high price sensitiveness throughout the price levels presentedin the study. Therefore, further price reductions do not seem to offer great possibilitiesof attracting students apart from the price sensitive group. On the other hand it would
Attracting Students Through Price Bundling 543
be difficult to set a price higher than SEK 300 per year although the “modern banking”segment gave some implications about its acceptability.
2) A Flexible Price Bundle ModelAn alternative to offer two (or more) different price bundles for the student market couldbe a flexible price bundle model where the students are allowed to pick up the servicesthey desire from a specific student bundle frame that defines the service options availablefor the students. The price would be dependent on the service choice along a prespecifiedformula. This suggestion is based on the fact that the segment results implied that theobtained models could not captureall the differences between the respondents althoughthe results were greatly improved through the segmentation procedure. Therefore, theattributes as were the loan demand or personal banker which throughout the segmentswere the least preferred services on average, might still be highly preferred by some andworth offering to those who value them highly.
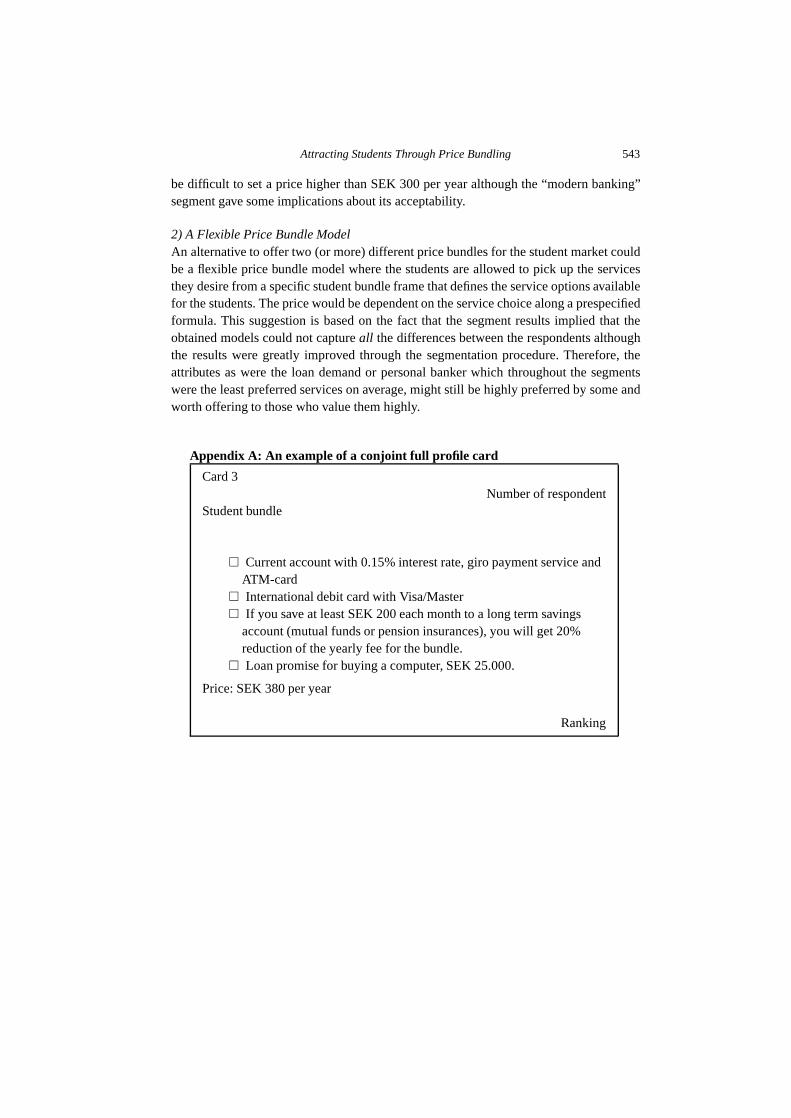
Appendix A: An example of a conjoint full profile card
Card 3Number of respondent
Student bundle
� Current account with 0.15% interest rate, giro payment service andATM-card
� International debit card with Visa/Master� If you save at least SEK 200 each month to a long term savings
account (mutual funds or pension insurances), you will get 20%reduction of the yearly fee for the bundle.
� Loan promise for buying a computer, SEK 25.000.
Price: SEK 380 per year
Ranking
544 M. Mankila
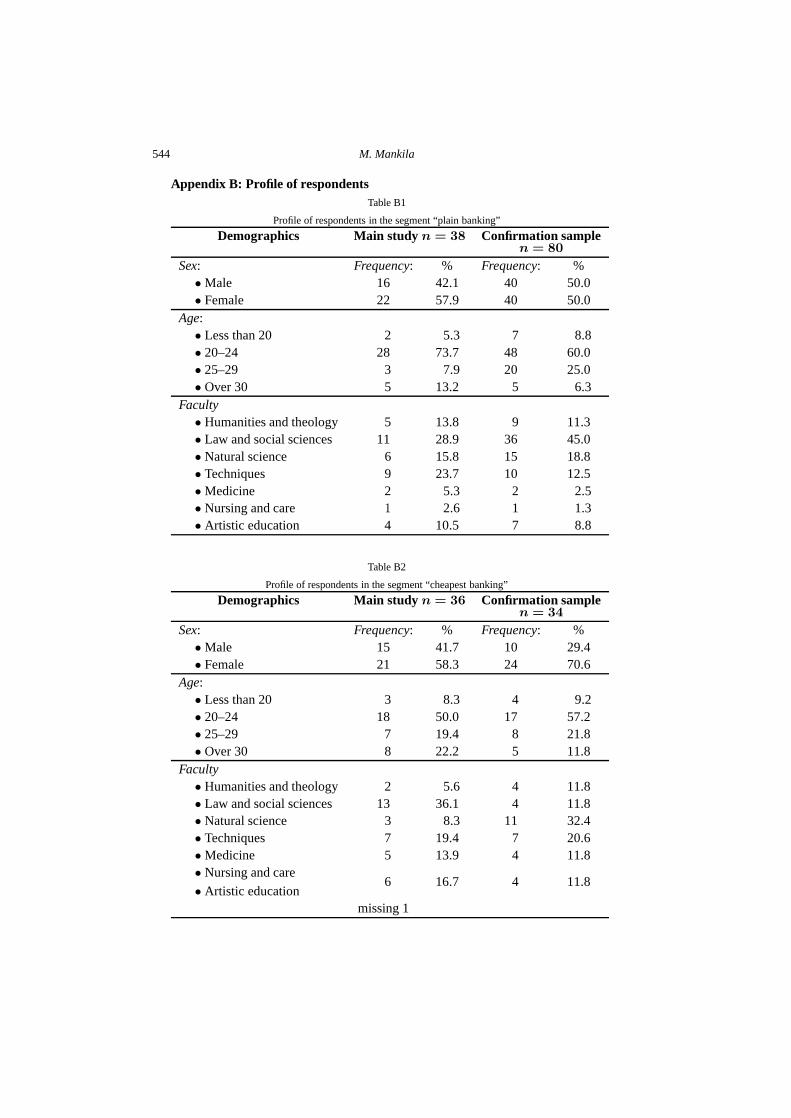
Appendix B: Profile of respondentsTable B1
Profile of respondents in the segment “plain banking”
Demographics Main studyn = 38 Confirmation samplen = 80
Sex: Frequency: % Frequency: %• Male 16 42.1 40 50.0• Female 22 57.9 40 50.0
Age:• Less than 20 2 5.3 7 8.8• 20–24 28 73.7 48 60.0• 25–29 3 7.9 20 25.0• Over 30 5 13.2 5 6.3
Faculty• Humanities and theology 5 13.8 9 11.3• Law and social sciences 11 28.9 36 45.0• Natural science 6 15.8 15 18.8• Techniques 9 23.7 10 12.5• Medicine 2 5.3 2 2.5• Nursing and care 1 2.6 1 1.3• Artistic education 4 10.5 7 8.8
Table B2
Profile of respondents in the segment “cheapest banking”
Demographics Main studyn = 36 Confirmation samplen = 34
Sex: Frequency: % Frequency: %• Male 15 41.7 10 29.4• Female 21 58.3 24 70.6
Age:• Less than 20 3 8.3 4 9.2• 20–24 18 50.0 17 57.2• 25–29 7 19.4 8 21.8• Over 30 8 22.2 5 11.8
Faculty• Humanities and theology 2 5.6 4 11.8• Law and social sciences 13 36.1 4 11.8• Natural science 3 8.3 11 32.4• Techniques 7 19.4 7 20.6• Medicine 5 13.9 4 11.8• Nursing and care
6 16.7 4 11.8• Artistic educationmissing 1

Attracting Students Through Price Bundling 545
Table B3
Profile of respondents in the segment “modern banking”
Demographics Main studyn = 32 Confirmation samplen = 12
Sex: Frequency: % Frequency: %• Male 22 68.8 7 58.3• Female 10 31.3 5 41.7
Age:• Less than 20 2 6.3 2 16.7• 20–24 18 56.3 6 50.0• 25–29 8 25.0 2 16.7• Over 30 4 12.5 2 16.7
Faculty• Humanities and theology 2 6.3 2 16.7• Law and social sciences 14 43.8 7 58.3• Natural science 7 21.9 1 8.3• Techniques 4 12.5 1 8.3• Medicine 3 9.4• Nursing and care
2 6.3 1 8.3• Artistic education
Table B4
Profile of respondents in the segment “traditional banking”
Demographics Main studyn = 17 Confirmation samplen = 9
Sex: Frequency: % Frequency: %• Male 7 41.2 3 33.3• Female 10 58.8 6 66.7
Age:• Less than 20 1 5.9 1 11.1• 20–24 8 47.1 4 44.4• 25–29 5 29.4 2 22.2• Over 30 3 17.6 2 22.2
Faculty• Humanities and theology 5 29.4 5 55.6• Law and social sciences 1 5.9 3 33.3• Natural science 3 17.6• Techniques 4 23.5 1 11.1• Medicine• Nursing and care
4 23.5• Artistic education
546 M. Mankila
References
Adams, W. J., J.L. Yellen (1976). Commodity bundling and the burden of monopoly.Quarterly Journal ofEconomics, 90, 475–495.
Fry, J.N., D.C. Shaw, C. Haehling von Lanzenauer, C.R. Dipchand (1986). Customer loyalty to banks: a longi-tudinal study.Journal of Business, 12, 517–525.
Ennew, C., S. McKechnie (1998). The financial services consumer. In M. Gabbot, G. Hogg (Eds.),Consumersand Services, pp. 185–207.
Green, P.E., V. Srinivasan (1978). Conjoint analysis in consumer research: issues and outlook.Journal of Con-sumer Research, 5, 103–123.
Green, P.E., A.M. Krieger (1991). Segmenting markets with conjoint analysis.Journal of Marketing, 55, 20–31.Guiltinan, J. (1987). The price bundling of services.Journal of Marketing, 51, 74–85.Golcate, M., K. Steward, R. Kinsella (1996). Customer defection: a study of the student market in Ireland.
International Journal of Bank Marketing, 14(3), 23–29.Hair, J.F., R.E. Anderson, R.L. Tatham, W.C. Black (1995).Multivariate Data Analysis with Readings. Prentice
Hall.Kara, A., E. Kaynak, O. Kucukemiroglu (1994). Credit card development strategies for the youth market: the
use of conjoint analysis.International Journal of Bank Marketing, 12(6), 30–36.Lewis, B.R., G.H. Bingham (1991). The youth market for financial services.International Journal of Bank
Marketing, 9(2), 3–11.Oppewal, H., M. Vriens (2000). Measuring perceived service quality using intergrated conjoint experiments.
International Journal of Bank Marketing, 18(4), 154–169.Punj, G., D.W. Steward (1983). Cluster analysis in marketing research: a review and suggestions for applica-
tions.Journal of Marketing Research, 27, 418–427.DeSarbo, W.S., M. Wedel, M. Vriens, M. Ramaswamy (1992). Latent class metric conjoint analysis.Marketing
Letters, 3, 273–288.Schmalensee, R. (1984). Pricing of product bundles, Gaussian demand and commodity bundling.Journal of
Business, 57(1), 211–230.Teas, K. R., W.L. Dellva (1985). Conjoint measurement of consumer preferences for multiattribute financial
services.Journal of Bank Research, Summer, 99–112.Wittink, D.R., P. Cattin (1989). Commercial use of conjoint analysis: an update.Journal of Marketing, 53,
91–96.Wittink, D.R., M. Vriens, W. Burhenne (1994). Commercial use of conjoint analysis in Europe: results and
critical reflections.International Journal of Research in Marketing, 11, 41–52.Zinkhan, F. C., G.M. Zinkhan (1991). Using conjoint analysis to design financial services.International Journal
of Bank Marketing, 8(1), 31–34.
M. Mankila is a doctoral candidate at the School of Economics and Commercial Lawin Gothenburg, Sweden. Her dissertation deals with retail bank pricing strategies, mostnotably, strategic price bundling, and how to improve the customer relationship manage-ment through it. Her other work on this subject will be published in a fortcoming issueof European Journal of Operational Resarch (Retaining students through price bundling)and inPerspectivas del Sistema Financiero (Application of price bundling strategies inretail banking in Europe). Her other research interests include consumer behaviour ineCommerce and customer loyalty issues in different areas.
Student ↪u pritraukimas kain ↪u grupavimu. Apibendrinta Švedijosstudent ↪u mažmeninio bankinio aptarnavimo preferencij ↪u studijaMerja MANKILA
Straipsnyje tiriama Švedijos bank↪u patirtis pritraukiant naujus klientus – studentus, pritaikiuskain ↪u grupavim↪a.