attracting the next generation of federal leaders · pdf file... attracting the next...
TRANSCRIPT
Taking the Helm: Attracting the Next Generation of Federal Leaders Copyright 2010 by the Senior Executives Association and Avue Technologies Corporation. All Rights Reserved. The contents may not be extracted, copied, reproduced, or distributed in any form without the written consent of the Senior Executives Association and Avue Technologies Corporation.
0 | P a g e
Taking the Helm Attracting the Next Generation of Federal Leaders
Taking the Helm: Attracting the Next Generation of Federal Leaders Copyright 2010 by the Senior Executives Association and Avue Technologies Corporation. All Rights Reserved. The contents may not be extracted, copied, reproduced, or distributed in any form without the written consent of the Senior Executives Association and Avue Technologies Corporation.
1 | P a g e
Senior Executives Association
SEA is a non-profit, non-partisan professional association that has
served as the voice of the career federal executive corps since
1980. SEA’s mission is to improve the efficiency, effectiveness,
and productivity of the federal government; to advance the
professionalism and advocate the interests of career federal
executives; and to enhance public recognition of their
accomplishments. For additional information about SEA, visit
www.seniorexecs.org.
Senior Executives Association
Professional Development League
The Senior Executives Association Professional Development
League is a non-profit, educational organization that is committed
to advancing the professionalism of career federal executives
through the sponsorship of training, recognition activities, and
research.
Avue Technologies Corporation
Avue – where revolutionary ideas meet up with deep Federal
expertise to support the best leadership, results, and
management practices in human capital. That’s why Avue is the
Operating System of the Insourcing Revolution – the movement to
restore open and effective government services delivered by
dedicated Federal employees. Our “Native Federal” fully-hosted
management platform enables collaboration that results in faster,
more effective, and better informed decisions by Federal
managers and employees, and connects millions of job candidates
directly with each other and the Federal community. Learn more
about Avue Technologies at www.avuetech.com.
®
Taking the Helm: Attracting the Next Generation of Federal Leaders Copyright 2010 by the Senior Executives Association and Avue Technologies Corporation. All Rights Reserved. The contents may not be extracted, copied, reproduced, or distributed in any form without the written consent of the Senior Executives Association and Avue Technologies Corporation.
2 | P a g e
Senior Executives Association
Professional Development League
Prepared under the direction of Carol Bonosaro, President
Project Director: K. Scott Derrick, Director of Professional Development
The following individuals made key contributions to this report:
Avue Technologies Corporation
Doris Brown, Director of Affiliate Relations
Monica Fritts, Senior Business Analyst
Shirley Stargel, Business Intelligence Analyst
For additional information about this report, please contact:
Deej Lundgren
Director of Communications
Senior Executives Association
202-927-7000
Email: [email protected]
Taking the Helm: Attracting the Next Generation of Federal Leaders Copyright 2010 by the Senior Executives Association and Avue Technologies Corporation. All Rights Reserved. The contents may not be extracted, copied, reproduced, or distributed in any form without the written consent of the Senior Executives Association and Avue Technologies Corporation.
3 | P a g e
Taking the Helm
Attracting the Next Generation
of Federal Leaders
Contents
Executive Summary ......................................................................................................... 4
Introduction .................................................................................................................... 9
Key Findings..................................................................................................................... 12
Recommendations ........................................................................................................... 44
Appendix I – Methodology ............................................................................................... 50
Appendix II – Result Tables for Government-wide Survey of GS-14/15 Employees ........... 54
Appendix III – Result Tables for Chief Human Capital Officers Council Questionnaire ...... 64
Appendix IV – Demographic Cross-Analysis Tables for Survey of GS-14/15 Employees .... 70
Taking the Helm: Attracting the Next Generation of Federal Leaders Copyright 2010 by the Senior Executives Association and Avue Technologies Corporation. All Rights Reserved. The contents may not be extracted, copied, reproduced, or distributed in any form without the written consent of the Senior Executives Association and Avue Technologies Corporation.
4 | P a g e
“SES positions hold no allure for me.
The negatives (political implications,
lack of clear authority to take action,
dealing with Congress) far outweigh
any positive benefits of serving in the
SES.”
-GS-14 Survey Respondent
“Although the opportunity to contribute
more fully to the mission of my agency as
an SES member is very attractive, the
total lack of work/life balance will keep
me from applying for any SES candidate
development program while I have
children at home.”
-GS-14 Survey Respondent
he United States is facing daunting
challenges spanning almost every facet
of the federal establishment. To address
these serious challenges, the nation needs a
capable and determined group of senior civil
servants to help implement critical initiatives.
Over 30 years ago, Congress created the Senior
Executive Service (SES) to be a new corps of
career executives charged with managing the
federal government. Almost 20 years ago,
Congress created two additional senior-level
career positions, which are collectively often
referred to as Senior Professional positions:
Scientific/Professional (ST) positions, which involve the performance of high-level research and development in the physical, biological, medical, or
engineering sciences, or a closely-related field, and
Senior Level (SL) positions, which do not involve significant supervisory duties nor scientific research yet are still high level, such as a high-level special assistant or a senior attorney in a highly-specialized field.
These SES and Senior Professional positions are
all classified above the General Schedule (GS)-
15 level in the federal government, and
individuals in these senior-level positions are
considered top career professionals in the civil
service.
Given the myriad of jobs and the substantial
responsibilities exercised by the SES and Senior
Professionals, these approximately 8,000 men
and women are critical to a high-performing
T
Executive Summary
“From my vantage point, the slight
increase in pay is more than off-set by
all of the SES ‘detractors,’ many of
which were asked about in this survey.”
-GS-15 Survey Respondent
“I've learned more about ST/SL
positions from this survey than I've ever
heard from my organization's
management.”
-GS-15 Survey Respondent
Taking the Helm: Attracting the Next Generation of Federal Leaders Copyright 2010 by the Senior Executives Association and Avue Technologies Corporation. All Rights Reserved. The contents may not be extracted, copied, reproduced, or distributed in any form without the written consent of the Senior Executives Association and Avue Technologies Corporation.
5 | P a g e
government. These senior-level career officials
are key to implementing the administration’s
management agenda and are an essential link
between the administration and agency
activities such as rulemaking, implementation,
enforcement, and operations. To address the
numerous complex challenges that the nation
faces, the federal government must have a
highly-qualified cadre of current and
prospective future leaders for these senior
positions. About 90 percent of federal
executives will be eligible for retirement over
the next 10 years, and the percentage of federal
executives currently eligible for retirement has
reached 50 percent of the corps in some
agencies. Unresolved challenges in attracting
the best and the brightest to these positions
would leave a serious leadership vacuum at the
top of the civil service.
In recent years, the Senior Executives
Association (SEA) has heard numerous concerns
about a declining interest by GS-14 and GS-15
employees in serving in senior career positions
in the federal government. In 2006, SEA
conducted a survey of the SES and issued an
associated report with regard to the new pay
and performance management system. The
report, “Lost in Translation,” revealed that 47
percent of all executives responding reported
that the new SES pay and performance
management system had had either a negative
effect or a very negative effect on the interest
of their GS-14/15 employees in becoming a
member of the SES. In 2008, the U.S. Office of
Personnel Management’s (OPM) survey of SES
members reported that less than 50 percent of
executives believed SES pay and benefits were
helpful in attracting and retaining high-quality
senior executives. Evidence continues to build
to support this view. Thus, the government
risks not attracting the best and the brightest to
the senior-level positions that will be vacated.
To fully understand the significance of this
issue, SEA determined that more specific data,
not simply anecdotes, were needed from GS-14
and GS-15 employees from across the federal
government.
This is why SEA developed and conducted, in
partnership with Avue Technologies
Corporation, an online survey to collect
information on the views and interests of
federal employees in GS-14 and GS-15 positions
(and their equivalents) related to applying for
and serving in senior career positions in the
federal government. In July 2009, SEA issued an
open call for GS-14/15 employees and their
equivalents across the federal government to
respond to the online survey. Survey questions
solicited information on respondents’ views and
interests concerning career SES and Senior
Professional positions as well as their job
satisfaction, personal work and professional
development experiences, future employment
plans, and demographic information. SEA
received a total of 11,798 responses to the
survey, including over 3,700 narrative
comments.
Review of the survey data showed that the
demographic profile of the GS-14/15
respondents was similar to the overall
government-wide workforce of GS-14s and GS-
15s, though some federal agencies were better
represented than others among the survey
respondents. Although the results of the survey
Executive Summary
Taking the Helm: Attracting the Next Generation of Federal Leaders Copyright 2010 by the Senior Executives Association and Avue Technologies Corporation. All Rights Reserved. The contents may not be extracted, copied, reproduced, or distributed in any form without the written consent of the Senior Executives Association and Avue Technologies Corporation.
6 | P a g e
are not representative of all GS-14 and GS-15
employees and their equivalents in the federal
government because the survey was not a
random sample, the survey results are
nonetheless instructive for identifying
challenges and possible solutions for ensuring
that the federal government is able to maintain
an outstanding cadre of federal career
executives.
In addition to the government-wide survey of
GS-14 and 15 employees and their equivalents,
SEA administered a related questionnaire to
members of the federal Chief Human Capital
Officers (CHCO) Council, which advises and
coordinates activities of federal agencies on
human resources matters. The questionnaire
was opened in July 2009 for CHCO Council
members to respond, and the questionnaire
remained open through the fall to allow
sufficient time for the CHCOs to respond. The
questionnaire asked members of the CHCO
Council for their views about the quality of
applicants for career SES and Senior
Professional positions, potential challenges in
hiring and retaining employees for such
positions as well as various attractors and
detractors to serving in these positions. SEA
received responses from 17 of the 24 Council
members who were asked to respond to the
questionnaire.
On the basis of a review and analysis of the GS-
14/15 survey results, SEA identified the
following key findings:
Finding 1: The most significant attractors for considering an SES or Senior Professional position are the ability to contribute more to
the mission of the agency, greater opportunity for creativity and innovation, the honor of serving at the highest level, and increased responsibility and authority.
Finding 2: The most significant detractors for considering an SES or Senior Professional position are the potential negative impact on the balance of work and family responsibilities, the possibility of being reassigned or transferred geographically, and the complexity of the application process.
Finding 3: Although pay was not a top attractor or detractor among survey responses, numerous narrative comments by survey respondents expressed that the difference in pay between a GS-14/15 position and an SES or Senior Professional position is often not commensurate with the increased workload, responsibility, and risk.
Finding 4: A majority of the survey respondents said they are interested in becoming a member of the SES or a Senior Professional and have confidence in their ability to serve in one of these positions. However, a much smaller percentage of respondents said they received supervisor encouragement to follow one of these career paths.
Finding 5: Despite respondents’ stated interest in serving in SES and Senior Professional positions, less than 50 percent of respondents said that the attractors to serving in these positions outweigh the detractors to serving in the positions.
Finding 6: A large number of respondents (83%) are generally satisfied with their current job, but a much smaller percentage of respondents (39%) are satisfied with the opportunity to get a better job in their organization.
Finding 7: A large number of respondents have not attended an executive education
Executive Summary
Taking the Helm: Attracting the Next Generation of Federal Leaders Copyright 2010 by the Senior Executives Association and Avue Technologies Corporation. All Rights Reserved. The contents may not be extracted, copied, reproduced, or distributed in any form without the written consent of the Senior Executives Association and Avue Technologies Corporation.
7 | P a g e
or SES candidate development program. Narrative comments in the survey responses indicate this is mainly due to budget constraints, lack of agency support, workload demands, mobility issues, poor quality of programs, or a combination of these factors.
Finding 8: Many respondents said they lack clear and accessible information about SES and Senior Professional positions, including the differences between these positions and those under the General Schedule, about developmental opportunities for these positions, and about ways to position oneself to apply for and succeed in these positions.
Finding 9: Some differences were found in responses based on self-reported gender, ethnicity, and race and national origin of survey respondents.
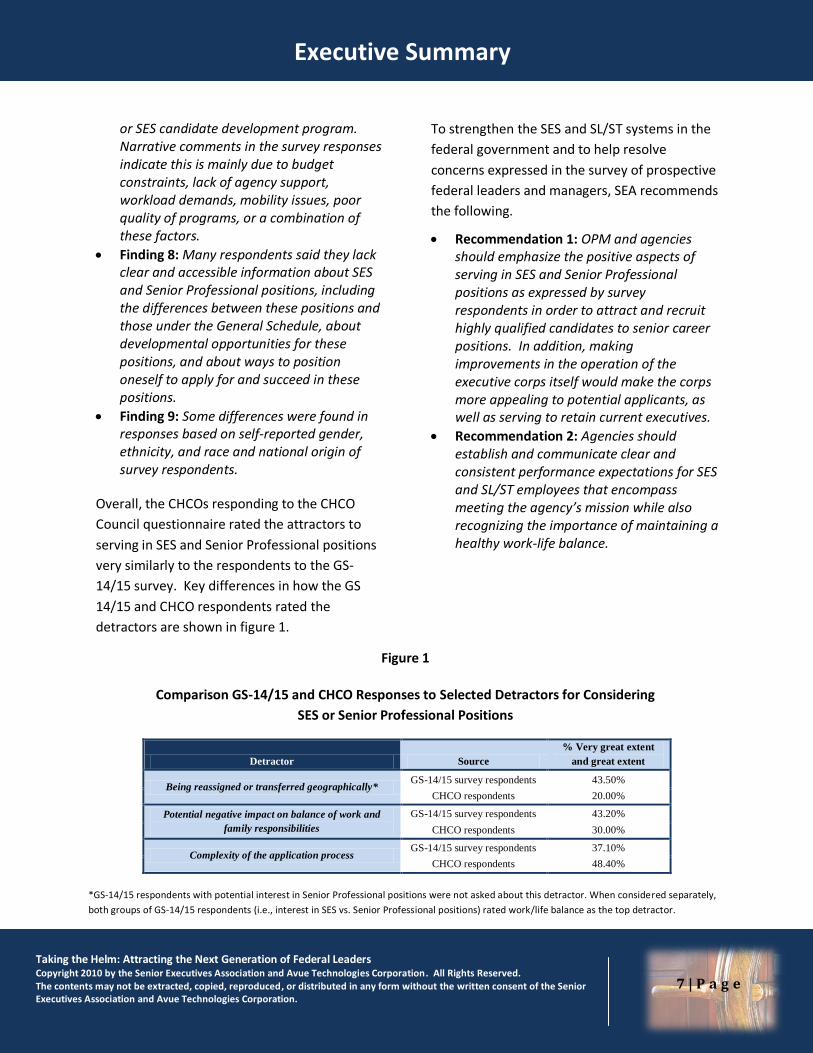
Overall, the CHCOs responding to the CHCO
Council questionnaire rated the attractors to
serving in SES and Senior Professional positions
very similarly to the respondents to the GS-
14/15 survey. Key differences in how the GS
14/15 and CHCO respondents rated the
detractors are shown in figure 1.
To strengthen the SES and SL/ST systems in the
federal government and to help resolve
concerns expressed in the survey of prospective
federal leaders and managers, SEA recommends
the following.
Recommendation 1: OPM and agencies should emphasize the positive aspects of serving in SES and Senior Professional positions as expressed by survey respondents in order to attract and recruit highly qualified candidates to senior career positions. In addition, making improvements in the operation of the executive corps itself would make the corps more appealing to potential applicants, as well as serving to retain current executives.
Recommendation 2: Agencies should establish and communicate clear and consistent performance expectations for SES and SL/ST employees that encompass meeting the agency’s mission while also recognizing the importance of maintaining a healthy work-life balance.
Detractor Source
% Very great extent
and great extent
Being reassigned or transferred geographically* GS-14/15 survey respondents 43.50%
CHCO respondents 20.00%
Potential negative impact on balance of work and
family responsibilities
GS-14/15 survey respondents 43.20%
CHCO respondents 30.00%
Complexity of the application process GS-14/15 survey respondents 37.10%
CHCO respondents 48.40%
Executive Summary
Figure 1
Comparison GS-14/15 and CHCO Responses to Selected Detractors for Considering
SES or Senior Professional Positions
*GS-14/15 respondents with potential interest in Senior Professional positions were not asked about this detractor. When considered separately,
both groups of GS-14/15 respondents (i.e., interest in SES vs. Senior Professional positions) rated work/life balance as the top detractor.
Taking the Helm: Attracting the Next Generation of Federal Leaders Copyright 2010 by the Senior Executives Association and Avue Technologies Corporation. All Rights Reserved. The contents may not be extracted, copied, reproduced, or distributed in any form without the written consent of the Senior Executives Association and Avue Technologies Corporation.
8 | P a g e
Recommendation 3: OPM should annually report data on the number of involuntary geographic transfers under the SES mobility provision, which could demonstrate to potential candidates that such a reassignment may be less likely to occur than they might assume.
Recommendation 4: OPM and agencies should simplify the job application process for SES and SL/ST positions while maintaining important safeguards against politicization and acceptance of unqualified candidates, including the continued use of OPM Qualifications Review Boards (QRBs) for SES positions.
Recommendation 5: OPM and agencies should improve the selection process for SES positions to ensure that SES members have not only the technical skills to succeed in the job but also the interpersonal and executive skills necessary to communicate and lead people effectively.
Recommendation 6: OPM and agencies should develop additional mechanisms for interested and qualified GS-14/15 employees to obtain valuable developmental experiences, including within their current geographic areas rather than requiring these individuals to relocate for extended periods.
Recommendation 7: Congress, OPM, and agencies should make SES and Senior Professional positions more attractive to potential candidates by increasing the incentives for serving in these positions. Incentives should include: an assured annual increase for those
rated fully successful or better; inclusion of performance awards and
retention and recruitment allowances in retirement annuity calculations; and
an assured increase of at least 5 percent in salary for new career executives and senior-level officials.
Recommendation 8: Congress should de-link its pay from SES and Senior Professional pay to help eliminate the growing problem that permits some subordinates to earn more than Senior Executives.
Recommendation 9: OPM and agencies should increase their efforts to provide additional information to federal employees about SES and Senior Professional positions, including the differences between these positions and those under the General Schedule, developmental opportunities for these positions, and ways to position oneself to apply for and succeed in these positions.
Recommendation 10: OPM and agencies need to coordinate and strengthen actions to support diversity in the SES corps and other senior-level positions while upholding merit systems principles.
To help solve the many difficulties that our
nation now faces, it is imperative that the
federal government attract motivated and
capable individuals to SES and Senior
Professional positions. Addressing the issues
identified in this report will go a long way
toward building strong SES and SL/ST systems
that are attractive to the next generation of
federal leaders.
Executive Summary
Taking the Helm: Attracting the Next Generation of Federal Leaders Copyright 2010 by the Senior Executives Association and Avue Technologies Corporation. All Rights Reserved. The contents may not be extracted, copied, reproduced, or distributed in any form without the written consent of the Senior Executives Association and Avue Technologies Corporation.
9 | P a g e
Introduction
he United States is facing numerous
daunting challenges spanning virtually
every facet of the federal establishment.
These serious challenges include defense,
health care, the economy, the environment,
homeland security, the nation’s infrastructure,
energy, the long-term sustainability of our
social safety net programs, and the federal
debt. To address these serious challenges, the
Administration, Congress, and the American
people need a capable and determined group of
senior civil servants to help lead the way toward
the successful implementation of critical
initiatives.
The Senior Executive Service (SES) was
established as part of the Civil Service Reform
Act of 1978 and became effective on July 13,
1979. Prior to this reform legislation, senior
executives in the federal government were
classified at grades 16, 17 and 18 under the
General Schedule (GS) which were often
referred to as “supergrade” positions. Congress
created the SES to be a new corps of executives
selected for their leadership qualifications and
charged with managing the federal
government. The stated purpose of the SES was
to "ensure that the executive management of
the Government of the United States is
responsive to the needs, policies, and goals of
the nation and otherwise is of the highest
quality." Members of the SES serve in the key
positions just below the top Presidential
appointees and act as a link between these
appointees and the remainder of the federal
workforce, helping to ensure continuity across
administrations. Currently, there are about
7,000 career SES employees in the federal
government.
With passage of the Federal Employees Pay
Comparability Act in 1990, Congress created
two additional senior-level positions, which are
collectively often referred to as Senior
Professional positions and are considered top
career professional positions in the federal
government. Both Scientific/Professional (ST)
positions and Senior Level (SL) positions are
classifiable above the GS-15 level yet do not
meet the SES criteria for executive duties and
functions. ST positions involve the performance
of high-level research and development in the
physical, biological, medical, or engineering
sciences, or a closely-related field. SL positions
are senior-level career positions that do not
involve significant supervisory duties nor
scientific research, such as a high-level special
assistant or a senior attorney in a highly-
specialized field. Currently, there are about 900
Senior Professionals in the federal government.
Given the myriad of jobs and the substantial
responsibilities exercised by the SES and Senior
Professionals, these approximately 8,000 men
and women are critical to a high-performing
government and are key to implementing the
administration’s political and management
agenda. These senior career officials are an
absolutely essential link between the
administration and agency activities such as
rulemaking, implementation, enforcement, and
operations. The federal government needs to
have a highly-qualified cadre of current and
prospective future leaders for these senior
positions to address the numerous complex
T
Taking the Helm: Attracting the Next Generation of Federal Leaders Copyright 2010 by the Senior Executives Association and Avue Technologies Corporation. All Rights Reserved. The contents may not be extracted, copied, reproduced, or distributed in any form without the written consent of the Senior Executives Association and Avue Technologies Corporation.
10 | P a g e
challenges that the nation faces. About 90
percent of federal executives will be eligible for
retirement over the next 10 years; in some
agencies, the number of executives currently
eligible to retire has reached 50 percent of the
corps. Unresolved challenges in attracting the
best and the brightest would leave a serious
leadership vacuum at the top of the civil
service.
In recent years, the Senior Executives
Association (SEA) has heard numerous
anecdotal statements and concerns from its
members and others about a declining interest
by experienced and able GS-15 employees in
serving in senior career positions in the federal
government. In 2006, SEA conducted a survey
of the SES with regard to the new pay and
performance management system. SEA’s
report on the survey results, “Lost in
Translation,” revealed that 47 percent of all
executives responding reported that the new
SES pay and performance management system
had either a negative effect or a very negative
effect on the interest of their GS-14/15
employees in becoming members of the SES. In
2008, the Office of Personnel Management
(OPM) – the federal government’s human
resources agency—surveyed SES members and
reported that less than 50 percent of executives
believe SES pay and benefits are helpful in
attracting and retaining high-quality senior
executives. Evidence continues to build to
support this view. Thus, the federal
government risks not attracting the best and
the brightest to senior leadership positions that
will need to be filled. To fully understand the
significance of this issue, SEA determined that
more specific data, not simply anecdotes, were
needed from GS-14 and GS-15 employees from
across the federal government.
Given this situation, SEA, in partnership with
Avue Technologies Corporation (Avue), initiated
an effort of gathering additional information
related to ensuring that the federal government
is able to maintain an outstanding cadre of
career senior leaders. SEA developed and, with
technical assistance from Avue, conducted an
online survey to collect information on the
views and interests of federal employees in GS-
14 and GS-15 positions (and their equivalents)
related to applying for and serving in senior
career positions in the federal government. In
July 2009, SEA issued an open call for GS-14/15
employees and their equivalents throughout
the federal government to respond to the
online survey. Survey questions solicited
information on respondents’ views and
interests concerning career SES and Senior
Professional positions as well as their job
satisfaction, personal work and professional
development experiences, future employment
plans, and demographic information. The GS-
14/15 online survey was opened to respondents
for over 6 weeks beginning in mid-summer
2009. SEA received a total of 11,798 responses
to the survey, including over 3,700 narrative
comments.
Review of the survey data revealed that the
demographic profile of the GS-14/15
respondents was similar to the overall
workforce of GS-14s and GS-15s across the
federal government. Among the survey
respondents, some federal agencies were
better represented than others. Because the
Taking the Helm: Attracting the Next Generation of Federal Leaders Copyright 2010 by the Senior Executives Association and Avue Technologies Corporation. All Rights Reserved. The contents may not be extracted, copied, reproduced, or distributed in any form without the written consent of the Senior Executives Association and Avue Technologies Corporation.
11 | P a g e
survey was not a random sample, the results of
the survey may not be representative of all GS-
14 and GS-15 employees and their equivalents.
Nonetheless, the survey results are instructive
for identifying challenges and possible solutions
for ensuring that the federal government is able
to maintain an outstanding cadre of federal
career executives. (See appendix I for
additional information on the methodology for
the GS-14/15 survey.)
In addition to the government-wide survey of
GS-14 and 15 employees and their equivalents,
SEA surveyed members of the federal Chief
Human Capital Officers (CHCO) Council on
similar issues associated with attracting, hiring,
and retaining individuals for career SES and
Senior Professional positions. The CHCO
Council, which was established by the Chief
Human Capital Officers Act of 2002, advises and
coordinates the activities of federal agencies on
such matters as the modernization of human
resources systems, improved quality of human
resources information, and legislation affecting
human resources operations and organizations.
Specifically, SEA asked members of the CHCO
Council for their views about the quality of
applicants for career SES and Senior
Professional positions, potential challenges in
hiring and retaining employees for such
positions, as well as various attractors and
detractors to serving in these positions. The
questionnaire was opened in July 2009 for
CHCO Council members to respond, and the
questionnaire remained open through the fall
to allow sufficient time for the CHCOs to
respond. Seventeen of the 24 CHCO Council
members responded to the SEA questionnaire.
(See appendix I for additional information on
the methodology for the CHCO Council
questionnaire.)
The report that follows provides a summary of
the results of the GS-14/15 survey and the
CHCO Council questionnaire as well as
recommendations for how some of the
identified concerns can be resolved to create a
better system for senior career positions in the
federal government.
Taking the Helm: Attracting the Next Generation of Federal Leaders Copyright 2010 by the Senior Executives Association and Avue Technologies Corporation. All Rights Reserved. The contents may not be extracted, copied, reproduced, or distributed in any form without the written consent of the Senior Executives Association and Avue Technologies Corporation.
12 | P a g e
Key Findings
On the basis of our review and analysis of the
responses to the government-wide survey of
GS-14/15s and their equivalents in the federal
government, we have identified nine key
findings related to important issues surrounding
career SES and Senior Professional positions.
This section of the report shows data relevant
to each finding. For each finding, we also
include results from our questionnaire of CHCO
Council members, where relevant. In addition,
we include selected examples of narrative
comments we received from respondents to the
GS-14/15 survey. (For the survey results of
each question of the GS-14/15 survey and the
CHCO Council questionnaire, see appendices II
and III.)
Finding 1
The most significant attractors for considering
an SES or Senior Professional position are the
ability to contribute more to the mission of the
agency, greater opportunity for creativity and
innovation, the honor of serving at the highest
level, and increased responsibility and
authority.
Most jobs have positive factors that draw
people to consider serving in the position; these
positive factors are referred to as “attractors” in
this report. In the survey of GS-14/15
employees, respondents were asked directly
about the following 11 attractors to serving in
SES and/or Senior Professional positions:
Ability to contribute more to the mission of my agency
Increased responsibility and authority
Greater opportunity for creativity and innovation
The ability to interact at higher levels (e.g., with both political appointees and career executives)
The honor of serving at the highest career level
Increased pay
Ability to receive Presidential Rank Awards
Ability to receive other performance awards
Annual leave carryover: Up to 720 hours of annual leave can be carried over from year to year.
Sabbaticals: Up to 11 months for study or uncompensated work experience. (Not applicable to Senior Professional positions)
Last move home: Entitled to moving expenses upon retirement under certain circumstances if reassigned or transferred geographically. (Not applicable to Senior Professional positions)
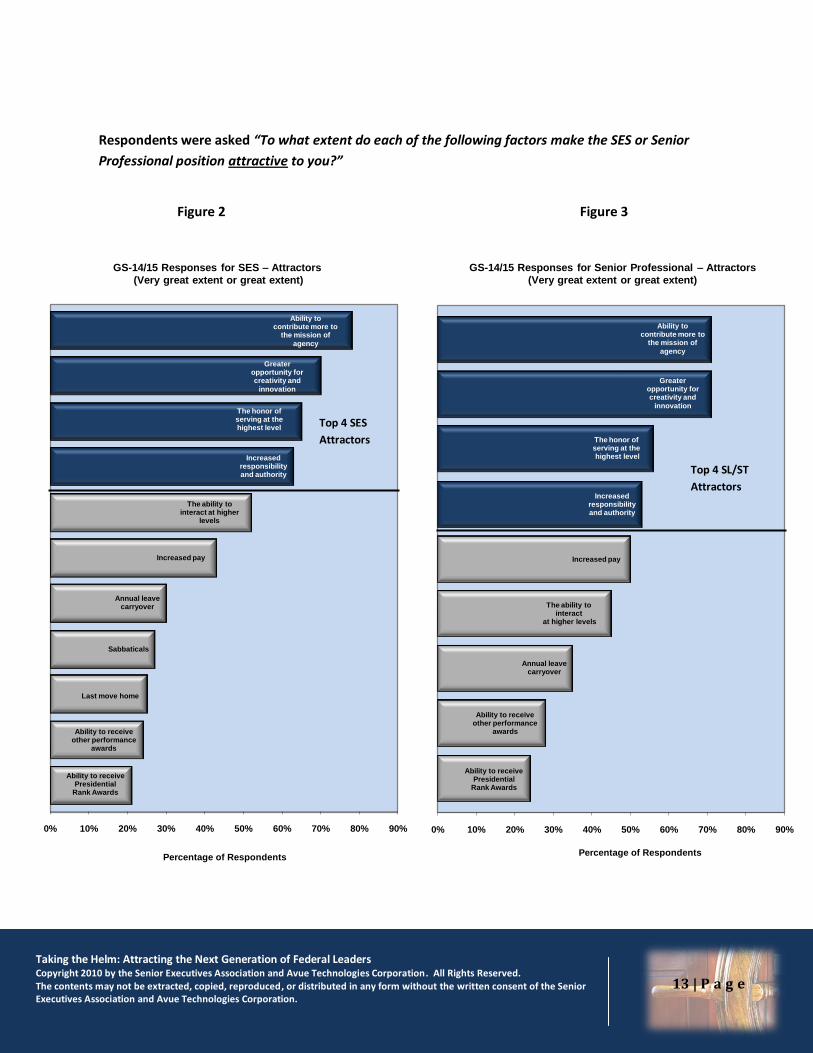
As shown in figures 2 and 3, survey respondents
viewed the top attractors (i.e., highest positive
4 factors) to serving in SES and Senior
Professional positions as the ability to
contribute more to the mission of the agency,
greater opportunity for creativity and
innovation, the honor of serving at the highest
level, and increased responsibility and
authority. These positive factors highlight the
importance of growth, responsibility, and
achievement in attracting individuals to these
senior federal positions. Our review of the
narrative comments made by respondents to
the survey did not identify any additional key
attractors that were unrelated to the 11 factors
we directly addressed in the survey.
Taking the Helm: Attracting the Next Generation of Federal Leaders Copyright 2010 by the Senior Executives Association and Avue Technologies Corporation. All Rights Reserved. The contents may not be extracted, copied, reproduced, or distributed in any form without the written consent of the Senior Executives Association and Avue Technologies Corporation.
13 | P a g e
Respondents were asked “To what extent do each of the following factors make the SES or Senior
Professional position attractive to you?”
Figure 2 Figure 3
Ability to receive Presidential
Rank Awards
Ability to receive other performance
awards
Last move home
Sabbaticals
Annual leave carryover
Increased pay
The ability to interact at higher
levels
Increased responsibility and authority
The honor of serving at the highest level
Greater opportunity for creativity and
innovation
Ability to contribute more to
the mission of agency
0% 10% 20% 30% 40% 50% 60% 70% 80% 90%
Percentage of Respondents
GS-14/15 Responses for SES – Attractors
(Very great extent or great extent)
Top 4 SES
Attractors
Ability to receive Presidential
Rank Awards
Ability to receive other performance
awards
Annual leave carryover
The ability to interact
at higher levels
Increased pay
Increased responsibilityand authority
The honor of serving at thehighest level
Greater opportunity for creativity and
innovation
Ability to contribute more to
the mission of
agency
0% 10% 20% 30% 40% 50% 60% 70% 80% 90%
Percentage of Respondents
GS-14/15 Responses for Senior Professional – Attractors
(Very great extent or great extent)
Top 4 SL/ST
Attractors
Taking the Helm: Attracting the Next Generation of Federal Leaders Copyright 2010 by the Senior Executives Association and Avue Technologies Corporation. All Rights Reserved. The contents may not be extracted, copied, reproduced, or distributed in any form without the written consent of the Senior Executives Association and Avue Technologies Corporation.
14 | P a g e
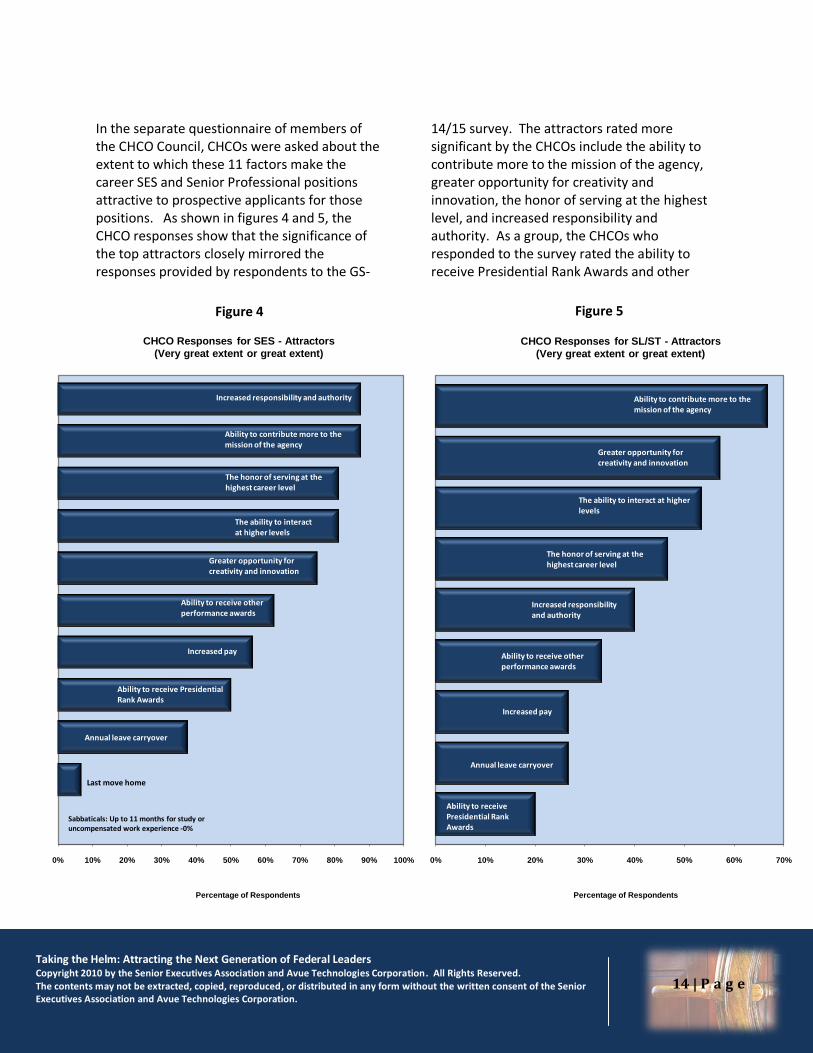
In the separate questionnaire of members of the CHCO Council, CHCOs were asked about the extent to which these 11 factors make the career SES and Senior Professional positions attractive to prospective applicants for those positions. As shown in figures 4 and 5, the CHCO responses show that the significance of the top attractors closely mirrored the responses provided by respondents to the GS-
14/15 survey. The attractors rated more significant by the CHCOs include the ability to contribute more to the mission of the agency, greater opportunity for creativity and innovation, the honor of serving at the highest level, and increased responsibility and authority. As a group, the CHCOs who responded to the survey rated the ability to receive Presidential Rank Awards and other
0% 10% 20% 30% 40% 50% 60% 70% 80% 90% 100%
Percentage of Respondents
CHCO Responses for SES - Attractors
(Very great extent or great extent)
Increased responsibility and authority
Ability to contribute more to the mission of the agency
The honor of serving at the highest career level
The ability to interact at higher levels
Greater opportunity for creativity and innovation
Ability to receive other performance awards
Increased pay
Ability to receive Presidential Rank Awards
Annual leave carryover
Last move home
Sabbaticals: Up to 11 months for study or uncompensated work experience -0%
0% 10% 20% 30% 40% 50% 60% 70%
Percentage of Respondents
CHCO Responses for SL/ST - Attractors
(Very great extent or great extent)
Ability to contribute more to the mission of the agency
Greater opportunity for creativity and innovation
The ability to interact at higher levels
The honor of serving at the highest career level
Increased responsibility and authority
Ability to receive other performance awards
Increased pay
Increased pay
Annual leave carryover
Ability to receivePresidential Rank Awards
Figure 5
Figure 4
Taking the Helm: Attracting the Next Generation of Federal Leaders Copyright 2010 by the Senior Executives Association and Avue Technologies Corporation. All Rights Reserved. The contents may not be extracted, copied, reproduced, or distributed in any form without the written consent of the Senior Executives Association and Avue Technologies Corporation.
15 | P a g e
performance awards as more significant attractors than sabbaticals and last move home. Conversely, the respondents to the GS-14/15 survey rated the ability to receive awards as the least significant of the 11 attractors.
The following are some selected comments provided by respondents to the GS-14/15 survey that address issues related to the attractors for considering SES or Senior Professional positions:
• “To me, selection to the ranks of SES is the pinnacle of public service, where you have a real opportunity to influence policy and programs.”
• “I believe that one of the biggest incentives for
SES service is the ability to impact agency
operations at the policy level. Working at the
supervisory level results in management of
programmatic aspects of the agency operations.
I would like to be able to make an impact on the
policy decisions that affect public health and
safety.”
• “I do think the responsibility, opportunities, etc
associated with being an SES are fantastic,
especially the opportunity to finally be far
enough up in the food chain to effect change,
develop your people, and make a difference.”
• “At this stage in my professional career and
personal development, the SES series would
provide the opportunity to serve in a capacity
where my strong leadership skills and influence
would create a positive change for the
department. I am committed to the goals and
mission of [my agency] especially at this time of
change and innovative leadership.”
• “It is an elite corps of managers who serve
selflessly for the good of the country in the most
demanding assignments. I would be honored
and proud to be a member.”
• “As a scientist, public health practitioner and
Hispanic woman, I strongly believe that I could
contribute to the mission of our Federal
Government to improve the health of individuals
in the United States and Abroad. I believe in the
mission of the federal government and its
establishment as a leader in many fields, in
particular health. I believe I will bring a set of
traits and tools, professional and personal, that
will be beneficial to any federal organization
that deals with matters of public health.”
• “I am seeking to rise to a position that I will
influence change and improve the process within
the agency. I understand that in our system of
checks and balances, no single person can
control change. But a person can build a
network that will build upon success to influence
the process for improvement.”
• “The opportunity to positively impact my
agency, and the government in general, is very
attractive. An SES or SL position provides the
chance to lead so as to improve the work of and
work environment for employees, and to build
good will towards my agency and the
government in general by the public at large,
both domestic and foreign.”
Taking the Helm: Attracting the Next Generation of Federal Leaders Copyright 2010 by the Senior Executives Association and Avue Technologies Corporation. All Rights Reserved. The contents may not be extracted, copied, reproduced, or distributed in any form without the written consent of the Senior Executives Association and Avue Technologies Corporation.
16 | P a g e
Finding 2
The most significant detractors for considering
an SES or Senior Professional position are the
potential negative impact on the balance of
work and family responsibilities, the possibility
of being reassigned or transferred
geographically, and the complexity of the
application process.
In addition to the positive aspects that make a
job attractive to prospective applicants, many
jobs also have negative factors that dissuade
people from considering the position, which are
referred to as “detractors” in this report. In the
survey of GS-14/15 employees, respondents
were asked directly about the following 11
detractors to serving in SES and/or Senior
Professional positions:
Complexity of the application process
Increased responsibility
Lack of sufficient authority to meet goals
Insufficient financial incentives
Ineffective SES or SL/ST performance management system
Potential negative impact on balance of work and family responsibilities
Increased interaction with political appointees
Being reassigned or transferred geographically (Generally not applicable to Senior Professional positions)
Lack of locality pay
Lack of an assured annual pay adjustment to reflect inflation
Increased job risk/loss of GS job rights (Not applicable to Senior Professional positions)
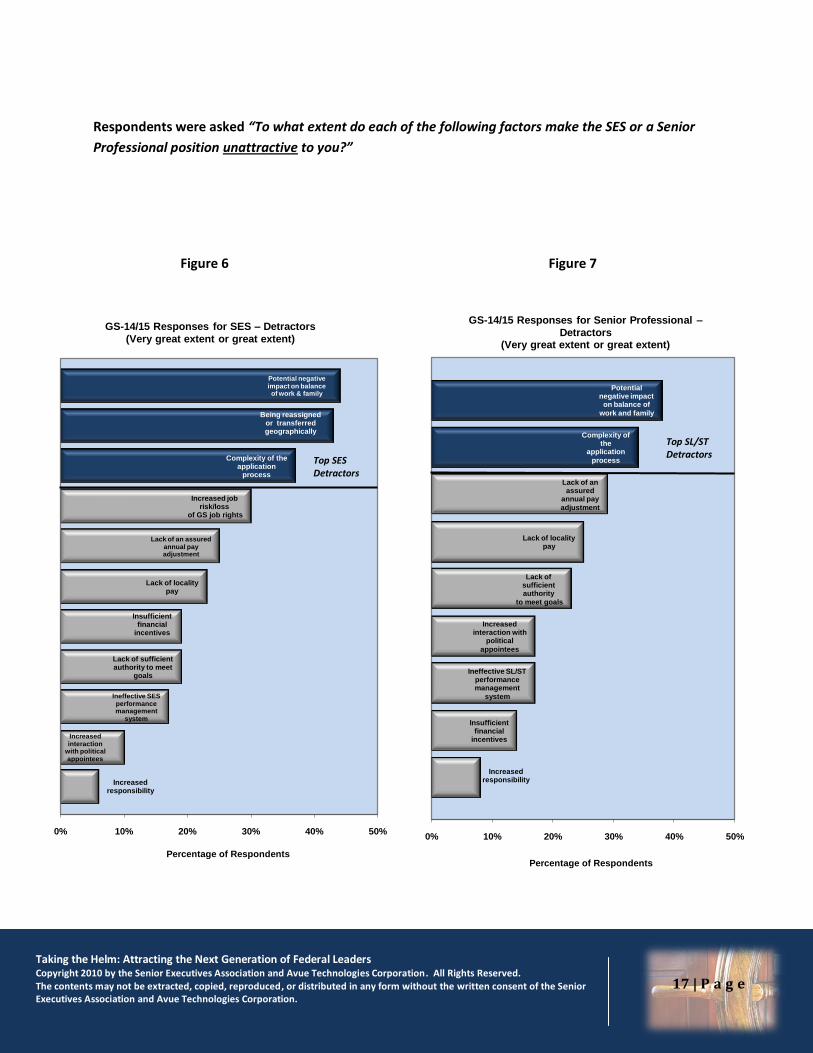
As shown in figures 6 and 7, respondents to the
GS-14/15 survey viewed the top detractor to
serving in SES and Senior Professional positions
as the potential negative impact on balance of
work and family responsibilities. As a whole,
GS-14/15 survey respondents in younger age
ranges were more likely to rate the potential
negative impact on the balance of work and
family responsibilities as unattractive. For
example, for those respondents with potential
interest in SES positions, 50 percent of those
under age 40 rated work/life balance as a
significant detractor vs. 41 percent of those
aged 50 and older. For those respondents with
potential interest in SL/ST positions, 49 percent
of those under age 40 rated the work/life
balance as significant detractor vs. 32 percent
of those aged 50 and older. Being reassigned or
transferred geographically and the complexity
of the application process were also top
detractors (i.e., over 1/3 of respondents rated
these as a detractor to a “great extent” or “very
great extent”).
Taking the Helm: Attracting the Next Generation of Federal Leaders Copyright 2010 by the Senior Executives Association and Avue Technologies Corporation. All Rights Reserved. The contents may not be extracted, copied, reproduced, or distributed in any form without the written consent of the Senior Executives Association and Avue Technologies Corporation.
17 | P a g e
Respondents were asked “To what extent do each of the following factors make the SES or a Senior
Professional position unattractive to you?”
Figure 6 Figure 7
Increasedresponsibility
Increased interaction
with political appointees
Ineffective SES performance management
system
Lack of sufficient authority to meet
goals
Insufficient financial
incentives
Lack of locality pay
Lack of an assured annual pay adjustment
Increased job risk/loss
of GS job rights
Complexity of the application
process
Being reassigned or transferred geographically
Potential negative impact on balance of work & family
0% 10% 20% 30% 40% 50%
Percentage of Respondents
GS-14/15 Responses for SES – Detractors
(Very great extent or great extent)
Top SES Detractors
Increased responsibility
Insufficient financial
incentives
Ineffective SL/ST performance management
system
Increased interaction with
political
appointees
Lack of sufficient authority
to meet goals
Lack of locality pay
Lack of an assured
annual pay
adjustment
Complexity of the
application
process
Potential negative impact
on balance of
work and family
0% 10% 20% 30% 40% 50%
Percentage of Respondents
GS-14/15 Responses for Senior Professional –
Detractors(Very great extent or great extent)
Top SL/ST Detractors
Taking the Helm: Attracting the Next Generation of Federal Leaders Copyright 2010 by the Senior Executives Association and Avue Technologies Corporation. All Rights Reserved. The contents may not be extracted, copied, reproduced, or distributed in any form without the written consent of the Senior Executives Association and Avue Technologies Corporation.
18 | P a g e
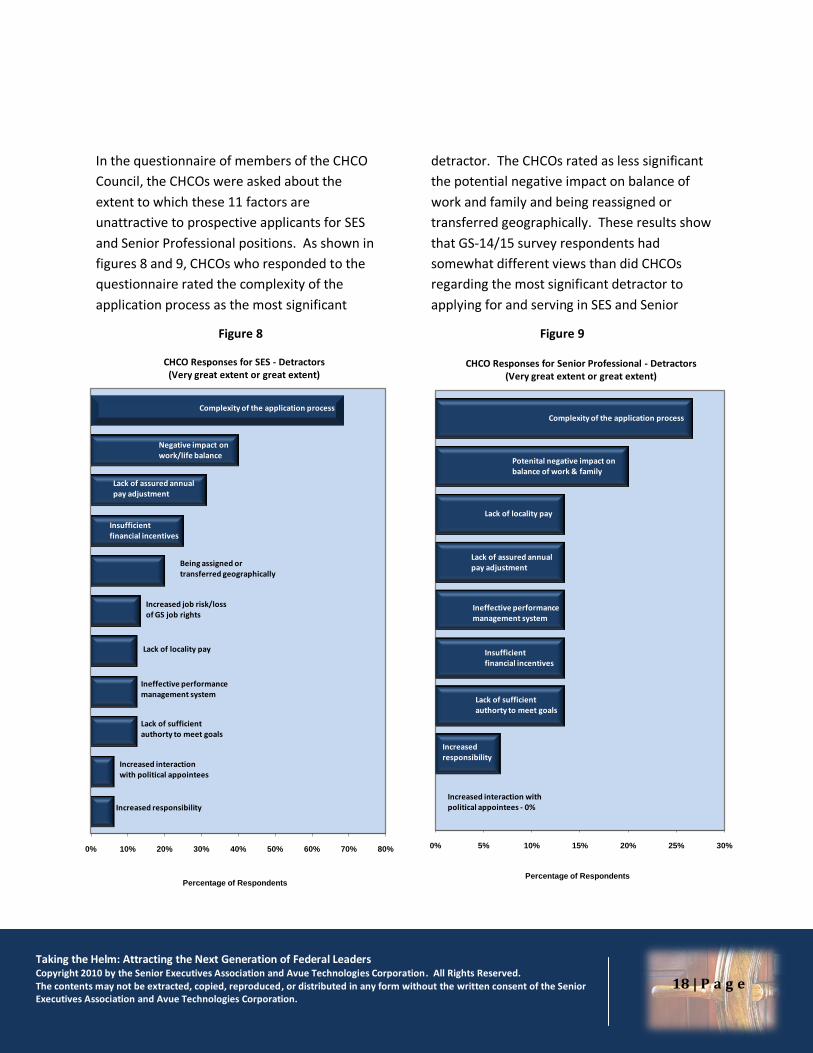
In the questionnaire of members of the CHCO
Council, the CHCOs were asked about the
extent to which these 11 factors are
unattractive to prospective applicants for SES
and Senior Professional positions. As shown in
figures 8 and 9, CHCOs who responded to the
questionnaire rated the complexity of the
application process as the most significant
detractor. The CHCOs rated as less significant
the potential negative impact on balance of
work and family and being reassigned or
transferred geographically. These results show
that GS-14/15 survey respondents had
somewhat different views than did CHCOs
regarding the most significant detractor to
applying for and serving in SES and Senior
Figure 9
0% 10% 20% 30% 40% 50% 60% 70% 80%
Percentage of Respondents
CHCO Responses for SES - Detractors(Very great extent or great extent)
Negative impact on work/life balance
Lack of assured annual pay adjustment
Insufficient financial incentives
Increased job risk/lossof GS job rights
Lack of locality pay
Ineffective performance management system
Lack of sufficient authorty to meet goals
Increased interaction with political appointees
Increased responsibility
Complexity of the application process
Being assigned or transferred geographically
0% 5% 10% 15% 20% 25% 30%
Percentage of Respondents
CHCO Responses for Senior Professional - Detractors(Very great extent or great extent)
Complexity of the application process
Potenital negative impact on balance of work & family
Lack of assured annual pay adjustment
Lack of locality pay
Insufficient financial incentives
Ineffective performance management system
Lack of sufficient authorty to meet goals
Increased responsibility
Increased interaction with political appointees - 0%
Figure 8
Taking the Helm: Attracting the Next Generation of Federal Leaders Copyright 2010 by the Senior Executives Association and Avue Technologies Corporation. All Rights Reserved. The contents may not be extracted, copied, reproduced, or distributed in any form without the written consent of the Senior Executives Association and Avue Technologies Corporation.
19 | P a g e
Professional positions.
The questionnaire to members of the CHCO
Council also included several specific questions
related to the job application process for SES
and Senior Professional positions. Twelve of
the 17 CHCO Council members responding to
the questionnaire said that the amount of time
(speed) for the hiring process of SES and/or
Senior Professional positions was “about right.”
Five of the 17 CHCOs said that the hiring
process at their agency was “too slow” for SES
and/or Senior Professional positions. Three of
these 5 CHCOs said that this slowness was
related to problems in attracting a sufficient
number of qualified applicants, but only to a
limited or moderate extent. None of the CHCO
Council members responding to the
questionnaire said that the hiring process for
SES and/or Senior Professional positions was
“too fast.” Irrespective of their views, 14 of the
17 CHCOs responded that their department or
agency over the past 2 years had SES or Senior
Professional vacancies that remained unfilled
for more than 6 months.
The following are some selected comments
provided by respondents to the GS-14/15
survey that address issues related to detractors
for considering SES or Senior Professional
positions.
Work/Life Balance
• “Expectation to do more with less without a
balance with home/family is the most
unattractive attribute.”
• “If you are not an empty nest family, the SES
could put you into a situation in which you
would have to compromise your responsibilities
as a parent. There isn’t enough money in the
world to motivate me to make that leap.”
• “I have now worked at two different federal
government entities. At both the Senior
Executives that I worked under did not have any
time that they were truly off-duty. At some
point quality of life and control over your life
becomes more important than money and
position.”
• “I have really enjoyed many of my previous jobs,
and am happy in my current job, but I have to
think twice about applying for SES positions due
to the stress of the work/life balance.”
• “The biggest detractor which prevents me from
considering an SES position, which are available
and abundant in my agency, is the lack of a
flexible work schedule. With young children I
enjoy a very flexible work schedule including
limited telework hours. The flexibility of the SES
at my agency is considerably limited and does
not suit my family life.”
• “I believe serving as an SES would be a noble
vocation, but unfortunately an all-consuming
one. Challenges are great in life and certainly
hard work goes with added responsibility, but
there really is not much ‘work/life’ balance as an
SES (no matter how much its importance is
discussed). A typical example - an SES sent me
an e-mail at 11:27 PM. I responded at 7:00 AM
the next day and received a response to my
message by 7:15 AM. Something is wrong with
this leadership model.”
• “I have great respect for the SES Corps and
aspire to be a member of this elite Corps. Our
SES need more worklife balance if they are to
move the Federal government into a higher level
of sophistication. Many of them can't separate
Taking the Helm: Attracting the Next Generation of Federal Leaders Copyright 2010 by the Senior Executives Association and Avue Technologies Corporation. All Rights Reserved. The contents may not be extracted, copied, reproduced, or distributed in any form without the written consent of the Senior Executives Association and Avue Technologies Corporation.
20 | P a g e
work from family and consequently it is affecting
the way they lead their organizations.”
• “I have worked very hard in my government
career to have reached my current position.
While I am not afraid of increased responsibility,
enjoy challenges and LOVE being a manager, I
am not willing at this stage in my personal life to
sacrifice my family and personal life by taking a
job that will certainly require longer hours,
increased travel, etc… That being said - I have
been fortunate in my career to have worked
with a number of extremely professional
executives whose work interactions I have
cherished immensely.”
• “Right now with children at home and a long
commute, one of the biggest detractors for me
that was not specifically mentioned by the
survey is having an alternate work schedule.”
Relocation
• “Being an SES does not appeal to me due to the
forced re-assignment capability that is possible.”
• “Having to move is the #1 reason why I have not
applied or even considered SES. When I
attended [leadership training], nearly 80% of the
participants were not interested in SES for the
same reason. There are so many great leaders
out there who would make fantastic executives,
but won't apply because they don't want to
move their family or move from their family.
The effects of not being around when your
parents are elderly or missing out on so many
family activities cannot be measured in dollars
and cents.”
• “Biggest detractor is the uncertainty of being
moved upon change of administration. I see
many SESers pushed out after elections. That
just does not work for me.”
• “I think the current system of moving SES
executives does not recognize the modern
demographic of two income households, and is a
hold-over from earlier times when you had one
main career in a family. I also think that people
move at great financial disadvantage to
themselves on many occasions, and the
government is unrealistic about federal
employees being willing to do this. I love my job
and I love the mission of my agency, but I have
to also think about what is good for my family.”
• “The lack of assignment control for SES
personnel is undesirable. I have observed in the
past where SESs were forced to move cross-
country to undesirable locations often with the
intent to force the person into retirement.”
• “As long as relocation is a likely requirement for
an SES, I can't commit to it. I experienced a two
year separation from my spouse earlier in my
career and am not willing to do so again. My
decision not to pursue an SES position is based
entirely on making my family my first priority.”
• “Having to sign a mobility agreement while I still
have children in school and a husband who has a
job that is not easily transferrable is really the
only thing stopping me from pursuing an SES
position.”
• “I may apply for the SES program in the next
couple of years. I really don't like the mobility
required to participate in the SES program.”
• “I think the opportunity to serve in a position
would be both exciting & challenging. With that
being said, you essentially sign your life away
and can be dictated for reassignment with little
or no input.”
Taking the Helm: Attracting the Next Generation of Federal Leaders Copyright 2010 by the Senior Executives Association and Avue Technologies Corporation. All Rights Reserved. The contents may not be extracted, copied, reproduced, or distributed in any form without the written consent of the Senior Executives Association and Avue Technologies Corporation.
21 | P a g e
Application Process
• “Possibly more employees would apply for the
SES program if the application process was
simplified. It appears to be difficult finding the
time and energy to apply while daily working at
a high level of responsibility.”
• “The biggest deterrent to applying for an SES
position is the application and selection process.
The application form and the information that is
required to be submitted is daunting, to say the
least. In addition, the selection process is
protracted, and requires concurrence from
several entities, which takes a long time. I am
uncertain whether I am willing to go through the
process because of the difficulties that are
associated with it.”
• “I have heard that the application process is
horrendous and that our agency actually hires
consultants to ‘fix up’ the applications in order
that the applicants be approved for SES
positions.”
• “I am also profoundly frustrated by the
application process, I came into government as a
GS-15 from private industry; in the corporate
world even CEOs, COOs or Senior VPs just submit
a detailed resume. The government SES
application process is cumbersome and
discourages many GS-15s that I've spoken with
from applying.”
• “After having worked in the private sector for 15
years prior to coming to the government, the
application process to SES is ridiculously
complex. My experience prior to coming to the
government would easily qualify me for SES
positions, but financially and given the
questionable work-life balance in SES positions,
it doesn't seem worth the effort to apply or
move into such positions...especially when you
can be geographically moved at someone's
whim.”
• “I applied for two SES positions before and was a
finalist. The higher pay of the last couple years
makes it more attractive for me - the pay
differential really wasn't worth the miserable
writing exercise of applying, and may still not
be.”
• “I believe the biggest problem with applying for
SES positions is the length of time to complete
applications when there are multiple Technical
Qualifications that need to be addressed. The
amount of time that can be spent writing these
is significant and then you may never hear back
after you've applied.”
• “Many qualified candidates are deterred by the
daunting task of building the application as well
as the often extended timelines for selection and
notification.”
A review of the narrative comments made by
respondents to the GS-14/15 survey identified
some additional detractors, several of which are
closely related to the specific detractors that we
listed in the survey. For example, the challenge
of dealing with poor performers in the
workplace could easily be associated with the
“increased responsibility” detractor. Additional
detractors mentioned by respondents in the
narrative comments include:
Quality of current SES members
Selections not based on merit
Lack of time, money, and support for training and development
Below are selected comments from survey
respondents about these additional detractors.
Taking the Helm: Attracting the Next Generation of Federal Leaders Copyright 2010 by the Senior Executives Association and Avue Technologies Corporation. All Rights Reserved. The contents may not be extracted, copied, reproduced, or distributed in any form without the written consent of the Senior Executives Association and Avue Technologies Corporation.
22 | P a g e
Quality of current SES members
• “I am continually disappointed with the quality
of Senior Executives serving in my bureau. For
too many years, the most dynamic leaders in the
organization have served at the GS-15 level, and
none of these dynamic leaders has advanced
into the SES in this organization. Instead, the
Department and bureau leadership continually
selects lesser qualified and less talented
candidates from outside the organization to fill
vacant SES slots.”
• “Have worked directly for career SES members
for nearly 20-years, and have consistently been
disappointed in their competency, capability and
willingness to make difficult decisions, and to
take opposing views forward for consideration.”
• “Although service at this level is attractive, the
realities I see every day dissuade me from
working towards a position at this level.
Frankly, I see little quality work at the SES level,
and much quality political maneuvering (which,
in the end, contributes little to long term mission
success). It is true the monetary rewards of SES
positions are limited, but I am more concerned
by what from my perspective is a limited
opportunity to do quality work.”
• “After 40 plus years with [my agency] I find
myself disappointed with the caliber of some of
the executives that I work for. Far too many
seem to be too cautious on the one hand. That
is, they are afraid to make any type of bold
decision that has any type of associated risk.
And on the other hand, many seem to make ego-
based decisions. I imagine them thinking ‘How
will I look to others if I make this decision,’
rather than ‘How can I make this a better
Agency’.”
• “I am unimpressed with the quality of SES
managers with whom I work. I do not have
exposure to the full environment of their job, but
these people hopefully do not represent the best
in government. It is discouraging after 30 plus
years to feel disillusioned with government
service - when several times during my career I
aspired to higher levels only to change my mind
based primarily on the poor performance of the
of people populating the leadership ranks.”
• “The majority of the SES's I have encountered
are excellent technical people, many with
advanced degrees, who concentrate on the
technical side of business and unfortunately lack
interest and/or ability in the critical functions of
managing people.”
• “Despite the respect and personal regard I have
for many current and former Senior Executives,
too many fail to inspire or lead, and even fewer
exhibit any meaningful innovative ideas or
abilities.”
Selections not based on merit
• “From my perspective, several of those in the
SES attained that status based on who they
know, rather than on their particular merits,
accomplishments, and/or expertise (or lack
thereof).”
• “Candidates for SES schools SEEM TO BE hand-
picked and members of the 'good old boy'
network. As an outsider looking in, I've seen
personnel who are well connected and have high
level mentors selected for SES positions. I
question the 'ability and experience’ of some
whom I've known personally who have been
selected for SES positions. Bottom-line, seems
like a beauty contest.”
Taking the Helm: Attracting the Next Generation of Federal Leaders Copyright 2010 by the Senior Executives Association and Avue Technologies Corporation. All Rights Reserved. The contents may not be extracted, copied, reproduced, or distributed in any form without the written consent of the Senior Executives Association and Avue Technologies Corporation.
23 | P a g e
• “I have applied for a number of SES positions
over the years and have found the process to be
frustrating at best, and often demeaning. I
would be interested in an SES position if there
was some assurance that selection was based on
knowledge, experience, and skills, rather than on
favoritism. Unfortunately, the selection process
in this agency in the past has been based on
individual preferences and wired for specific
individuals.”
• “While I respect those that have attained the
level of SES, I do not believe that they are the
best to get things done. It's not what you know,
it's who you know.”
• “I'm not that impressed with SES selections in
my agency. Selection is more related to ‘who
you know,’ rather than upon capability. Only a
few SES positions in my agency are filled by
competent, capable individuals.”
Lack of time, money and support for training & development
• “Despite working directly for career SES
members most of my Government career, and
being told I am SES caliber, none of my SES
supervisors have supported my attending SES
candidate programs, citing mission needs that
precluded my absence.”
• “Agency based programs to promote SES
candidate development do not work, and are
implemented sporadically at best. I was rated
#1 candidate by my agency in the application
process for SES candidate development school
only to find the program cancelled. I cannot
think of any SES's within our agency that have
completed a candidate development program.”
• “As my agency does not have its own CDP, I have
found it difficult to learn about such programs to
which I may be invited to apply.”
• “During the bulk of my career at the GS-14 level,
my supervisor discouraged my requests for
additional education, stating that he needed me
to be there to work issues as the functional
expert. That included paying for college courses
at the Master's level. He supported these areas
for those folks he did not believe would provide
him with the needed operational support. In
essence, it was his way of getting them out of
the office. At this late date, I believe it would
not be in either my or my agency's best interest
to pursue additional education. Yet to be in the
SES, it is probably mandated.”
Taking the Helm: Attracting the Next Generation of Federal Leaders Copyright 2010 by the Senior Executives Association and Avue Technologies Corporation. All Rights Reserved. The contents may not be extracted, copied, reproduced, or distributed in any form without the written consent of the Senior Executives Association and Avue Technologies Corporation.
24 | P a g e
Finding 3
Although pay was not a top attractor or
detractor among survey responses, numerous
narrative comments by survey respondents
expressed that the difference in pay between a
GS-14/15 position and an SES or Senior
Professional position is often not
commensurate with the increased workload,
responsibility, and risk.
As discussed under findings 1 and 2, pay was
not a top attractor or detractor for the
respondents to the GS-14/15 survey. For
calendar year 2010, the minimum pay level for
SES and Senior Professional positions is
$119,554, and the maximum is $179,700 in
agencies with a performance appraisal system
certified by OPM as meeting certain
requirements. For those agencies not certified,
the maximum pay level for SES and Senior
Professional positions is $165,300.
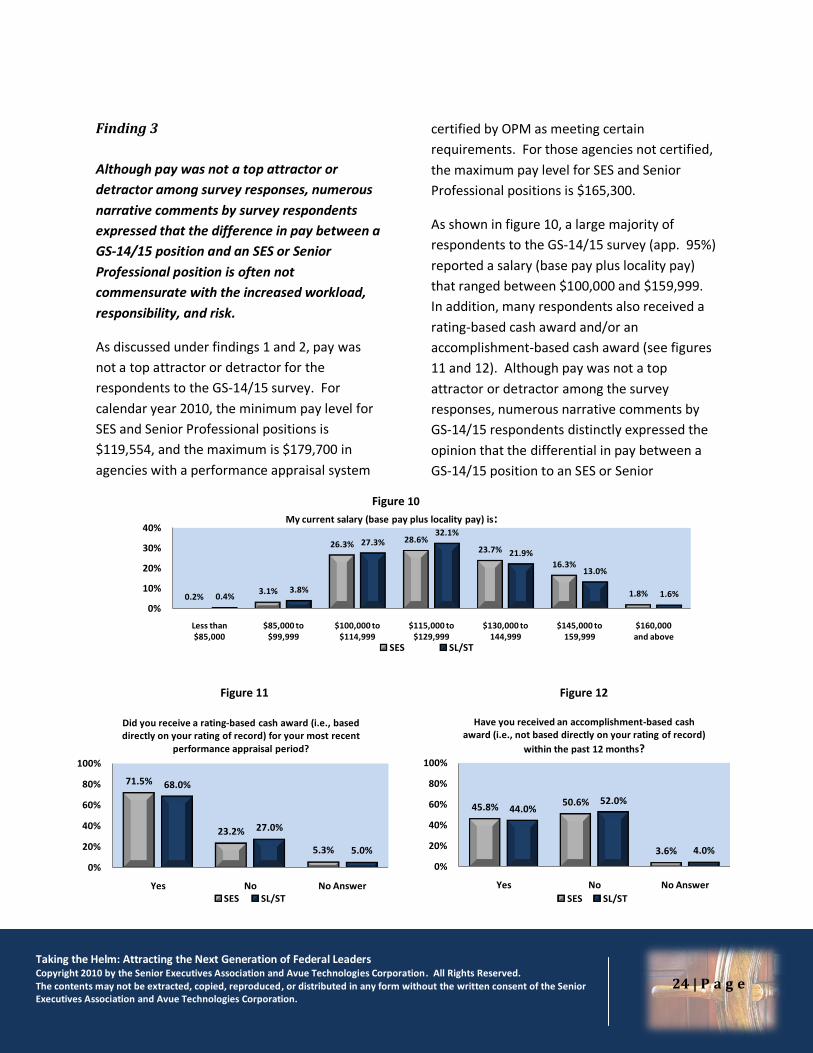
As shown in figure 10, a large majority of
respondents to the GS-14/15 survey (app. 95%)
reported a salary (base pay plus locality pay)
that ranged between $100,000 and $159,999.
In addition, many respondents also received a
rating-based cash award and/or an
accomplishment-based cash award (see figures
11 and 12). Although pay was not a top
attractor or detractor among the survey
responses, numerous narrative comments by
GS-14/15 respondents distinctly expressed the
opinion that the differential in pay between a
GS-14/15 position to an SES or Senior
71.5%
23.2%
5.3%
68.0%
27.0%
5.0%
0%
20%
40%
60%
80%
100%
Yes No No Answer
Did you receive a rating-based cash award (i.e., based directly on your rating of record) for your most recent
performance appraisal period?
SES SL/ST
45.8% 50.6%
3.6%
44.0%52.0%
4.0%
0%
20%
40%
60%
80%
100%
Yes No No Answer
Have you received an accomplishment-based cash award (i.e., not based directly on your rating of record)
within the past 12 months?
SES SL/ST
0.2%3.1%
26.3%28.6%
23.7%
16.3%
1.8%0.4%3.8%
27.3%32.1%
21.9%
13.0%
1.6%
0%
10%
20%
30%
40%
Less than$85,000
$85,000 to$99,999
$100,000 to$114,999
$115,000 to$129,999
$130,000 to144,999
$145,000 to159,999
$160,000and above
My current salary (base pay plus locality pay) is:
SES SL/ST
Figure 10
Figure 11 Figure 12
Taking the Helm: Attracting the Next Generation of Federal Leaders Copyright 2010 by the Senior Executives Association and Avue Technologies Corporation. All Rights Reserved. The contents may not be extracted, copied, reproduced, or distributed in any form without the written consent of the Senior Executives Association and Avue Technologies Corporation.
25 | P a g e
Professional position is not often
commensurate with the increased workload,
responsibility, and risk associated with serving
in an SES or Senior Professional position.
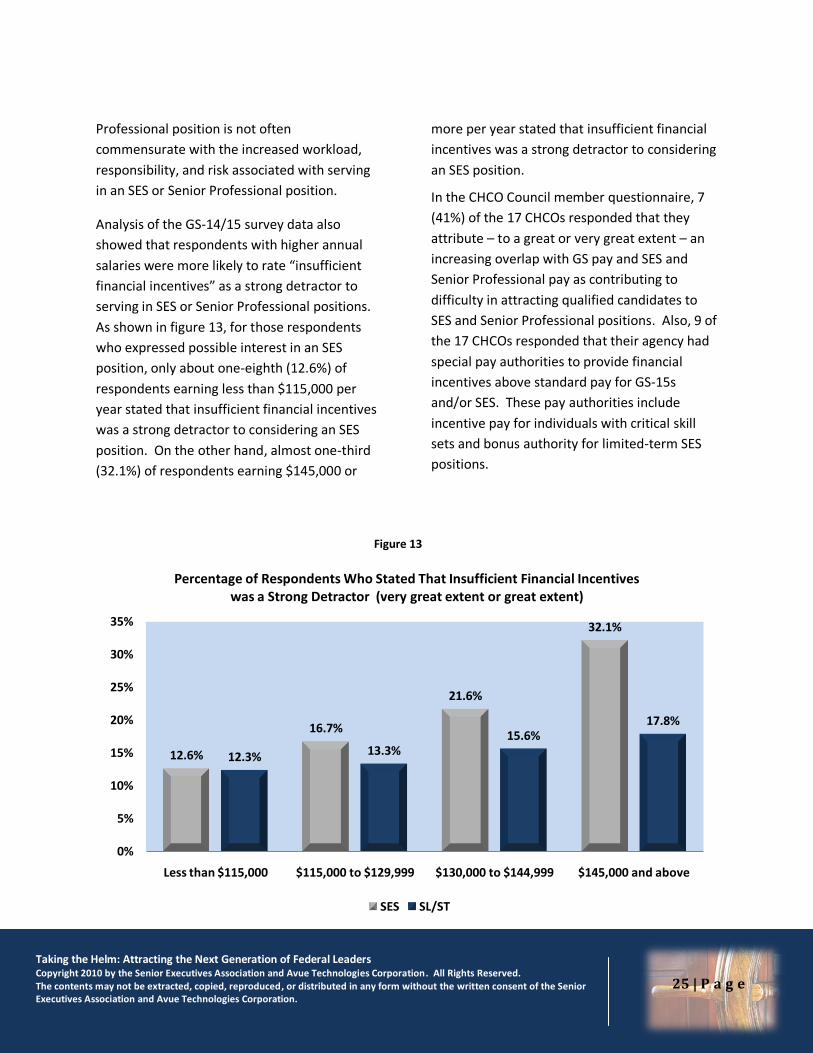
Analysis of the GS-14/15 survey data also
showed that respondents with higher annual
salaries were more likely to rate “insufficient
financial incentives” as a strong detractor to
serving in SES or Senior Professional positions.
As shown in figure 13, for those respondents
who expressed possible interest in an SES
position, only about one-eighth (12.6%) of
respondents earning less than $115,000 per
year stated that insufficient financial incentives
was a strong detractor to considering an SES
position. On the other hand, almost one-third
(32.1%) of respondents earning $145,000 or
more per year stated that insufficient financial
incentives was a strong detractor to considering
an SES position.
In the CHCO Council member questionnaire, 7
(41%) of the 17 CHCOs responded that they
attribute – to a great or very great extent – an
increasing overlap with GS pay and SES and
Senior Professional pay as contributing to
difficulty in attracting qualified candidates to
SES and Senior Professional positions. Also, 9 of
the 17 CHCOs responded that their agency had
special pay authorities to provide financial
incentives above standard pay for GS-15s
and/or SES. These pay authorities include
incentive pay for individuals with critical skill
sets and bonus authority for limited-term SES
positions.
12.6%
16.7%
21.6%
32.1%
12.3% 13.3%15.6%
17.8%
0%
5%
10%
15%
20%
25%
30%
35%
Less than $115,000 $115,000 to $129,999 $130,000 to $144,999 $145,000 and above
Percentage of Respondents Who Stated That Insufficient Financial Incentives was a Strong Detractor (very great extent or great extent)
SES SL/ST
Figure 13
Taking the Helm: Attracting the Next Generation of Federal Leaders Copyright 2010 by the Senior Executives Association and Avue Technologies Corporation. All Rights Reserved. The contents may not be extracted, copied, reproduced, or distributed in any form without the written consent of the Senior Executives Association and Avue Technologies Corporation.
26 | P a g e
The following are some selected comments
provided by respondents to the GS-14/15
survey that address issues related to pay for SES
or Senior Professional positions
• “Increased responsibilities of SES positions do
not carry with it a sufficiently increased
financial benefit.”
• “The salary difference between SES and GS is
not enough to make it worthwhile to go
through the process of applying.”
• “The level of responsibility for SES and Senior
Professional positions versus the pay is not
fair, i.e., pay and benefits are too low in
comparison with the private sector.”
• “Becoming a SES is not fiscally attractive to
me. There should be a greater disparity
between GS-15 step 10 salary and the salary
of a SES.”
• “Becoming an SES is a whole lot more
responsibility for not a whole lot more money.
I would clearly do it because I think that I
could accomplish more at that level than I can
now.”
• “A person who had an SES position in our
office told the office director that he wanted
to go back to a GS-15 job because the SES
didn’t really pay more and it wasn’t worth the
stress.”
• “Being at the GS-15 equivalent level presently
and looking forward, the prestige,
opportunities and responsibilities associated
with the SES do not appear as significant
enough inducements given the relative
additional compensation.”
• “From my vantage point, the slight increase in
pay is more than off-set by all of the SES
‘detractors,’ many of which were asked about
in this survey.”
• “For me, time is more important than money,
which is to say that I would be reserved about
accepting an SES position even if the
monetary rewards were much greater than
they are.”
• “As a GS-14, the pay differential to SES is not
enough to justify the increased opportunity.
I’m concerned that in the future as the gap
between SES pay and GS-14/15 pay closes,
most people will choose to stay in the GS-
series.”
• “I believe that the SES are severely underpaid
for their level of responsibility.”
• “The SES cadre is a great group of talented
people who spend endless hours hunting for
money, doing strategic planning, fending off
budget assaults, and attending meetings. For
the differences in salary, why would I subject
myself to that pain?”
Taking the Helm: Attracting the Next Generation of Federal Leaders Copyright 2010 by the Senior Executives Association and Avue Technologies Corporation. All Rights Reserved. The contents may not be extracted, copied, reproduced, or distributed in any form without the written consent of the Senior Executives Association and Avue Technologies Corporation.
27 | P a g e
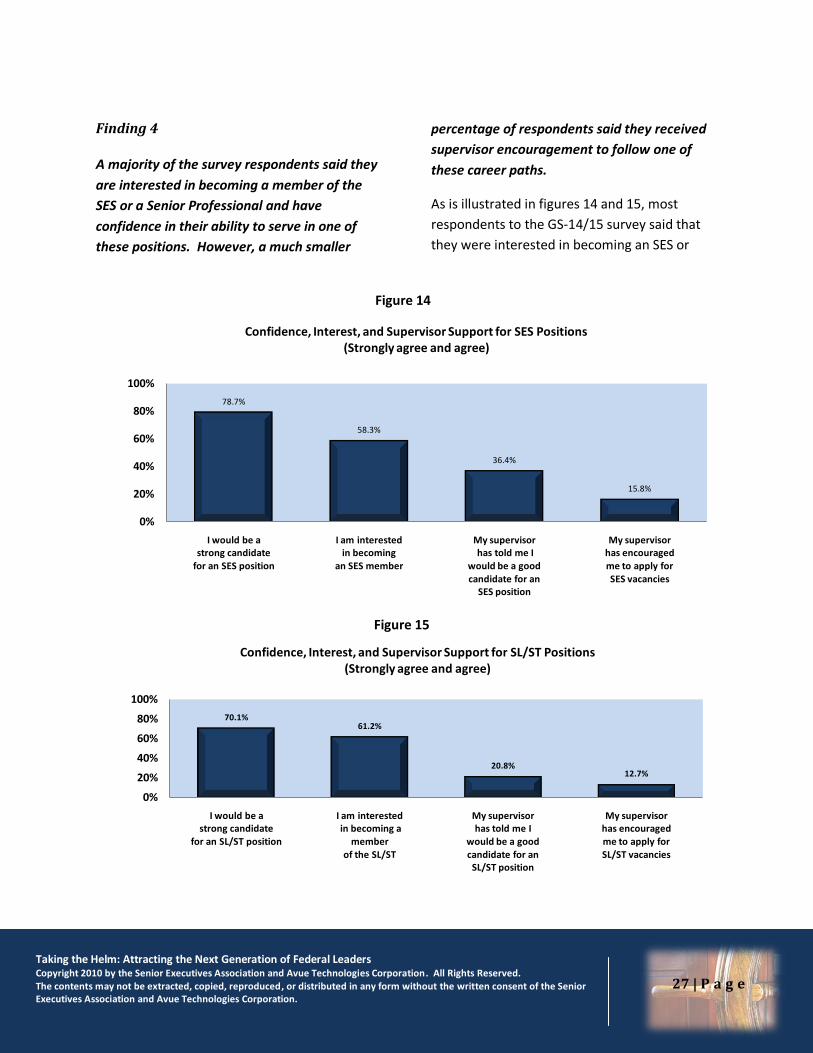
Finding 4
A majority of the survey respondents said they
are interested in becoming a member of the
SES or a Senior Professional and have
confidence in their ability to serve in one of
these positions. However, a much smaller
percentage of respondents said they received
supervisor encouragement to follow one of
these career paths.
As is illustrated in figures 14 and 15, most
respondents to the GS-14/15 survey said that
they were interested in becoming an SES or
78.7%
58.3%
36.4%
15.8%
0%
20%
40%
60%
80%
100%
I would be astrong candidate
for an SES position
I am interestedin becoming
an SES member
My supervisorhas told me I
would be a goodcandidate for an
SES position
My supervisorhas encouragedme to apply forSES vacancies
Confidence, Interest, and Supervisor Support for SES Positions(Strongly agree and agree)
Figure 14
Figure 15
70.1%61.2%
20.8%12.7%
0%
20%
40%
60%
80%
100%
I would be astrong candidate
for an SL/ST position
I am interestedin becoming a
memberof the SL/ST
My supervisorhas told me I
would be a goodcandidate for an
SL/ST position
My supervisorhas encouragedme to apply for SL/ST vacancies
Confidence, Interest, and Supervisor Support for SL/ST Positions(Strongly agree and agree)
Taking the Helm: Attracting the Next Generation of Federal Leaders Copyright 2010 by the Senior Executives Association and Avue Technologies Corporation. All Rights Reserved. The contents may not be extracted, copied, reproduced, or distributed in any form without the written consent of the Senior Executives Association and Avue Technologies Corporation.
28 | P a g e
SL/ST employee and believe they would be
strong candidates. Despite this, only a small
percentage of respondents said that they
received encouragement from their supervisor
to move toward one of these positions (also
illustrated in figures 14 and 15). Analysis of
survey results showed that respondents with
fewer years of service expressed greater
interest in serving as an SES member or Senior
Professional. For example, more than 70
percent of respondents with 10 years or less of
federal service either strongly agreed or agreed
that they were interested in becoming a
member of the SES or in becoming a Senior
Professional. On the other hand, only 50
percent of respondents with more than 20
years of federal service expressed the same
level of interest.
Analysis of the GS-14/15 survey data showed
similar results based on respondents’ time in
grade and age. For those respondents with 3
years or less in their current grade, 63 percent
either strongly agreed or agreed that they were
interested in becoming a member of the SES or
a Senior Professional. Only 49 percent of
respondents with 11 or more years in their
current grade felt the same. A similar gap in
interest existed based on the age of survey
respondents. More than 68 percent of
respondents under 40 years of age either
strongly agreed or agreed that they were
interested in becoming a member of the SES or
a Senior Professional while only 54 percent of
respondents age 50 and older showed the same
level of interest.
Responses to the CHCO questionnaire generally
show that the quality of applicants for career
SES and Senior Professional positions is high
(over the past 2 years) and the quality of
applicants has increased or stayed the same
(over the past 4 years). Specifically, 71 percent
of CHCO respondents stated that the quality of
applicants was very high or high over the past 2
years, and 74 percent stated that the quality of
applicants has increased or stayed the same
over the past 4 years. In addition, respondents
to the CHCO questionnaire rated the level of
interest of high-quality GS-15 or equivalent
employees as relatively high. Specifically, 52
percent of CHCO respondents state that the
level of interest of high-quality applicants is
very high or high. However, several CHCOs
noted a lack of information (e.g., via employee
surveys, interviews, focus groups) to assist them
in determining a more specific level of interest
of GS-15 employees or equivalents in applying
for or accepting career SES and Senior
Professional positions.
The following are some selected comments
provided by respondents to the GS-14/15
survey that address issues related to their
perceived ability to serve in SES or Senior
Professional positions as well as their views on
the level of support provided by their agencies
in preparing for SES or Senior Professional
positions.
• “Serving in the SES or Senior Professional
positions is a great opportunity for me to excel
in my career and contribute to others as a leader
within my agency. I am very competent and
dedicated in my work. I want to be successful
for myself and others, which in the end leads to
the agency’s success overall.”
Taking the Helm: Attracting the Next Generation of Federal Leaders Copyright 2010 by the Senior Executives Association and Avue Technologies Corporation. All Rights Reserved. The contents may not be extracted, copied, reproduced, or distributed in any form without the written consent of the Senior Executives Association and Avue Technologies Corporation.
29 | P a g e
• “From what I have observed thus far, my agency
does little to prepare or encourage most GS-14s
and 15s, especially high-performing transfers
from other agencies, to develop the skills for and
apply for SES.”
• “I get strong messages from my chain of
command that I need to greatly discount further
self-development and education in favor of
spending all of my time attending to current
duties (note: I got an outstanding rating last
period and am recognized as a top performer);
e.g., I was told I could not apply for the SES
Candidate Development Program the last time it
was offered. This unwillingness to support
further development is very discouraging.”
• “The employees in the office where I work are
not afforded the opportunity to participate in
developmental programs such as this. The
current manager will not allow this training or
much of any other unless it is to maintain a
certification.”
• “Could there be a performance metric for SESers
that specifically encourages them to support SES
career development? In my office, my boss
really doesn't have an incentive to encourage or
support me to pursue a SES job because were he
to lose me, a huge portion of his portfolio (i.e.,
the work I do) is now endangered. He is not able
to see the potential benefit to his office in
supporting my advancement to SES.”
• Unlike SES'ers I worked with during my previous
years in government service, no SES'er is now
serving as my mentor or even offering any word
of encouragement or praise for any job well
done--even jobs that earn recognition for other
individuals on my teams. “
• “The most significant detractor to my interest in
pursuing an SES position is the lack of role
models in my agency. I have met several whose
work ethic I greatly respect, but they themselves
seem frustrated in their jobs and they are too
busy to give priority to mentoring those who
might come after them.”
• “Despite working directly for career SES
members most of my Government career, and
being told I am SES caliber, none of my SES
supervisors have supported my attending SES
candidate programs, citing mission needs
precluded my absence.”
• “During the bulk of my career at the GS-14 level,
my supervisor discouraged my requests for
additional education, stating that he needed me
to be there to work issues as the functional
expert.”
• “There is no encouragement for professional
development in my work group. I recently went
to my first professional training in over four
years.”
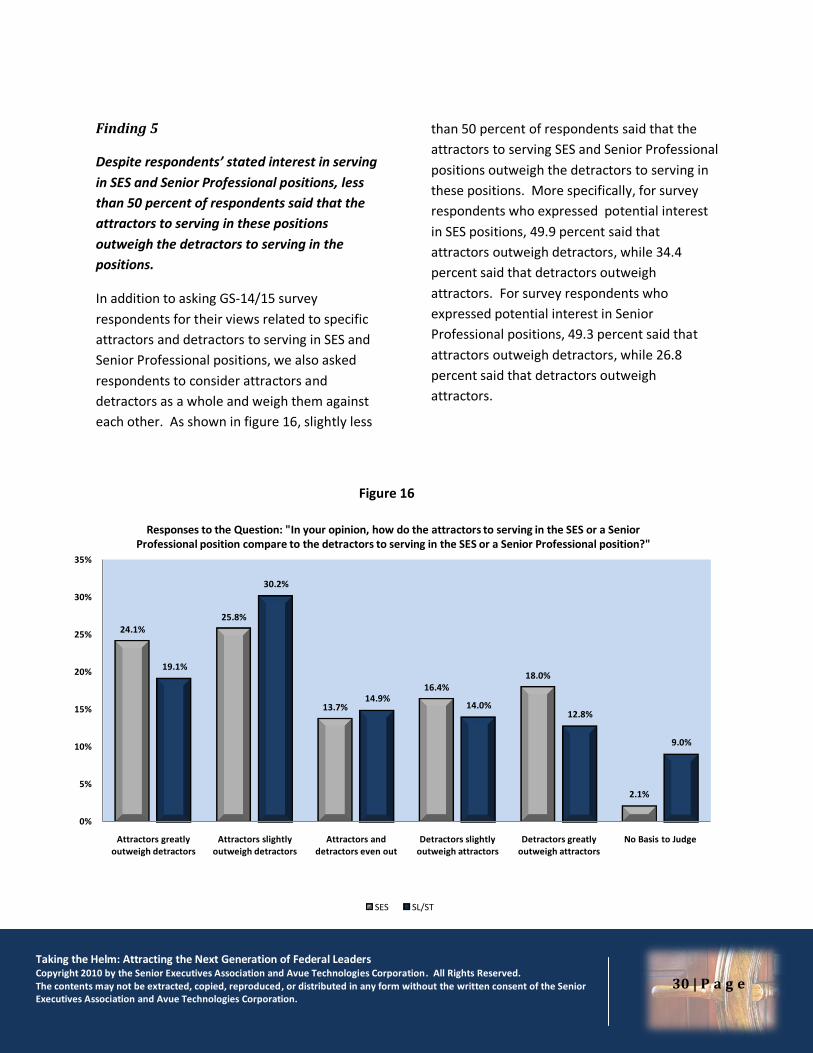
Taking the Helm: Attracting the Next Generation of Federal Leaders Copyright 2010 by the Senior Executives Association and Avue Technologies Corporation. All Rights Reserved. The contents may not be extracted, copied, reproduced, or distributed in any form without the written consent of the Senior Executives Association and Avue Technologies Corporation.
30 | P a g e
Finding 5
Despite respondents’ stated interest in serving
in SES and Senior Professional positions, less
than 50 percent of respondents said that the
attractors to serving in these positions
outweigh the detractors to serving in the
positions.
In addition to asking GS-14/15 survey
respondents for their views related to specific
attractors and detractors to serving in SES and
Senior Professional positions, we also asked
respondents to consider attractors and
detractors as a whole and weigh them against
each other. As shown in figure 16, slightly less
than 50 percent of respondents said that the
attractors to serving SES and Senior Professional
positions outweigh the detractors to serving in
these positions. More specifically, for survey
respondents who expressed potential interest
in SES positions, 49.9 percent said that
attractors outweigh detractors, while 34.4
percent said that detractors outweigh
attractors. For survey respondents who
expressed potential interest in Senior
Professional positions, 49.3 percent said that
attractors outweigh detractors, while 26.8
percent said that detractors outweigh
attractors.
24.1%25.8%
13.7%
16.4%18.0%
2.1%
19.1%
30.2%
14.9%14.0%
12.8%
9.0%
0%
5%
10%
15%
20%
25%
30%
35%
Attractors greatly outweigh detractors
Attractors slightly outweigh detractors
Attractors and detractors even out
Detractors slightly outweigh attractors
Detractors greatly outweigh attractors
No Basis to Judge
Responses to the Question: "In your opinion, how do the attractors to serving in the SES or a Senior Professional position compare to the detractors to serving in the SES or a Senior Professional position?"
SES SL/ST
Figure 16
Taking the Helm: Attracting the Next Generation of Federal Leaders Copyright 2010 by the Senior Executives Association and Avue Technologies Corporation. All Rights Reserved. The contents may not be extracted, copied, reproduced, or distributed in any form without the written consent of the Senior Executives Association and Avue Technologies Corporation.
31 | P a g e
In the questionnaire for the CHCO Council
members, we also asked their views about the
attractors and detractors of SES and Senior
Professional positions as a whole and asked
them to weigh them against each other. In
contrast to the GS-14/15 survey respondents, a
larger percentage of CHCOs stated that the
attractors to serving in SES positions
outweighed the detractors. Nine of the 15
CHCOs responding to the question (or 60%) said
that attractors to serving in SES positions
“greatly outweigh” or “slightly outweigh” the
detractors to serving those positions. Seven of
the 14 CHCOs responding to the question (or
50%) said that the attractors to serving in Senior
Professional positions “greatly outweigh” or
“slightly outweigh” the detractors to serving in
those positions.
The following are some selected comments
provided by respondents to the GS-14/15
survey that address issues related to weighing
attractors and detractors to serving in SES or
Senior Professional positions.
• “SES positions hold no allure for me. The
negatives (political implications, lack of clear
authority to take action, dealing with Congress)
far out weigh any positive benefits of serving in
the SES.”
• “After seeing high performing SES supervisors
demoted and insulted by political appointees, I
have no interest in serving in an SES position.
The benefits attendant to such a post do not
outweigh the indignity of being treated as a
partisan football. I worked in the private sector
before entering government service and I have
never seen executives or managers treated with
such an appalling lack of respect.”
• “I am currently a GS-15 step 8. The increase in
salary to take an SES position does not outweigh
the commitment of late hours and weekend
availability that would be expected of an SES.”
• “Frankly, the additional authority, responsibility,
requirement to deal with professional
politicians, and sheer aggravation far outweigh
the meager pay differential between GS-15 and
SES positions. The only possible reasons any GS-
15 would want an SES position are likely tied to
the desire for power and/or having one's ego
stroked.”
• “From my personal experience holding
somewhat similar senior level positions, the
advantages of an ST appointment clearly
outweigh the disadvantages when compared to
a GS appointment.”
• “I could see myself going after a SES position.
However, the negatives of SES service greatly
outweigh the benefits. Primarily I see strong
negatives in the inability to hire and fire staff,
and thus see so many of the SES I work with
have to deal with ineffective workers and related
personnel issues that they complain a lot to me
about, and use as one reason to discourage me
from becoming SES. I also note the
management and personnel headaches are not
worth the very small increase (after taxes) in
salary between GS 15-10 and SES service.”
• “It is clear to me that detractors far outweigh
attractors in applying for an SES position. The
key trade-off is compensation versus increased
responsibility and work load. The compensation
increase would have to be considerably better
than it is now for me to be interested.”
Taking the Helm: Attracting the Next Generation of Federal Leaders Copyright 2010 by the Senior Executives Association and Avue Technologies Corporation. All Rights Reserved. The contents may not be extracted, copied, reproduced, or distributed in any form without the written consent of the Senior Executives Association and Avue Technologies Corporation.
32 | P a g e
• “My observation of the SES positions within my
bureau and in many instances across the agency
is that the level of work, stress, bureaucracy, etc.
one has to deal with outweighs the benefits of
the position. Family involvement would
definitely diminish as well. My current
aspiration is to get a GS-15 job--although several
of those positions have many of the same issues
as SES positions.”
• “SES looks like the potential for a pay cut from
my current GS 15-9. My current bonus is not
guaranteed but highly likely, whereas the SES
bonus is at the discretion of people who have
proven themselves capricious and vindictive.
Moreover the application process is
cumbersome, although it would not be a
significant deterrent if the SES position were
worth obtaining. The prestige is a minor plus
factor, but not worth a potential pay cut.
Finally, the post-employment restrictions are a
minor factor weighing against applying for an
SES position.”
• “The bottom line for me - I am a GS-15, Step 10.
My salary is higher than some SES employees
and the limited financial gains of an SES or
Senior Professional position do not outweigh the
personal inconvenience of relocating, heavy
travel, and long hours that are usually required
to be successful in SES positions.”
• “There is not much incentive to pursue SES or
SL/ST positions in this agency. The relatively
small financial gain isn't worth the loss of
personal time or the increase in political
maneuvering required. To make matters worse,
the SES managers in this agency, with a few
exceptions, are poor role models for those of us
looking up from below. Instead of mentoring
lower level managers, they are busy in-fighting
and protecting their own turf. Why should I
pursue that world of endless meetings and back-
biting when I can accomplish more on a daily
basis as a high step GS-14?”
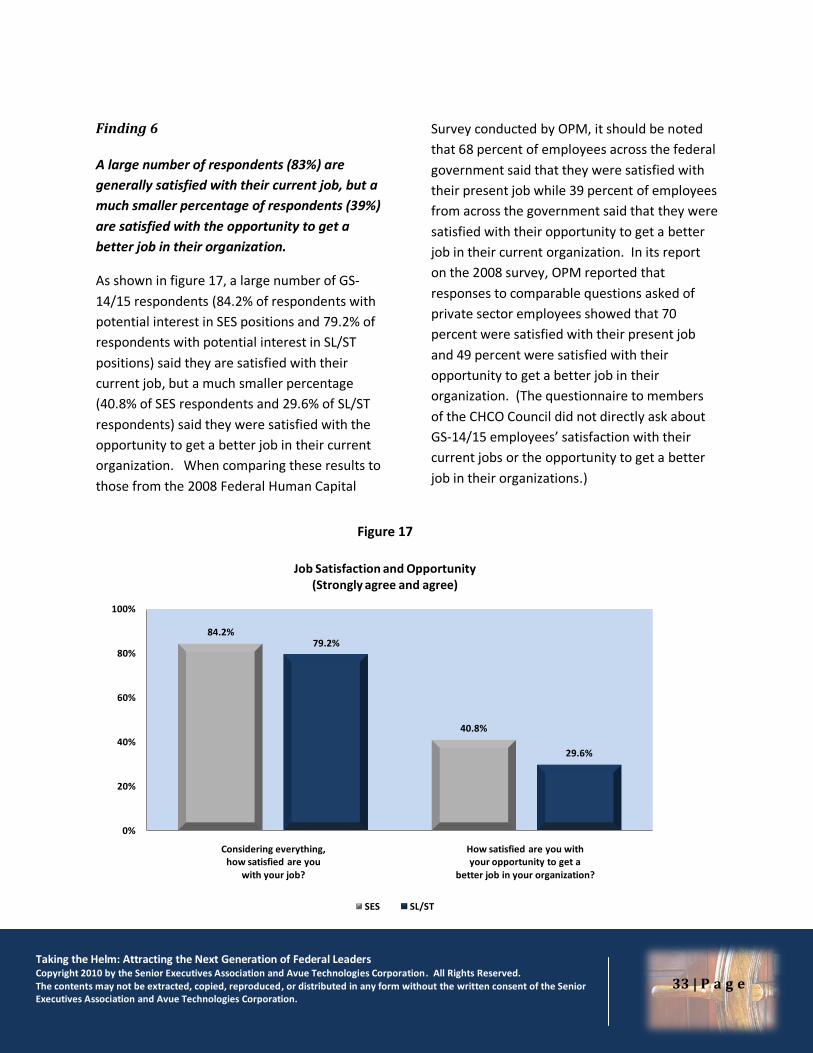
Taking the Helm: Attracting the Next Generation of Federal Leaders Copyright 2010 by the Senior Executives Association and Avue Technologies Corporation. All Rights Reserved. The contents may not be extracted, copied, reproduced, or distributed in any form without the written consent of the Senior Executives Association and Avue Technologies Corporation.
33 | P a g e
Finding 6
A large number of respondents (83%) are
generally satisfied with their current job, but a
much smaller percentage of respondents (39%)
are satisfied with the opportunity to get a
better job in their organization.
As shown in figure 17, a large number of GS-
14/15 respondents (84.2% of respondents with
potential interest in SES positions and 79.2% of
respondents with potential interest in SL/ST
positions) said they are satisfied with their
current job, but a much smaller percentage
(40.8% of SES respondents and 29.6% of SL/ST
respondents) said they were satisfied with the
opportunity to get a better job in their current
organization. When comparing these results to
those from the 2008 Federal Human Capital
Survey conducted by OPM, it should be noted
that 68 percent of employees across the federal
government said that they were satisfied with
their present job while 39 percent of employees
from across the government said that they were
satisfied with their opportunity to get a better
job in their current organization. In its report
on the 2008 survey, OPM reported that
responses to comparable questions asked of
private sector employees showed that 70
percent were satisfied with their present job
and 49 percent were satisfied with their
opportunity to get a better job in their
organization. (The questionnaire to members
of the CHCO Council did not directly ask about
GS-14/15 employees’ satisfaction with their
current jobs or the opportunity to get a better
job in their organizations.)
84.2%
40.8%
79.2%
29.6%
0%
20%
40%
60%
80%
100%
Considering everything,how satisfied are you
with your job?
How satisfied are you withyour opportunity to get a
better job in your organization?
Job Satisfaction and Opportunity(Strongly agree and agree)
SES SL/ST
Figure 17
Taking the Helm: Attracting the Next Generation of Federal Leaders Copyright 2010 by the Senior Executives Association and Avue Technologies Corporation. All Rights Reserved. The contents may not be extracted, copied, reproduced, or distributed in any form without the written consent of the Senior Executives Association and Avue Technologies Corporation.
34 | P a g e
The following are some selected comments
provided by respondents to the GS-14/15
survey that address issues related to job
satisfaction and the opportunity to get a better
job in their organization.
• “Sometimes I am interested in a SES position,
but I really like my current job.”
• “My personal philosophy is that, as long as I am
fulfilled in my work, able to make a meaningful
contribution to our mission and am sufficiently
compensated for what I do (regardless of the
grade), that's how I define job satisfaction. If
that means staying a happy GS-14 or advancing
to a GS-15 but no further, I can live with that.”
• “I have no knowledge of these programs or any
opportunities; however, I am very happy in what
I currently do for the agency.”
• “At the GS-15 level, I'm able to focus on getting
real work done that I believe is making a true
difference in national security and in the overall
value of my agency to the taxpayer. Interaction
with field personnel on resolving significant
problems, and the ability to see projects thru to
completion equates to job satisfaction. At the
SES level there are significant distractions, and
tremendous stress associated with having to
constantly justify what you are doing for reasons
that are often more political than factual.”
• “As I am a very new Supervisor, I would be
interested in learning more about the SES and
Senior Professional positions. This looks like an
opportunity for me that I was previously
unaware of.”
• “I feel that I make a difference in my
organization in my current position. I have great
job satisfaction and enjoy working in my
organization. The SES's that I have contact with
are great, but I feel that they are not treated
very well at all.”
• “Despite exceptionally strong educational
credentials, extensive cross-functional
experience, etc., there is still no opportunity to
be considered for selection by the broader
agency to either SES or SES-readiness programs
without endorsement by one’s own functional
executives. That can create an almost
insurmountable barrier if those executives don’t
know or work directly with a field applicant or
have a non-business reason for denying
support.”
• “There are many barriers to entering the SES
positions and little mysteries that seem to serve
no purpose other than to discourage the very
employees the government claims it is looking
for. I have been rated Outstanding in my
performance appraisals since joining the
government but cannot determine a viable way
to move up in the federal government.”
• “My management has actually discouraged me
from applying for the candidate programs,
though I have expressed interest. That is the #1
reason why I am considering leaving the Federal
Government: I am ambitious to move up, and I
feel stuck in my current position.”
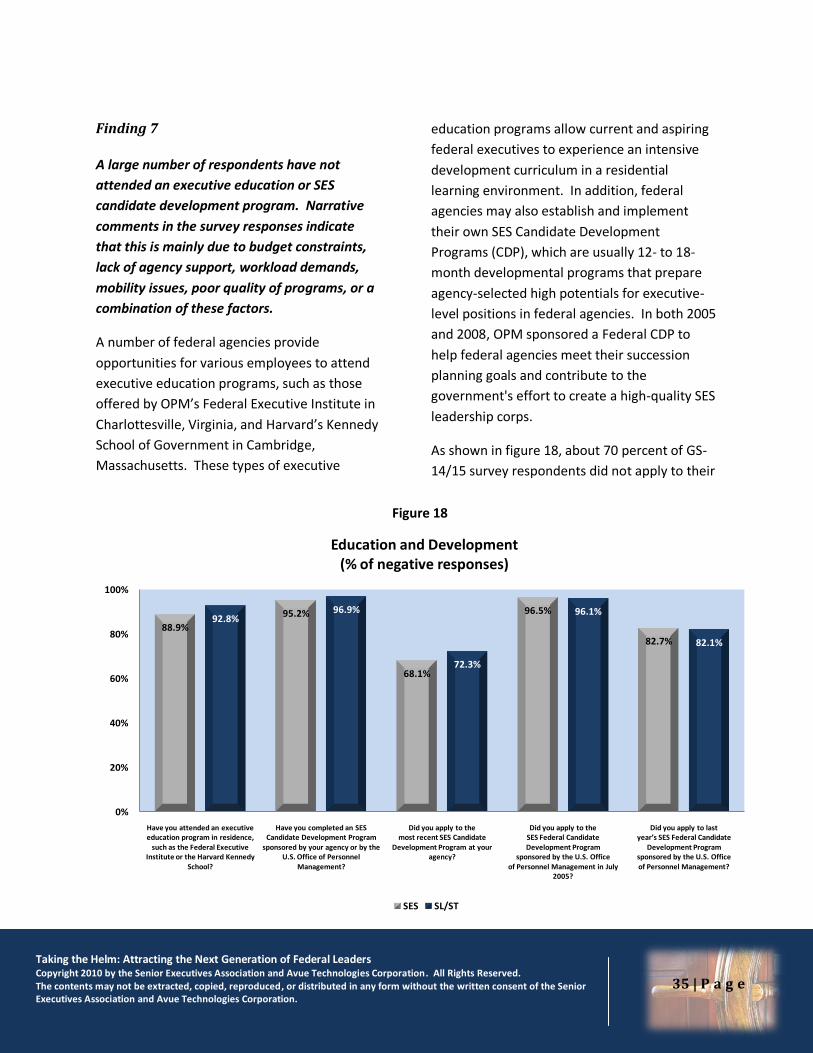
Taking the Helm: Attracting the Next Generation of Federal Leaders Copyright 2010 by the Senior Executives Association and Avue Technologies Corporation. All Rights Reserved. The contents may not be extracted, copied, reproduced, or distributed in any form without the written consent of the Senior Executives Association and Avue Technologies Corporation.
35 | P a g e
Finding 7
A large number of respondents have not
attended an executive education or SES
candidate development program. Narrative
comments in the survey responses indicate
that this is mainly due to budget constraints,
lack of agency support, workload demands,
mobility issues, poor quality of programs, or a
combination of these factors.
A number of federal agencies provide
opportunities for various employees to attend
executive education programs, such as those
offered by OPM’s Federal Executive Institute in
Charlottesville, Virginia, and Harvard’s Kennedy
School of Government in Cambridge,
Massachusetts. These types of executive
education programs allow current and aspiring
federal executives to experience an intensive
development curriculum in a residential
learning environment. In addition, federal
agencies may also establish and implement
their own SES Candidate Development
Programs (CDP), which are usually 12- to 18-
month developmental programs that prepare
agency-selected high potentials for executive-
level positions in federal agencies. In both 2005
and 2008, OPM sponsored a Federal CDP to
help federal agencies meet their succession
planning goals and contribute to the
government's effort to create a high-quality SES
leadership corps.
As shown in figure 18, about 70 percent of GS-
14/15 survey respondents did not apply to their
88.9%
95.2%
68.1%
96.5%
82.7%
92.8%96.9%
72.3%
96.1%
82.1%
0%
20%
40%
60%
80%
100%
Have you attended an executiveeducation program in residence,
such as the Federal Executive Institute or the Harvard Kennedy
School?
Have you completed an SESCandidate Development Program
sponsored by your agency or by theU.S. Office of Personnel
Management?
Did you apply to themost recent SES Candidate
Development Program at your agency?
Did you apply to theSES Federal CandidateDevelopment Program
sponsored by the U.S. Officeof Personnel Management in July
2005?
Did you apply to lastyear’s SES Federal Candidate
Development Programsponsored by the U.S. Officeof Personnel Management?
Education and Development(% of negative responses)
SES SL/ST
Figure 18
Taking the Helm: Attracting the Next Generation of Federal Leaders Copyright 2010 by the Senior Executives Association and Avue Technologies Corporation. All Rights Reserved. The contents may not be extracted, copied, reproduced, or distributed in any form without the written consent of the Senior Executives Association and Avue Technologies Corporation.
36 | P a g e
agency’s most recent CDP, and a large
percentage of respondents had not applied to
OPM’s Federal CDP in 2005 and 2008. A large
percentage of respondents also reported that
they had not attended an executive program in
residence or completed an SES CDP. Analysis of
the survey results shows that those
respondents who had attended an executive
education program or who had completed a
CDP were more likely to have positive feelings
about their abilities, opportunities, and support
from their supervisors. These respondents
were also more likely to express positive views
about the attractors to SES and Senior
Professional positions.
The CHCOs responding to the CHCO Council
questionnaire stated that by and large the
quality of applicants for their respective
agency’s SES candidate development programs
has been high over the past 4 years.
Specifically, 10 of the 17 CHCOs responded that
their department or agency had accepted
participants into an agency-sponsored SES CDP
within the past 4 years, and 7 CHCOs responded
that the quality of applicants for the SES CDPs
was “high” or “very high.”
The following are some selected comments
provided by respondents to the GS-14/15
survey that address issues related to executive
education and professional development in
preparing for SES or Senior Professional
positions.
• “As my agency does not have its own CDP, I have
found it difficult to learn about such programs to
which I may be invited to apply.”
• “I am interested in becoming a member of the
SES. Unfortunately, my agency does not have
the funding to send candidates to Executive
Leadership training or SES development training.
With that in mind, I will probably have to
transfer to another federal agency with more
advancement opportunities.”
• “I was interested in attending training, but was
discouraged by management due to lack of in-
house resources to cover during my absence.”
• “I developed an Individual Development Plan
(IDP), but ostensibly the agency's training
budget will not allow full implementation of my
plan.”
• “I am interested in the SES programs but all
development programs are Washington based;
since I am in the field, options are limited. I was
considered for an SES development program
several years ago but there was no funding.
Since I was not based in DC, no one took my
interest very seriously and there was always the
question of budget. We don't have it...so sorry
about that.”
• “I've never been approached about mentoring,
career counseling, possibilities of SES candidacy
or training, etc. I am too swamped with day-to-
day responsibilities to think about the possibility
of taking time off for SES-related training.”
• “It appears difficult to complete SES Candidate
programs if you are not DC based. A recent
program required the candidate to take 8
months of university classes at a DC based
university. I fully recognize that the candidate
program requires rotations, etc. which I am
willing to do. However, having a requirement
for a DC based set of university classes (without
Taking the Helm: Attracting the Next Generation of Federal Leaders Copyright 2010 by the Senior Executives Association and Avue Technologies Corporation. All Rights Reserved. The contents may not be extracted, copied, reproduced, or distributed in any form without the written consent of the Senior Executives Association and Avue Technologies Corporation.
37 | P a g e
apparent facility for distance learning) was
sufficient to cause me to not apply.”
• “[My agency] offered a SES development
program but we in the field were not allowed to
apply. The reason is that it was viewed as too
expensive (required 25-50K). If these type of
things were centrally funded, it would be easier
for those of us in the field where funding is an
issue.”
• “I do not currently have the flexibility to move
and this prevents me from applying for the SES
development training courses. I would very
much like to participate in this level of training.”
• “The 4-week SES programs in Charlottesville are
hard to take advantage of if you are a working
mother or person with a disability.”
• “Leaving my family for 4-6 weeks at a time for a
CDP requirement is unrealistic.”
• “Feel that SES Candidacy Program is designed to
unfairly favor those who are single or place
career ahead of family -- having to be able to
move anywhere is the biggest drawback to the
program -- I would never consider the program
because of this.”
• “It is my impression from seeing SES candidates
that the SES development programs require
frequent relocations over the course of several
years to provide experience in different
positions. Frequent long relocations are not
desirable for me because I do not wish to be
apart from my family for long periods.”
• “The SES Candidate Development Program
application process I completed was very
cumbersome and did not provide for
communication in understanding of what was
needed or expected in the application. After
spending 40 plus hours on the application
process and not being able to receive feedback
when not selected during the screening process
was so discouraging that I did not apply when
the program was re-advertised.”
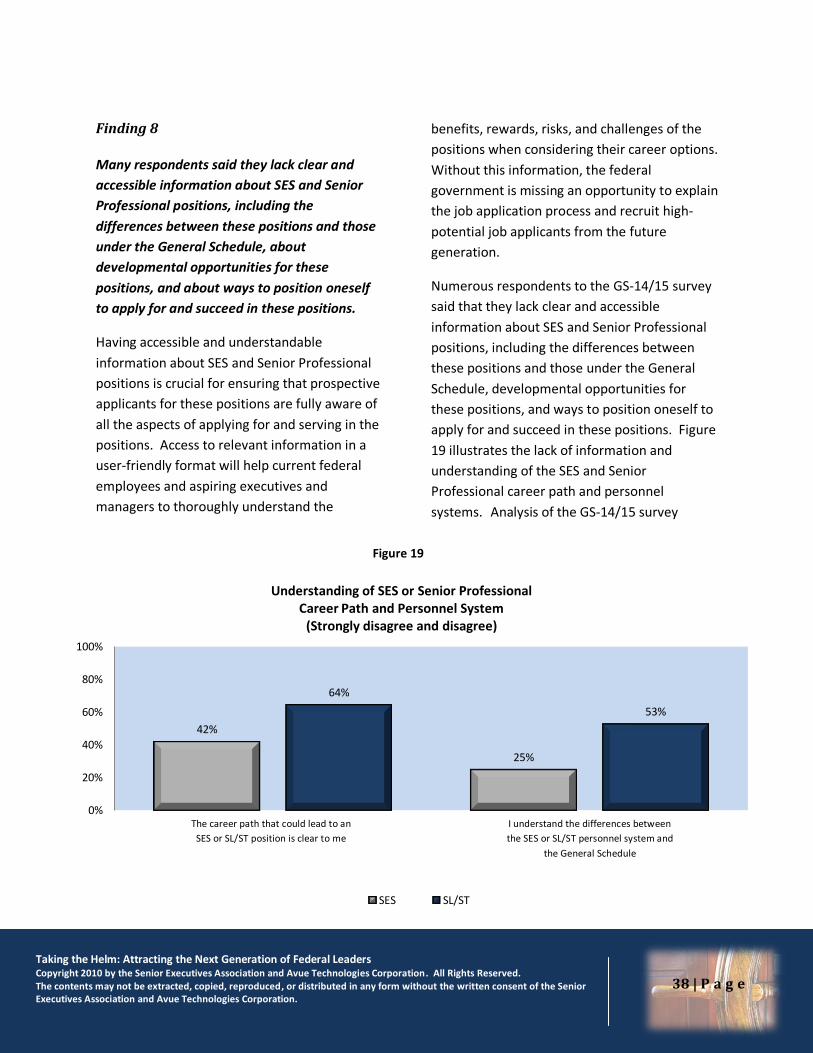
Taking the Helm: Attracting the Next Generation of Federal Leaders Copyright 2010 by the Senior Executives Association and Avue Technologies Corporation. All Rights Reserved. The contents may not be extracted, copied, reproduced, or distributed in any form without the written consent of the Senior Executives Association and Avue Technologies Corporation.
38 | P a g e
Finding 8
Many respondents said they lack clear and
accessible information about SES and Senior
Professional positions, including the
differences between these positions and those
under the General Schedule, about
developmental opportunities for these
positions, and about ways to position oneself
to apply for and succeed in these positions.
Having accessible and understandable
information about SES and Senior Professional
positions is crucial for ensuring that prospective
applicants for these positions are fully aware of
all the aspects of applying for and serving in the
positions. Access to relevant information in a
user-friendly format will help current federal
employees and aspiring executives and
managers to thoroughly understand the
benefits, rewards, risks, and challenges of the
positions when considering their career options.
Without this information, the federal
government is missing an opportunity to explain
the job application process and recruit high-
potential job applicants from the future
generation.
Numerous respondents to the GS-14/15 survey
said that they lack clear and accessible
information about SES and Senior Professional
positions, including the differences between
these positions and those under the General
Schedule, developmental opportunities for
these positions, and ways to position oneself to
apply for and succeed in these positions. Figure
19 illustrates the lack of information and
understanding of the SES and Senior
Professional career path and personnel
systems. Analysis of the GS-14/15 survey
42%
25%
64%
53%
0%
20%
40%
60%
80%
100%
Understanding of SES or Senior ProfessionalCareer Path and Personnel System
(Strongly disagree and disagree)
SES SL/ST
The career path that could lead to an
SES or SL/ST position is clear to me
I understand the differences between
the SES or SL/ST personnel system and
the General Schedule
Figure 19
I understand the differences between
the SES or SL/ST personnel system and
the General Schedule
Taking the Helm: Attracting the Next Generation of Federal Leaders Copyright 2010 by the Senior Executives Association and Avue Technologies Corporation. All Rights Reserved. The contents may not be extracted, copied, reproduced, or distributed in any form without the written consent of the Senior Executives Association and Avue Technologies Corporation.
39 | P a g e
results shows that the less time in grade, the
less likely the respondents were to understand
the differences between the GS and SES
systems. For example, 58 percent of
respondents with 3 years or less in grade said
that they understood the differences in the two
systems to a great or very great extent versus
76 percent of respondents with 11 years or
more in grade. (The questionnaire to members
of the CHCO Council did not directly ask about
GS-14/15 employees’ general knowledge of SES
and SL/ST positions or about the availability of
information concerning such positions.)
The following are some selected comments
provided by respondents to the GS-14/15
survey that address issues related to the lack of
information about applying for and serving in
SES or Senior Professional positions.
• “I don’t see much information about the SES or
Senior Professional positions posted anywhere. I
would recommend making this information
readily available to government employees,
public, etc. so that the government can attract
and retain as many talented individuals as
possible.”
• “I do not feel that I’ve gotten any direction on
how best to prepare myself for consideration for
an SES position.”
• “There is significant lack of knowledge at field
sites about how to become an SES. I did all of
the research on my own with no help from the
organization.”
• “I am unaware of how to pursue this career
track. I will have to ask more questions of my
supervisors, but it would also help if more
information were readily available.”
• “I do not know whether it is a phenomenon
particular to my department, or my bureau, or
my office, but although I have been a civil
servant for 17 years and a GS-14 for four, I have
heard almost nothing about the SES.”
• “Although I have been with my agency for over
30 years and have recently finished a Candidate
Development Program, some of the perks noted
in this survey are the first time I am hearing
about them. I will certainly explore them further
now, but I guess some advertising of the benefits
would not hurt to attract more interest in the
program. Give people the facts.”
• “I have been told by several supervisors that I
should consider the SES. But, after almost nine
years in the agency, I am under the impression
that information about the SES is a closely
guarded secret.”
• “There should be more information available
about Senior Professional positions and how to
get them. There does not seem to be a clear,
easy path for people who want to remain in a
technical area and move up in the hierarchy to
do so.”
• “Information regarding these positions is
lacking. Although invitations to apply for
training appear from time to time, we never
really know what these positions are all about.”
• “In the over 20 years I’ve worked here, I have
never been provided with information on SES or
senior professional positions, nor have I been
given information on any of the training
opportunities mentioned in this survey.”
• “I haven’t even heard of SL and ST positions
before taking this survey, a sad commentary on
Taking the Helm: Attracting the Next Generation of Federal Leaders Copyright 2010 by the Senior Executives Association and Avue Technologies Corporation. All Rights Reserved. The contents may not be extracted, copied, reproduced, or distributed in any form without the written consent of the Senior Executives Association and Avue Technologies Corporation.
40 | P a g e
the importance of career development
information dissemination in my organization.”
• “Thanks for allowing me to take part in this
survey. Sometimes in the field we do not always
receive information that can help us expand our
knowledge-base or career path.”
• “I never hear managers in my organization talk
about how one could become a GS-15 or get into
an SES program.”
• “I've learned more about ST/SL positions from
this survey than I've ever heard from my
organization's management.”
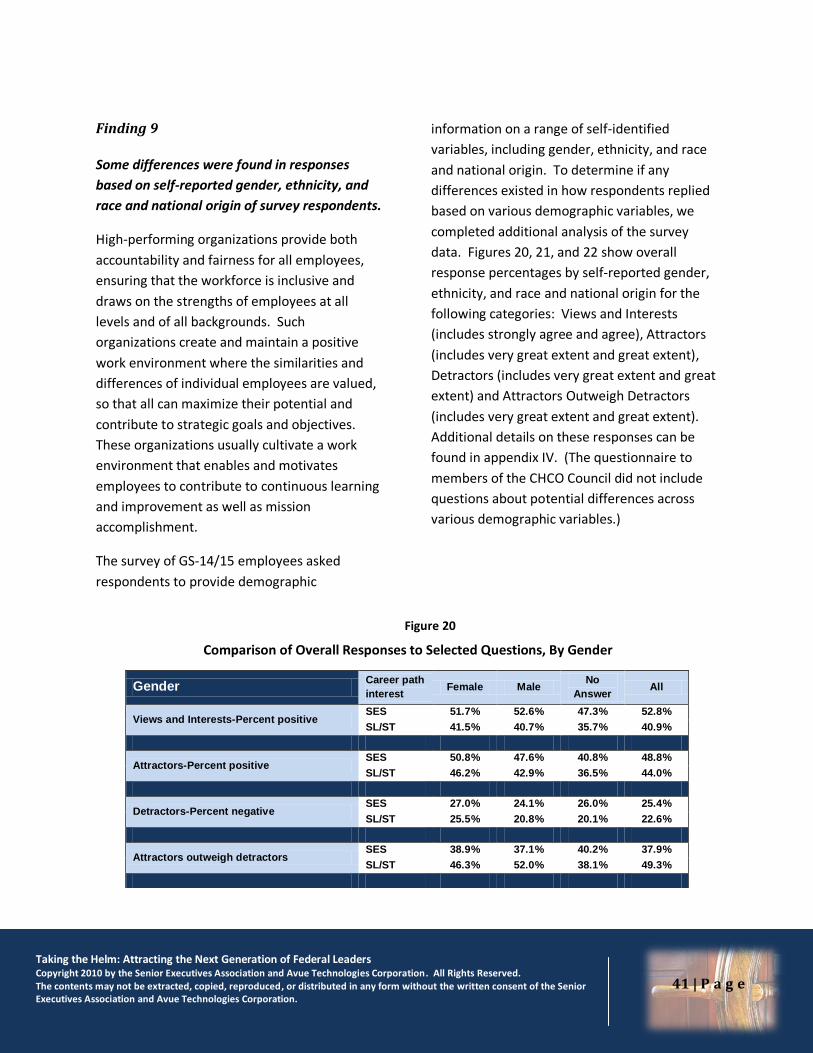
Taking the Helm: Attracting the Next Generation of Federal Leaders Copyright 2010 by the Senior Executives Association and Avue Technologies Corporation. All Rights Reserved. The contents may not be extracted, copied, reproduced, or distributed in any form without the written consent of the Senior Executives Association and Avue Technologies Corporation.
41 | P a g e
Finding 9
Some differences were found in responses
based on self-reported gender, ethnicity, and
race and national origin of survey respondents.
High-performing organizations provide both
accountability and fairness for all employees,
ensuring that the workforce is inclusive and
draws on the strengths of employees at all
levels and of all backgrounds. Such
organizations create and maintain a positive
work environment where the similarities and
differences of individual employees are valued,
so that all can maximize their potential and
contribute to strategic goals and objectives.
These organizations usually cultivate a work
environment that enables and motivates
employees to contribute to continuous learning
and improvement as well as mission
accomplishment.
The survey of GS-14/15 employees asked
respondents to provide demographic
information on a range of self-identified
variables, including gender, ethnicity, and race
and national origin. To determine if any
differences existed in how respondents replied
based on various demographic variables, we
completed additional analysis of the survey
data. Figures 20, 21, and 22 show overall
response percentages by self-reported gender,
ethnicity, and race and national origin for the
following categories: Views and Interests
(includes strongly agree and agree), Attractors
(includes very great extent and great extent),
Detractors (includes very great extent and great
extent) and Attractors Outweigh Detractors
(includes very great extent and great extent).
Additional details on these responses can be
found in appendix IV. (The questionnaire to
members of the CHCO Council did not include
questions about potential differences across
various demographic variables.)
Gender Career path
interest Female Male
No
Answer All
Views and Interests-Percent positive SES 51.7% 52.6% 47.3% 52.8%
SL/ST 41.5% 40.7% 35.7% 40.9%
Attractors-Percent positive SES 50.8% 47.6% 40.8% 48.8%
SL/ST 46.2% 42.9% 36.5% 44.0%
Detractors-Percent negative SES 27.0% 24.1% 26.0% 25.4%
SL/ST 25.5% 20.8% 20.1% 22.6%
Attractors outweigh detractors SES 38.9% 37.1% 40.2% 37.9%
SL/ST 46.3% 52.0% 38.1% 49.3%
Figure 20
Comparison of Overall Responses to Selected Questions, By Gender
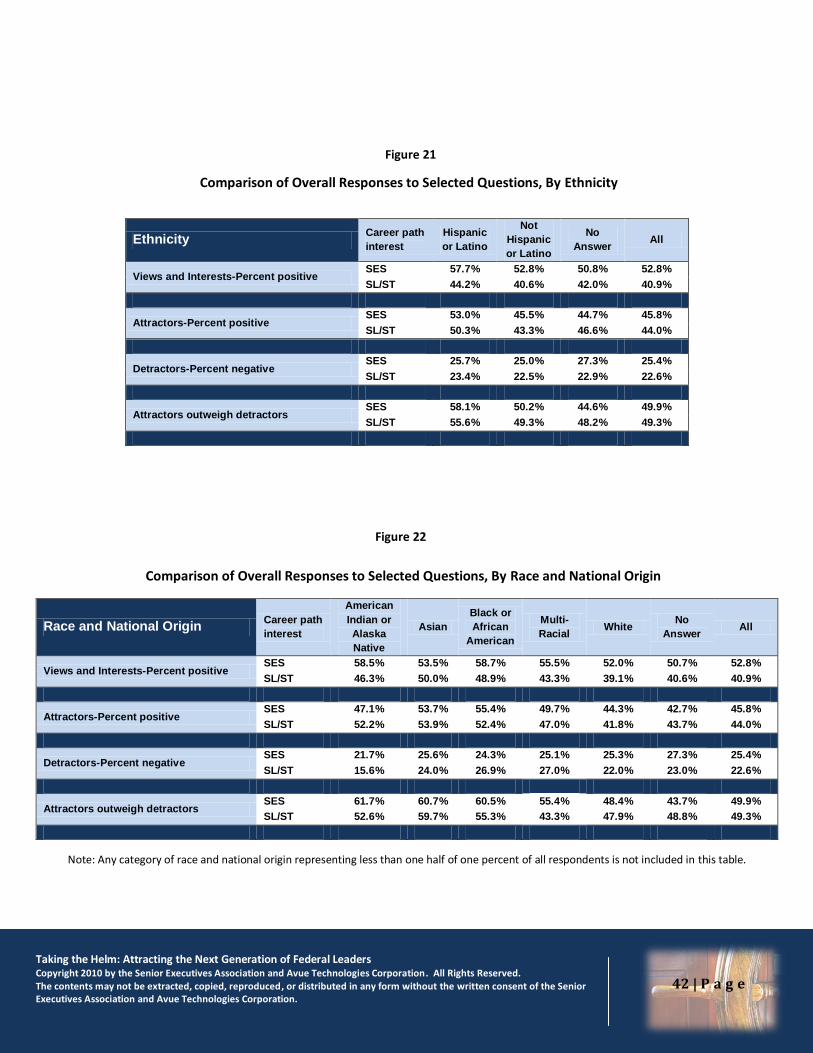
Taking the Helm: Attracting the Next Generation of Federal Leaders Copyright 2010 by the Senior Executives Association and Avue Technologies Corporation. All Rights Reserved. The contents may not be extracted, copied, reproduced, or distributed in any form without the written consent of the Senior Executives Association and Avue Technologies Corporation.
42 | P a g e
Ethnicity Career path
interest
Hispanic
or Latino
Not
Hispanic
or Latino
No
Answer All
Views and Interests-Percent positive SES 57.7% 52.8% 50.8% 52.8%
SL/ST 44.2% 40.6% 42.0% 40.9%
Attractors-Percent positive SES 53.0% 45.5% 44.7% 45.8%
SL/ST 50.3% 43.3% 46.6% 44.0%
Detractors-Percent negative SES 25.7% 25.0% 27.3% 25.4%
SL/ST 23.4% 22.5% 22.9% 22.6%
Attractors outweigh detractors SES 58.1% 50.2% 44.6% 49.9%
SL/ST 55.6% 49.3% 48.2% 49.3%
Race and National Origin Career path
interest
American
Indian or
Alaska
Native
Asian
Black or
African
American
Multi-
Racial White
No
Answer All
Views and Interests-Percent positive SES 58.5% 53.5% 58.7% 55.5% 52.0% 50.7% 52.8%
SL/ST 46.3% 50.0% 48.9% 43.3% 39.1% 40.6% 40.9%
Attractors-Percent positive SES 47.1% 53.7% 55.4% 49.7% 44.3% 42.7% 45.8%
SL/ST 52.2% 53.9% 52.4% 47.0% 41.8% 43.7% 44.0%
Detractors-Percent negative SES 21.7% 25.6% 24.3% 25.1% 25.3% 27.3% 25.4%
SL/ST 15.6% 24.0% 26.9% 27.0% 22.0% 23.0% 22.6%
Attractors outweigh detractors SES 61.7% 60.7% 60.5% 55.4% 48.4% 43.7% 49.9%
SL/ST 52.6% 59.7% 55.3% 43.3% 47.9% 48.8% 49.3%
Figure 21
Comparison of Overall Responses to Selected Questions, By Ethnicity
Figure 22
Comparison of Overall Responses to Selected Questions, By Race and National Origin
Note: Any category of race and national origin representing less than one half of one percent of all respondents is not included in this table.
Taking the Helm: Attracting the Next Generation of Federal Leaders Copyright 2010 by the Senior Executives Association and Avue Technologies Corporation. All Rights Reserved. The contents may not be extracted, copied, reproduced, or distributed in any form without the written consent of the Senior Executives Association and Avue Technologies Corporation.
43 | P a g e
The following are some selected comments
provided by respondents to the GS-14/15
survey that address issues related to diversity
and serving in SES or Senior Professional
positions.
• “Agency SES candidate programs are not transparent. There is very little agency accountability in selection in promoting goals of diversity—not just in terms of race or ethnicity but also in terms of professional and intellectual diversity. This lack of diversity limits the ability of potential candidates who have broad skills.”
• “I believe that my chances of selection to the SES are minimal because I am a white male. I believe that selection for the SES should be based on merit, but it is not, and this deeply offends me.”
• “Why are there so few Hispanic SES in the federal government at a time when Hispanics are thriving in the private sector? Hispanics are underrepresented in all aspects of employment in the federal government…not just in the SES ranks.”
• “As a white male, I’ve been told repeatedly over the years that I would have little or no chance of being selected for the SES candidate program.”
• “I would like to see more emphasis in leadership initiatives to recruit minorities into SES positions. There appears to be a glass ceiling within the federal government for minority individuals going beyond the GS-15.”
• “I feel that non-white junior employees are not given equal opportunities early in their careers to demonstrate leadership and this makes them less competitive for future senior positions.”
• “I strongly encourage the recruitment of people with severe/targeted disabilities in the SES as you would any other minority group. Disabilities affect people from all walks of life. However, we
are doing a poor job of hiring, advancing, and retaining people with severe disabilities in our Federal workforce.”
• “I applied to the SES development program in my agency and made it to the interview process. The two interviewers (white males) did not treat me courteously and my sense was that my management experience in the private sector was a negative, not a positive, in their view.
• “It’s clear that my agency prefers male veterans; women are discriminated against, overtly and subtly, on a recurring basis. Women are seen as good worker bees, but too emotional and not particularly serious candidates for promotion.”
• “Our agency has made it clear that older white males, no matter how outstanding you may be rated or the number of awards you receive, are not being encouraged to file for advancement at the senior ranks.”
• “I would definitely love to have the opportunity to serve my country at such a higher level and feel like I am contributing something to society. Unfortunately, these positions are only given to Caucasian men and women even though some minority people are qualified.”
• “Most of the current SES candidates in my agency are in their 30s. Older employees are not encouraged to apply for SES development programs.”
• “Many barriers still exist for women and minorities when it comes to selection into the SES. OPM does little or nothing in the way of monitoring or enforcing the merit systems principles, relying on agencies to police themselves.”
• “I would like to see more mentorship for minorities, especially African American males. I have been with my agency for 22 years and not once has anyone approached me about mentorship or my interest in becoming an SES.”
Taking the Helm: Attracting the Next Generation of Federal Leaders Copyright 2010 by the Senior Executives Association and Avue Technologies Corporation. All Rights Reserved. The contents may not be extracted, copied, reproduced, or distributed in any form without the written consent of the Senior Executives Association and Avue Technologies Corporation.
44 | P a g e
Recommendations
On the basis of review and analysis of the
results of the government-wide GS-14/15
survey and the CHCO questionnaire, SEA
recommends the following to strengthen the
career SES and SL/ST systems in the federal
government and to help resolve concerns
expressed in the survey of prospective federal
leaders and managers.
Recommendation 1: OPM and agencies should
emphasize the positive aspects of serving in
SES and Senior Professional positions as
expressed by survey respondents in order to
attract and recruit highly qualified candidates
to senior career positions. In addition, making
improvements in the operation of the
executive corps itself would make the corps
more appealing to potential applicants, as well
as serving to retain current executives. More
than one-third of the current SES will likely
retire in the next 5 years, so agencies need to
use effective means for recruiting high-quality
candidates for critical career executive and
senior-level positions. Agencies should be more
proactive in seeking out senior talent by
highlighting the positive facets of serving in SES
and Senior Professional positions, including the
ability to contribute more to the mission of the
agency, greater opportunity for creativity and
innovation, the honor of serving at the highest
level, and increased responsibility and
authority. In addition, improving service in the
executive corps itself could help to advance the
professional lives of current SES members. For
example, placing high-performing career
executives in key positions that are now
reserved almost exclusively for political
appointees will reinforce the attractors to
serving in SES positions as well as help to ensure
continuity in leadership and expertise during
the transition from one administration to
another.
Recommendation 2: Agencies should establish
and communicate clear and consistent
performance expectations for SES and SL/ST
employees that encompass meeting the
agency’s mission while also recognizing the
importance of maintaining a healthy work-life
balance. According to the Best Places to Work
in the Federal Government – a ranking of
federal agencies based on employees’ views
about job satisfaction and commitment –
effective leadership is the main driver of
employee satisfaction and commitment. In
addition, OPM’s government-wide Federal
Human Capital Survey – the biennial survey of
the federal workforce which serves as the
foundation of the Best Places rankings –
reported a significant decrease in satisfaction
with supervisor support for work-life balance.
As agencies strive to retain and attract top
performers for SES and SL/ST positions,
agencies must focus on building effective
leadership that achieves results while fostering
an environment that values work-life balance.
To help in this regard, agencies should publish
on their internal websites their SES
Performance Management Plans and any other
information describing the approach for
determining SES salaries and adjustments,
including specifics on the connection to job
performance.
Taking the Helm: Attracting the Next Generation of Federal Leaders Copyright 2010 by the Senior Executives Association and Avue Technologies Corporation. All Rights Reserved. The contents may not be extracted, copied, reproduced, or distributed in any form without the written consent of the Senior Executives Association and Avue Technologies Corporation.
45 | P a g e
Recommendation 3: OPM should annually
report data on the number of involuntary
geographic transfers under the SES mobility
provision, which could demonstrate to
potential candidates that such a reassignment
may be less likely to occur than they might
assume. Involuntary transfers do not appear to
occur in large numbers across the SES corps.
Still, potential candidates for senior positions
may fear this possible action and the
consequences for their professional careers and
personal lives. For example, dramatic
reductions in real estate values in some parts of
the country mean that a relocated employee,
who has to sell a house in today’s market, may
do so at a significant loss. Furthermore, moving
to a higher cost area with no locality pay could
be detrimental for many people. Regular and
up-to-date data on the number of involuntary
transfers of career SES members might
demonstrate to potential SES candidates that
such potential action is less likely to happen
than perceived. Potential job candidates for
SES positions could thus be less resistant to
considering and applying for these important
positions. In addition, agencies should ensure
that relocation assistance programs and
relocation bonuses are routinely available to
SES and SL/ST employees who are reassigned to
a position in a new geographic area.
Recommendation 4: OPM and agencies should
simplify the job application process for SES and
SL/ST positions while maintaining important
safeguards against politicization and
acceptance of unqualified candidates,
including the continued use of OPM
Qualifications Review Boards (QRBs) for SES
positions. The hiring process for SES positions
is viewed by many as complex and burdensome.
In OPM’s most recent survey of the SES, only 30
percent of respondents disagreed with the
statement, “The SES application process
discourages high-quality candidates from
applying.” The assessment process for SES
vacancies involves a QRB that reviews and
assesses the credentials of a recommended job
candidate and determines whether the
candidate has met the executive qualifications
required for entry into the SES. Each three-
person review board convened by OPM has at
least two career SES members and rotates, with
each member serving for short periods of time.
Independent peer review of applications
through the QRB process is imperative for
minimizing politicization of the SES and the
unfair appointment of unqualified persons who
are politically connected. In addition, agencies
should have succession plans in place to identify
positions before they become vacant, allowing
sufficient time to broadcast openings and
identify qualified candidates to fill the vacant
positions. Moreover, agency leaders should
place priority on ensuring that SES hiring is
completed within the 30-day goal outlined by
OPM. Any changes to the current hiring process
should ensure that job applicants face fewer
undue administrative burdens while making
certain that agencies have sufficient
information to determine qualifications of
applicants. Finally, agencies should have
sufficient resources to carry out the changes
and should continue to uphold merit system
principles.
Taking the Helm: Attracting the Next Generation of Federal Leaders Copyright 2010 by the Senior Executives Association and Avue Technologies Corporation. All Rights Reserved. The contents may not be extracted, copied, reproduced, or distributed in any form without the written consent of the Senior Executives Association and Avue Technologies Corporation.
46 | P a g e
Recommendation 5: OPM and agencies should
improve the selection process for SES positions
to ensure that these leaders have not only the
technical skills to succeed in the job but also
the interpersonal and executive skills
necessary to communicate and lead people
effectively. Technical qualifications are not
required for all SES positions, although
individual agencies can require technical
qualifications when filling their SES vacancies.
On the other hand, OPM has identified five
Executive Core Qualifications (ECQs) that are
mandatory for every SES position: Leading
Change, Leading People, Results Driven,
Business Acumen, and Building Coalitions.
Agencies should stress the importance of
Leading People in assessing candidates for SES
positions, as this competency appears to be a
key component of executive success according
to many GS-14/15 direct reports of SES
members. Having more effective leaders with
strong interpersonal and supervisory skills will
likely increase employee satisfaction and
commitment in agencies. OPM’s recently
issued rule (see Federal Register, Volume 74,
No. 236, pp. 65383-65390) should help in this
regard by requiring (1) mandatory training for
new supervisors within the first year on the job
and ongoing training at least once every 3 years
and (2) the preparation and use of an Executive
Development Plan (EDP) for each senior
executive to guide his or her continuous
learning. Congressional action should be taken
to provide funding for training and to ensure
agencies prioritize training and development
when budgets are tight. SEA supports giving
each senior executive an annual allowance of at
least $5,000 to cover his or her training and
development expenses.
Recommendation 6: OPM and agencies should
develop additional mechanisms for interested
and qualified GS-14/15 employees to obtain
valuable developmental experiences, including
within their current geographic areas rather
than requiring these individuals to relocate for
extended periods. Professional development
programs for aspiring SES and Senior
Professional employees are mostly
decentralized and sometimes haphazard.
Cabinet-level departments should conduct an
SES candidate development program at least
once every 3 years, and OPM should work with
smaller agencies to develop a joint candidate
development program to be used by these
smaller agencies to leverage economies of
scale. Additional mechanisms for development
could include inter-agency, inter-governmental,
and inter-sector rotation programs for GS-14/15
employees showing leadership potential. As an
example, the 28 Federal Executive Boards –
which serve as a forum for communication and
collaboration among federal agencies outside of
Washington, DC – could play a greater role in
facilitating the effort for federal employees
within their specific geographic areas to obtain
developmental experiences through short-term
rotations to other federal agencies in the same
geographic area.
Recommendation 7: Congress, OPM, and
agencies should make career SES and Senior
Professional positions more attractive to
potential candidates by increasing the
incentives for serving in these positions. Most
federal managers are more fundamentally
Taking the Helm: Attracting the Next Generation of Federal Leaders Copyright 2010 by the Senior Executives Association and Avue Technologies Corporation. All Rights Reserved. The contents may not be extracted, copied, reproduced, or distributed in any form without the written consent of the Senior Executives Association and Avue Technologies Corporation.
47 | P a g e
motivated by devotion to the mission than by
pay. No manager ignores his or her pay but the
question raised here is whether the relatively
marginal pay increments available to the SES,
especially when coupled with looming pay
compression, actually make any difference at
all, much less enough difference to overcome
the many perceived negatives associated with
senior leadership positions. To address this
issue, additional incentives for serving in SES
and Senior Professional positions should
include:
An assured annual increase for those rated fully successful or better. All SES and Senior Professionals who receive a rating of “fully successful” or higher should receive a mandatory annual adjustment to their salary. This adjustment should be equal to the total average increase awarded to General Schedule employees. The current pay system creates disincentives for GS-15 employees to apply for SES and Senior Professional positions. SES and SL/ST pay caps are linked to congressional salaries, and Congress can deny increases in these pay caps. SES members and Senior Professionals who have reached the pay cap cannot earn more, regardless of performance. It should be noted that under the current system all pay increases – even those based on performance – are totally discretionary to the agency. This recommendation will provide an assurance to Senior Executives and Senior Professionals that, with good performance, they will at least receive approximately the same increase as their subordinates. A minimum increase will also address the concerns of some that entry into the SES means a loss of locality pay.
Inclusion of performance awards and retention and recruitment allowances in retirement annuity calculations. Performance awards given to career senior leaders should be included in “high 3” average salary calculations for retirement. Performance awards are a significant part of senior-level compensation and should be further recognized as such by including them in retirement calculations. The existence of this incentive could well encourage many GS-14 and GS-15 employees to apply to SES and Senior Professional positions.
An assured increase of at least 5 percent in salary for new career executives and senior-level officials. For 2010, the minimum pay level for SES and SL/ST positions is $119,554. Conversely, the salary range for a GS-15 employee stationed in the Washington, DC locality area is $123,758 to $155,500. Given this situation, any person who is appointed to an SES or SL/ST position from the General Schedule should be assured a minimum salary increase of at least 5 percent over his or her current GS salary.
Recommendation 8: Congress should de-link
its pay from SES and Senior Professional pay to
help eliminate the growing problem that
permits some subordinates to earn more than
Senior Executives. As a result of legislation in
2004 and 2008, SES members and SL/ST
employees no longer receive either traditional
cost-of-living adjustments or locality pay. Thus,
GS-15 employees can earn more than career
executives. GS pay is increasingly overlapping
SES pay and, in fact, pay levels for political
appointees. For example, in the Washington,
D.C. locality area, pay for GS-15, step 10 now
Taking the Helm: Attracting the Next Generation of Federal Leaders Copyright 2010 by the Senior Executives Association and Avue Technologies Corporation. All Rights Reserved. The contents may not be extracted, copied, reproduced, or distributed in any form without the written consent of the Senior Executives Association and Avue Technologies Corporation.
48 | P a g e
equals Executive Schedule IV ($155,500), which
is the pay rate for Assistant Secretaries, as well
as the presidentially-appointed members of
such agencies as the National Labor Relations
Board and other commissions; this alone is a
disincentive for potential political appointees,
much less Senior Executives. Currently, the
minimum pay level for SES and Senior
Professional positions is $119,554 and the
maximum is $179,700 (Executive Schedule II) in
agencies with a certified performance appraisal
system. The maximum pay level for those
agencies not certified is $165,300 (Executive
Level III). The SES and Senior Professional pay
ceiling has not kept pace with General Schedule
pay adjustments, that is, adjustments for the
pay of employees these executives supervise. If
the Executive Schedule had kept pace with the
national comparability increases provided the
General Schedule since 1994, Executive Level II
(the cap for SES and SL/ST pay in certified
agencies) would be $248,182, not $179,700.
Recommendation 9: OPM and agencies should
increase their efforts to provide additional
information to federal employees about SES
and Senior Professional positions, including
the differences between these positions and
those under the General Schedule,
developmental opportunities for these
positions, and ways to position oneself to
apply for and succeed in these positions. A
lack of current and comprehensive information
about SES and Senior Professional positions
limits the ability of agencies to attract a sizeable
number of high-quality candidates to these
senior leadership positions. The additional
information about SES and SL/ST positions that
would likely prove to be useful includes the
specific differences between these positions
and those under the General Schedule,
developmental opportunities for these
positions, and ways to position oneself to apply
for and succeed in these positions. SEA
currently offers seminars to its members on the
differences between SES and SL/ST positions
and those under the General Schedule. SEA
also plans to offer future workshops and
training sessions for federal managers and
supervisors on ways to position oneself to apply
for and succeed in these senior leadership
positions.
Recommendation 10: OPM and agencies need
to coordinate and strengthen actions to
support diversity in the SES corps and other
senior-level positions while upholding merit
system principles. Past efforts to increase
diversity in the career SES corps have been
fragmented and without overall leadership
necessary for success. There is an absence of a
well-developed pipeline and the need to foster
a culture of leadership that values diversity.
SEA supports diversity legislation introduced in
2008 that seeks to identify methods of
increasing diversity in the career SES while
upholding merit system principles and not
creating further complications in appointing
practices. OPM’s newly re-established
executive resources office should play a key role
in ensuring that agencies are taking appropriate
actions to further diversity of the corps.
Agencies should be tasked to work with OPM to
eliminate barriers for minorities, women, and
individuals with disabilities to advance to the
SES. Agencies should also be required to have
Taking the Helm: Attracting the Next Generation of Federal Leaders Copyright 2010 by the Senior Executives Association and Avue Technologies Corporation. All Rights Reserved. The contents may not be extracted, copied, reproduced, or distributed in any form without the written consent of the Senior Executives Association and Avue Technologies Corporation.
49 | P a g e
annual plans approved by OPM that will help
assure a diverse SES, and agencies should be
expected to use diverse Executive Resources
Boards and selection panels to the extent
practicable.
Taking the Helm: Attracting the Next Generation of Federal Leaders Copyright 2010 by the Senior Executives Association and Avue Technologies Corporation. All Rights Reserved. The contents may not be extracted, copied, reproduced, or distributed in any form without the written consent of the Senior Executives Association and Avue Technologies Corporation.
50 | P a g e
Appendix I – Methodology
The following is a description of the
methodology that SEA and Avue used to gather
and analyze information for this report. This
description includes detailed information on the
protocols for the online survey of GS-14 and GS-
15 employees and their equivalents in the
federal government and the questionnaire for
members of the Chief Human Capital Officers
(CHCO) Council.
Survey of GS-14 and GS-15 Employees and
Their Equivalents
In the fall of 2008, SEA staff began developing
an initial draft survey for GS-14 and GS-15
employees and their equivalents in the federal
government to obtain their views and interests
related to applying for and serving in Senior
Executive Service (SES) positions. The draft
survey instrument was reviewed by the SEA
Board of Directors, which recommended a
number of changes to the survey wording. The
survey was then provided informally to several
human capital officials in the federal sector to
gauge their initial reactions to such a survey.
One significant comment provided to SEA
suggested that the survey include questions
about GS-14/15 employees’ interests and views
related to Senior Professional positions in
addition to SES positions; consequently, SEA
revised the survey to include questions about
Senior Professional positions. In late December
2008, the draft survey was provided to
representatives of the U.S. Office of Personnel
Management (OPM) and further changes were
made in response to this review. In the spring
of 2009, SEA worked with consultants from
Avue to input the draft survey to an online
instrument that would be accessible to
respondents through an Internet hyperlink. The
draft survey was pretested with 5 federal
employees at the GS-14/15 level and additional
revisions were made based on their feedback.
In June 2009, a screen-capture copy of the final
draft online survey was sent to representatives
of OPM, and a copy of the final survey was
submitted to the SEA Board for its review and
approval.
To access the online survey, respondents visited
the home page of the SEA website
(www.seniorexecs.org) and clicked on a
hyperlink that took the respondent to the Avue
website (www.avuecentral.com). SEA
recognized that GS-14/15 employees in some
agencies might have difficulties with computer
access to the online survey, and information
was included for telephone and e-mail technical
assistance provided by Avue; the other option
for GS-14/15 employees was to complete the
survey from a home computer. Upon entering
the online GS-14/15 survey, respondents were
given the option to choose whether they would
most likely consider application to a SES
position or a Senior Professional position,
assuming that they were to consider application
for a senior-level career position in the federal
government. In addition to questions asking
respondents about their views and interests
concerning career SES and Senior Professional
positions, the survey also solicited information
on job satisfaction, personal work and
professional development experiences, future
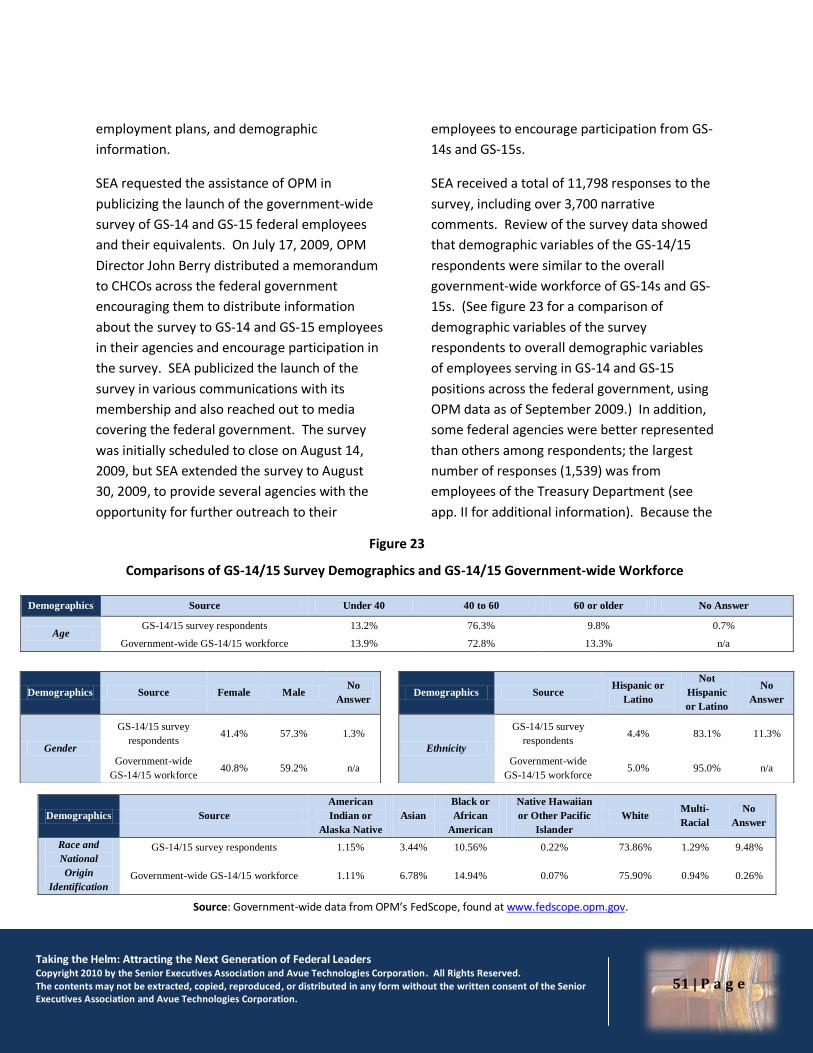
Taking the Helm: Attracting the Next Generation of Federal Leaders Copyright 2010 by the Senior Executives Association and Avue Technologies Corporation. All Rights Reserved. The contents may not be extracted, copied, reproduced, or distributed in any form without the written consent of the Senior Executives Association and Avue Technologies Corporation.
51 | P a g e
employment plans, and demographic
information.
SEA requested the assistance of OPM in
publicizing the launch of the government-wide
survey of GS-14 and GS-15 federal employees
and their equivalents. On July 17, 2009, OPM
Director John Berry distributed a memorandum
to CHCOs across the federal government
encouraging them to distribute information
about the survey to GS-14 and GS-15 employees
in their agencies and encourage participation in
the survey. SEA publicized the launch of the
survey in various communications with its
membership and also reached out to media
covering the federal government. The survey
was initially scheduled to close on August 14,
2009, but SEA extended the survey to August
30, 2009, to provide several agencies with the
opportunity for further outreach to their
employees to encourage participation from GS-
14s and GS-15s.
SEA received a total of 11,798 responses to the
survey, including over 3,700 narrative
comments. Review of the survey data showed
that demographic variables of the GS-14/15
respondents were similar to the overall
government-wide workforce of GS-14s and GS-
15s. (See figure 23 for a comparison of
demographic variables of the survey
respondents to overall demographic variables
of employees serving in GS-14 and GS-15
positions across the federal government, using
OPM data as of September 2009.) In addition,
some federal agencies were better represented
than others among respondents; the largest
number of responses (1,539) was from
employees of the Treasury Department (see
app. II for additional information). Because the
Demographics Source Under 40 40 to 60 60 or older No Answer
Age GS-14/15 survey respondents 13.2% 76.3% 9.8% 0.7%
Government-wide GS-14/15 workforce 13.9% 72.8% 13.3% n/a
Demographics Source Female Male No
Answer Demographics Source
Hispanic or
Latino
Not
Hispanic
or Latino
No
Answer
Gender
GS-14/15 survey
respondents 41.4% 57.3% 1.3%
Ethnicity
GS-14/15 survey
respondents 4.4% 83.1% 11.3%
Government-wide
GS-14/15 workforce 40.8% 59.2% n/a
Government-wide
GS-14/15 workforce 5.0% 95.0% n/a
Demographics Source
American
Indian or
Alaska Native
Asian
Black or
African
American
Native Hawaiian
or Other Pacific
Islander
White Multi-
Racial
No
Answer
Race and
National
Origin
Identification
GS-14/15 survey respondents 1.15% 3.44% 10.56% 0.22% 73.86% 1.29% 9.48%
Government-wide GS-14/15 workforce 1.11% 6.78% 14.94% 0.07% 75.90% 0.94% 0.26%
Figure 23
Comparisons of GS-14/15 Survey Demographics and GS-14/15 Government-wide Workforce
Source: Government-wide data from OPM’s FedScope, found at www.fedscope.opm.gov.
Taking the Helm: Attracting the Next Generation of Federal Leaders Copyright 2010 by the Senior Executives Association and Avue Technologies Corporation. All Rights Reserved. The contents may not be extracted, copied, reproduced, or distributed in any form without the written consent of the Senior Executives Association and Avue Technologies Corporation.
52 | P a g e
survey was not a random sample, the results
may not be+ representative of all GS-14 and GS-
15 employees and their equivalents in the
federal government. Nonetheless, the survey
results are instructive for identifying challenges
and possible solutions for ensuring that the
federal government is able to maintain an
outstanding cadre of federal career executives.
Questionnaire for Members of the CHCO
Council
In addition to the government-wide survey of
GS-14 and 15 employees and their equivalents,
SEA staff also began developing an initial draft
questionnaire in the fall of 2008 to ask
members of the federal Chief Human Capital
Officers (CHCO) Council about their views on
issues associated with attracting, hiring, and
retaining individuals for career SES and Senior
Professional positions. The draft questionnaire
was reviewed by the SEA Board of Directors,
which recommended a number of changes to
the survey wording. The questionnaire was
then provided informally to several human
capital officials in the federal sector to gauge
their initial reactions to the questionnaire. One
significant comment provided to SEA suggested
that SEA’s planned survey of GS-14/15
employees also include questions about GS-
14/15 employees’ interests and views related to
Senior Professional positions in addition to SES
positions; in response, SEA revised both the GS-
14/15 survey and CHCO questionnaire to
include questions about Senior Professional
positions. In late December 2008, the draft
questionnaire was provided to OPM
representatives and further changes were made
in response to this review. In June 2009, a copy
of the final draft questionnaire was sent to
representatives of OPM, and a copy of the final
questionnaire was submitted to the SEA Board
for its review and approval.
SEA requested the assistance of OPM in
distributing the CHCO questionnaire to
members of the CHCO Council. OPM Director
John Berry’s July 17, 2009 memorandum to
federal CHCOs included information about SEA’s
effort to survey CHCO Council members on
issues associated with attracting, hiring, and
retaining individuals for career SES and Senior
Professional positions. Specifically, the
questionnaire asked CHCO Council members for
their views about the quality of applicants for
career SES and Senior Professional positions,
potential challenges in hiring and retaining
employees for such positions, as well as various
attractors and detractors to serving in these
positions. The OPM memorandum included a
copy of the CHCO questionnaire that CHCO
Council members could complete and submit to
SEA via fax or mail. SEA sought responses from
24 Council members. OPM and OMB have two
representatives on the CHCO Council; SEA
sought only one survey response per agency.
The CHCO questionnaire was initially scheduled
to close on August 30, 2009, but SEA extended
the survey through the fall to allow additional
time for CHCO Council members to respond.
For those CHCOs who had not yet responded to
the questionnaire during that time, SEA made
several attempts to contact them and obtain
their input, including providing additional
copies of the questionnaire. (During this time,
SEA staff and Avue consultants analyzed the
survey data and approximately 3,700 narrative
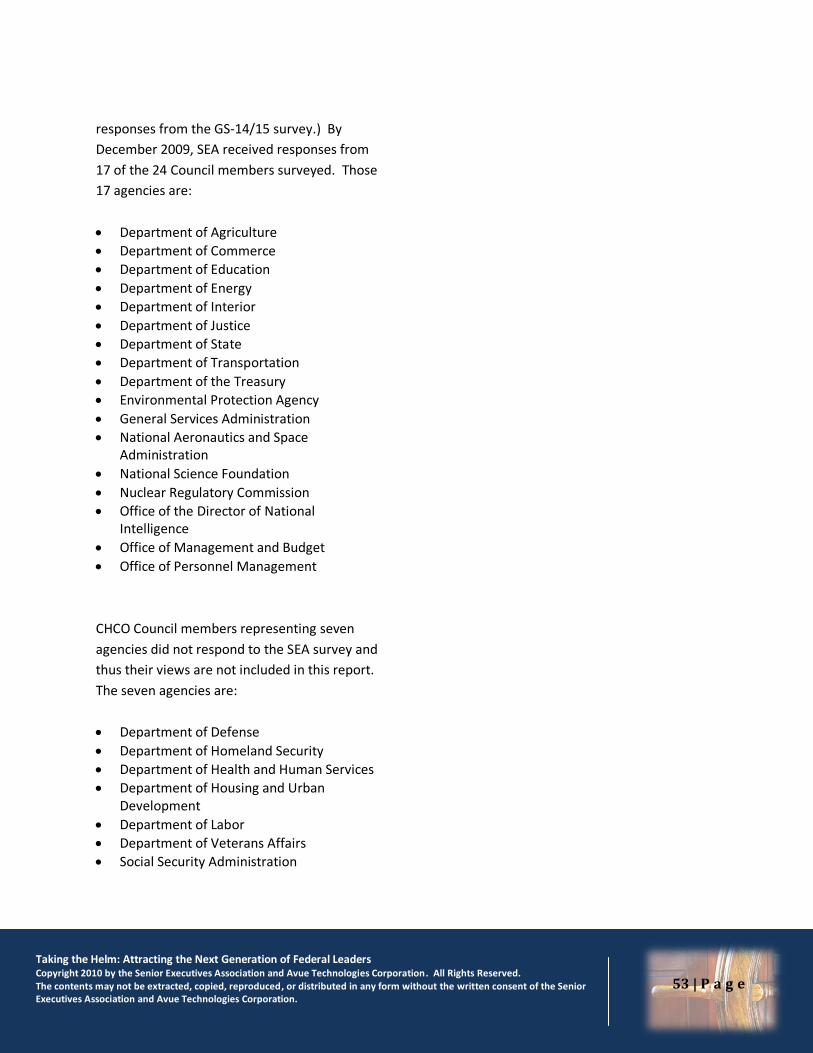
Taking the Helm: Attracting the Next Generation of Federal Leaders Copyright 2010 by the Senior Executives Association and Avue Technologies Corporation. All Rights Reserved. The contents may not be extracted, copied, reproduced, or distributed in any form without the written consent of the Senior Executives Association and Avue Technologies Corporation.
53 | P a g e
responses from the GS-14/15 survey.) By
December 2009, SEA received responses from
17 of the 24 Council members surveyed. Those
17 agencies are:
Department of Agriculture
Department of Commerce
Department of Education
Department of Energy
Department of Interior
Department of Justice
Department of State
Department of Transportation
Department of the Treasury
Environmental Protection Agency
General Services Administration
National Aeronautics and Space Administration
National Science Foundation
Nuclear Regulatory Commission
Office of the Director of National Intelligence
Office of Management and Budget
Office of Personnel Management
CHCO Council members representing seven
agencies did not respond to the SEA survey and
thus their views are not included in this report.
The seven agencies are:
Department of Defense
Department of Homeland Security
Department of Health and Human Services
Department of Housing and Urban Development
Department of Labor
Department of Veterans Affairs
Social Security Administration
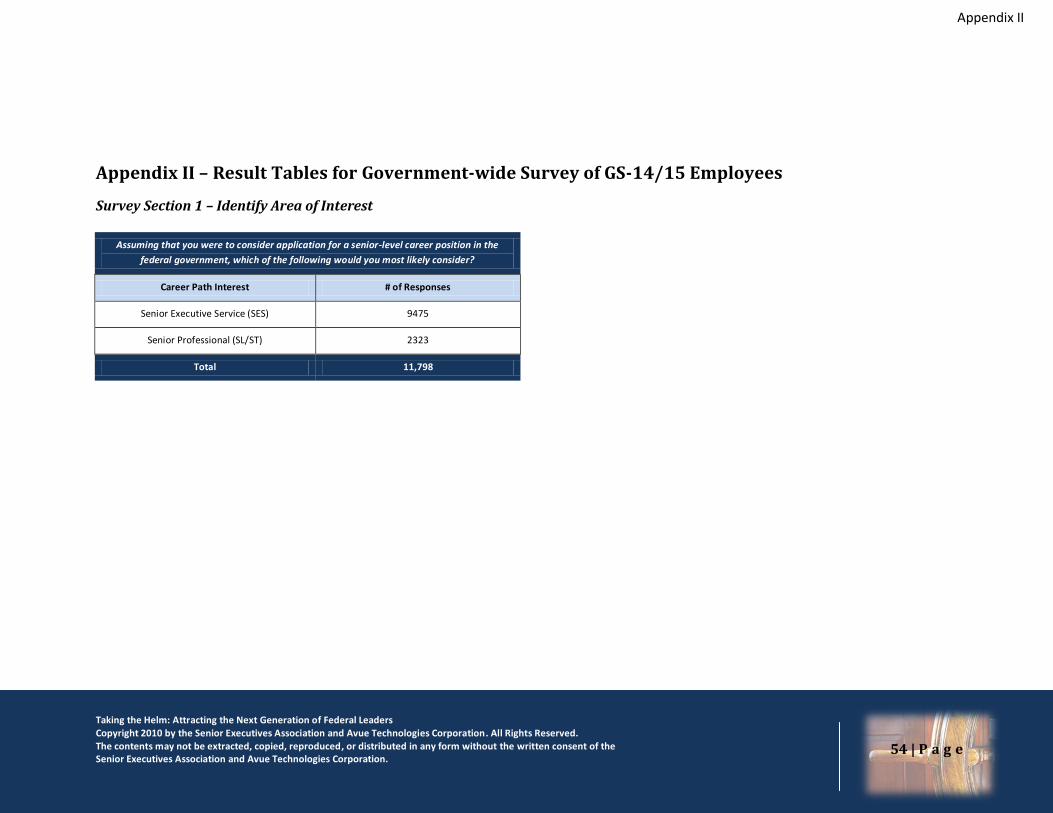
Taking the Helm: Attracting the Next Generation of Federal Leaders Copyright 2010 by the Senior Executives Association and Avue Technologies Corporation. All Rights Reserved. The contents may not be extracted, copied, reproduced, or distributed in any form without the written consent of the Senior Executives Association and Avue Technologies Corporation.
54 | P a g e
Appendix II – Result Tables for Government-wide Survey of GS-14/15 Employees
Survey Section 1 – Identify Area of Interest
Assuming that you were to consider application for a senior-level career position in the
federal government, which of the following would you most likely consider?
Career Path Interest # of Responses
Senior Executive Service (SES) 9475
Senior Professional (SL/ST) 2323
Total 11,798
Appendix II
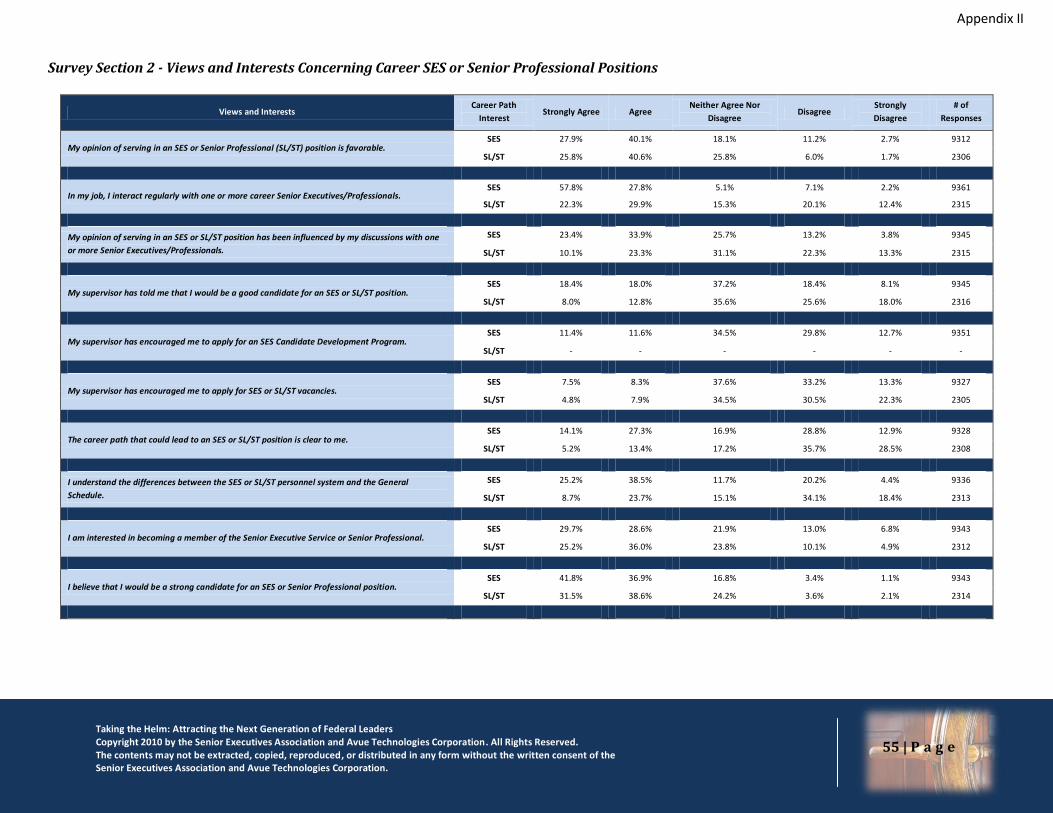
Taking the Helm: Attracting the Next Generation of Federal Leaders Copyright 2010 by the Senior Executives Association and Avue Technologies Corporation. All Rights Reserved. The contents may not be extracted, copied, reproduced, or distributed in any form without the written consent of the Senior Executives Association and Avue Technologies Corporation.
55 | P a g e
Survey Section 2 - Views and Interests Concerning Career SES or Senior Professional Positions
Views and Interests Career Path
Interest Strongly Agree Agree
Neither Agree Nor
Disagree Disagree
Strongly
Disagree
# of
Responses
My opinion of serving in an SES or Senior Professional (SL/ST) position is favorable. SES 27.9% 40.1% 18.1% 11.2% 2.7% 9312
SL/ST 25.8% 40.6% 25.8% 6.0% 1.7% 2306
In my job, I interact regularly with one or more career Senior Executives/Professionals. SES 57.8% 27.8% 5.1% 7.1% 2.2% 9361
SL/ST 22.3% 29.9% 15.3% 20.1% 12.4% 2315
My opinion of serving in an SES or SL/ST position has been influenced by my discussions with one
or more Senior Executives/Professionals.
SES 23.4% 33.9% 25.7% 13.2% 3.8% 9345
SL/ST 10.1% 23.3% 31.1% 22.3% 13.3% 2315
My supervisor has told me that I would be a good candidate for an SES or SL/ST position. SES 18.4% 18.0% 37.2% 18.4% 8.1% 9345
SL/ST 8.0% 12.8% 35.6% 25.6% 18.0% 2316
My supervisor has encouraged me to apply for an SES Candidate Development Program. SES 11.4% 11.6% 34.5% 29.8% 12.7% 9351
SL/ST - - - - - -
My supervisor has encouraged me to apply for SES or SL/ST vacancies. SES 7.5% 8.3% 37.6% 33.2% 13.3% 9327
SL/ST 4.8% 7.9% 34.5% 30.5% 22.3% 2305
The career path that could lead to an SES or SL/ST position is clear to me. SES 14.1% 27.3% 16.9% 28.8% 12.9% 9328
SL/ST 5.2% 13.4% 17.2% 35.7% 28.5% 2308
I understand the differences between the SES or SL/ST personnel system and the General
Schedule.
SES 25.2% 38.5% 11.7% 20.2% 4.4% 9336
SL/ST 8.7% 23.7% 15.1% 34.1% 18.4% 2313
I am interested in becoming a member of the Senior Executive Service or Senior Professional. SES 29.7% 28.6% 21.9% 13.0% 6.8% 9343
SL/ST 25.2% 36.0% 23.8% 10.1% 4.9% 2312
I believe that I would be a strong candidate for an SES or Senior Professional position. SES 41.8% 36.9% 16.8% 3.4% 1.1% 9343
SL/ST 31.5% 38.6% 24.2% 3.6% 2.1% 2314
Appendix II
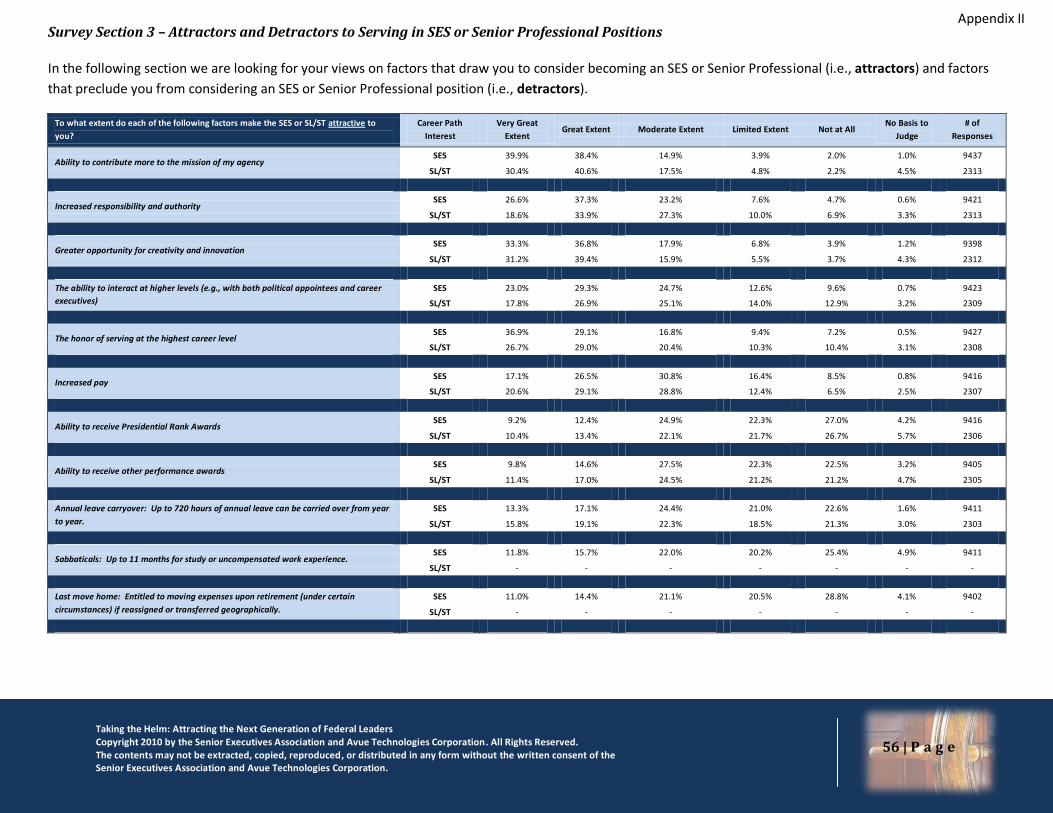
Taking the Helm: Attracting the Next Generation of Federal Leaders Copyright 2010 by the Senior Executives Association and Avue Technologies Corporation. All Rights Reserved. The contents may not be extracted, copied, reproduced, or distributed in any form without the written consent of the Senior Executives Association and Avue Technologies Corporation.
56 | P a g e
Survey Section 3 – Attractors and Detractors to Serving in SES or Senior Professional Positions
In the following section we are looking for your views on factors that draw you to consider becoming an SES or Senior Professional (i.e., attractors) and factors
that preclude you from considering an SES or Senior Professional position (i.e., detractors).
To what extent do each of the following factors make the SES or SL/ST attractive to
you?
Career Path
Interest
Very Great
Extent Great Extent Moderate Extent Limited Extent Not at All
No Basis to
Judge
# of
Responses
Ability to contribute more to the mission of my agency SES 39.9% 38.4% 14.9% 3.9% 2.0% 1.0% 9437
SL/ST 30.4% 40.6% 17.5% 4.8% 2.2% 4.5% 2313
Increased responsibility and authority SES 26.6% 37.3% 23.2% 7.6% 4.7% 0.6% 9421
SL/ST 18.6% 33.9% 27.3% 10.0% 6.9% 3.3% 2313
Greater opportunity for creativity and innovation SES 33.3% 36.8% 17.9% 6.8% 3.9% 1.2% 9398
SL/ST 31.2% 39.4% 15.9% 5.5% 3.7% 4.3% 2312
The ability to interact at higher levels (e.g., with both political appointees and career
executives)
SES 23.0% 29.3% 24.7% 12.6% 9.6% 0.7% 9423
SL/ST 17.8% 26.9% 25.1% 14.0% 12.9% 3.2% 2309
The honor of serving at the highest career level SES 36.9% 29.1% 16.8% 9.4% 7.2% 0.5% 9427
SL/ST 26.7% 29.0% 20.4% 10.3% 10.4% 3.1% 2308
Increased pay SES 17.1% 26.5% 30.8% 16.4% 8.5% 0.8% 9416
SL/ST 20.6% 29.1% 28.8% 12.4% 6.5% 2.5% 2307
Ability to receive Presidential Rank Awards SES 9.2% 12.4% 24.9% 22.3% 27.0% 4.2% 9416
SL/ST 10.4% 13.4% 22.1% 21.7% 26.7% 5.7% 2306
Ability to receive other performance awards SES 9.8% 14.6% 27.5% 22.3% 22.5% 3.2% 9405
SL/ST 11.4% 17.0% 24.5% 21.2% 21.2% 4.7% 2305
Annual leave carryover: Up to 720 hours of annual leave can be carried over from year
to year.
SES 13.3% 17.1% 24.4% 21.0% 22.6% 1.6% 9411
SL/ST 15.8% 19.1% 22.3% 18.5% 21.3% 3.0% 2303
Sabbaticals: Up to 11 months for study or uncompensated work experience. SES 11.8% 15.7% 22.0% 20.2% 25.4% 4.9% 9411
SL/ST - - - - - - -
Last move home: Entitled to moving expenses upon retirement (under certain
circumstances) if reassigned or transferred geographically.
SES 11.0% 14.4% 21.1% 20.5% 28.8% 4.1% 9402
SL/ST - - - - - - -
Appendix II
Appendix II
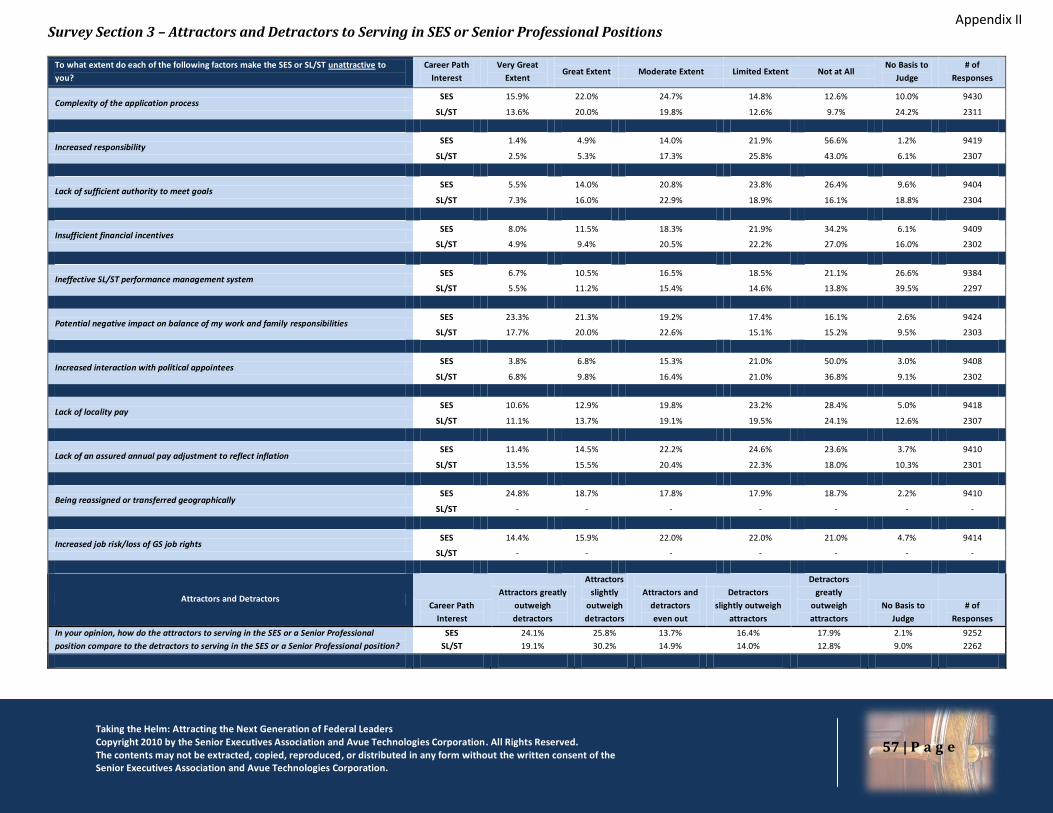
Taking the Helm: Attracting the Next Generation of Federal Leaders Copyright 2010 by the Senior Executives Association and Avue Technologies Corporation. All Rights Reserved. The contents may not be extracted, copied, reproduced, or distributed in any form without the written consent of the Senior Executives Association and Avue Technologies Corporation.
57 | P a g e
Survey Section 3 – Attractors and Detractors to Serving in SES or Senior Professional Positions
To what extent do each of the following factors make the SES or SL/ST unattractive to
you?
Career Path
Interest
Very Great
Extent Great Extent Moderate Extent Limited Extent Not at All
No Basis to
Judge
# of
Responses
Complexity of the application process SES 15.9% 22.0% 24.7% 14.8% 12.6% 10.0% 9430
SL/ST 13.6% 20.0% 19.8% 12.6% 9.7% 24.2% 2311
Increased responsibility SES 1.4% 4.9% 14.0% 21.9% 56.6% 1.2% 9419
SL/ST 2.5% 5.3% 17.3% 25.8% 43.0% 6.1% 2307
Lack of sufficient authority to meet goals SES 5.5% 14.0% 20.8% 23.8% 26.4% 9.6% 9404
SL/ST 7.3% 16.0% 22.9% 18.9% 16.1% 18.8% 2304
Insufficient financial incentives SES 8.0% 11.5% 18.3% 21.9% 34.2% 6.1% 9409
SL/ST 4.9% 9.4% 20.5% 22.2% 27.0% 16.0% 2302
Ineffective SL/ST performance management system SES 6.7% 10.5% 16.5% 18.5% 21.1% 26.6% 9384
SL/ST 5.5% 11.2% 15.4% 14.6% 13.8% 39.5% 2297
Potential negative impact on balance of my work and family responsibilities SES 23.3% 21.3% 19.2% 17.4% 16.1% 2.6% 9424
SL/ST 17.7% 20.0% 22.6% 15.1% 15.2% 9.5% 2303
Increased interaction with political appointees SES 3.8% 6.8% 15.3% 21.0% 50.0% 3.0% 9408
SL/ST 6.8% 9.8% 16.4% 21.0% 36.8% 9.1% 2302
Lack of locality pay SES 10.6% 12.9% 19.8% 23.2% 28.4% 5.0% 9418
SL/ST 11.1% 13.7% 19.1% 19.5% 24.1% 12.6% 2307
Lack of an assured annual pay adjustment to reflect inflation SES 11.4% 14.5% 22.2% 24.6% 23.6% 3.7% 9410
SL/ST 13.5% 15.5% 20.4% 22.3% 18.0% 10.3% 2301
Being reassigned or transferred geographically SES 24.8% 18.7% 17.8% 17.9% 18.7% 2.2% 9410
SL/ST - - - - - - -
Increased job risk/loss of GS job rights SES 14.4% 15.9% 22.0% 22.0% 21.0% 4.7% 9414
SL/ST - - - - - - -
Attractors and Detractors Career Path
Interest
Attractors greatly
outweigh
detractors
Attractors
slightly
outweigh
detractors
Attractors and
detractors
even out
Detractors
slightly outweigh
attractors
Detractors
greatly
outweigh
attractors
No Basis to
Judge
# of
Responses
In your opinion, how do the attractors to serving in the SES or a Senior Professional
position compare to the detractors to serving in the SES or a Senior Professional position?
SES 24.1% 25.8% 13.7% 16.4% 17.9% 2.1% 9252
SL/ST 19.1% 30.2% 14.9% 14.0% 12.8% 9.0% 2262
Appendix II
Appendix II
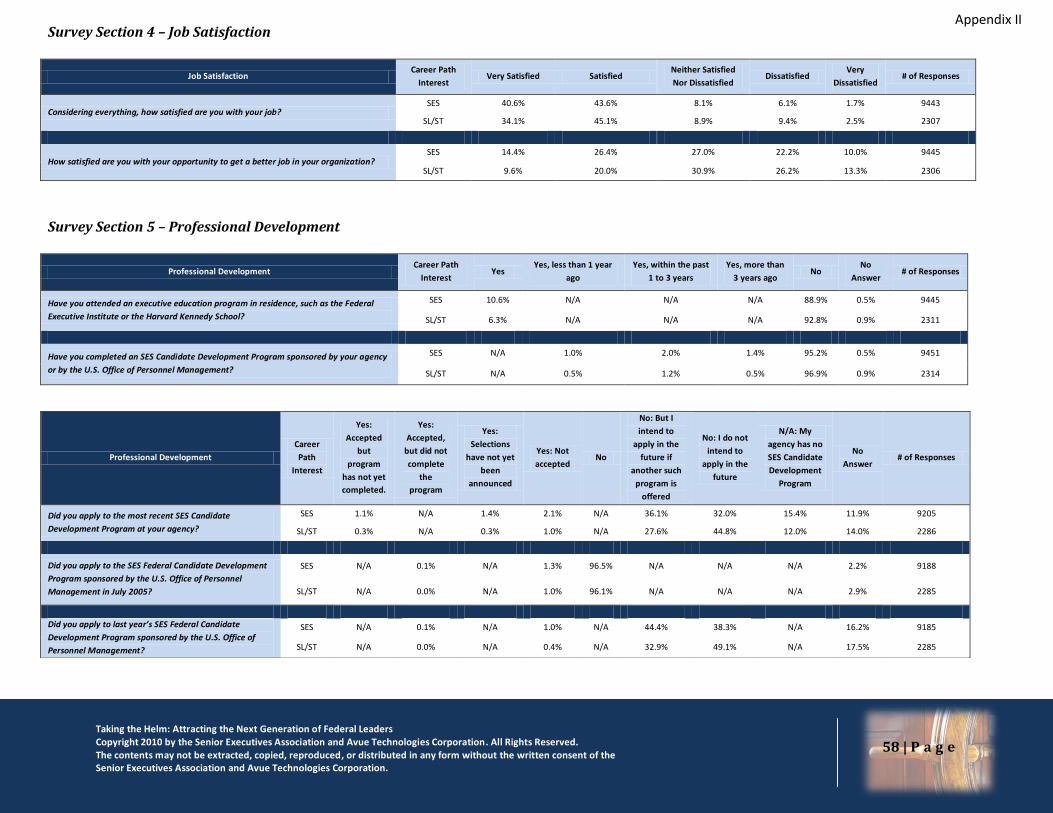
Taking the Helm: Attracting the Next Generation of Federal Leaders Copyright 2010 by the Senior Executives Association and Avue Technologies Corporation. All Rights Reserved. The contents may not be extracted, copied, reproduced, or distributed in any form without the written consent of the Senior Executives Association and Avue Technologies Corporation.
58 | P a g e
Survey Section 4 – Job Satisfaction
Job Satisfaction Career Path
Interest Very Satisfied Satisfied
Neither Satisfied
Nor Dissatisfied Dissatisfied
Very
Dissatisfied # of Responses
Considering everything, how satisfied are you with your job? SES 40.6% 43.6% 8.1% 6.1% 1.7% 9443
SL/ST 34.1% 45.1% 8.9% 9.4% 2.5% 2307
How satisfied are you with your opportunity to get a better job in your organization? SES 14.4% 26.4% 27.0% 22.2% 10.0% 9445
SL/ST 9.6% 20.0% 30.9% 26.2% 13.3% 2306
Survey Section 5 – Professional Development
Professional Development Career Path
Interest Yes
Yes, less than 1 year
ago
Yes, within the past
1 to 3 years
Yes, more than
3 years ago No
No
Answer # of Responses
Have you attended an executive education program in residence, such as the Federal
Executive Institute or the Harvard Kennedy School?
SES 10.6% N/A N/A N/A 88.9% 0.5% 9445
SL/ST 6.3% N/A N/A N/A 92.8% 0.9% 2311
Have you completed an SES Candidate Development Program sponsored by your agency
or by the U.S. Office of Personnel Management?
SES N/A 1.0% 2.0% 1.4% 95.2% 0.5% 9451
SL/ST N/A 0.5% 1.2% 0.5% 96.9% 0.9% 2314
Professional Development
Career
Path
Interest
Yes:
Accepted
but
program
has not yet
completed.
Yes:
Accepted,
but did not
complete
the
program
Yes:
Selections
have not yet
been
announced
Yes: Not
accepted No
No: But I
intend to
apply in the
future if
another such
program is
offered
No: I do not
intend to
apply in the
future
N/A: My
agency has no
SES Candidate
Development
Program
No
Answer # of Responses
Did you apply to the most recent SES Candidate
Development Program at your agency?
SES 1.1% N/A 1.4% 2.1% N/A 36.1% 32.0% 15.4% 11.9% 9205
SL/ST 0.3% N/A 0.3% 1.0% N/A 27.6% 44.8% 12.0% 14.0% 2286
Did you apply to the SES Federal Candidate Development
Program sponsored by the U.S. Office of Personnel
Management in July 2005?
SES N/A 0.1% N/A 1.3% 96.5% N/A N/A N/A 2.2% 9188
SL/ST N/A 0.0% N/A 1.0% 96.1% N/A N/A N/A 2.9% 2285
Did you apply to last year’s SES Federal Candidate
Development Program sponsored by the U.S. Office of
Personnel Management?
SES N/A 0.1% N/A 1.0% N/A 44.4% 38.3% N/A 16.2% 9185
SL/ST N/A 0.0% N/A 0.4% N/A 32.9% 49.1% N/A 17.5% 2285
Appendix II
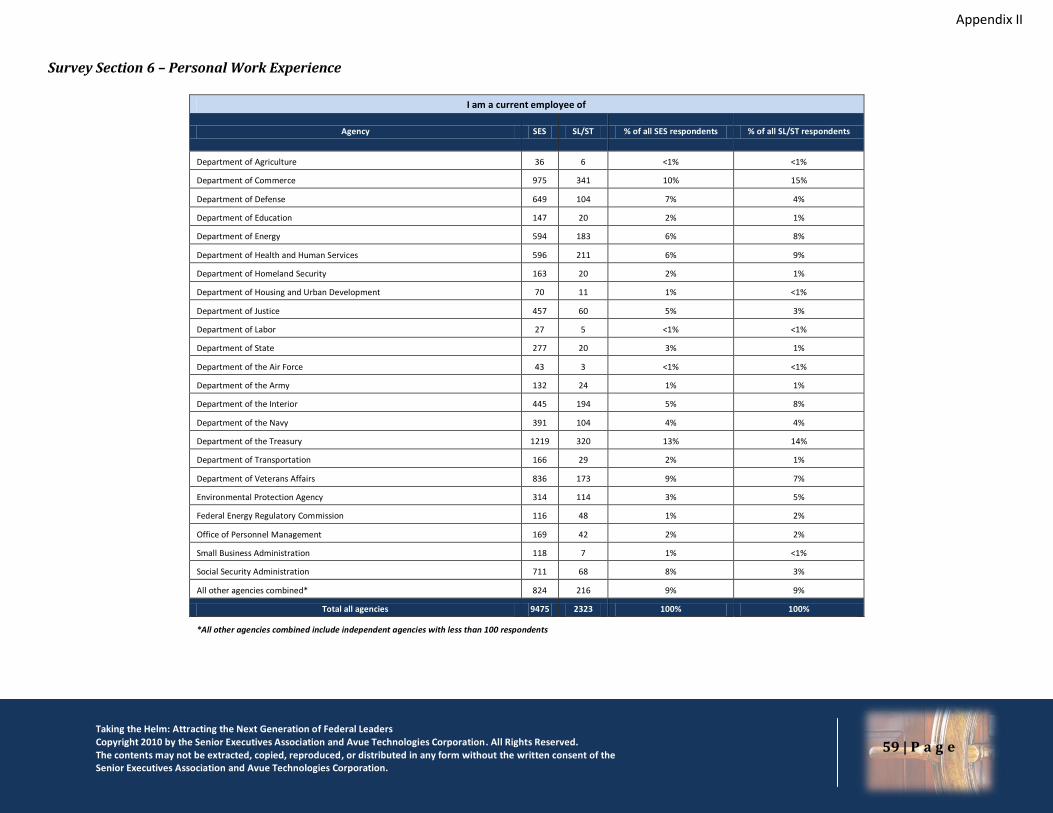
Taking the Helm: Attracting the Next Generation of Federal Leaders Copyright 2010 by the Senior Executives Association and Avue Technologies Corporation. All Rights Reserved. The contents may not be extracted, copied, reproduced, or distributed in any form without the written consent of the Senior Executives Association and Avue Technologies Corporation.
59 | P a g e
Survey Section 6 – Personal Work Experience
I am a current employee of
Agency SES SL/ST % of all SES respondents % of all SL/ST respondents
Department of Agriculture 36 6 <1% <1%
Department of Commerce 975 341 10% 15%
Department of Defense 649 104 7% 4%
Department of Education 147 20 2% 1%
Department of Energy 594 183 6% 8%
Department of Health and Human Services 596 211 6% 9%
Department of Homeland Security 163 20 2% 1%
Department of Housing and Urban Development 70 11 1% <1%
Department of Justice 457 60 5% 3%
Department of Labor 27 5 <1% <1%
Department of State 277 20 3% 1%
Department of the Air Force 43 3 <1% <1%
Department of the Army 132 24 1% 1%
Department of the Interior 445 194 5% 8%
Department of the Navy 391 104 4% 4%
Department of the Treasury 1219 320 13% 14%
Department of Transportation 166 29 2% 1%
Department of Veterans Affairs 836 173 9% 7%
Environmental Protection Agency 314 114 3% 5%
Federal Energy Regulatory Commission 116 48 1% 2%
Office of Personnel Management 169 42 2% 2%
Small Business Administration 118 7 1% <1%
Social Security Administration 711 68 8% 3%
All other agencies combined* 824 216 9% 9%
Total all agencies 9475 2323 100% 100%
*All other agencies combined include independent agencies with less than 100 respondents
Appendix II
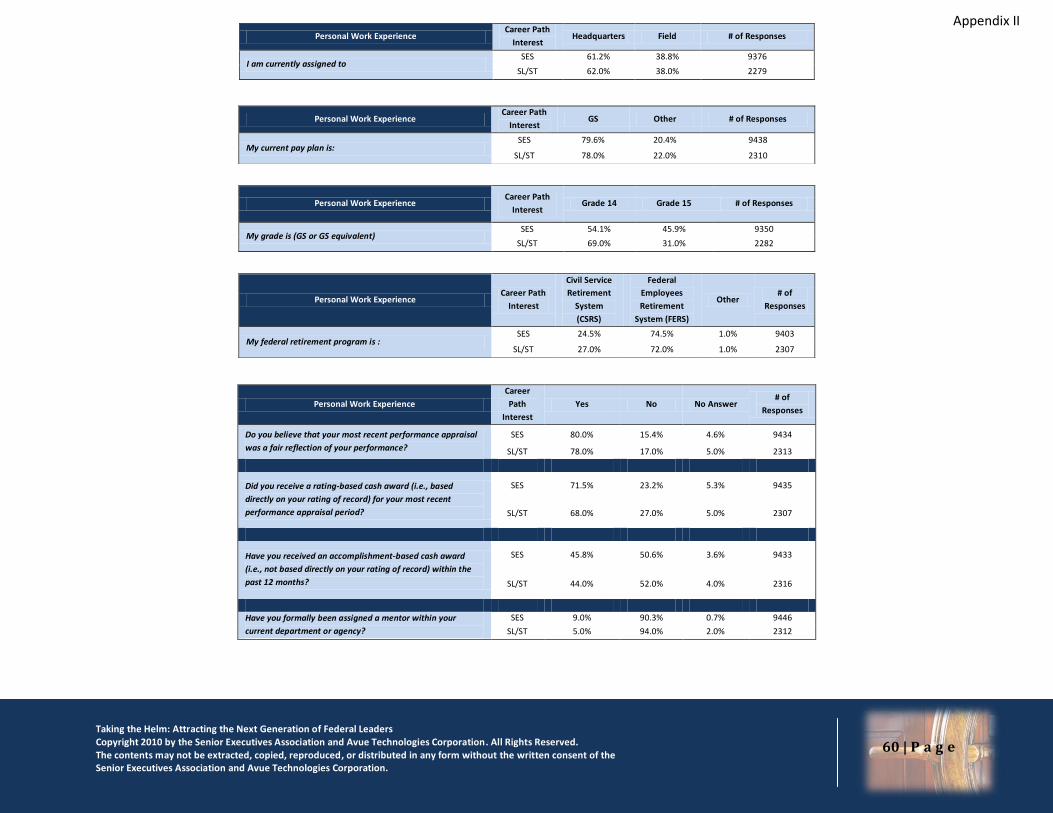
Taking the Helm: Attracting the Next Generation of Federal Leaders Copyright 2010 by the Senior Executives Association and Avue Technologies Corporation. All Rights Reserved. The contents may not be extracted, copied, reproduced, or distributed in any form without the written consent of the Senior Executives Association and Avue Technologies Corporation.
60 | P a g e
Personal Work Experience Career Path
Interest Headquarters Field # of Responses
I am currently assigned to SES 61.2% 38.8% 9376
SL/ST 62.0% 38.0% 2279
Personal Work Experience
Career
Path
Interest
Yes No No Answer # of
Responses
Do you believe that your most recent performance appraisal
was a fair reflection of your performance?
SES 80.0% 15.4% 4.6% 9434
SL/ST 78.0% 17.0% 5.0% 2313
Did you receive a rating-based cash award (i.e., based
directly on your rating of record) for your most recent
performance appraisal period?
SES 71.5% 23.2% 5.3% 9435
SL/ST 68.0% 27.0% 5.0% 2307
Have you received an accomplishment-based cash award
(i.e., not based directly on your rating of record) within the
past 12 months?
SES 45.8% 50.6% 3.6% 9433
SL/ST 44.0% 52.0% 4.0% 2316
Have you formally been assigned a mentor within your
current department or agency?
SES 9.0% 90.3% 0.7% 9446
SL/ST 5.0% 94.0% 2.0% 2312
Personal Work Experience Career Path
Interest GS Other # of Responses
My current pay plan is: SES 79.6% 20.4% 9438
SL/ST 78.0% 22.0% 2310
Personal Work Experience Career Path
Interest Grade 14 Grade 15 # of Responses
My grade is (GS or GS equivalent) SES 54.1% 45.9% 9350
SL/ST 69.0% 31.0% 2282
Personal Work Experience Career Path
Interest
Civil Service
Retirement
System
(CSRS)
Federal
Employees
Retirement
System (FERS)
Other # of
Responses
My federal retirement program is : SES 24.5% 74.5% 1.0% 9403
SL/ST 27.0% 72.0% 1.0% 2307
Appendix II
Appendix II
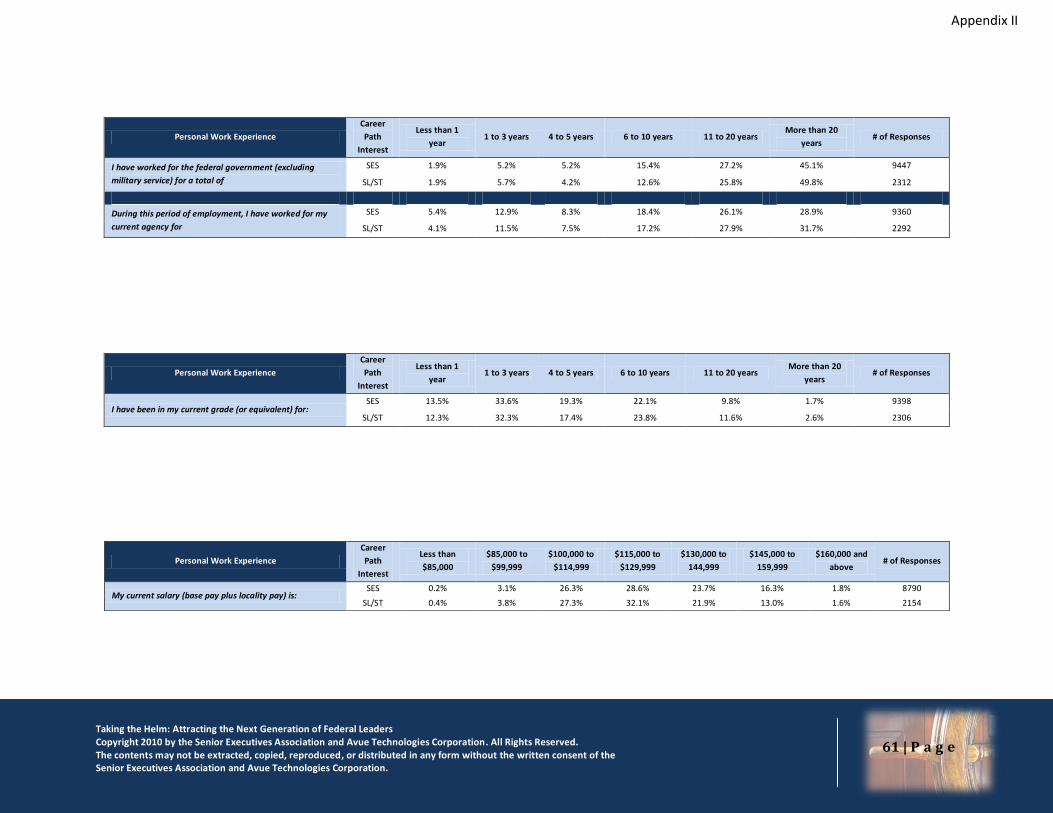
Taking the Helm: Attracting the Next Generation of Federal Leaders Copyright 2010 by the Senior Executives Association and Avue Technologies Corporation. All Rights Reserved. The contents may not be extracted, copied, reproduced, or distributed in any form without the written consent of the Senior Executives Association and Avue Technologies Corporation.
61 | P a g e
Personal Work Experience
Career
Path
Interest
Less than 1
year 1 to 3 years 4 to 5 years 6 to 10 years 11 to 20 years
More than 20
years # of Responses
I have worked for the federal government (excluding
military service) for a total of
SES 1.9% 5.2% 5.2% 15.4% 27.2% 45.1% 9447
SL/ST 1.9% 5.7% 4.2% 12.6% 25.8% 49.8% 2312
During this period of employment, I have worked for my
current agency for
SES 5.4% 12.9% 8.3% 18.4% 26.1% 28.9% 9360
SL/ST 4.1% 11.5% 7.5% 17.2% 27.9% 31.7% 2292
Personal Work Experience
Career
Path
Interest
Less than 1
year 1 to 3 years 4 to 5 years 6 to 10 years 11 to 20 years
More than 20
years # of Responses
I have been in my current grade (or equivalent) for: SES 13.5% 33.6% 19.3% 22.1% 9.8% 1.7% 9398
SL/ST 12.3% 32.3% 17.4% 23.8% 11.6% 2.6% 2306
Personal Work Experience
Career
Path
Interest
Less than
$85,000
$85,000 to
$99,999
$100,000 to
$114,999
$115,000 to
$129,999
$130,000 to
144,999
$145,000 to
159,999
$160,000 and
above # of Responses
My current salary (base pay plus locality pay) is: SES 0.2% 3.1% 26.3% 28.6% 23.7% 16.3% 1.8% 8790
SL/ST 0.4% 3.8% 27.3% 32.1% 21.9% 13.0% 1.6% 2154
Appendix II
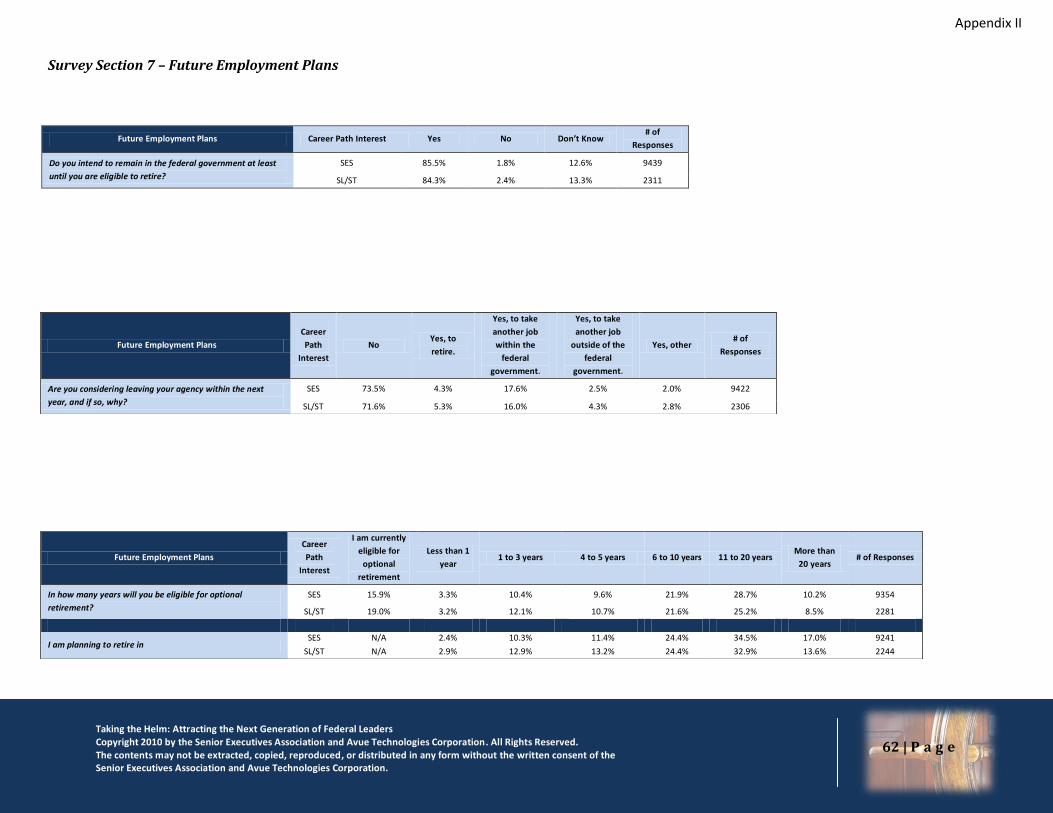
Taking the Helm: Attracting the Next Generation of Federal Leaders Copyright 2010 by the Senior Executives Association and Avue Technologies Corporation. All Rights Reserved. The contents may not be extracted, copied, reproduced, or distributed in any form without the written consent of the Senior Executives Association and Avue Technologies Corporation.
62 | P a g e
Survey Section 7 – Future Employment Plans
Future Employment Plans Career Path Interest Yes No Don’t Know # of
Responses
Do you intend to remain in the federal government at least
until you are eligible to retire?
SES 85.5% 1.8% 12.6% 9439
SL/ST 84.3% 2.4% 13.3% 2311
Future Employment Plans
Career
Path
Interest
No Yes, to
retire.
Yes, to take
another job
within the
federal
government.
Yes, to take
another job
outside of the
federal
government.
Yes, other # of
Responses
Are you considering leaving your agency within the next
year, and if so, why?
SES 73.5% 4.3% 17.6% 2.5% 2.0% 9422
SL/ST 71.6% 5.3% 16.0% 4.3% 2.8% 2306
Future Employment Plans
Career
Path
Interest
I am currently
eligible for
optional
retirement
Less than 1
year 1 to 3 years 4 to 5 years 6 to 10 years 11 to 20 years
More than
20 years # of Responses
In how many years will you be eligible for optional
retirement?
SES 15.9% 3.3% 10.4% 9.6% 21.9% 28.7% 10.2% 9354
SL/ST 19.0% 3.2% 12.1% 10.7% 21.6% 25.2% 8.5% 2281
I am planning to retire in SES N/A 2.4% 10.3% 11.4% 24.4% 34.5% 17.0% 9241
SL/ST N/A 2.9% 12.9% 13.2% 24.4% 32.9% 13.6% 2244
Appendix II
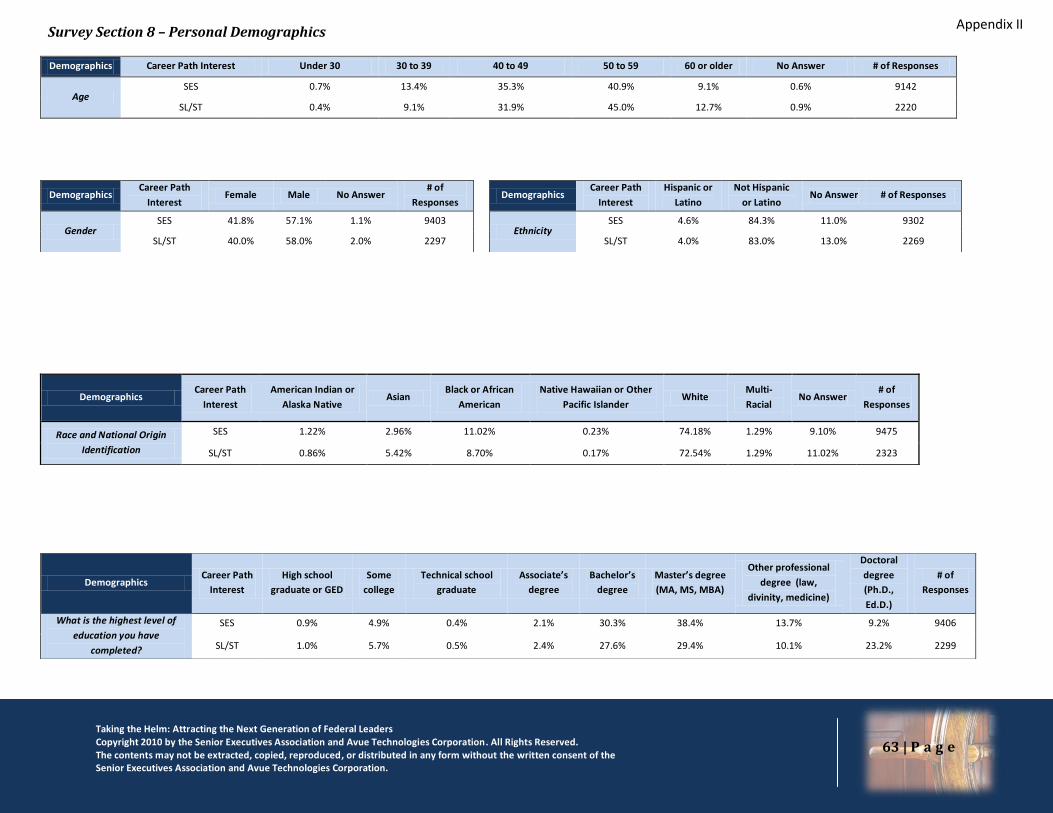
Taking the Helm: Attracting the Next Generation of Federal Leaders Copyright 2010 by the Senior Executives Association and Avue Technologies Corporation. All Rights Reserved. The contents may not be extracted, copied, reproduced, or distributed in any form without the written consent of the Senior Executives Association and Avue Technologies Corporation.
63 | P a g e
Survey Section 8 – Personal Demographics
Demographics Career Path Interest Under 30 30 to 39 40 to 49 50 to 59 60 or older No Answer # of Responses
Age SES 0.7% 13.4% 35.3% 40.9% 9.1% 0.6% 9142
SL/ST 0.4% 9.1% 31.9% 45.0% 12.7% 0.9% 2220
Demographics Career Path
Interest Female Male No Answer
# of
Responses Demographics
Career Path
Interest
Hispanic or
Latino
Not Hispanic
or Latino No Answer # of Responses
Gender SES 41.8% 57.1% 1.1% 9403
Ethnicity SES 4.6% 84.3% 11.0% 9302
SL/ST 40.0% 58.0% 2.0% 2297 SL/ST 4.0% 83.0% 13.0% 2269
Demographics Career Path
Interest
High school
graduate or GED
Some
college
Technical school
graduate
Associate’s
degree
Bachelor’s
degree
Master’s degree
(MA, MS, MBA)
Other professional
degree (law,
divinity, medicine)
Doctoral
degree
(Ph.D.,
Ed.D.)
# of
Responses
What is the highest level of
education you have
completed?
SES 0.9% 4.9% 0.4% 2.1% 30.3% 38.4% 13.7% 9.2% 9406
SL/ST 1.0% 5.7% 0.5% 2.4% 27.6% 29.4% 10.1% 23.2% 2299
Demographics Career Path
Interest
American Indian or
Alaska Native Asian
Black or African
American
Native Hawaiian or Other
Pacific Islander White
Multi-
Racial No Answer
# of
Responses
Race and National Origin
Identification
SES 1.22% 2.96% 11.02% 0.23% 74.18% 1.29% 9.10% 9475
SL/ST 0.86% 5.42% 8.70% 0.17% 72.54% 1.29% 11.02% 2323
Appendix II
Appendix II
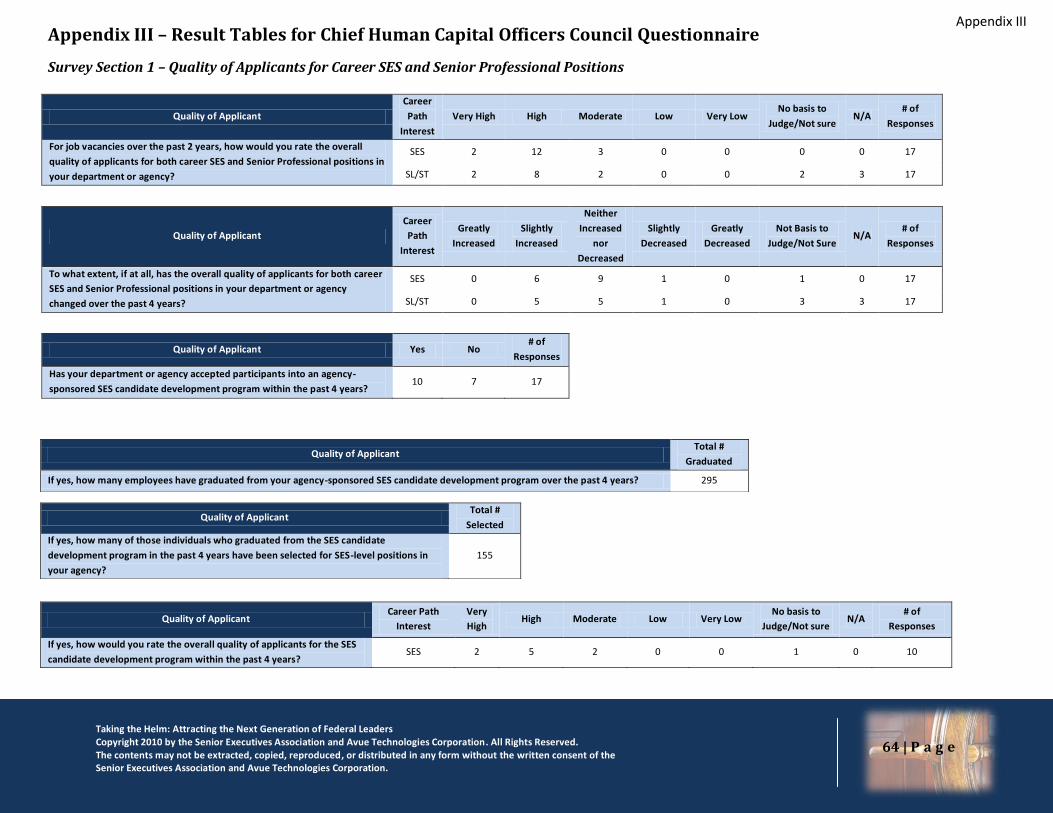
Taking the Helm: Attracting the Next Generation of Federal Leaders Copyright 2010 by the Senior Executives Association and Avue Technologies Corporation. All Rights Reserved. The contents may not be extracted, copied, reproduced, or distributed in any form without the written consent of the Senior Executives Association and Avue Technologies Corporation.
64 | P a g e
Appendix III – Result Tables for Chief Human Capital Officers Council Questionnaire
Survey Section 1 – Quality of Applicants for Career SES and Senior Professional Positions
Quality of Applicant
Career
Path
Interest
Very High High Moderate Low Very Low No basis to
Judge/Not sure N/A
# of
Responses
For job vacancies over the past 2 years, how would you rate the overall
quality of applicants for both career SES and Senior Professional positions in
your department or agency?
SES 2 12 3 0 0 0 0 17
SL/ST 2 8 2 0 0 2 3 17
Quality of Applicant
Career
Path
Interest
Greatly
Increased
Slightly
Increased
Neither
Increased
nor
Decreased
Slightly
Decreased
Greatly
Decreased
Not Basis to
Judge/Not Sure N/A
# of
Responses
To what extent, if at all, has the overall quality of applicants for both career
SES and Senior Professional positions in your department or agency
changed over the past 4 years?
SES 0 6 9 1 0 1 0 17
SL/ST 0 5 5 1 0 3 3 17
Quality of Applicant Yes No # of
Responses Has your department or agency accepted participants into an agency-
sponsored SES candidate development program within the past 4 years? 10 7 17
Quality of Applicant Total #
Graduated
If yes, how many employees have graduated from your agency-sponsored SES candidate development program over the past 4 years? 295
Quality of Applicant Total #
Selected
If yes, how many of those individuals who graduated from the SES candidate
development program in the past 4 years have been selected for SES-level positions in
your agency?
155
Quality of Applicant Career Path
Interest
Very
High High Moderate Low Very Low
No basis to
Judge/Not sure N/A
# of
Responses
If yes, how would you rate the overall quality of applicants for the SES
candidate development program within the past 4 years? SES 2 5 2 0 0 1 0 10
Appendix III
Appendix III
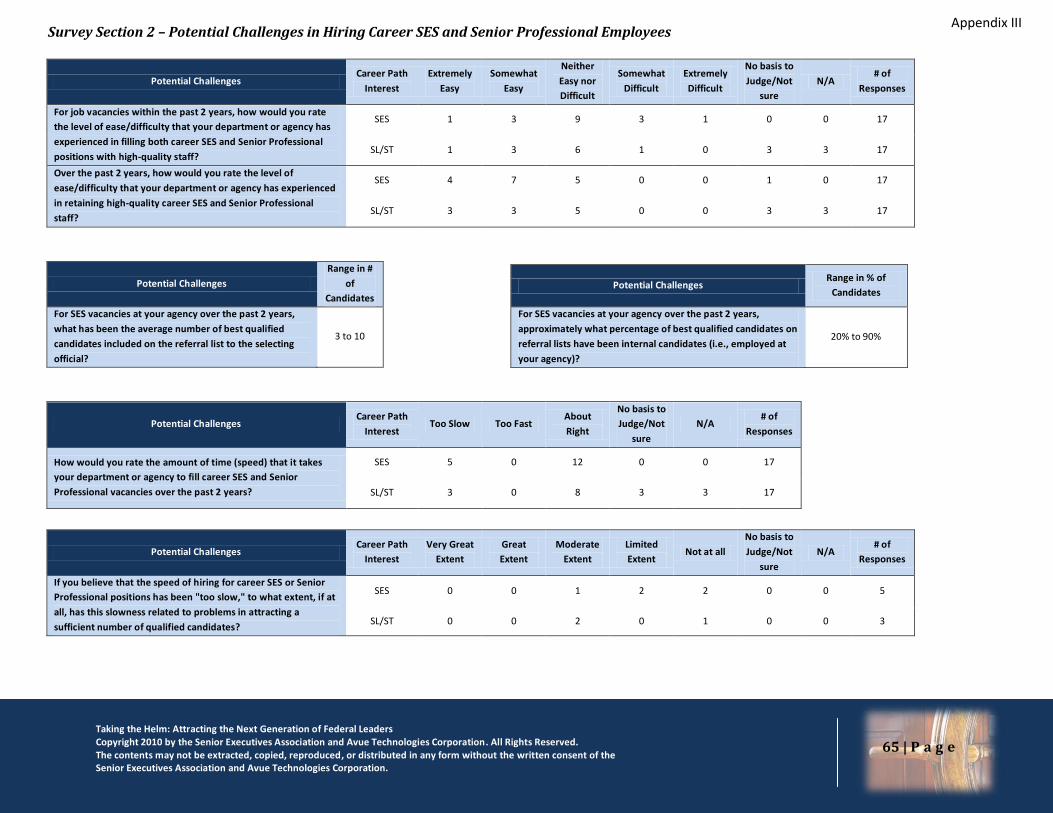
Taking the Helm: Attracting the Next Generation of Federal Leaders Copyright 2010 by the Senior Executives Association and Avue Technologies Corporation. All Rights Reserved. The contents may not be extracted, copied, reproduced, or distributed in any form without the written consent of the Senior Executives Association and Avue Technologies Corporation.
65 | P a g e
Survey Section 2 – Potential Challenges in Hiring Career SES and Senior Professional Employees
Potential Challenges Career Path
Interest
Extremely
Easy
Somewhat
Easy
Neither
Easy nor
Difficult
Somewhat
Difficult
Extremely
Difficult
No basis to
Judge/Not
sure
N/A # of
Responses
For job vacancies within the past 2 years, how would you rate
the level of ease/difficulty that your department or agency has
experienced in filling both career SES and Senior Professional
positions with high-quality staff?
SES 1 3 9 3 1 0 0 17
SL/ST 1 3 6 1 0 3 3 17
Over the past 2 years, how would you rate the level of
ease/difficulty that your department or agency has experienced
in retaining high-quality career SES and Senior Professional
staff?
SES 4 7 5 0 0 1 0 17
SL/ST 3 3 5 0 0 3 3 17
Potential Challenges
Range in #
of
Candidates
For SES vacancies at your agency over the past 2 years,
what has been the average number of best qualified
candidates included on the referral list to the selecting
official?
3 to 10
Potential Challenges Career Path
Interest Too Slow Too Fast
About
Right
No basis to
Judge/Not
sure
N/A # of
Responses
How would you rate the amount of time (speed) that it takes
your department or agency to fill career SES and Senior
Professional vacancies over the past 2 years?
SES 5 0 12 0 0 17
SL/ST 3 0 8 3 3 17
Potential Challenges Career Path
Interest
Very Great
Extent
Great
Extent
Moderate
Extent
Limited
Extent Not at all
No basis to
Judge/Not
sure
N/A # of
Responses
If you believe that the speed of hiring for career SES or Senior
Professional positions has been "too slow," to what extent, if at
all, has this slowness related to problems in attracting a
sufficient number of qualified candidates?
SES 0 0 1 2 2 0 0 5
SL/ST 0 0 2 0 1 0 0 3
Potential Challenges Range in % of
Candidates
For SES vacancies at your agency over the past 2 years,
approximately what percentage of best qualified candidates on
referral lists have been internal candidates (i.e., employed at
your agency)?
20% to 90%
Appendix III
Appendix III
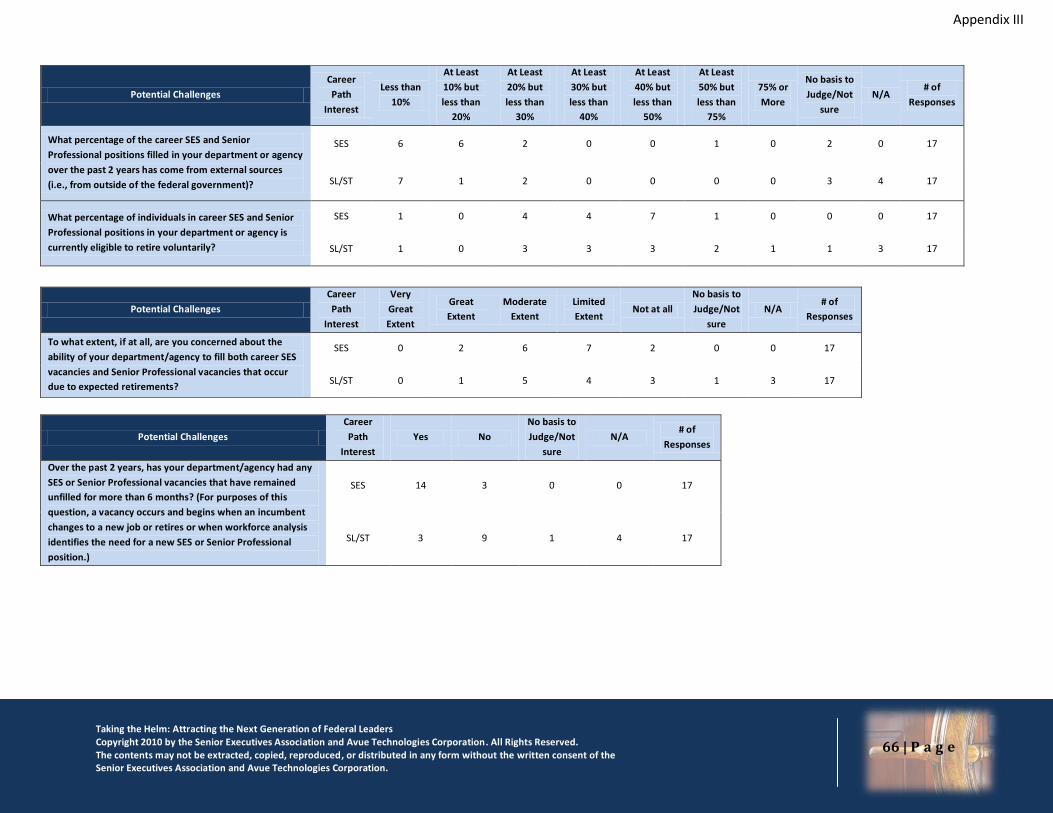
Taking the Helm: Attracting the Next Generation of Federal Leaders Copyright 2010 by the Senior Executives Association and Avue Technologies Corporation. All Rights Reserved. The contents may not be extracted, copied, reproduced, or distributed in any form without the written consent of the Senior Executives Association and Avue Technologies Corporation.
66 | P a g e
Potential Challenges
Career
Path
Interest
Less than
10%
At Least
10% but
less than
20%
At Least
20% but
less than
30%
At Least
30% but
less than
40%
At Least
40% but
less than
50%
At Least
50% but
less than
75%
75% or
More
No basis to
Judge/Not
sure
N/A # of
Responses
What percentage of the career SES and Senior
Professional positions filled in your department or agency
over the past 2 years has come from external sources
(i.e., from outside of the federal government)?
SES 6 6 2 0 0 1 0 2 0 17
SL/ST 7 1 2 0 0 0 0 3 4 17
What percentage of individuals in career SES and Senior
Professional positions in your department or agency is
currently eligible to retire voluntarily?
SES 1 0 4 4 7 1 0 0 0 17
SL/ST 1 0 3 3 3 2 1 1 3 17
Potential Challenges
Career
Path
Interest
Very
Great
Extent
Great
Extent
Moderate
Extent
Limited
Extent Not at all
No basis to
Judge/Not
sure
N/A # of
Responses
To what extent, if at all, are you concerned about the
ability of your department/agency to fill both career SES
vacancies and Senior Professional vacancies that occur
due to expected retirements?
SES 0 2 6 7 2 0 0 17
SL/ST 0 1 5 4 3 1 3 17
Potential Challenges
Career
Path
Interest
Yes No
No basis to
Judge/Not
sure
N/A # of
Responses
Over the past 2 years, has your department/agency had any
SES or Senior Professional vacancies that have remained
unfilled for more than 6 months? (For purposes of this
question, a vacancy occurs and begins when an incumbent
changes to a new job or retires or when workforce analysis
identifies the need for a new SES or Senior Professional
position.)
SES 14 3 0 0 17
SL/ST 3 9 1 4 17
Appendix III
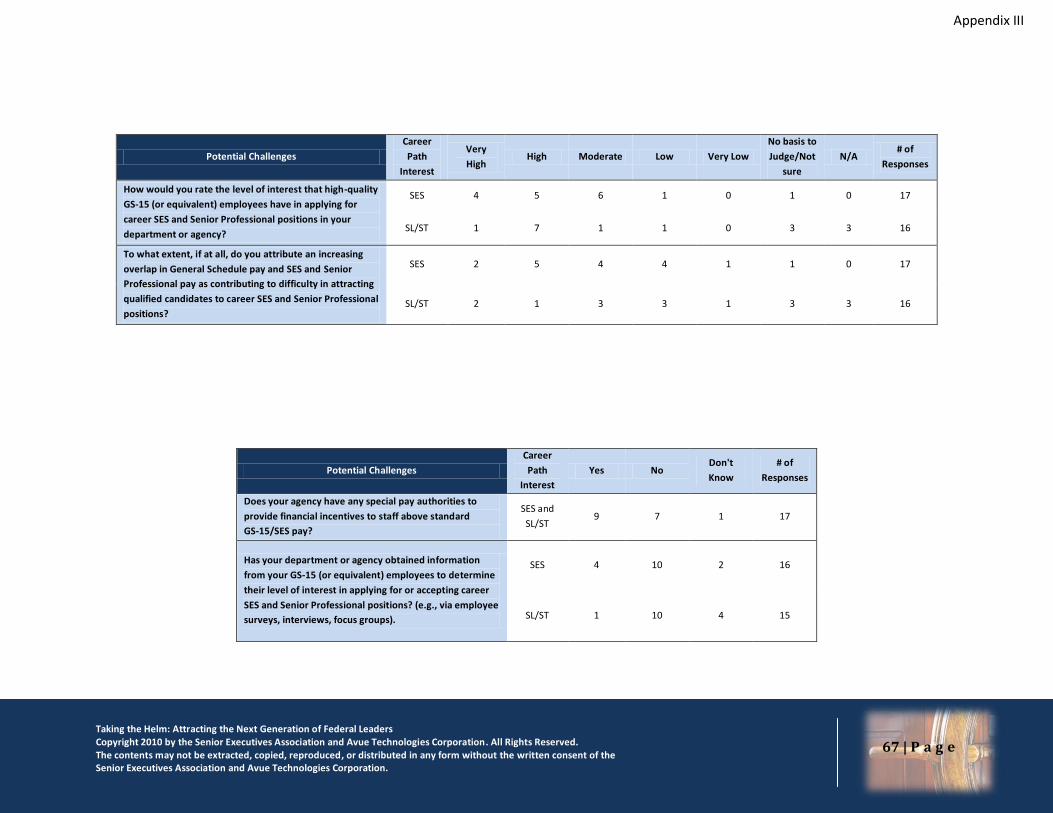
Taking the Helm: Attracting the Next Generation of Federal Leaders Copyright 2010 by the Senior Executives Association and Avue Technologies Corporation. All Rights Reserved. The contents may not be extracted, copied, reproduced, or distributed in any form without the written consent of the Senior Executives Association and Avue Technologies Corporation.
67 | P a g e
Potential Challenges
Career
Path
Interest
Very
High High Moderate Low Very Low
No basis to
Judge/Not
sure
N/A # of
Responses
How would you rate the level of interest that high-quality
GS-15 (or equivalent) employees have in applying for
career SES and Senior Professional positions in your
department or agency?
SES 4 5 6 1 0 1 0 17
SL/ST 1 7 1 1 0 3 3 16
To what extent, if at all, do you attribute an increasing
overlap in General Schedule pay and SES and Senior
Professional pay as contributing to difficulty in attracting
qualified candidates to career SES and Senior Professional
positions?
SES 2 5 4 4 1 1 0 17
SL/ST 2 1 3 3 1 3 3 16
Potential Challenges
Career
Path
Interest
Yes No Don't
Know
# of
Responses
Does your agency have any special pay authorities to
provide financial incentives to staff above standard
GS-15/SES pay?
SES and
SL/ST 9 7 1 17
Has your department or agency obtained information
from your GS-15 (or equivalent) employees to determine
their level of interest in applying for or accepting career
SES and Senior Professional positions? (e.g., via employee
surveys, interviews, focus groups).
SES 4 10 2 16
SL/ST 1 10 4 15
Appendix III
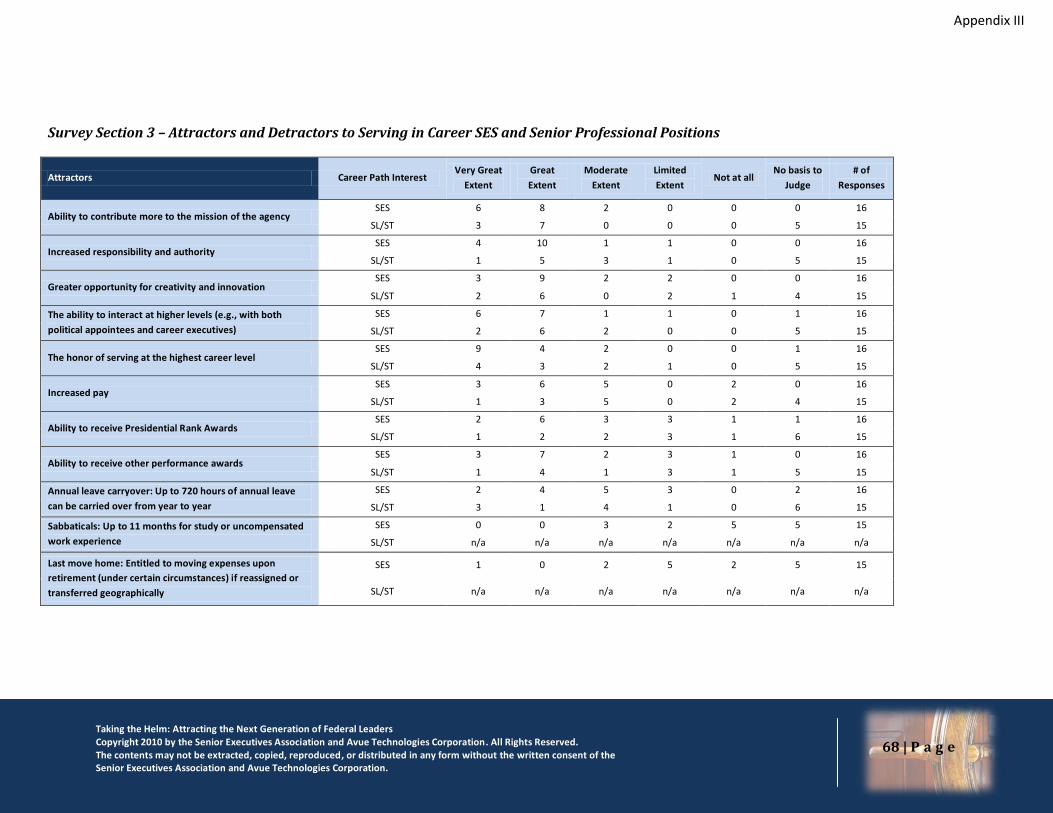
Taking the Helm: Attracting the Next Generation of Federal Leaders Copyright 2010 by the Senior Executives Association and Avue Technologies Corporation. All Rights Reserved. The contents may not be extracted, copied, reproduced, or distributed in any form without the written consent of the Senior Executives Association and Avue Technologies Corporation.
68 | P a g e
Survey Section 3 – Attractors and Detractors to Serving in Career SES and Senior Professional Positions
Attractors Career Path Interest Very Great
Extent
Great
Extent
Moderate
Extent
Limited
Extent Not at all
No basis to
Judge
# of
Responses
Ability to contribute more to the mission of the agency SES 6 8 2 0 0 0 16
SL/ST 3 7 0 0 0 5 15
Increased responsibility and authority SES 4 10 1 1 0 0 16
SL/ST 1 5 3 1 0 5 15
Greater opportunity for creativity and innovation SES 3 9 2 2 0 0 16
SL/ST 2 6 0 2 1 4 15
The ability to interact at higher levels (e.g., with both
political appointees and career executives)
SES 6 7 1 1 0 1 16
SL/ST 2 6 2 0 0 5 15
The honor of serving at the highest career level SES 9 4 2 0 0 1 16
SL/ST 4 3 2 1 0 5 15
Increased pay SES 3 6 5 0 2 0 16
SL/ST 1 3 5 0 2 4 15
Ability to receive Presidential Rank Awards SES 2 6 3 3 1 1 16
SL/ST 1 2 2 3 1 6 15
Ability to receive other performance awards SES 3 7 2 3 1 0 16
SL/ST 1 4 1 3 1 5 15
Annual leave carryover: Up to 720 hours of annual leave
can be carried over from year to year
SES 2 4 5 3 0 2 16
SL/ST 3 1 4 1 0 6 15
Sabbaticals: Up to 11 months for study or uncompensated
work experience
SES 0 0 3 2 5 5 15
SL/ST n/a n/a n/a n/a n/a n/a n/a
Last move home: Entitled to moving expenses upon
retirement (under certain circumstances) if reassigned or
transferred geographically
SES 1 0 2 5 2 5 15
SL/ST n/a n/a n/a n/a n/a n/a n/a
Appendix III
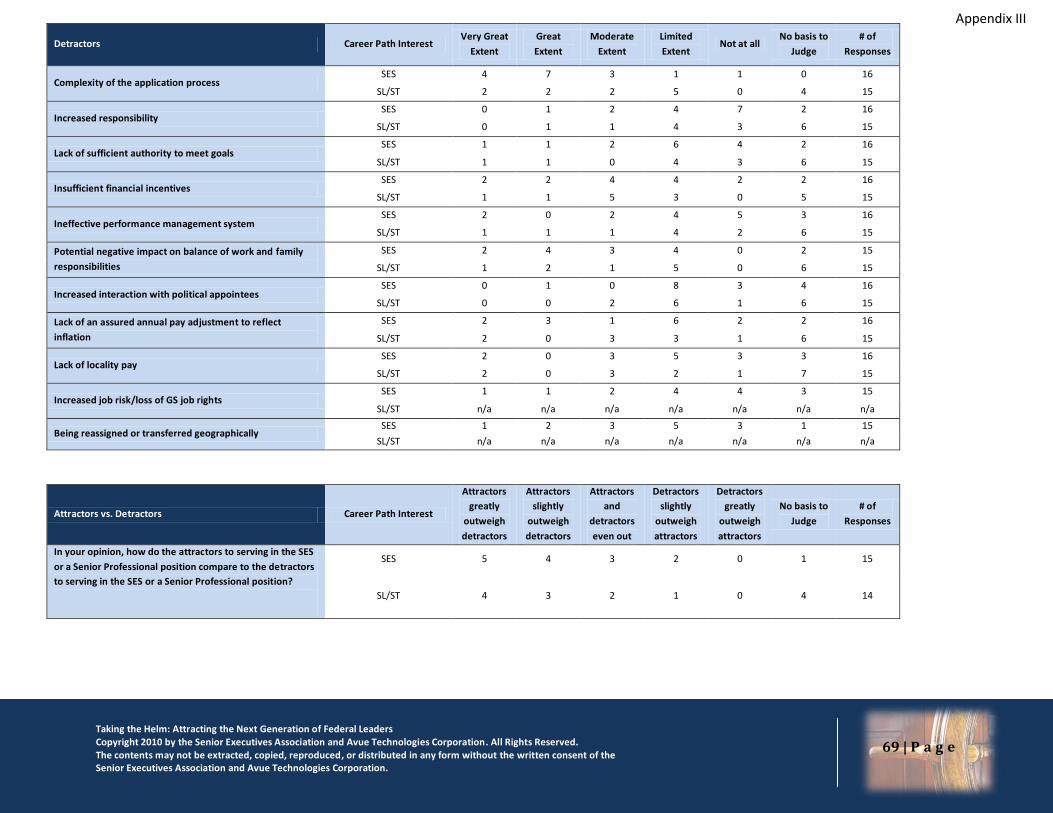
Taking the Helm: Attracting the Next Generation of Federal Leaders Copyright 2010 by the Senior Executives Association and Avue Technologies Corporation. All Rights Reserved. The contents may not be extracted, copied, reproduced, or distributed in any form without the written consent of the Senior Executives Association and Avue Technologies Corporation.
69 | P a g e
Detractors Career Path Interest Very Great
Extent
Great
Extent
Moderate
Extent
Limited
Extent Not at all
No basis to
Judge
# of
Responses
Complexity of the application process SES 4 7 3 1 1 0 16
SL/ST 2 2 2 5 0 4 15
Increased responsibility SES 0 1 2 4 7 2 16
SL/ST 0 1 1 4 3 6 15
Lack of sufficient authority to meet goals SES 1 1 2 6 4 2 16
SL/ST 1 1 0 4 3 6 15
Insufficient financial incentives SES 2 2 4 4 2 2 16
SL/ST 1 1 5 3 0 5 15
Ineffective performance management system SES 2 0 2 4 5 3 16
SL/ST 1 1 1 4 2 6 15
Potential negative impact on balance of work and family
responsibilities
SES 2 4 3 4 0 2 15
SL/ST 1 2 1 5 0 6 15
Increased interaction with political appointees SES 0 1 0 8 3 4 16
SL/ST 0 0 2 6 1 6 15
Lack of an assured annual pay adjustment to reflect
inflation
SES 2 3 1 6 2 2 16
SL/ST 2 0 3 3 1 6 15
Lack of locality pay SES 2 0 3 5 3 3 16
SL/ST 2 0 3 2 1 7 15
Increased job risk/loss of GS job rights SES 1 1 2 4 4 3 15
SL/ST n/a n/a n/a n/a n/a n/a n/a
Being reassigned or transferred geographically SES 1 2 3 5 3 1 15
SL/ST n/a n/a n/a n/a n/a n/a n/a
Attractors vs. Detractors Career Path Interest
Attractors
greatly
outweigh
detractors
Attractors
slightly
outweigh
detractors
Attractors
and
detractors
even out
Detractors
slightly
outweigh
attractors
Detractors
greatly
outweigh
attractors
No basis to
Judge
# of
Responses
In your opinion, how do the attractors to serving in the SES
or a Senior Professional position compare to the detractors
to serving in the SES or a Senior Professional position?
SES 5 4 3 2 0 1 15
SL/ST 4 3 2 1 0 4 14
Appendix III
Appendix III
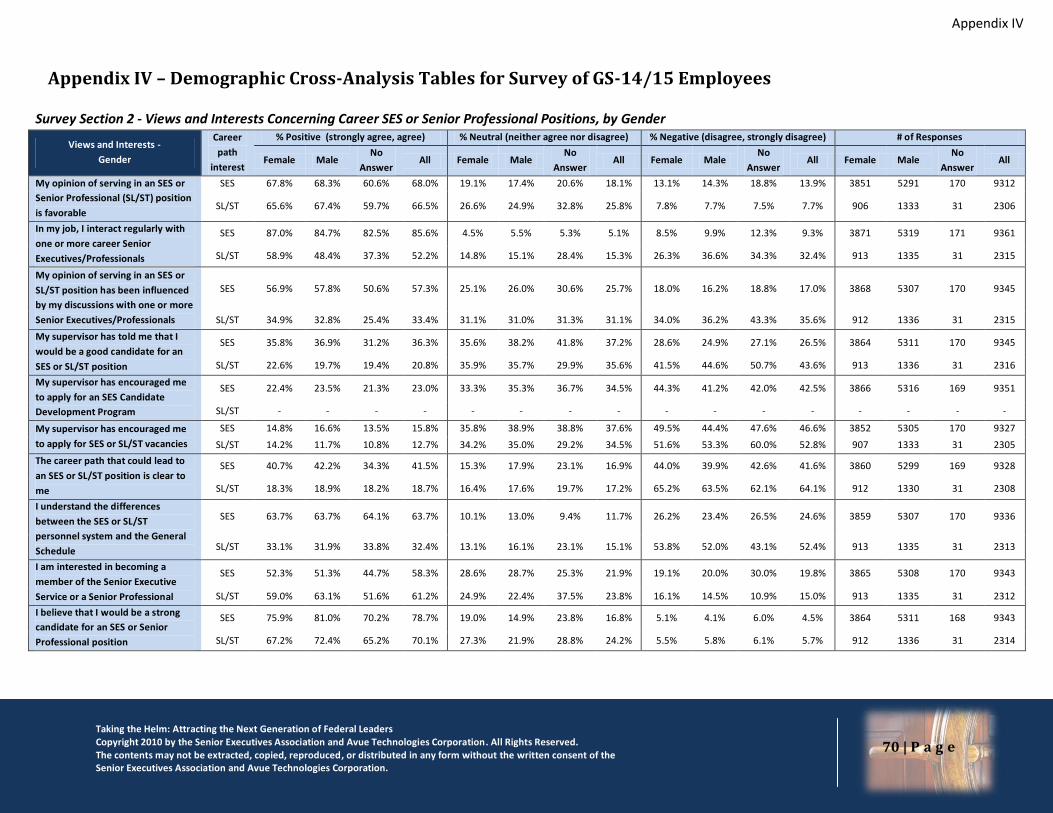
Taking the Helm: Attracting the Next Generation of Federal Leaders Copyright 2010 by the Senior Executives Association and Avue Technologies Corporation. All Rights Reserved. The contents may not be extracted, copied, reproduced, or distributed in any form without the written consent of the Senior Executives Association and Avue Technologies Corporation.
70 | P a g e
Appendix IV – Demographic Cross-Analysis Tables for Survey of GS-14/15 Employees
Survey Section 2 - Views and Interests Concerning Career SES or Senior Professional Positions, by Gender
Views and Interests -
Gender
Career
path
interest
% Positive (strongly agree, agree) % Neutral (neither agree nor disagree) % Negative (disagree, strongly disagree) # of Responses
Female Male No
Answer All Female Male
No
Answer All Female Male
No
Answer All Female Male
No
Answer All
My opinion of serving in an SES or
Senior Professional (SL/ST) position
is favorable
SES 67.8% 68.3% 60.6% 68.0% 19.1% 17.4% 20.6% 18.1% 13.1% 14.3% 18.8% 13.9% 3851 5291 170 9312
SL/ST 65.6% 67.4% 59.7% 66.5% 26.6% 24.9% 32.8% 25.8% 7.8% 7.7% 7.5% 7.7% 906 1333 31 2306
In my job, I interact regularly with
one or more career Senior
Executives/Professionals
SES 87.0% 84.7% 82.5% 85.6% 4.5% 5.5% 5.3% 5.1% 8.5% 9.9% 12.3% 9.3% 3871 5319 171 9361
SL/ST 58.9% 48.4% 37.3% 52.2% 14.8% 15.1% 28.4% 15.3% 26.3% 36.6% 34.3% 32.4% 913 1335 31 2315
My opinion of serving in an SES or
SL/ST position has been influenced
by my discussions with one or more
Senior Executives/Professionals
SES 56.9% 57.8% 50.6% 57.3% 25.1% 26.0% 30.6% 25.7% 18.0% 16.2% 18.8% 17.0% 3868 5307 170 9345
SL/ST 34.9% 32.8% 25.4% 33.4% 31.1% 31.0% 31.3% 31.1% 34.0% 36.2% 43.3% 35.6% 912 1336 31 2315
My supervisor has told me that I
would be a good candidate for an
SES or SL/ST position
SES 35.8% 36.9% 31.2% 36.3% 35.6% 38.2% 41.8% 37.2% 28.6% 24.9% 27.1% 26.5% 3864 5311 170 9345
SL/ST 22.6% 19.7% 19.4% 20.8% 35.9% 35.7% 29.9% 35.6% 41.5% 44.6% 50.7% 43.6% 913 1336 31 2316
My supervisor has encouraged me
to apply for an SES Candidate
Development Program
SES 22.4% 23.5% 21.3% 23.0% 33.3% 35.3% 36.7% 34.5% 44.3% 41.2% 42.0% 42.5% 3866 5316 169 9351
SL/ST - - - - - - - - - - - - - - - -
My supervisor has encouraged me
to apply for SES or SL/ST vacancies
SES 14.8% 16.6% 13.5% 15.8% 35.8% 38.9% 38.8% 37.6% 49.5% 44.4% 47.6% 46.6% 3852 5305 170 9327
SL/ST 14.2% 11.7% 10.8% 12.7% 34.2% 35.0% 29.2% 34.5% 51.6% 53.3% 60.0% 52.8% 907 1333 31 2305
The career path that could lead to
an SES or SL/ST position is clear to
me
SES 40.7% 42.2% 34.3% 41.5% 15.3% 17.9% 23.1% 16.9% 44.0% 39.9% 42.6% 41.6% 3860 5299 169 9328
SL/ST 18.3% 18.9% 18.2% 18.7% 16.4% 17.6% 19.7% 17.2% 65.2% 63.5% 62.1% 64.1% 912 1330 31 2308
I understand the differences
between the SES or SL/ST
personnel system and the General
Schedule
SES 63.7% 63.7% 64.1% 63.7% 10.1% 13.0% 9.4% 11.7% 26.2% 23.4% 26.5% 24.6% 3859 5307 170 9336
SL/ST 33.1% 31.9% 33.8% 32.4% 13.1% 16.1% 23.1% 15.1% 53.8% 52.0% 43.1% 52.4% 913 1335 31 2313
I am interested in becoming a
member of the Senior Executive
Service or a Senior Professional
SES 52.3% 51.3% 44.7% 58.3% 28.6% 28.7% 25.3% 21.9% 19.1% 20.0% 30.0% 19.8% 3865 5308 170 9343
SL/ST 59.0% 63.1% 51.6% 61.2% 24.9% 22.4% 37.5% 23.8% 16.1% 14.5% 10.9% 15.0% 913 1335 31 2312
I believe that I would be a strong
candidate for an SES or Senior
Professional position
SES 75.9% 81.0% 70.2% 78.7% 19.0% 14.9% 23.8% 16.8% 5.1% 4.1% 6.0% 4.5% 3864 5311 168 9343
SL/ST 67.2% 72.4% 65.2% 70.1% 27.3% 21.9% 28.8% 24.2% 5.5% 5.8% 6.1% 5.7% 912 1336 31 2314
Appendix IV
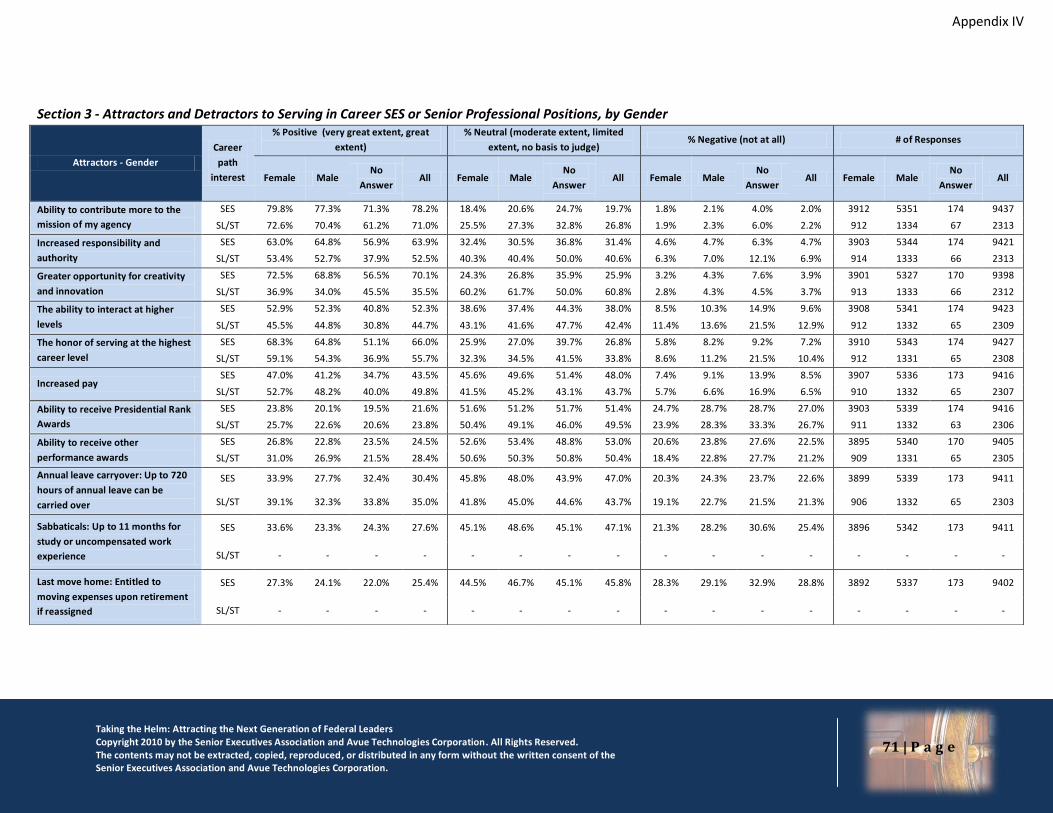
Taking the Helm: Attracting the Next Generation of Federal Leaders Copyright 2010 by the Senior Executives Association and Avue Technologies Corporation. All Rights Reserved. The contents may not be extracted, copied, reproduced, or distributed in any form without the written consent of the Senior Executives Association and Avue Technologies Corporation.
71 | P a g e
Section 3 - Attractors and Detractors to Serving in Career SES or Senior Professional Positions, by Gender
Attractors - Gender
Career
path
interest
% Positive (very great extent, great
extent)
% Neutral (moderate extent, limited
extent, no basis to judge) % Negative (not at all) # of Responses
Female Male No
Answer All Female Male
No
Answer All Female Male
No
Answer All Female Male
No
Answer All
Ability to contribute more to the
mission of my agency
SES 79.8% 77.3% 71.3% 78.2% 18.4% 20.6% 24.7% 19.7% 1.8% 2.1% 4.0% 2.0% 3912 5351 174 9437
SL/ST 72.6% 70.4% 61.2% 71.0% 25.5% 27.3% 32.8% 26.8% 1.9% 2.3% 6.0% 2.2% 912 1334 67 2313
Increased responsibility and
authority
SES 63.0% 64.8% 56.9% 63.9% 32.4% 30.5% 36.8% 31.4% 4.6% 4.7% 6.3% 4.7% 3903 5344 174 9421
SL/ST 53.4% 52.7% 37.9% 52.5% 40.3% 40.4% 50.0% 40.6% 6.3% 7.0% 12.1% 6.9% 914 1333 66 2313
Greater opportunity for creativity
and innovation
SES 72.5% 68.8% 56.5% 70.1% 24.3% 26.8% 35.9% 25.9% 3.2% 4.3% 7.6% 3.9% 3901 5327 170 9398
SL/ST 36.9% 34.0% 45.5% 35.5% 60.2% 61.7% 50.0% 60.8% 2.8% 4.3% 4.5% 3.7% 913 1333 66 2312
The ability to interact at higher
levels
SES 52.9% 52.3% 40.8% 52.3% 38.6% 37.4% 44.3% 38.0% 8.5% 10.3% 14.9% 9.6% 3908 5341 174 9423
SL/ST 45.5% 44.8% 30.8% 44.7% 43.1% 41.6% 47.7% 42.4% 11.4% 13.6% 21.5% 12.9% 912 1332 65 2309
The honor of serving at the highest
career level
SES 68.3% 64.8% 51.1% 66.0% 25.9% 27.0% 39.7% 26.8% 5.8% 8.2% 9.2% 7.2% 3910 5343 174 9427
SL/ST 59.1% 54.3% 36.9% 55.7% 32.3% 34.5% 41.5% 33.8% 8.6% 11.2% 21.5% 10.4% 912 1331 65 2308
Increased pay SES 47.0% 41.2% 34.7% 43.5% 45.6% 49.6% 51.4% 48.0% 7.4% 9.1% 13.9% 8.5% 3907 5336 173 9416
SL/ST 52.7% 48.2% 40.0% 49.8% 41.5% 45.2% 43.1% 43.7% 5.7% 6.6% 16.9% 6.5% 910 1332 65 2307
Ability to receive Presidential Rank
Awards
SES 23.8% 20.1% 19.5% 21.6% 51.6% 51.2% 51.7% 51.4% 24.7% 28.7% 28.7% 27.0% 3903 5339 174 9416
SL/ST 25.7% 22.6% 20.6% 23.8% 50.4% 49.1% 46.0% 49.5% 23.9% 28.3% 33.3% 26.7% 911 1332 63 2306
Ability to receive other
performance awards
SES 26.8% 22.8% 23.5% 24.5% 52.6% 53.4% 48.8% 53.0% 20.6% 23.8% 27.6% 22.5% 3895 5340 170 9405
SL/ST 31.0% 26.9% 21.5% 28.4% 50.6% 50.3% 50.8% 50.4% 18.4% 22.8% 27.7% 21.2% 909 1331 65 2305
Annual leave carryover: Up to 720
hours of annual leave can be
carried over
SES 33.9% 27.7% 32.4% 30.4% 45.8% 48.0% 43.9% 47.0% 20.3% 24.3% 23.7% 22.6% 3899 5339 173 9411
SL/ST 39.1% 32.3% 33.8% 35.0% 41.8% 45.0% 44.6% 43.7% 19.1% 22.7% 21.5% 21.3% 906 1332 65 2303
Sabbaticals: Up to 11 months for
study or uncompensated work
experience
SES 33.6% 23.3% 24.3% 27.6% 45.1% 48.6% 45.1% 47.1% 21.3% 28.2% 30.6% 25.4% 3896 5342 173 9411
SL/ST - - - - - - - - - - - - - - - -
Last move home: Entitled to
moving expenses upon retirement
if reassigned
SES 27.3% 24.1% 22.0% 25.4% 44.5% 46.7% 45.1% 45.8% 28.3% 29.1% 32.9% 28.8% 3892 5337 173 9402
SL/ST - - - - - - - - - - - - - - - -
Appendix IV

Taking the Helm: Attracting the Next Generation of Federal Leaders Copyright 2010 by the Senior Executives Association and Avue Technologies Corporation. All Rights Reserved. The contents may not be extracted, copied, reproduced, or distributed in any form without the written consent of the Senior Executives Association and Avue Technologies Corporation.
72 | P a g e
Detractors - Gender
Career
path
interest
% Positive (not at all) % Neutral (moderate extent, limited
extent, no basis to judge)
% Negative (very great extent, great
extent) # of Responses
Female Male No
Answer All Female Male
No
Answer All Female Male
No
Answer All Female Male
No
Answer All
Complexity of the
application process
SES 11.6% 13.1% 18.4% 12.6% 49.6% 49.7% 41.4% 49.5% 38.9% 37.1% 40.2% 37.9% 3907 5349 174 9430
SL/ST 9.2% 10.2% 7.6% 9.7% 53.9% 58.5% 57.6% 56.6% 36.9% 31.3% 34.8% 33.6% 913 1332 66 2311
Increased responsibility SES 51.2% 60.6% 56.1% 56.6% 40.7% 34.3% 36.4% 37.0% 8.1% 5.0% 7.5% 6.3% 3900 5346 173 9419
SL/ST 36.9% 47.3% 40.9% 43.0% 52.6% 46.5% 56.1% 49.2% 10.4% 6.2% 3.0% 7.8% 910 1331 66 2307
Lack of sufficient authority
to meet goals
SES 23.8% 28.2% 26.0% 26.4% 55.0% 53.7% 51.4% 54.2% 21.1% 18.1% 22.5% 19.5% 3889 5342 173 9404
SL/ST 14.6% 17.5% 9.1% 16.1% 59.1% 61.2% 69.7% 60.6% 26.3% 21.3% 21.2% 23.3% 910 1328 66 2304
Insufficient financial
incentives
SES 33.5% 34.9% 29.8% 34.2% 48.2% 45.0% 44.4% 46.3% 18.4% 20.1% 25.7% 19.5% 3899 5339 171 9409
SL/ST 24.0% 29.4% 19.7% 27.0% 60.8% 56.6% 71.2% 58.7% 15.2% 14.0% 9.1% 14.3% 909 1327 66 2302
Ineffective SES or SL/ST
performance management
system
SES 18.7% 22.9% 19.9% 21.1% 62.7% 60.9% 58.5% 61.6% 18.5% 16.2% 21.6% 17.3% 3884 5329 171 9384
SL/ST 11.6% 15.4% 10.9% 13.8% 69.3% 69.6% 71.9% 69.5% 19.1% 15.1% 17.2% 16.7% 906 1327 64 2297
Potential negative impact
on balance of my work and
family responsibilities
SES 15.4% 16.4% 19.5% 16.1% 37.7% 40.5% 39.1% 39.3% 46.9% 43.1% 41.4% 44.7% 3904 5346 174 9424
SL/ST 14.4% 15.7% 16.7% 15.2% 42.0% 50.4% 51.5% 47.1% 43.6% 33.9% 31.8% 37.6% 908 1329 66 2303
Increased interaction with
political appointees
SES 48.1% 51.6% 47.1% 50.0% 41.7% 37.5% 40.2% 39.3% 10.3% 10.9% 12.6% 10.7% 3902 5332 174 9408
SL/ST 36.2% 37.8% 26.2% 36.8% 46.7% 46.0% 55.4% 46.6% 17.1% 16.2% 18.5% 16.6% 908 1329 65 2302
Being reassigned or
transferred geographically
SES 17.4% 19.7% 20.7% 18.7% 35.1% 39.7% 42.0% 37.8% 47.5% 40.6% 37.4% 43.4% 3898 5338 174 9410
SL/ST - - - - - - - - - - - - - - - -
Lack of locality pay SES 26.8% 29.5% 28.9% 28.4% 48.8% 47.6% 48.0% 48.1% 24.4% 22.9% 23.1% 23.5% 3901 5344 173 9418
SL/ST 21.0% 26.1% 25.8% 24.1% 51.5% 50.8% 54.5% 51.2% 27.5% 23.0% 19.7% 24.7% 909 1332 66 2307
Lack of an assured annual
pay adjustment to reflect
inflation
SES 21.3% 25.4% 20.3% 23.6% 50.8% 50.1% 54.1% 50.5% 27.9% 24.5% 25.6% 25.9% 3895 5343 172 9410
SL/ST 14.9% 20.1% 19.7% 18.0% 51.6% 54.0% 54.5% 53.1% 33.6% 25.9% 25.8% 28.9% 909 1326 66 2301
Count of Increased job
risk/loss of GS job rights
SES 17.6% 23.5% 19.7% 21.0% 47.3% 49.7% 52.6% 48.8% 35.1% 26.8% 27.7% 30.3% 3897 5344 173 9414
SL/ST - - - - - - - - - - - - - - - -
Attractors vs. Detractors -
Gender
Career
path
interest
% Positive
(attractors greatly outweigh/slightly
outweigh detractors)
% Neutral
(attractors and detractors even out, no
basis to judge)
% Negative
(detractors greatly outweigh/slightly
outweigh attractors)
# of Responses
Female Male No
Answer All Female Male
No
Answer All Female Male
No
Answer All Female Male
No
Answer All
How do the attractors to
serving in the SES or a
Senior Professional position
compare to the detractors
to serving in the SES or a
Senior Professional
position?
SES 47.8% 51.6% 43.0% 49.9% 17.9% 14.2% 19.2% 15.8% 34.3% 34.2% 37.8% 34.3% 3840 5240 172 9252
SL/ST 46.3% 52.0% 38.1% 49.3% 26.2% 21.7% 38.1% 23.9% 27.5% 26.3% 23.8% 26.7% 897 1302 63 2262
Appendix IV
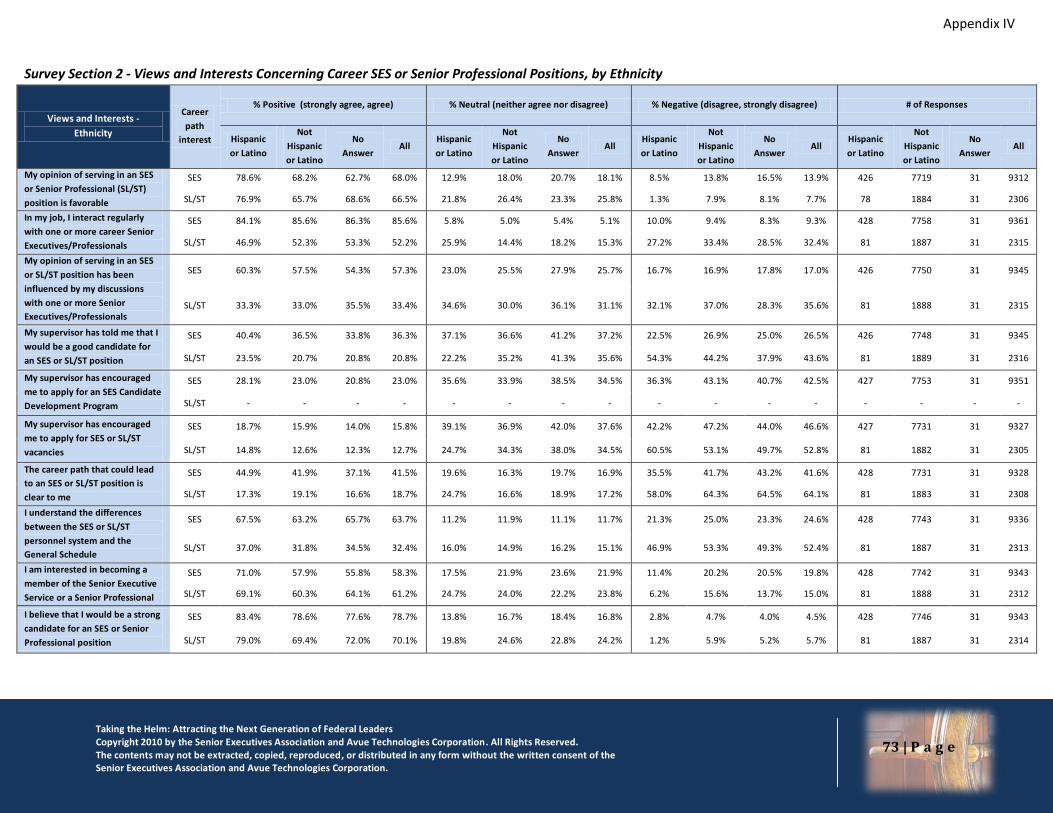
Taking the Helm: Attracting the Next Generation of Federal Leaders Copyright 2010 by the Senior Executives Association and Avue Technologies Corporation. All Rights Reserved. The contents may not be extracted, copied, reproduced, or distributed in any form without the written consent of the Senior Executives Association and Avue Technologies Corporation.
73 | P a g e
Survey Section 2 - Views and Interests Concerning Career SES or Senior Professional Positions, by Ethnicity
Views and Interests -
Ethnicity
Career
path
interest
% Positive (strongly agree, agree) % Neutral (neither agree nor disagree) % Negative (disagree, strongly disagree) # of Responses
Hispanic
or Latino
Not
Hispanic
or Latino
No
Answer All
Hispanic
or Latino
Not
Hispanic
or Latino
No
Answer All
Hispanic
or Latino
Not
Hispanic
or Latino
No
Answer All
Hispanic
or Latino
Not
Hispanic
or Latino
No
Answer All
My opinion of serving in an SES
or Senior Professional (SL/ST)
position is favorable
SES 78.6% 68.2% 62.7% 68.0% 12.9% 18.0% 20.7% 18.1% 8.5% 13.8% 16.5% 13.9% 426 7719 31 9312
SL/ST 76.9% 65.7% 68.6% 66.5% 21.8% 26.4% 23.3% 25.8% 1.3% 7.9% 8.1% 7.7% 78 1884 31 2306
In my job, I interact regularly
with one or more career Senior
Executives/Professionals
SES 84.1% 85.6% 86.3% 85.6% 5.8% 5.0% 5.4% 5.1% 10.0% 9.4% 8.3% 9.3% 428 7758 31 9361
SL/ST 46.9% 52.3% 53.3% 52.2% 25.9% 14.4% 18.2% 15.3% 27.2% 33.4% 28.5% 32.4% 81 1887 31 2315
My opinion of serving in an SES
or SL/ST position has been
influenced by my discussions
with one or more Senior
Executives/Professionals
SES 60.3% 57.5% 54.3% 57.3% 23.0% 25.5% 27.9% 25.7% 16.7% 16.9% 17.8% 17.0% 426 7750 31 9345
SL/ST 33.3% 33.0% 35.5% 33.4% 34.6% 30.0% 36.1% 31.1% 32.1% 37.0% 28.3% 35.6% 81 1888 31 2315
My supervisor has told me that I
would be a good candidate for
an SES or SL/ST position
SES 40.4% 36.5% 33.8% 36.3% 37.1% 36.6% 41.2% 37.2% 22.5% 26.9% 25.0% 26.5% 426 7748 31 9345
SL/ST 23.5% 20.7% 20.8% 20.8% 22.2% 35.2% 41.3% 35.6% 54.3% 44.2% 37.9% 43.6% 81 1889 31 2316
My supervisor has encouraged
me to apply for an SES Candidate
Development Program
SES 28.1% 23.0% 20.8% 23.0% 35.6% 33.9% 38.5% 34.5% 36.3% 43.1% 40.7% 42.5% 427 7753 31 9351
SL/ST - - - - - - - - - - - - - - - -
My supervisor has encouraged
me to apply for SES or SL/ST
vacancies
SES 18.7% 15.9% 14.0% 15.8% 39.1% 36.9% 42.0% 37.6% 42.2% 47.2% 44.0% 46.6% 427 7731 31 9327
SL/ST 14.8% 12.6% 12.3% 12.7% 24.7% 34.3% 38.0% 34.5% 60.5% 53.1% 49.7% 52.8% 81 1882 31 2305
The career path that could lead
to an SES or SL/ST position is
clear to me
SES 44.9% 41.9% 37.1% 41.5% 19.6% 16.3% 19.7% 16.9% 35.5% 41.7% 43.2% 41.6% 428 7731 31 9328
SL/ST 17.3% 19.1% 16.6% 18.7% 24.7% 16.6% 18.9% 17.2% 58.0% 64.3% 64.5% 64.1% 81 1883 31 2308
I understand the differences
between the SES or SL/ST
personnel system and the
General Schedule
SES 67.5% 63.2% 65.7% 63.7% 11.2% 11.9% 11.1% 11.7% 21.3% 25.0% 23.3% 24.6% 428 7743 31 9336
SL/ST 37.0% 31.8% 34.5% 32.4% 16.0% 14.9% 16.2% 15.1% 46.9% 53.3% 49.3% 52.4% 81 1887 31 2313
I am interested in becoming a
member of the Senior Executive
Service or a Senior Professional
SES 71.0% 57.9% 55.8% 58.3% 17.5% 21.9% 23.6% 21.9% 11.4% 20.2% 20.5% 19.8% 428 7742 31 9343
SL/ST 69.1% 60.3% 64.1% 61.2% 24.7% 24.0% 22.2% 23.8% 6.2% 15.6% 13.7% 15.0% 81 1888 31 2312
I believe that I would be a strong
candidate for an SES or Senior
Professional position
SES 83.4% 78.6% 77.6% 78.7% 13.8% 16.7% 18.4% 16.8% 2.8% 4.7% 4.0% 4.5% 428 7746 31 9343
SL/ST 79.0% 69.4% 72.0% 70.1% 19.8% 24.6% 22.8% 24.2% 1.2% 5.9% 5.2% 5.7% 81 1887 31 2314
Appendix IV

Taking the Helm: Attracting the Next Generation of Federal Leaders Copyright 2010 by the Senior Executives Association and Avue Technologies Corporation. All Rights Reserved. The contents may not be extracted, copied, reproduced, or distributed in any form without the written consent of the Senior Executives Association and Avue Technologies Corporation.
74 | P a g e
Section 3 - Attractors and Detractors to Serving in Career SES or Senior Professional Positions, by Ethnicity
Attractors - Ethnicity
Career
path
interest
% Positive (very great extent, great extent) % Neutral (moderate extent, limited extent,
no basis to judge) % Negative (not at all) # of Responses
Hispanic
or Latino
Not
Hispanic
or Latino
No
Answer All
Hispanic
or Latino
Not
Hispanic
or Latino
No
Answer All
Hispanic
or Latino
Not
Hispanic
or Latino
No
Answer All
Hispanic
or Latino
Not
Hispanic
or Latino
No
Answer All
Ability to contribute more to the
mission of my agency
SES 85.6% 78.2% 75.9% 78.2% 12.8% 20.0% 20.8% 19.7% 1.6% 1.8% 3.4% 2.0% 430 7818 31 9437
SL/ST 72.8% 70.7% 72.3% 71.0% 25.9% 27.1% 24.9% 26.8% 1.2% 2.2% 2.9% 2.2% 81 1886 346 2313
Increased responsibility and
authority
SES 70.3% 63.8% 62.3% 63.9% 26.4% 31.6% 31.9% 31.4% 3.3% 4.6% 5.7% 4.7% 428 7806 31 9421
SL/ST 59.3% 51.9% 54.2% 52.5% 34.6% 41.2% 38.6% 40.6% 6.2% 6.8% 7.2% 6.9% 81 1887 345 2313
Greater opportunity for creativity
and innovation
SES 81.1% 69.9% 67.9% 70.1% 17.3% 26.4% 26.2% 25.9% 1.6% 3.8% 5.9% 3.9% 428 7792 1178 9398
SL/ST 53.1% 34.1% 38.8% 35.5% 43.2% 62.4% 56.5% 60.8% 3.7% 3.6% 4.6% 3.7% 81 1886 345 2312
The ability to interact at higher
levels
SES 59.9% 52.2% 50.3% 52.3% 31.5% 38.5% 37.6% 38.0% 8.6% 9.3% 12.1% 9.6% 429 7810 1184 9423
SL/ST 51.9% 43.7% 48.5% 44.7% 39.5% 43.3% 38.1% 42.4% 8.6% 13.1% 13.4% 12.9% 81 1884 344 2309
The honor of serving at the
highest career level
SES 76.7% 65.9% 62.6% 66.0% 17.9% 27.1% 27.9% 26.8% 5.4% 7.0% 9.5% 7.2% 429 7813 1185 9427
SL/ST 63.0% 55.3% 56.1% 55.7% 29.6% 34.4% 31.7% 33.8% 7.4% 10.2% 12.2% 10.4% 81 1883 344 2308
Increased pay SES 43.5% 43.8% 42.0% 43.5% 47.7% 48.0% 47.8% 48.0% 8.9% 8.2% 10.2% 8.5% 428 7805 1183 9416
SL/ST 60.5% 49.2% 50.1% 49.8% 32.1% 44.7% 40.8% 43.7% 7.4% 6.1% 9.0% 6.5% 81 1883 343 2307
Ability to receive Presidential
Rank Awards
SES 28.9% 21.3% 21.1% 21.6% 49.9% 51.9% 48.8% 51.4% 21.2% 26.9% 30.1% 27.0% 429 7806 1181 9416
SL/ST 22.2% 22.8% 29.2% 23.8% 50.6% 51.0% 41.1% 49.5% 27.2% 26.1% 29.7% 26.7% 81 1882 343 2306
Ability to receive other
performance awards
SES 29.8% 24.3% 23.9% 24.5% 52.4% 53.4% 50.4% 53.0% 17.7% 22.3% 25.7% 22.5% 429 7797 1179 9405
SL/ST 32.5% 27.5% 32.2% 28.4% 48.8% 51.8% 43.0% 50.4% 18.8% 20.7% 24.9% 21.2% 80 1883 342 2305
Annual leave carryover: Up to 720
hours of annual leave can be
carried over
SES 35.1% 29.9% 31.8% 30.4% 48.0% 47.3% 44.5% 47.0% 16.9% 22.8% 23.7% 22.6% 427 7797 1187 9411
SL/ST 37.0% 34.3% 38.4% 35.0% 45.7% 44.1% 41.0% 43.7% 17.3% 21.6% 20.6% 21.3% 81 1878 344 2303
Sabbaticals: Up to 11 months for
study or uncompensated work
experience
SES 34.5% 27.0% 28.8% 27.6% 46.4% 47.5% 44.5% 47.1% 19.1% 25.5% 26.6% 25.4% 429 7796 1186 9411
SL/ST - - - - - - - - - - - - - - - -
Last move home: Entitled to
moving expenses upon retirement
if reassigned
SES 37.1% 24.9% 24.6% 25.4% 42.9% 46.1% 44.2% 45.8% 20.0% 29.0% 31.2% 28.8% 429 7792 1181 9402
SL/ST - - - - - - - - - - - - - - - -
Appendix IV
Appendix IV
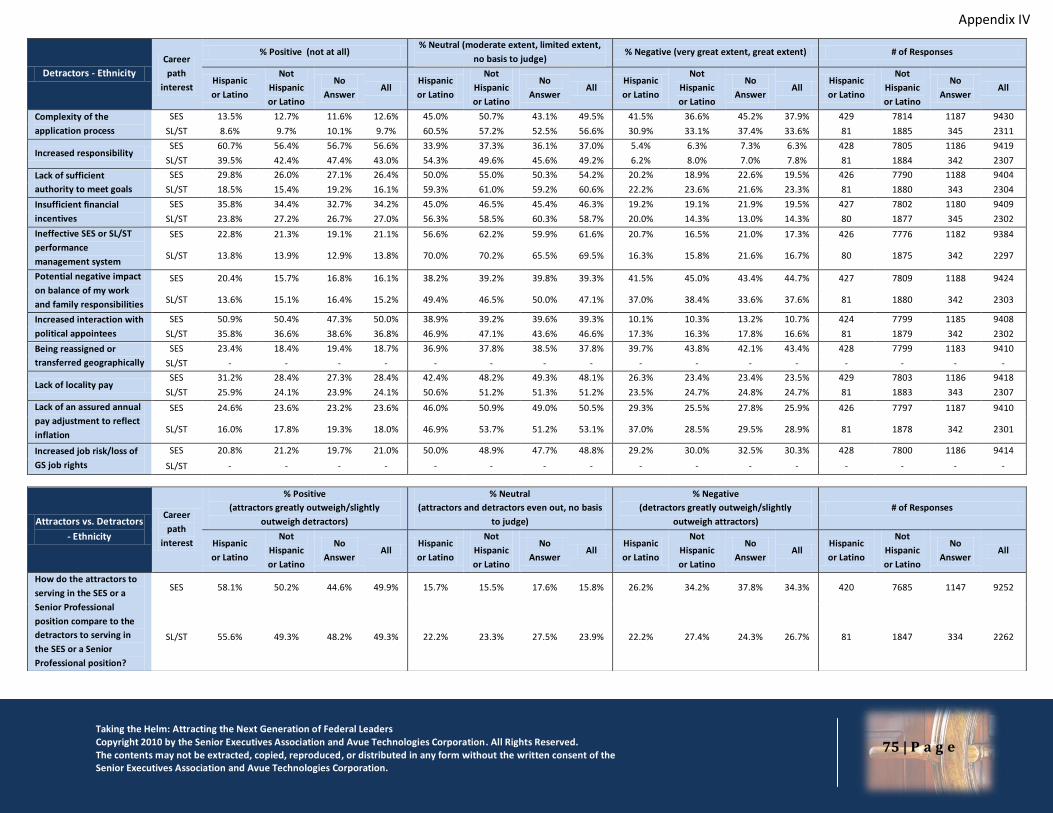
Taking the Helm: Attracting the Next Generation of Federal Leaders Copyright 2010 by the Senior Executives Association and Avue Technologies Corporation. All Rights Reserved. The contents may not be extracted, copied, reproduced, or distributed in any form without the written consent of the Senior Executives Association and Avue Technologies Corporation.
75 | P a g e
Detractors - Ethnicity
Career
path
interest
% Positive (not at all) % Neutral (moderate extent, limited extent,
no basis to judge) % Negative (very great extent, great extent) # of Responses
Hispanic
or Latino
Not
Hispanic
or Latino
No
Answer All
Hispanic
or Latino
Not
Hispanic
or Latino
No
Answer All
Hispanic
or Latino
Not
Hispanic
or Latino
No
Answer All
Hispanic
or Latino
Not
Hispanic
or Latino
No
Answer All
Complexity of the
application process
SES 13.5% 12.7% 11.6% 12.6% 45.0% 50.7% 43.1% 49.5% 41.5% 36.6% 45.2% 37.9% 429 7814 1187 9430
SL/ST 8.6% 9.7% 10.1% 9.7% 60.5% 57.2% 52.5% 56.6% 30.9% 33.1% 37.4% 33.6% 81 1885 345 2311
Increased responsibility SES 60.7% 56.4% 56.7% 56.6% 33.9% 37.3% 36.1% 37.0% 5.4% 6.3% 7.3% 6.3% 428 7805 1186 9419
SL/ST 39.5% 42.4% 47.4% 43.0% 54.3% 49.6% 45.6% 49.2% 6.2% 8.0% 7.0% 7.8% 81 1884 342 2307
Lack of sufficient
authority to meet goals
SES 29.8% 26.0% 27.1% 26.4% 50.0% 55.0% 50.3% 54.2% 20.2% 18.9% 22.6% 19.5% 426 7790 1188 9404
SL/ST 18.5% 15.4% 19.2% 16.1% 59.3% 61.0% 59.2% 60.6% 22.2% 23.6% 21.6% 23.3% 81 1880 343 2304
Insufficient financial
incentives
SES 35.8% 34.4% 32.7% 34.2% 45.0% 46.5% 45.4% 46.3% 19.2% 19.1% 21.9% 19.5% 427 7802 1180 9409
SL/ST 23.8% 27.2% 26.7% 27.0% 56.3% 58.5% 60.3% 58.7% 20.0% 14.3% 13.0% 14.3% 80 1877 345 2302
Ineffective SES or SL/ST
performance
management system
SES 22.8% 21.3% 19.1% 21.1% 56.6% 62.2% 59.9% 61.6% 20.7% 16.5% 21.0% 17.3% 426 7776 1182 9384
SL/ST 13.8% 13.9% 12.9% 13.8% 70.0% 70.2% 65.5% 69.5% 16.3% 15.8% 21.6% 16.7% 80 1875 342 2297
Potential negative impact
on balance of my work
and family responsibilities
SES 20.4% 15.7% 16.8% 16.1% 38.2% 39.2% 39.8% 39.3% 41.5% 45.0% 43.4% 44.7% 427 7809 1188 9424
SL/ST 13.6% 15.1% 16.4% 15.2% 49.4% 46.5% 50.0% 47.1% 37.0% 38.4% 33.6% 37.6% 81 1880 342 2303
Increased interaction with
political appointees
SES 50.9% 50.4% 47.3% 50.0% 38.9% 39.2% 39.6% 39.3% 10.1% 10.3% 13.2% 10.7% 424 7799 1185 9408
SL/ST 35.8% 36.6% 38.6% 36.8% 46.9% 47.1% 43.6% 46.6% 17.3% 16.3% 17.8% 16.6% 81 1879 342 2302
Being reassigned or
transferred geographically
SES 23.4% 18.4% 19.4% 18.7% 36.9% 37.8% 38.5% 37.8% 39.7% 43.8% 42.1% 43.4% 428 7799 1183 9410
SL/ST - - - - - - - - - - - - - - - -
Lack of locality pay SES 31.2% 28.4% 27.3% 28.4% 42.4% 48.2% 49.3% 48.1% 26.3% 23.4% 23.4% 23.5% 429 7803 1186 9418
SL/ST 25.9% 24.1% 23.9% 24.1% 50.6% 51.2% 51.3% 51.2% 23.5% 24.7% 24.8% 24.7% 81 1883 343 2307
Lack of an assured annual
pay adjustment to reflect
inflation
SES 24.6% 23.6% 23.2% 23.6% 46.0% 50.9% 49.0% 50.5% 29.3% 25.5% 27.8% 25.9% 426 7797 1187 9410
SL/ST 16.0% 17.8% 19.3% 18.0% 46.9% 53.7% 51.2% 53.1% 37.0% 28.5% 29.5% 28.9% 81 1878 342 2301
Increased job risk/loss of
GS job rights
SES 20.8% 21.2% 19.7% 21.0% 50.0% 48.9% 47.7% 48.8% 29.2% 30.0% 32.5% 30.3% 428 7800 1186 9414
SL/ST - - - - - - - - - - - - - - - -
Attractors vs. Detractors
- Ethnicity
Career
path
interest
% Positive
(attractors greatly outweigh/slightly
outweigh detractors)
% Neutral
(attractors and detractors even out, no basis
to judge)
% Negative
(detractors greatly outweigh/slightly
outweigh attractors)
# of Responses
Hispanic
or Latino
Not
Hispanic
or Latino
No
Answer All
Hispanic
or Latino
Not
Hispanic
or Latino
No
Answer All
Hispanic
or Latino
Not
Hispanic
or Latino
No
Answer All
Hispanic
or Latino
Not
Hispanic
or Latino
No
Answer All
How do the attractors to
serving in the SES or a
Senior Professional
position compare to the
detractors to serving in
the SES or a Senior
Professional position?
SES 58.1% 50.2% 44.6% 49.9% 15.7% 15.5% 17.6% 15.8% 26.2% 34.2% 37.8% 34.3% 420 7685 1147 9252
SL/ST 55.6% 49.3% 48.2% 49.3% 22.2% 23.3% 27.5% 23.9% 22.2% 27.4% 24.3% 26.7% 81 1847 334 2262
Appendix IV
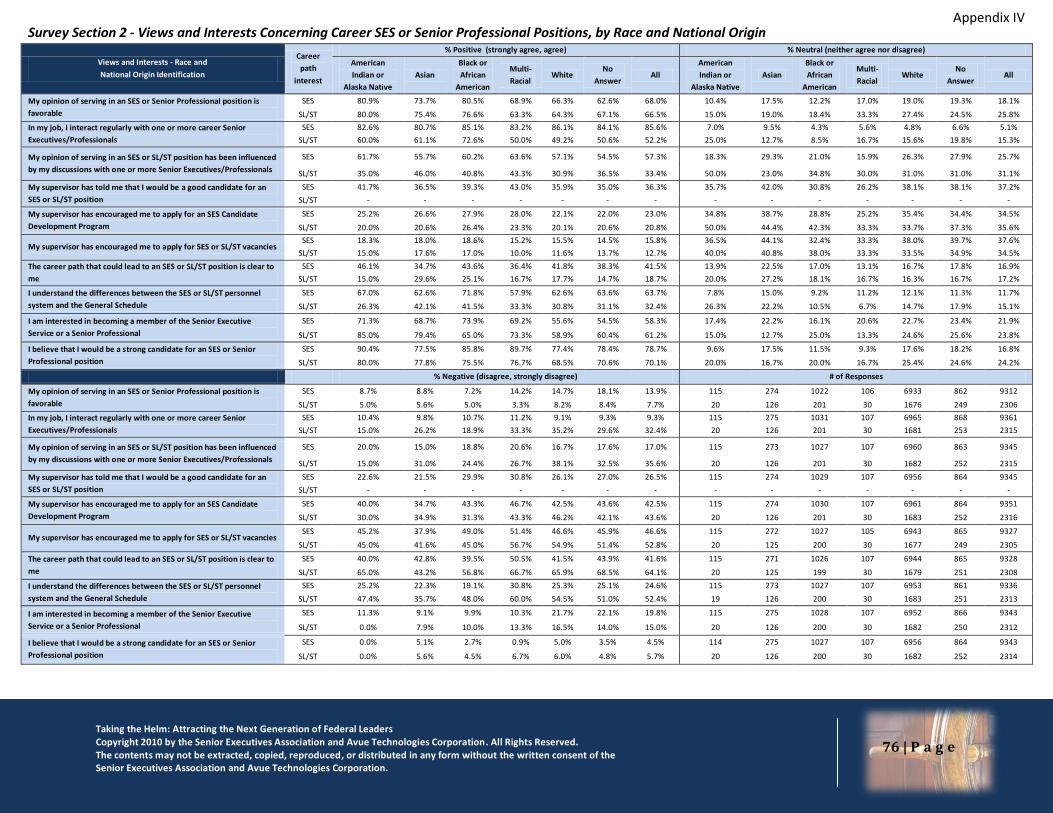
Taking the Helm: Attracting the Next Generation of Federal Leaders Copyright 2010 by the Senior Executives Association and Avue Technologies Corporation. All Rights Reserved. The contents may not be extracted, copied, reproduced, or distributed in any form without the written consent of the Senior Executives Association and Avue Technologies Corporation.
76 | P a g e
Survey Section 2 - Views and Interests Concerning Career SES or Senior Professional Positions, by Race and National Origin
Views and Interests - Race and
National Origin Identification
Career
path
interest
% Positive (strongly agree, agree) % Neutral (neither agree nor disagree)
American
Indian or
Alaska Native
Asian
Black or
African
American
Multi-
Racial White
No
Answer All
American
Indian or
Alaska Native
Asian
Black or
African
American
Multi-
Racial White
No
Answer All
My opinion of serving in an SES or Senior Professional position is
favorable
SES 80.9% 73.7% 80.5% 68.9% 66.3% 62.6% 68.0% 10.4% 17.5% 12.2% 17.0% 19.0% 19.3% 18.1%
SL/ST 80.0% 75.4% 76.6% 63.3% 64.3% 67.1% 66.5% 15.0% 19.0% 18.4% 33.3% 27.4% 24.5% 25.8%
In my job, I interact regularly with one or more career Senior
Executives/Professionals
SES 82.6% 80.7% 85.1% 83.2% 86.1% 84.1% 85.6% 7.0% 9.5% 4.3% 5.6% 4.8% 6.6% 5.1%
SL/ST 60.0% 61.1% 72.6% 50.0% 49.2% 50.6% 52.2% 25.0% 12.7% 8.5% 16.7% 15.6% 19.8% 15.3%
My opinion of serving in an SES or SL/ST position has been influenced
by my discussions with one or more Senior Executives/Professionals
SES 61.7% 55.7% 60.2% 63.6% 57.1% 54.5% 57.3% 18.3% 29.3% 21.0% 15.9% 26.3% 27.9% 25.7%
SL/ST 35.0% 46.0% 40.8% 43.3% 30.9% 36.5% 33.4% 50.0% 23.0% 34.8% 30.0% 31.0% 31.0% 31.1%
My supervisor has told me that I would be a good candidate for an
SES or SL/ST position
SES 41.7% 36.5% 39.3% 43.0% 35.9% 35.0% 36.3% 35.7% 42.0% 30.8% 26.2% 38.1% 38.1% 37.2%
SL/ST - - - - - - - - - - - - - -
My supervisor has encouraged me to apply for an SES Candidate
Development Program
SES 25.2% 26.6% 27.9% 28.0% 22.1% 22.0% 23.0% 34.8% 38.7% 28.8% 25.2% 35.4% 34.4% 34.5%
SL/ST 20.0% 20.6% 26.4% 23.3% 20.1% 20.6% 20.8% 50.0% 44.4% 42.3% 33.3% 33.7% 37.3% 35.6%
My supervisor has encouraged me to apply for SES or SL/ST vacancies SES 18.3% 18.0% 18.6% 15.2% 15.5% 14.5% 15.8% 36.5% 44.1% 32.4% 33.3% 38.0% 39.7% 37.6%
SL/ST 15.0% 17.6% 17.0% 10.0% 11.6% 13.7% 12.7% 40.0% 40.8% 38.0% 33.3% 33.5% 34.9% 34.5%
The career path that could lead to an SES or SL/ST position is clear to
me
SES 46.1% 34.7% 43.6% 36.4% 41.8% 38.3% 41.5% 13.9% 22.5% 17.0% 13.1% 16.7% 17.8% 16.9%
SL/ST 15.0% 29.6% 25.1% 16.7% 17.7% 14.7% 18.7% 20.0% 27.2% 18.1% 16.7% 16.3% 16.7% 17.2%
I understand the differences between the SES or SL/ST personnel
system and the General Schedule
SES 67.0% 62.6% 71.8% 57.9% 62.6% 63.6% 63.7% 7.8% 15.0% 9.2% 11.2% 12.1% 11.3% 11.7%
SL/ST 26.3% 42.1% 41.5% 33.3% 30.8% 31.1% 32.4% 26.3% 22.2% 10.5% 6.7% 14.7% 17.9% 15.1%
I am interested in becoming a member of the Senior Executive
Service or a Senior Professional
SES 71.3% 68.7% 73.9% 69.2% 55.6% 54.5% 58.3% 17.4% 22.2% 16.1% 20.6% 22.7% 23.4% 21.9%
SL/ST 85.0% 79.4% 65.0% 73.3% 58.9% 60.4% 61.2% 15.0% 12.7% 25.0% 13.3% 24.6% 25.6% 23.8%
I believe that I would be a strong candidate for an SES or Senior
Professional position
SES 90.4% 77.5% 85.8% 89.7% 77.4% 78.4% 78.7% 9.6% 17.5% 11.5% 9.3% 17.6% 18.2% 16.8%
SL/ST 80.0% 77.8% 75.5% 76.7% 68.5% 70.6% 70.1% 20.0% 16.7% 20.0% 16.7% 25.4% 24.6% 24.2%
% Negative (disagree, strongly disagree) # of Responses
My opinion of serving in an SES or Senior Professional position is
favorable
SES 8.7% 8.8% 7.2% 14.2% 14.7% 18.1% 13.9% 115 274 1022 106 6933 862 9312
SL/ST 5.0% 5.6% 5.0% 3.3% 8.2% 8.4% 7.7% 20 126 201 30 1676 249 2306
In my job, I interact regularly with one or more career Senior
Executives/Professionals
SES 10.4% 9.8% 10.7% 11.2% 9.1% 9.3% 9.3% 115 275 1031 107 6965 868 9361
SL/ST 15.0% 26.2% 18.9% 33.3% 35.2% 29.6% 32.4% 20 126 201 30 1681 253 2315
My opinion of serving in an SES or SL/ST position has been influenced
by my discussions with one or more Senior Executives/Professionals
SES 20.0% 15.0% 18.8% 20.6% 16.7% 17.6% 17.0% 115 273 1027 107 6960 863 9345
SL/ST 15.0% 31.0% 24.4% 26.7% 38.1% 32.5% 35.6% 20 126 201 30 1682 252 2315
My supervisor has told me that I would be a good candidate for an
SES or SL/ST position
SES 22.6% 21.5% 29.9% 30.8% 26.1% 27.0% 26.5% 115 274 1029 107 6956 864 9345
SL/ST - - - - - - - - - - - - - -
My supervisor has encouraged me to apply for an SES Candidate
Development Program
SES 40.0% 34.7% 43.3% 46.7% 42.5% 43.6% 42.5% 115 274 1030 107 6961 864 9351
SL/ST 30.0% 34.9% 31.3% 43.3% 46.2% 42.1% 43.6% 20 126 201 30 1683 252 2316
My supervisor has encouraged me to apply for SES or SL/ST vacancies SES 45.2% 37.9% 49.0% 51.4% 46.6% 45.9% 46.6% 115 272 1027 105 6943 865 9327
SL/ST 45.0% 41.6% 45.0% 56.7% 54.9% 51.4% 52.8% 20 125 200 30 1677 249 2305
The career path that could lead to an SES or SL/ST position is clear to
me
SES 40.0% 42.8% 39.5% 50.5% 41.5% 43.9% 41.6% 115 271 1026 107 6944 865 9328
SL/ST 65.0% 43.2% 56.8% 66.7% 65.9% 68.5% 64.1% 20 125 199 30 1679 251 2308
I understand the differences between the SES or SL/ST personnel
system and the General Schedule
SES 25.2% 22.3% 19.1% 30.8% 25.3% 25.1% 24.6% 115 273 1027 107 6953 861 9336
SL/ST 47.4% 35.7% 48.0% 60.0% 54.5% 51.0% 52.4% 19 126 200 30 1683 251 2313
I am interested in becoming a member of the Senior Executive
Service or a Senior Professional
SES 11.3% 9.1% 9.9% 10.3% 21.7% 22.1% 19.8% 115 275 1028 107 6952 866 9343
SL/ST 0.0% 7.9% 10.0% 13.3% 16.5% 14.0% 15.0% 20 126 200 30 1682 250 2312
I believe that I would be a strong candidate for an SES or Senior
Professional position
SES 0.0% 5.1% 2.7% 0.9% 5.0% 3.5% 4.5% 114 275 1027 107 6956 864 9343
SL/ST 0.0% 5.6% 4.5% 6.7% 6.0% 4.8% 5.7% 20 126 200 30 1682 252 2314
Appendix IV
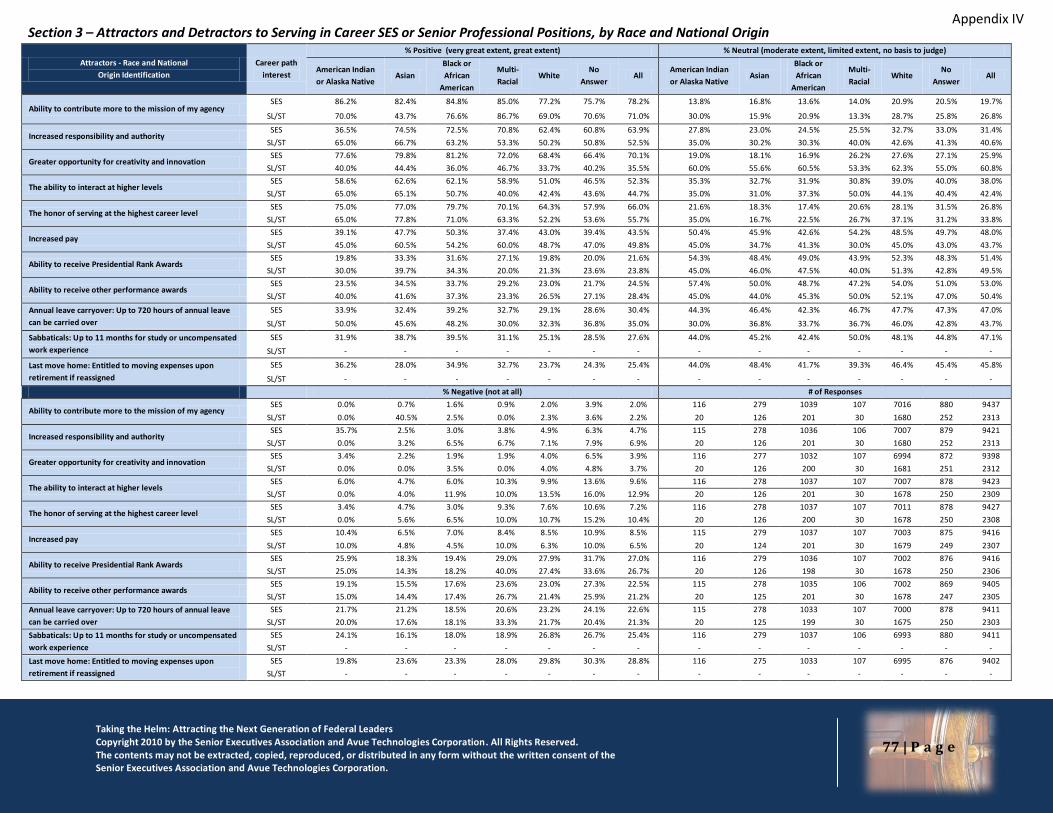
Taking the Helm: Attracting the Next Generation of Federal Leaders Copyright 2010 by the Senior Executives Association and Avue Technologies Corporation. All Rights Reserved. The contents may not be extracted, copied, reproduced, or distributed in any form without the written consent of the Senior Executives Association and Avue Technologies Corporation.
77 | P a g e
Section 3 – Attractors and Detractors to Serving in Career SES or Senior Professional Positions, by Race and National Origin
Attractors - Race and National
Origin Identification
Career path
interest
% Positive (very great extent, great extent) % Neutral (moderate extent, limited extent, no basis to judge)
American Indian
or Alaska Native Asian
Black or
African
American
Multi-
Racial White
No
Answer All
American Indian
or Alaska Native Asian
Black or
African
American
Multi-
Racial White
No
Answer All
Ability to contribute more to the mission of my agency SES 86.2% 82.4% 84.8% 85.0% 77.2% 75.7% 78.2% 13.8% 16.8% 13.6% 14.0% 20.9% 20.5% 19.7%
SL/ST 70.0% 43.7% 76.6% 86.7% 69.0% 70.6% 71.0% 30.0% 15.9% 20.9% 13.3% 28.7% 25.8% 26.8%
Increased responsibility and authority SES 36.5% 74.5% 72.5% 70.8% 62.4% 60.8% 63.9% 27.8% 23.0% 24.5% 25.5% 32.7% 33.0% 31.4%
SL/ST 65.0% 66.7% 63.2% 53.3% 50.2% 50.8% 52.5% 35.0% 30.2% 30.3% 40.0% 42.6% 41.3% 40.6%
Greater opportunity for creativity and innovation SES 77.6% 79.8% 81.2% 72.0% 68.4% 66.4% 70.1% 19.0% 18.1% 16.9% 26.2% 27.6% 27.1% 25.9%
SL/ST 40.0% 44.4% 36.0% 46.7% 33.7% 40.2% 35.5% 60.0% 55.6% 60.5% 53.3% 62.3% 55.0% 60.8%
The ability to interact at higher levels SES 58.6% 62.6% 62.1% 58.9% 51.0% 46.5% 52.3% 35.3% 32.7% 31.9% 30.8% 39.0% 40.0% 38.0%
SL/ST 65.0% 65.1% 50.7% 40.0% 42.4% 43.6% 44.7% 35.0% 31.0% 37.3% 50.0% 44.1% 40.4% 42.4%
The honor of serving at the highest career level SES 75.0% 77.0% 79.7% 70.1% 64.3% 57.9% 66.0% 21.6% 18.3% 17.4% 20.6% 28.1% 31.5% 26.8%
SL/ST 65.0% 77.8% 71.0% 63.3% 52.2% 53.6% 55.7% 35.0% 16.7% 22.5% 26.7% 37.1% 31.2% 33.8%
Increased pay SES 39.1% 47.7% 50.3% 37.4% 43.0% 39.4% 43.5% 50.4% 45.9% 42.6% 54.2% 48.5% 49.7% 48.0%
SL/ST 45.0% 60.5% 54.2% 60.0% 48.7% 47.0% 49.8% 45.0% 34.7% 41.3% 30.0% 45.0% 43.0% 43.7%
Ability to receive Presidential Rank Awards SES 19.8% 33.3% 31.6% 27.1% 19.8% 20.0% 21.6% 54.3% 48.4% 49.0% 43.9% 52.3% 48.3% 51.4%
SL/ST 30.0% 39.7% 34.3% 20.0% 21.3% 23.6% 23.8% 45.0% 46.0% 47.5% 40.0% 51.3% 42.8% 49.5%
Ability to receive other performance awards SES 23.5% 34.5% 33.7% 29.2% 23.0% 21.7% 24.5% 57.4% 50.0% 48.7% 47.2% 54.0% 51.0% 53.0%
SL/ST 40.0% 41.6% 37.3% 23.3% 26.5% 27.1% 28.4% 45.0% 44.0% 45.3% 50.0% 52.1% 47.0% 50.4%
Annual leave carryover: Up to 720 hours of annual leave
can be carried over
SES 33.9% 32.4% 39.2% 32.7% 29.1% 28.6% 30.4% 44.3% 46.4% 42.3% 46.7% 47.7% 47.3% 47.0%
SL/ST 50.0% 45.6% 48.2% 30.0% 32.3% 36.8% 35.0% 30.0% 36.8% 33.7% 36.7% 46.0% 42.8% 43.7%
Sabbaticals: Up to 11 months for study or uncompensated
work experience
SES 31.9% 38.7% 39.5% 31.1% 25.1% 28.5% 27.6% 44.0% 45.2% 42.4% 50.0% 48.1% 44.8% 47.1%
SL/ST - - - - - - - - - - - - - -
Last move home: Entitled to moving expenses upon
retirement if reassigned
SES 36.2% 28.0% 34.9% 32.7% 23.7% 24.3% 25.4% 44.0% 48.4% 41.7% 39.3% 46.4% 45.4% 45.8%
SL/ST - - - - - - - - - - - - - -
% Negative (not at all) # of Responses
Ability to contribute more to the mission of my agency SES 0.0% 0.7% 1.6% 0.9% 2.0% 3.9% 2.0% 116 279 1039 107 7016 880 9437
SL/ST 0.0% 40.5% 2.5% 0.0% 2.3% 3.6% 2.2% 20 126 201 30 1680 252 2313
Increased responsibility and authority SES 35.7% 2.5% 3.0% 3.8% 4.9% 6.3% 4.7% 115 278 1036 106 7007 879 9421
SL/ST 0.0% 3.2% 6.5% 6.7% 7.1% 7.9% 6.9% 20 126 201 30 1680 252 2313
Greater opportunity for creativity and innovation SES 3.4% 2.2% 1.9% 1.9% 4.0% 6.5% 3.9% 116 277 1032 107 6994 872 9398
SL/ST 0.0% 0.0% 3.5% 0.0% 4.0% 4.8% 3.7% 20 126 200 30 1681 251 2312
The ability to interact at higher levels SES 6.0% 4.7% 6.0% 10.3% 9.9% 13.6% 9.6% 116 278 1037 107 7007 878 9423
SL/ST 0.0% 4.0% 11.9% 10.0% 13.5% 16.0% 12.9% 20 126 201 30 1678 250 2309
The honor of serving at the highest career level SES 3.4% 4.7% 3.0% 9.3% 7.6% 10.6% 7.2% 116 278 1037 107 7011 878 9427
SL/ST 0.0% 5.6% 6.5% 10.0% 10.7% 15.2% 10.4% 20 126 200 30 1678 250 2308
Increased pay SES 10.4% 6.5% 7.0% 8.4% 8.5% 10.9% 8.5% 115 279 1037 107 7003 875 9416
SL/ST 10.0% 4.8% 4.5% 10.0% 6.3% 10.0% 6.5% 20 124 201 30 1679 249 2307
Ability to receive Presidential Rank Awards SES 25.9% 18.3% 19.4% 29.0% 27.9% 31.7% 27.0% 116 279 1036 107 7002 876 9416
SL/ST 25.0% 14.3% 18.2% 40.0% 27.4% 33.6% 26.7% 20 126 198 30 1678 250 2306
Ability to receive other performance awards SES 19.1% 15.5% 17.6% 23.6% 23.0% 27.3% 22.5% 115 278 1035 106 7002 869 9405
SL/ST 15.0% 14.4% 17.4% 26.7% 21.4% 25.9% 21.2% 20 125 201 30 1678 247 2305
Annual leave carryover: Up to 720 hours of annual leave
can be carried over
SES 21.7% 21.2% 18.5% 20.6% 23.2% 24.1% 22.6% 115 278 1033 107 7000 878 9411
SL/ST 20.0% 17.6% 18.1% 33.3% 21.7% 20.4% 21.3% 20 125 199 30 1675 250 2303
Sabbaticals: Up to 11 months for study or uncompensated
work experience
SES 24.1% 16.1% 18.0% 18.9% 26.8% 26.7% 25.4% 116 279 1037 106 6993 880 9411
SL/ST - - - - - - - - - - - - - -
Last move home: Entitled to moving expenses upon
retirement if reassigned
SES 19.8% 23.6% 23.3% 28.0% 29.8% 30.3% 28.8% 116 275 1033 107 6995 876 9402
SL/ST - - - - - - - - - - - - - -
Appendix IV
Appendix IV
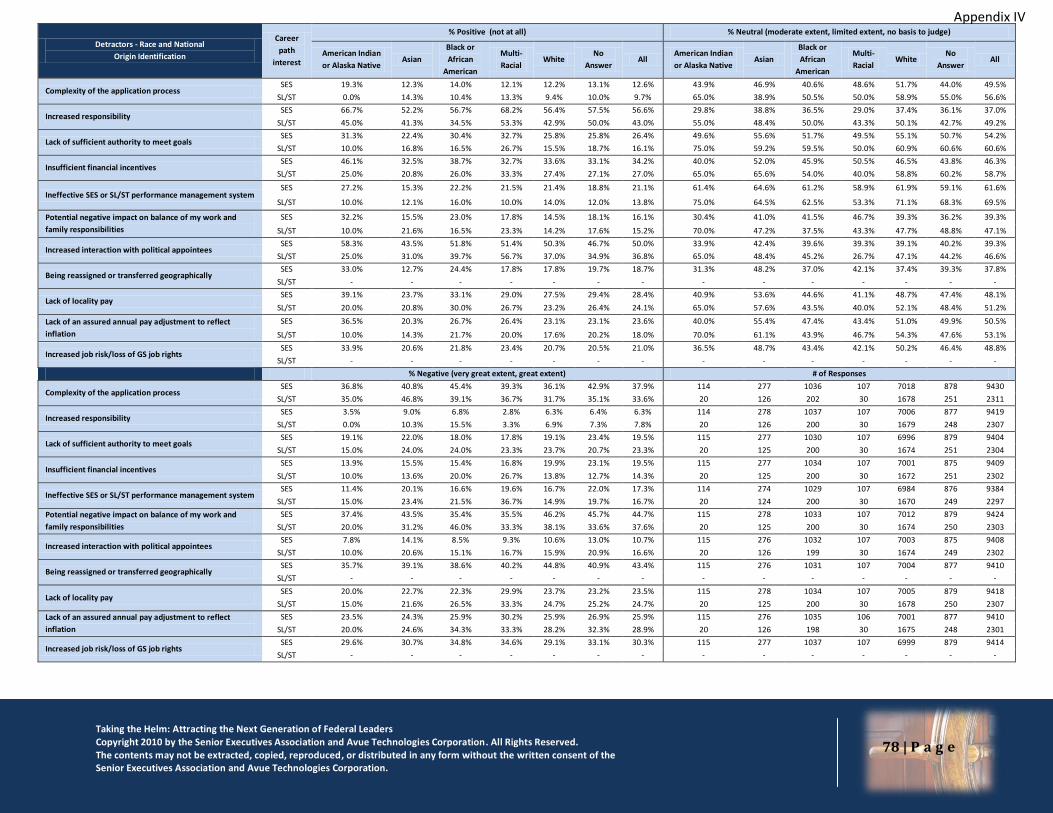
Taking the Helm: Attracting the Next Generation of Federal Leaders Copyright 2010 by the Senior Executives Association and Avue Technologies Corporation. All Rights Reserved. The contents may not be extracted, copied, reproduced, or distributed in any form without the written consent of the Senior Executives Association and Avue Technologies Corporation.
78 | P a g e
Detractors - Race and National
Origin Identification
Career
path
interest
% Positive (not at all) % Neutral (moderate extent, limited extent, no basis to judge)
American Indian
or Alaska Native Asian
Black or
African
American
Multi-
Racial White
No
Answer All
American Indian
or Alaska Native Asian
Black or
African
American
Multi-
Racial White
No
Answer All
Complexity of the application process SES 19.3% 12.3% 14.0% 12.1% 12.2% 13.1% 12.6% 43.9% 46.9% 40.6% 48.6% 51.7% 44.0% 49.5%
SL/ST 0.0% 14.3% 10.4% 13.3% 9.4% 10.0% 9.7% 65.0% 38.9% 50.5% 50.0% 58.9% 55.0% 56.6%
Increased responsibility SES 66.7% 52.2% 56.7% 68.2% 56.4% 57.5% 56.6% 29.8% 38.8% 36.5% 29.0% 37.4% 36.1% 37.0%
SL/ST 45.0% 41.3% 34.5% 53.3% 42.9% 50.0% 43.0% 55.0% 48.4% 50.0% 43.3% 50.1% 42.7% 49.2%
Lack of sufficient authority to meet goals SES 31.3% 22.4% 30.4% 32.7% 25.8% 25.8% 26.4% 49.6% 55.6% 51.7% 49.5% 55.1% 50.7% 54.2%
SL/ST 10.0% 16.8% 16.5% 26.7% 15.5% 18.7% 16.1% 75.0% 59.2% 59.5% 50.0% 60.9% 60.6% 60.6%
Insufficient financial incentives SES 46.1% 32.5% 38.7% 32.7% 33.6% 33.1% 34.2% 40.0% 52.0% 45.9% 50.5% 46.5% 43.8% 46.3%
SL/ST 25.0% 20.8% 26.0% 33.3% 27.4% 27.1% 27.0% 65.0% 65.6% 54.0% 40.0% 58.8% 60.2% 58.7%
Ineffective SES or SL/ST performance management system SES 27.2% 15.3% 22.2% 21.5% 21.4% 18.8% 21.1% 61.4% 64.6% 61.2% 58.9% 61.9% 59.1% 61.6%
SL/ST 10.0% 12.1% 16.0% 10.0% 14.0% 12.0% 13.8% 75.0% 64.5% 62.5% 53.3% 71.1% 68.3% 69.5%
Potential negative impact on balance of my work and
family responsibilities
SES 32.2% 15.5% 23.0% 17.8% 14.5% 18.1% 16.1% 30.4% 41.0% 41.5% 46.7% 39.3% 36.2% 39.3%
SL/ST 10.0% 21.6% 16.5% 23.3% 14.2% 17.6% 15.2% 70.0% 47.2% 37.5% 43.3% 47.7% 48.8% 47.1%
Increased interaction with political appointees SES 58.3% 43.5% 51.8% 51.4% 50.3% 46.7% 50.0% 33.9% 42.4% 39.6% 39.3% 39.1% 40.2% 39.3%
SL/ST 25.0% 31.0% 39.7% 56.7% 37.0% 34.9% 36.8% 65.0% 48.4% 45.2% 26.7% 47.1% 44.2% 46.6%
Being reassigned or transferred geographically SES 33.0% 12.7% 24.4% 17.8% 17.8% 19.7% 18.7% 31.3% 48.2% 37.0% 42.1% 37.4% 39.3% 37.8%
SL/ST - - - - - - - - - - - - - -
Lack of locality pay SES 39.1% 23.7% 33.1% 29.0% 27.5% 29.4% 28.4% 40.9% 53.6% 44.6% 41.1% 48.7% 47.4% 48.1%
SL/ST 20.0% 20.8% 30.0% 26.7% 23.2% 26.4% 24.1% 65.0% 57.6% 43.5% 40.0% 52.1% 48.4% 51.2%
Lack of an assured annual pay adjustment to reflect
inflation
SES 36.5% 20.3% 26.7% 26.4% 23.1% 23.1% 23.6% 40.0% 55.4% 47.4% 43.4% 51.0% 49.9% 50.5%
SL/ST 10.0% 14.3% 21.7% 20.0% 17.6% 20.2% 18.0% 70.0% 61.1% 43.9% 46.7% 54.3% 47.6% 53.1%
Increased job risk/loss of GS job rights SES 33.9% 20.6% 21.8% 23.4% 20.7% 20.5% 21.0% 36.5% 48.7% 43.4% 42.1% 50.2% 46.4% 48.8%
SL/ST - - - - - - - - - - - - - -
% Negative (very great extent, great extent) # of Responses
Complexity of the application process SES 36.8% 40.8% 45.4% 39.3% 36.1% 42.9% 37.9% 114 277 1036 107 7018 878 9430
SL/ST 35.0% 46.8% 39.1% 36.7% 31.7% 35.1% 33.6% 20 126 202 30 1678 251 2311
Increased responsibility SES 3.5% 9.0% 6.8% 2.8% 6.3% 6.4% 6.3% 114 278 1037 107 7006 877 9419
SL/ST 0.0% 10.3% 15.5% 3.3% 6.9% 7.3% 7.8% 20 126 200 30 1679 248 2307
Lack of sufficient authority to meet goals SES 19.1% 22.0% 18.0% 17.8% 19.1% 23.4% 19.5% 115 277 1030 107 6996 879 9404
SL/ST 15.0% 24.0% 24.0% 23.3% 23.7% 20.7% 23.3% 20 125 200 30 1674 251 2304
Insufficient financial incentives SES 13.9% 15.5% 15.4% 16.8% 19.9% 23.1% 19.5% 115 277 1034 107 7001 875 9409
SL/ST 10.0% 13.6% 20.0% 26.7% 13.8% 12.7% 14.3% 20 125 200 30 1672 251 2302
Ineffective SES or SL/ST performance management system SES 11.4% 20.1% 16.6% 19.6% 16.7% 22.0% 17.3% 114 274 1029 107 6984 876 9384
SL/ST 15.0% 23.4% 21.5% 36.7% 14.9% 19.7% 16.7% 20 124 200 30 1670 249 2297
Potential negative impact on balance of my work and
family responsibilities
SES 37.4% 43.5% 35.4% 35.5% 46.2% 45.7% 44.7% 115 278 1033 107 7012 879 9424
SL/ST 20.0% 31.2% 46.0% 33.3% 38.1% 33.6% 37.6% 20 125 200 30 1674 250 2303
Increased interaction with political appointees SES 7.8% 14.1% 8.5% 9.3% 10.6% 13.0% 10.7% 115 276 1032 107 7003 875 9408
SL/ST 10.0% 20.6% 15.1% 16.7% 15.9% 20.9% 16.6% 20 126 199 30 1674 249 2302
Being reassigned or transferred geographically SES 35.7% 39.1% 38.6% 40.2% 44.8% 40.9% 43.4% 115 276 1031 107 7004 877 9410
SL/ST - - - - - - - - - - - - - -
Lack of locality pay SES 20.0% 22.7% 22.3% 29.9% 23.7% 23.2% 23.5% 115 278 1034 107 7005 879 9418
SL/ST 15.0% 21.6% 26.5% 33.3% 24.7% 25.2% 24.7% 20 125 200 30 1678 250 2307
Lack of an assured annual pay adjustment to reflect
inflation
SES 23.5% 24.3% 25.9% 30.2% 25.9% 26.9% 25.9% 115 276 1035 106 7001 877 9410
SL/ST 20.0% 24.6% 34.3% 33.3% 28.2% 32.3% 28.9% 20 126 198 30 1675 248 2301
Increased job risk/loss of GS job rights SES 29.6% 30.7% 34.8% 34.6% 29.1% 33.1% 30.3% 115 277 1037 107 6999 879 9414
SL/ST - - - - - - - - - - - - - -
Appendix IV
Appendix IV
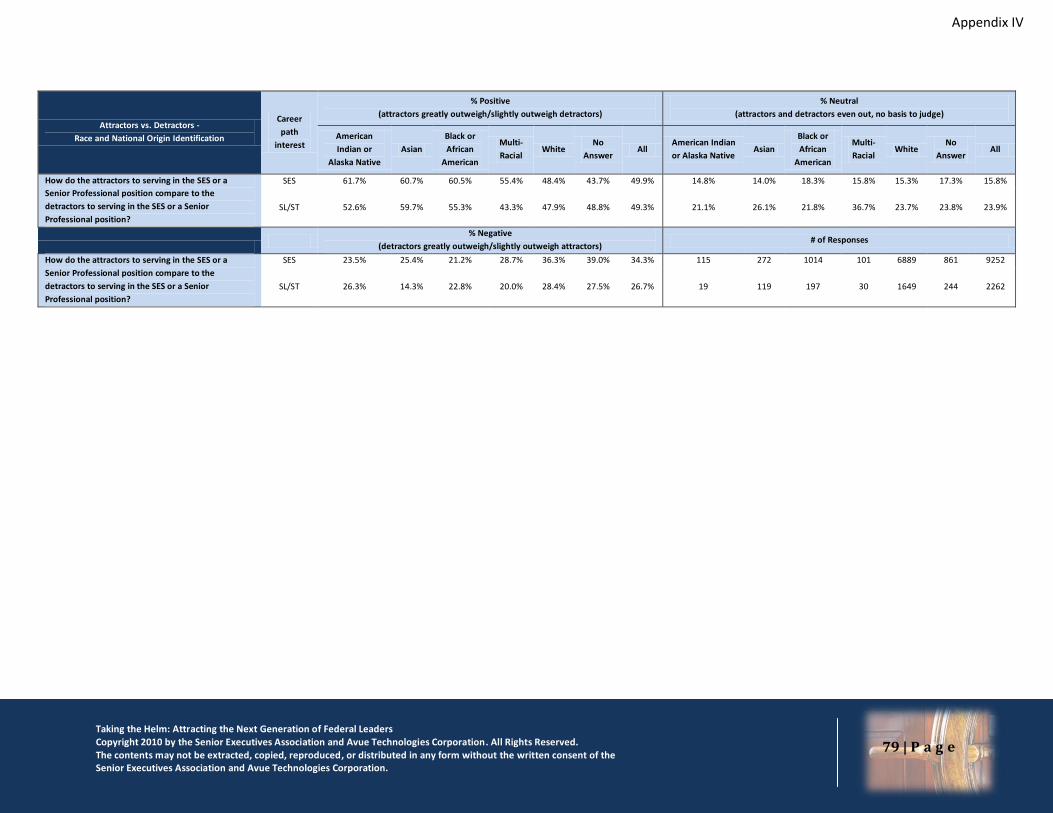
Taking the Helm: Attracting the Next Generation of Federal Leaders Copyright 2010 by the Senior Executives Association and Avue Technologies Corporation. All Rights Reserved. The contents may not be extracted, copied, reproduced, or distributed in any form without the written consent of the Senior Executives Association and Avue Technologies Corporation.
79 | P a g e
Attractors vs. Detractors -
Race and National Origin Identification
Career
path
interest
% Positive
(attractors greatly outweigh/slightly outweigh detractors)
% Neutral
(attractors and detractors even out, no basis to judge)
American
Indian or
Alaska Native
Asian
Black or
African
American
Multi-
Racial White
No
Answer All
American Indian
or Alaska Native Asian
Black or
African
American
Multi-
Racial White
No
Answer All
How do the attractors to serving in the SES or a
Senior Professional position compare to the
detractors to serving in the SES or a Senior
Professional position?
SES 61.7% 60.7% 60.5% 55.4% 48.4% 43.7% 49.9% 14.8% 14.0% 18.3% 15.8% 15.3% 17.3% 15.8%
SL/ST 52.6% 59.7% 55.3% 43.3% 47.9% 48.8% 49.3% 21.1% 26.1% 21.8% 36.7% 23.7% 23.8% 23.9%
% Negative
(detractors greatly outweigh/slightly outweigh attractors) # of Responses
How do the attractors to serving in the SES or a
Senior Professional position compare to the
detractors to serving in the SES or a Senior
Professional position?
SES 23.5% 25.4% 21.2% 28.7% 36.3% 39.0% 34.3% 115 272 1014 101 6889 861 9252
SL/ST 26.3% 14.3% 22.8% 20.0% 28.4% 27.5% 26.7% 19 119 197 30 1649 244 2262
Appendix IV
Appendix IV


Senior Executives Association
Professional Development League
820 First Street NE
Suite 700
Washington, DC 20002
202.927.7000
www.seniorexecs.org