attrition measurement update year end 2013 developing meaningful trends prepared by: trg associates,...
TRANSCRIPT
ATTRITION MEASUREMENTUPDATE YEAR END 2013DEVELOPING MEANINGFULTRENDS
Prepared By: TRG Associates, Inc.860-395-0548www.trgassociates.com
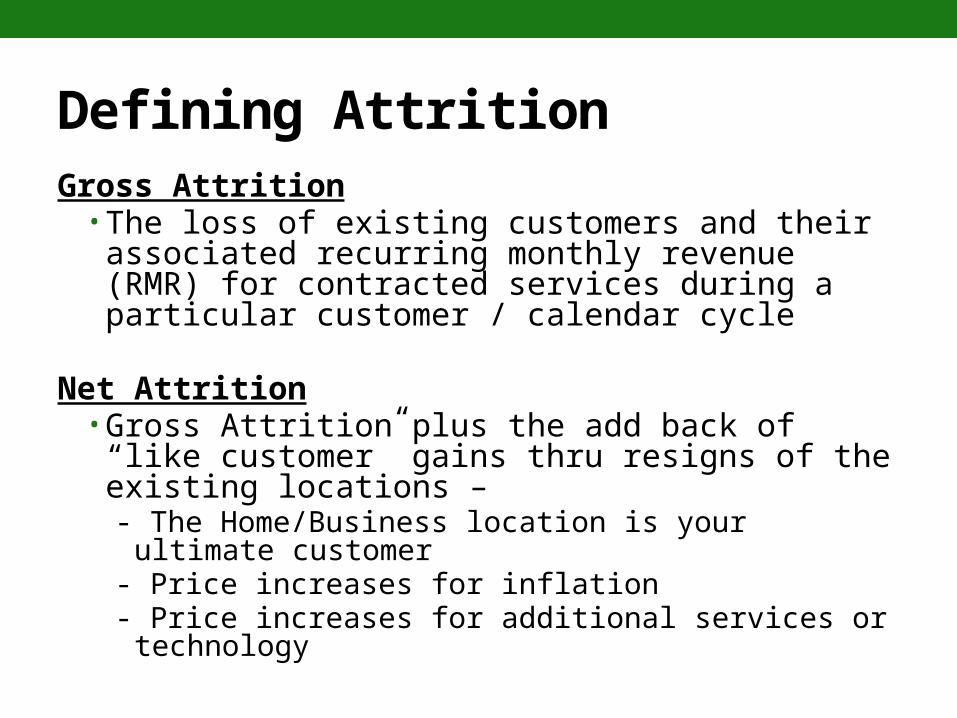
Defining AttritionGross Attrition
• The loss of existing customers and their associated recurring monthly revenue (RMR) for contracted services during a particular customer / calendar cycle
Net Attrition• Gross Attrition plus the add back of “like customer” gains thru resigns of the existing locations – - The Home/Business location is your ultimate
customer- Price increases for inflation- Price increases for additional services or technology
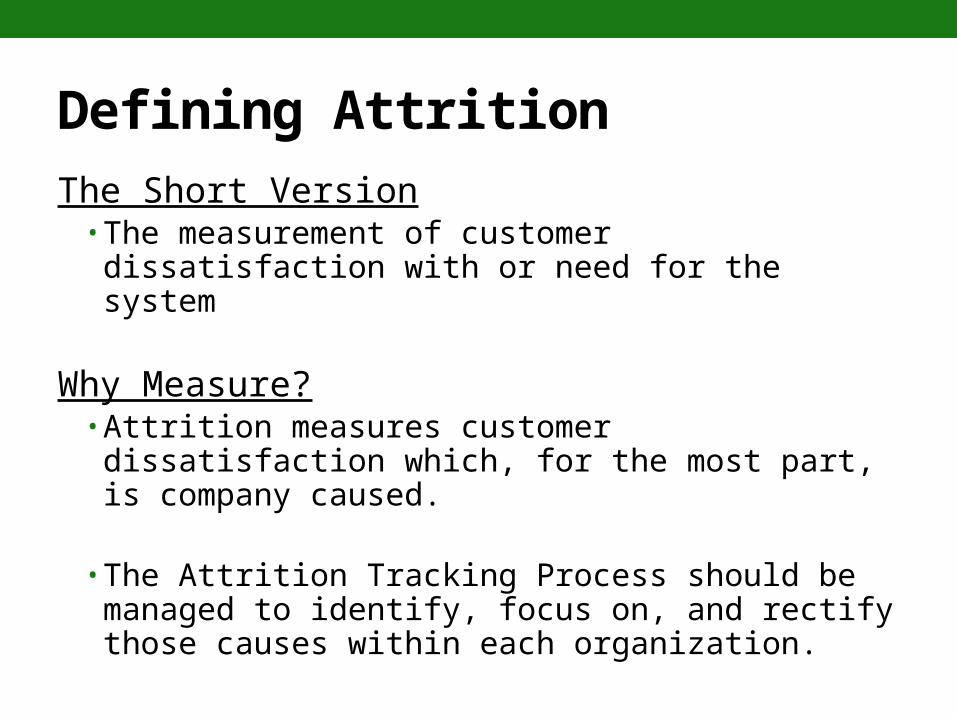
Defining Attrition
The Short Version• The measurement of customer dissatisfaction with or need for the system
Why Measure?• Attrition measures customer dissatisfaction which, for the most part, is company caused.
• The Attrition Tracking Process should be managed to identify, focus on, and rectify those causes within each organization.
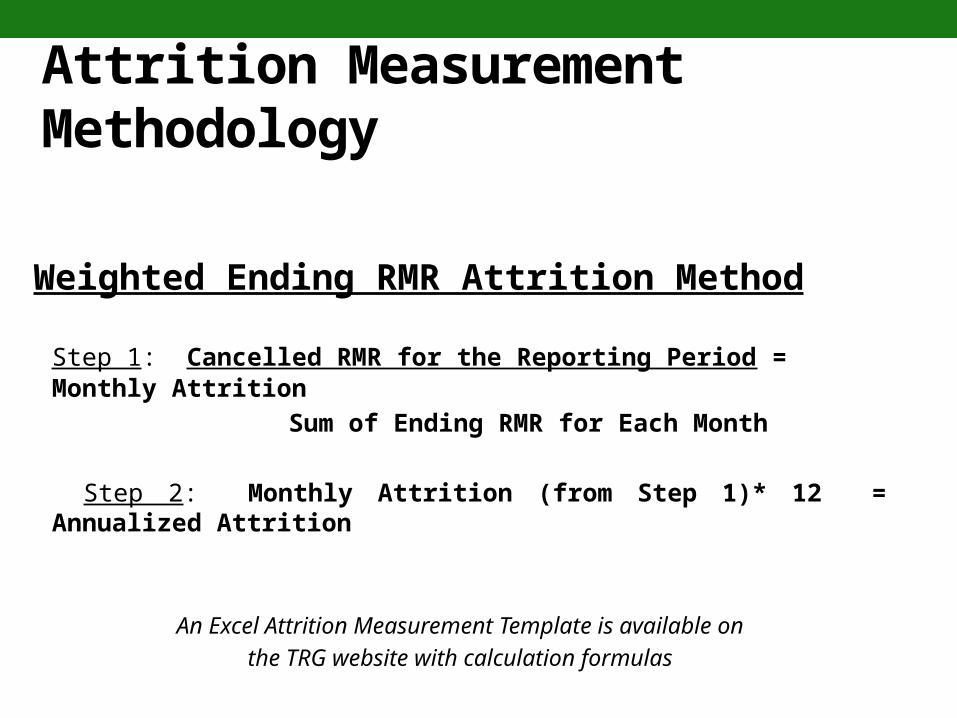
Attrition Measurement Methodology
Weighted Ending RMR Attrition Method
Step 1: Cancelled RMR for the Reporting Period = Monthly Attrition
Sum of Ending RMR for Each Month
Step 2: Monthly Attrition (from Step 1)* 12 = Annualized Attrition
An Excel Attrition Measurement Template is available on
the TRG website with calculation formulas
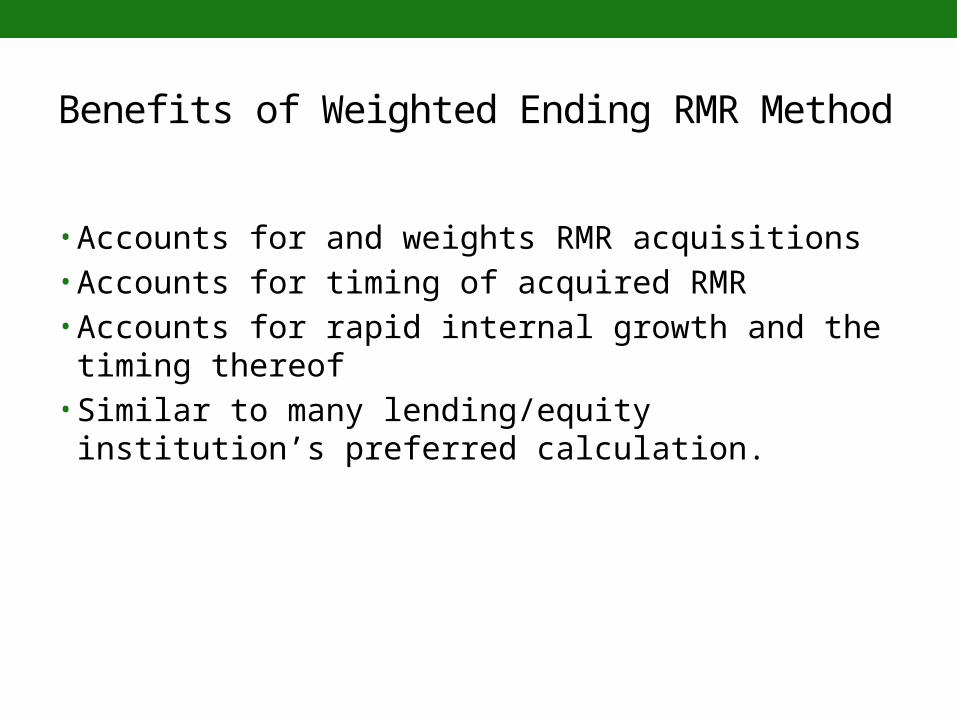
Benefits of Weighted Ending RMR Method
• Accounts for and weights RMR acquisitions• Accounts for timing of acquired RMR• Accounts for rapid internal growth and the timing thereof
• Similar to many lending/equity institution’s preferred calculation.
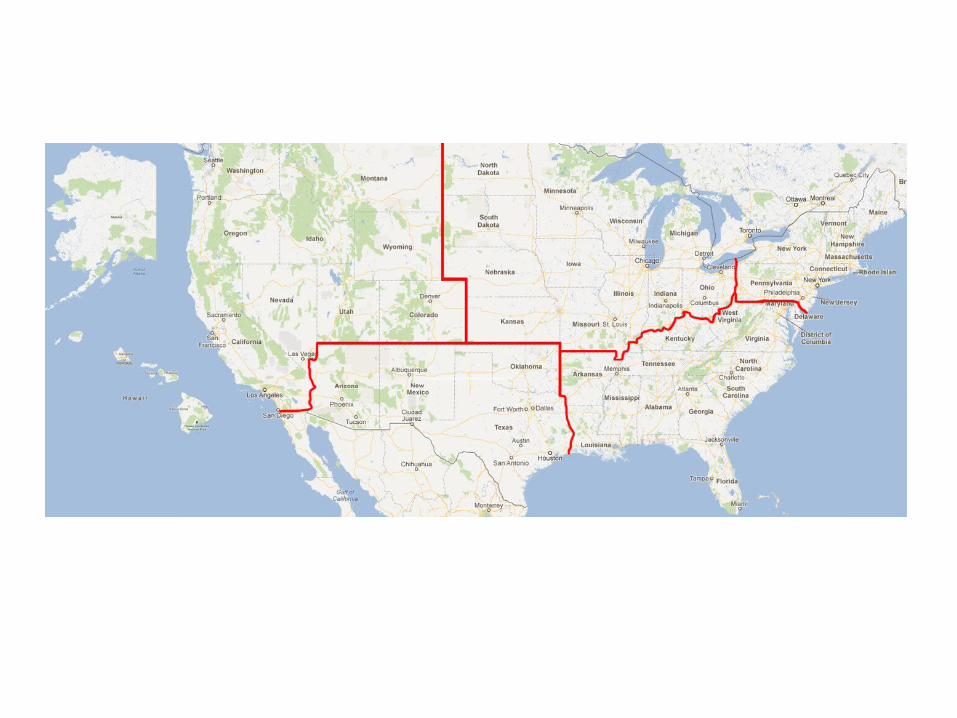
The Geography of Attrition
• NE/Mid Atlantic• Southeast• Midwest• Southwest• West• International
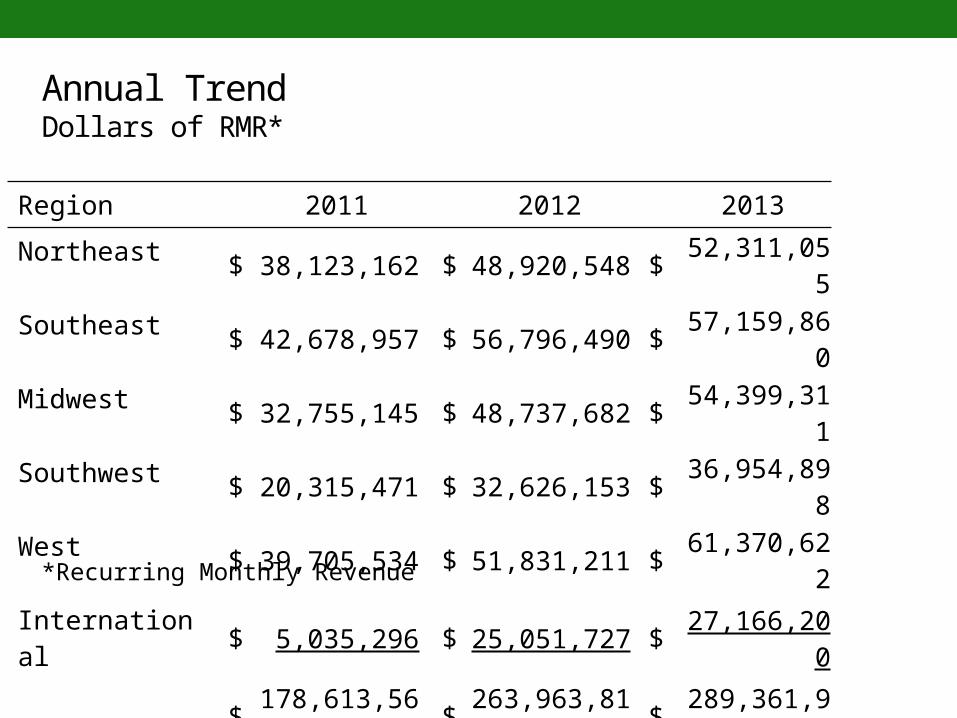
Annual TrendDollars of RMR*
Region 2011 2012 2013
Northeast $ 38,123,162 $ 48,920,548 $ 52,311,055
Southeast $ 42,678,957 $ 56,796,490 $ 57,159,860
Midwest $ 32,755,145 $ 48,737,682 $ 54,399,311
Southwest $ 20,315,471 $ 32,626,153 $ 36,954,898
West $ 39,705,534 $ 51,831,211 $ 61,370,622
International $ 5,035,296 $ 25,051,727 $ 27,166,200
$ 178,613,564
$ 263,963,811
$ 289,361,946
*Recurring Monthly Revenue
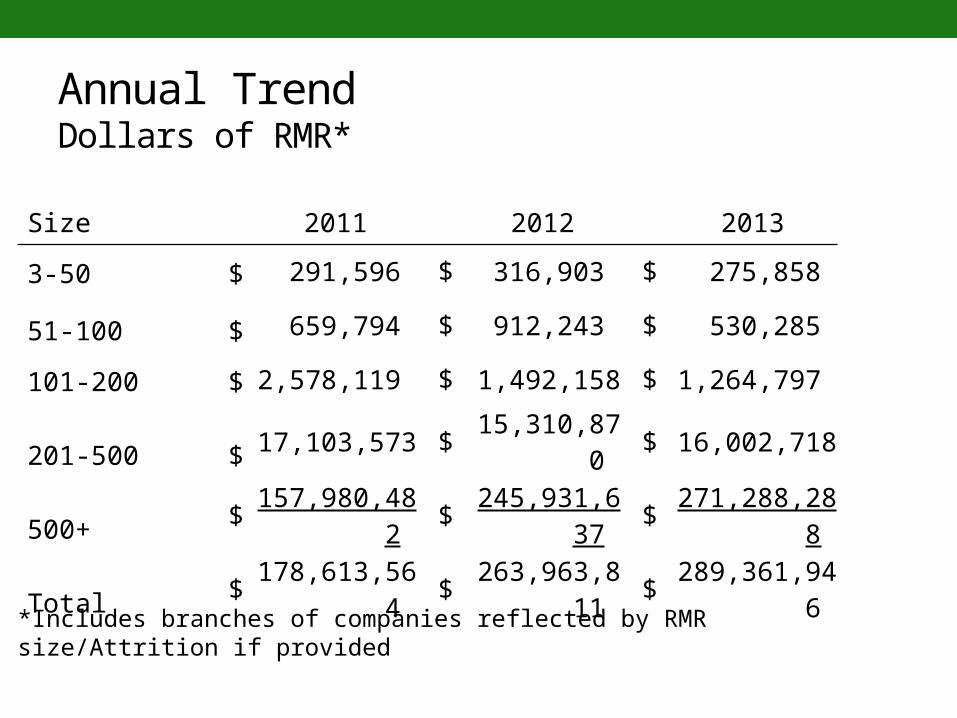
Annual TrendDollars of RMR*
Size 2011 2012 2013
3-50 $ 291,596 $ 316,903 $ 275,858
51-100 $ 659,794 $ 912,243 $ 530,285
101-200 $ 2,578,119 $ 1,492,158 $ 1,264,797
201-500 $ 17,103,573 $ 15,310,870 $ 16,002,718
500+ $ 157,980,482
$ 245,931,637
$ 271,288,288
Total $ 178,613,564
$ 263,963,811
$ 289,361,946
*Includes branches of companies reflected by RMR size/Attrition if provided
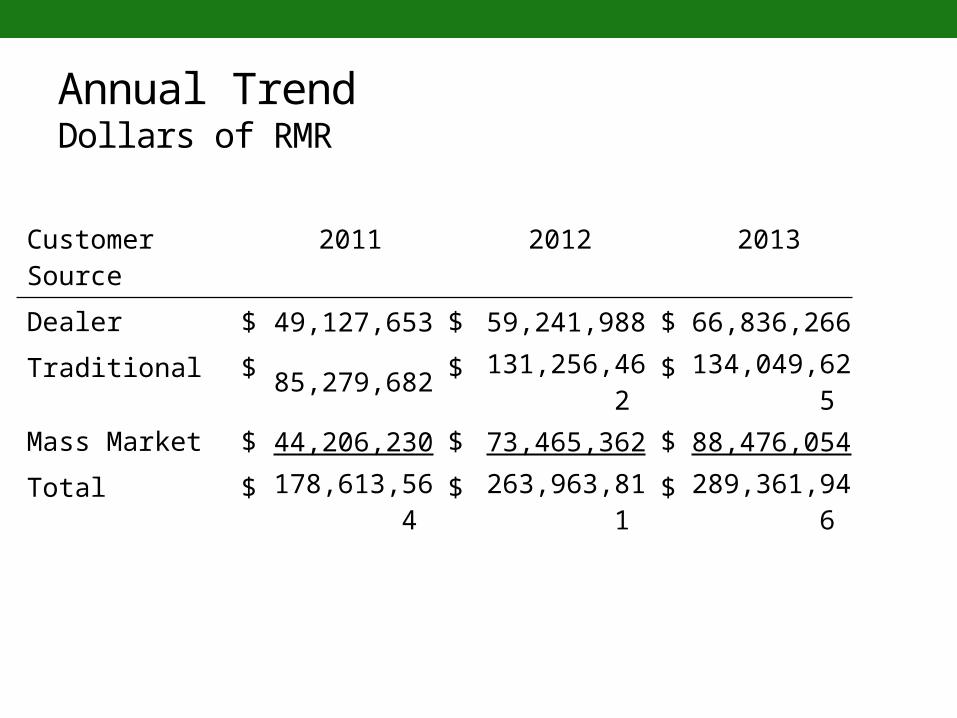
Annual TrendDollars of RMR
Customer Source 2011 2012 2013
Dealer $ 49,127,653 $ 59,241,988 $ 66,836,266
Traditional $ 85,279,682 $ 131,256,462 $ 134,049,625
Mass Market $ 44,206,230 $ 73,465,362 $ 88,476,054
Total $ 178,613,564
$ 263,963,811 $ 289,361,946
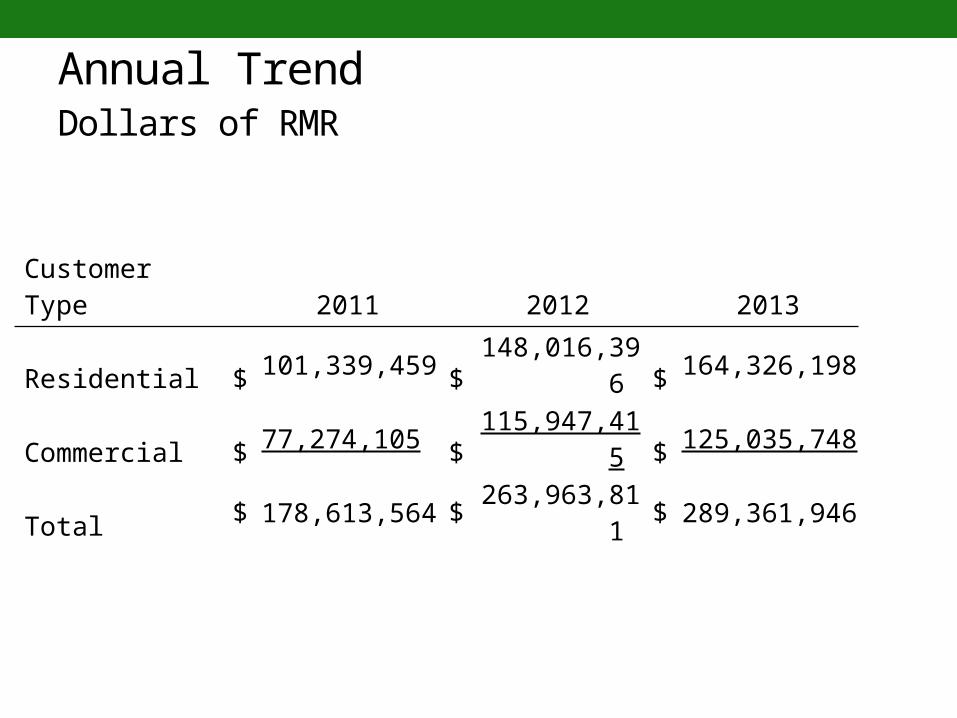
Annual TrendDollars of RMR
Customer Type 2011 2012 2013
Residential $ 101,339,459 $148,016,39
6 $ 164,326,198
Commercial $ 77,274,105 $115,947,41
5 $ 125,035,748
Total $ 178,613,564 $ 263,963,811
$ 289,361,946
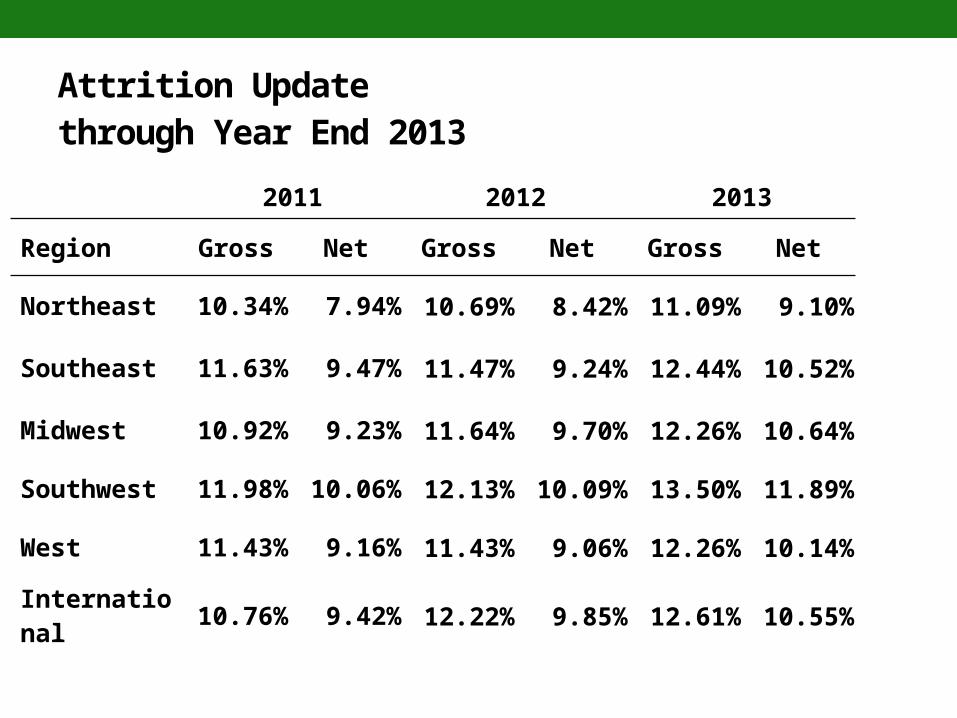
Attrition Updatethrough Year End 2013
2011 2012 2013
Region Gross Net Gross Net Gross Net
Northeast10.34
% 7.94% 10.69% 8.42% 11.09% 9.10%
Southeast11.63
% 9.47% 11.47% 9.24% 12.44% 10.52%
Midwest10.92
% 9.23% 11.64% 9.70% 12.26% 10.64%
Southwest11.98
% 10.06% 12.13% 10.09% 13.50% 11.89%
West11.43
% 9.16% 11.43% 9.06% 12.26% 10.14%
International
10.76% 9.42% 12.22% 9.85% 12.61% 10.55%
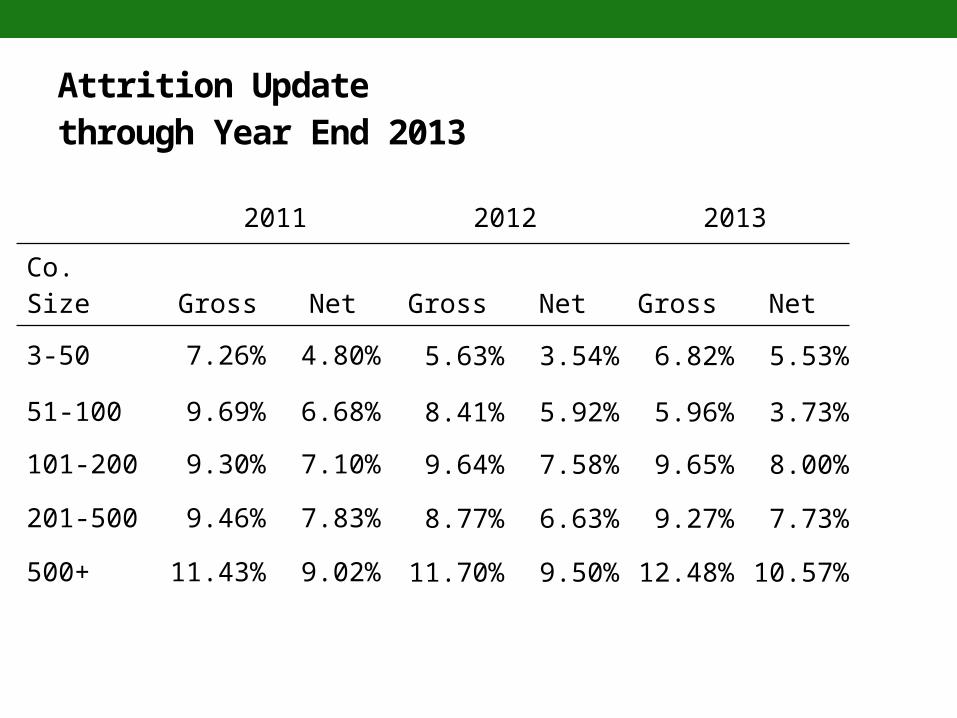
Attrition Updatethrough Year End 2013
2011 2012 2013
Co. Size Gross Net Gross Net Gross Net
3-50 7.26% 4.80% 5.63% 3.54% 6.82% 5.53%
51-100 9.69% 6.68% 8.41% 5.92% 5.96% 3.73%
101-200 9.30% 7.10% 9.64% 7.58% 9.65% 8.00%
201-500 9.46% 7.83% 8.77% 6.63% 9.27% 7.73%
500+11.43
% 9.02% 11.70% 9.50% 12.48% 10.57%
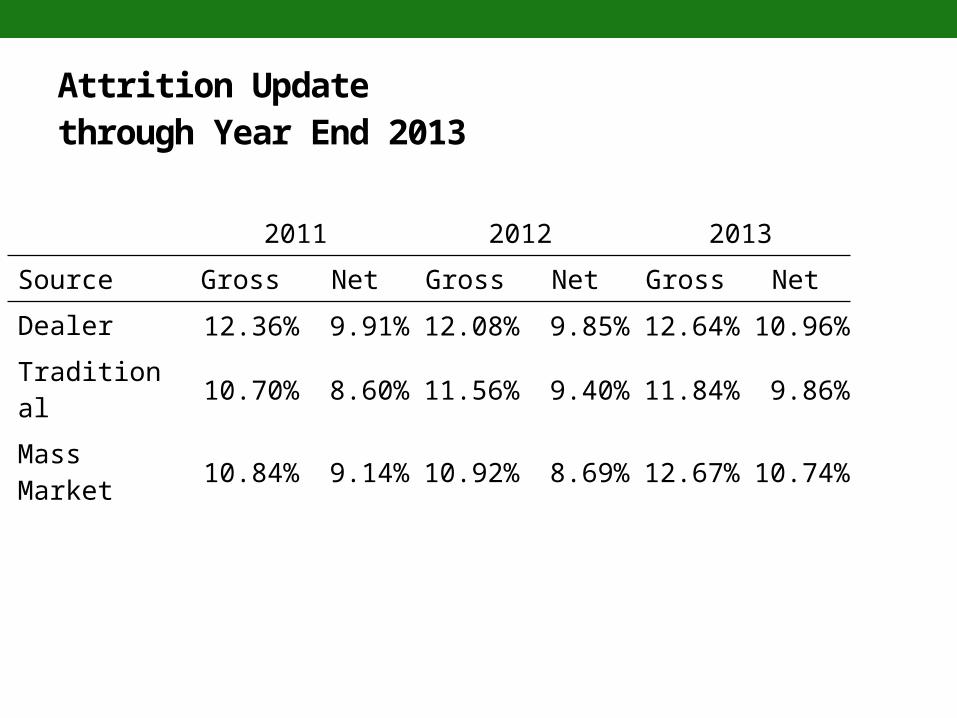
Attrition Updatethrough Year End 2013
2011 2012 2013
Source Gross Net Gross Net Gross Net
Dealer 12.36% 9.91% 12.08% 9.85% 12.64% 10.96%
Traditional 10.70% 8.60% 11.56% 9.40% 11.84% 9.86%
Mass Market 10.84% 9.14% 10.92% 8.69% 12.67% 10.74%
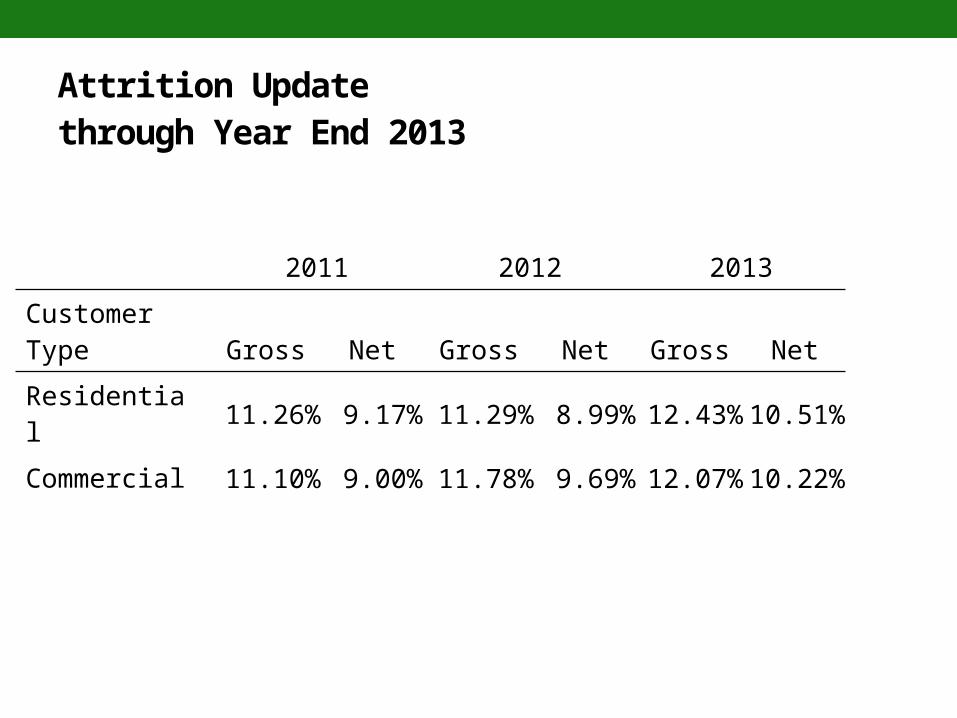
Attrition Updatethrough Year End 2013
2011 2012 2013
Customer Type Gross Net Gross Net Gross Net
Residential 11.26% 9.17% 11.29% 8.99% 12.43%10.51
%
Commercial 11.10% 9.00% 11.78% 9.69% 12.07%10.22
%
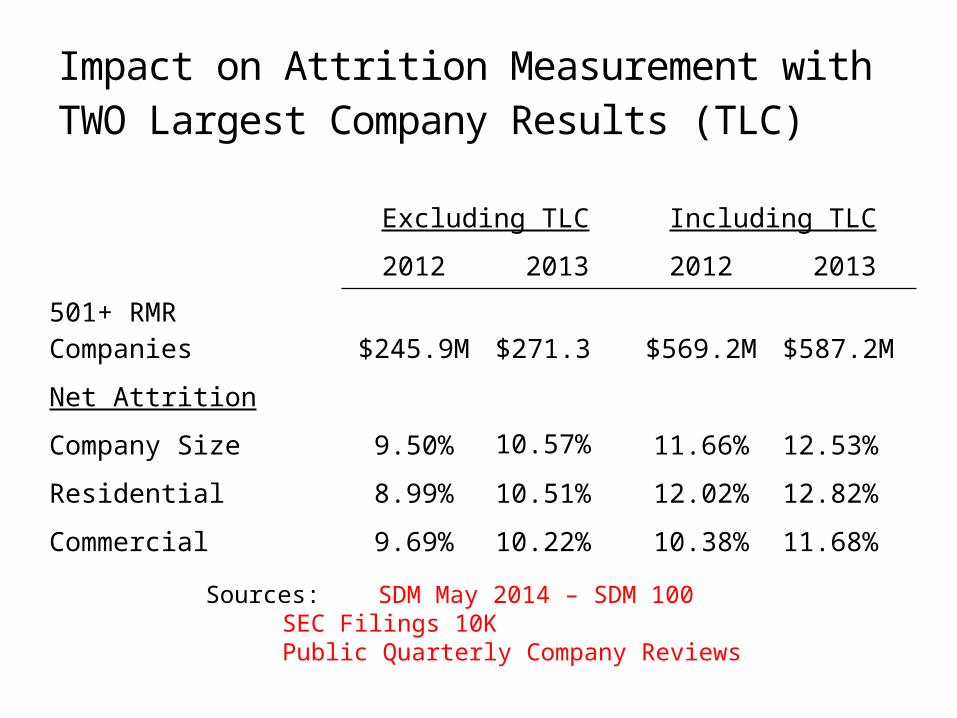
Impact on Attrition Measurement with TWO Largest Company Results (TLC)
Excluding TLC Including TLC
2012 2013 2012 2013
501+ RMR Companies $245.9M $271.3 $569.2M $587.2M
Net Attrition
Company Size 9.50% 10.57% 11.66% 12.53%
Residential 8.99% 10.51% 12.02% 12.82%
Commercial 9.69% 10.22% 10.38% 11.68%
Sources: SDM May 2014 – SDM 100 SEC Filings 10K Public Quarterly Company Reviews
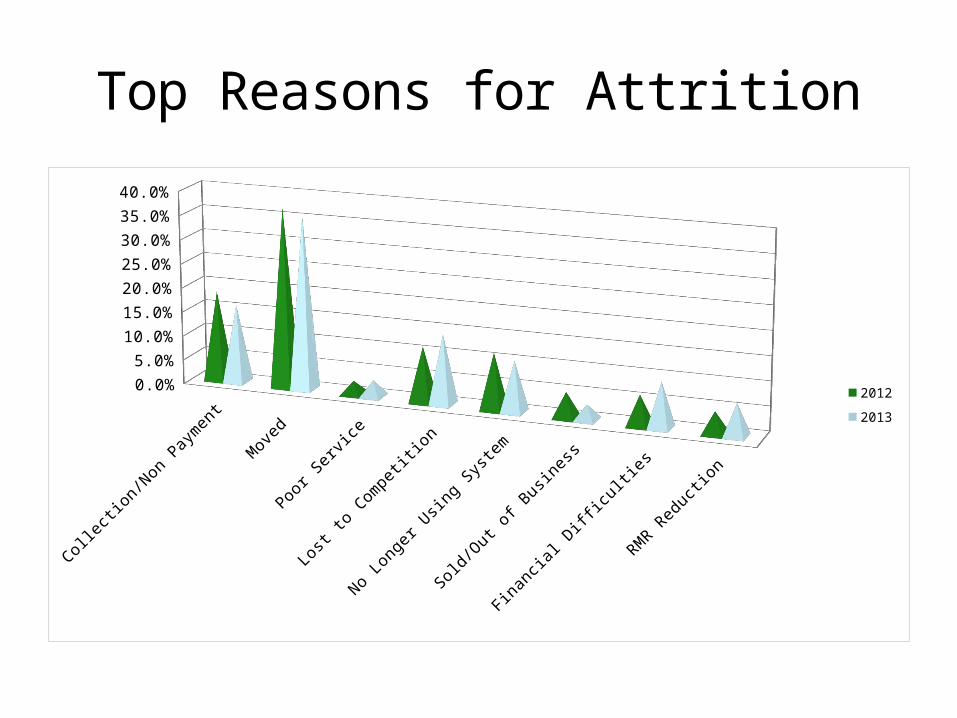
Top Reasons for Attrition
Colle
ction
/Non
Pay
men
t
Mov
ed
Poor S
ervic
e
Lost
to C
ompe
tition
No Lo
nger
Usin
g Sys
tem
Sold/
Out o
f Bus
ines
s
Finan
cial D
ifficu
lties
RMR R
educ
tion
0.0%
5.0%
10.0%
15.0%
20.0%
25.0%
30.0%
35.0%
40.0%
2012
2013
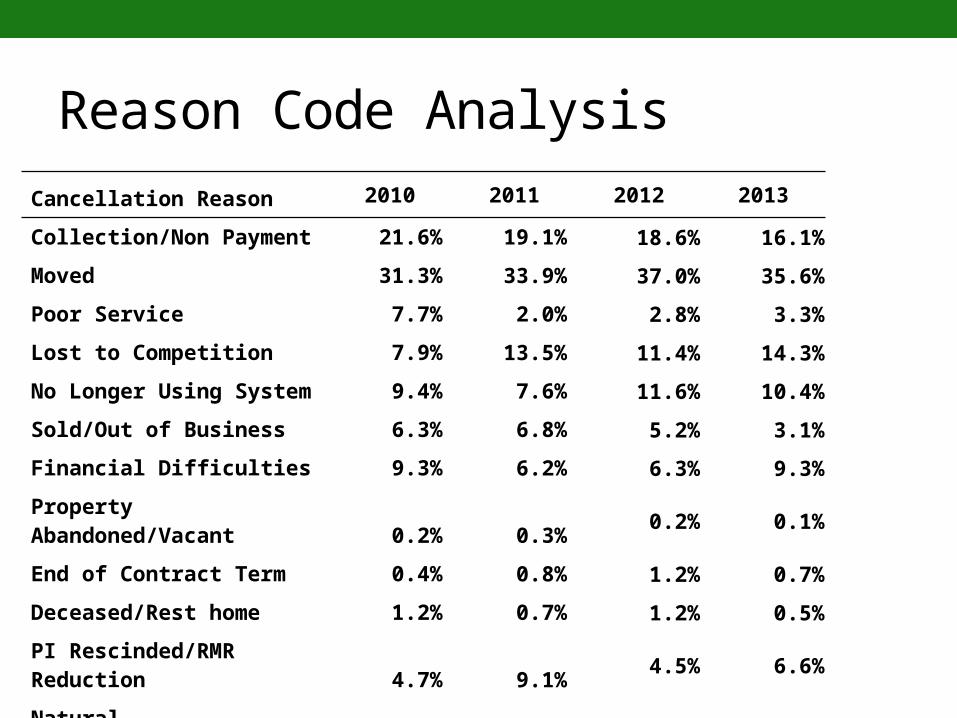
Reason Code Analysis
Cancellation Reason 2010 2011 2012 2013
Collection/Non Payment 21.6% 19.1% 18.6% 16.1%
Moved 31.3% 33.9% 37.0% 35.6%
Poor Service 7.7% 2.0% 2.8% 3.3%
Lost to Competition 7.9% 13.5% 11.4% 14.3%
No Longer Using System 9.4% 7.6% 11.6% 10.4%
Sold/Out of Business 6.3% 6.8% 5.2% 3.1%
Financial Difficulties 9.3% 6.2% 6.3% 9.3%
Property Abandoned/Vacant 0.2% 0.3% 0.2% 0.1%
End of Contract Term 0.4% 0.8% 1.2% 0.7%
Deceased/Rest home 1.2% 0.7% 1.2% 0.5%
PI Rescinded/RMR Reduction 4.7% 9.1% 4.5% 6.6%
Natural Disaster/Military 0.0% 0.0% 0.0% 0.0%

TRG Maintains Full Confidentiality of Participant’s Figures
• Summary results as presented will be available on CSAA Web-Site (www.csaaintl.org)TRG Web-Site (www.trgassociates.com)
• Next update for 2014 – May 2015Posted in June 2015