attrition rate analysis and impact on actuarial valuation
TRANSCRIPT
Attrition Rate Analysis and It’s Impact on Actuarial ValuationKartikey Kandoi, Actuary, K A PanditGanesh Sudrik, Actuarial Manager, K A Pandit
15th Seminar on Current Issues in Retirement Benefits
Hotel Sea Princess, Juhu, Mumbai 29th November, 2018
Agenda• Introduction• Data Collation, Storage and Analysis• Attrition rate based on service• Attrition rate based on Age• Industry wise Attrition rate analysis• Impact of Attrition rate on non‐vested benefits• Impact of Attrition rate on vested benefits• Conclusion
www.actuariesindia.org2
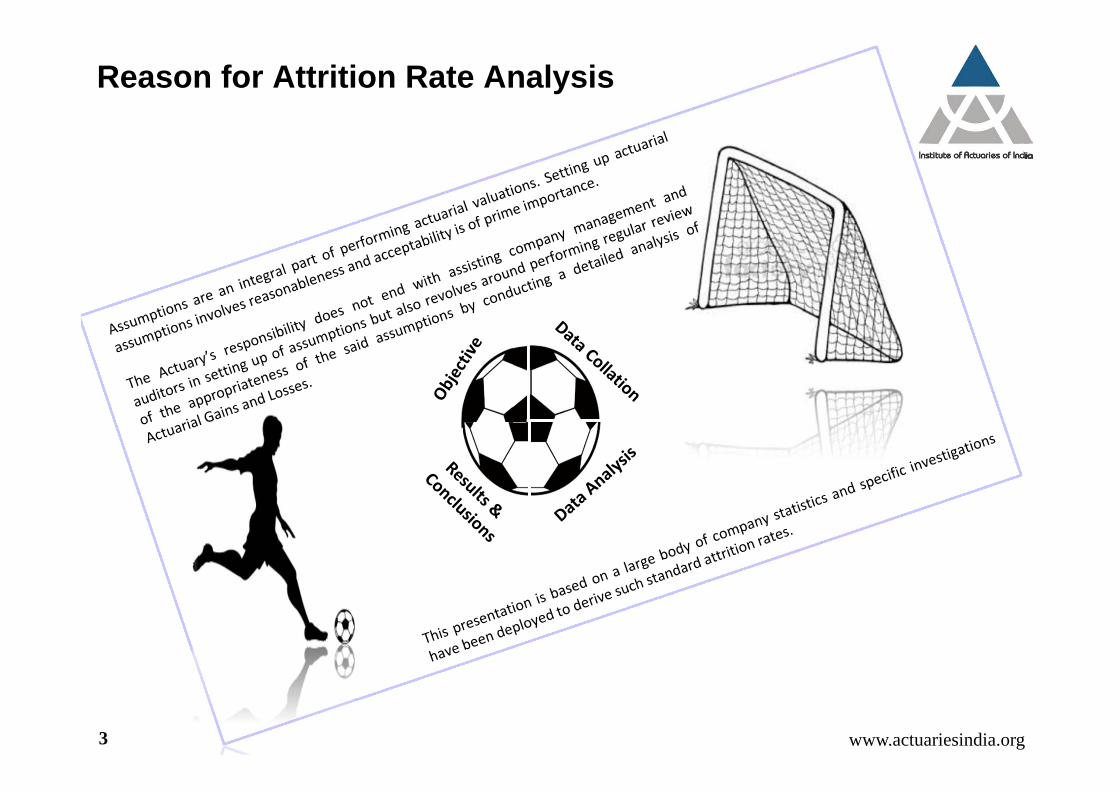
Reason for Attrition Rate Analysis
www.actuariesindia.org3
Data Collation
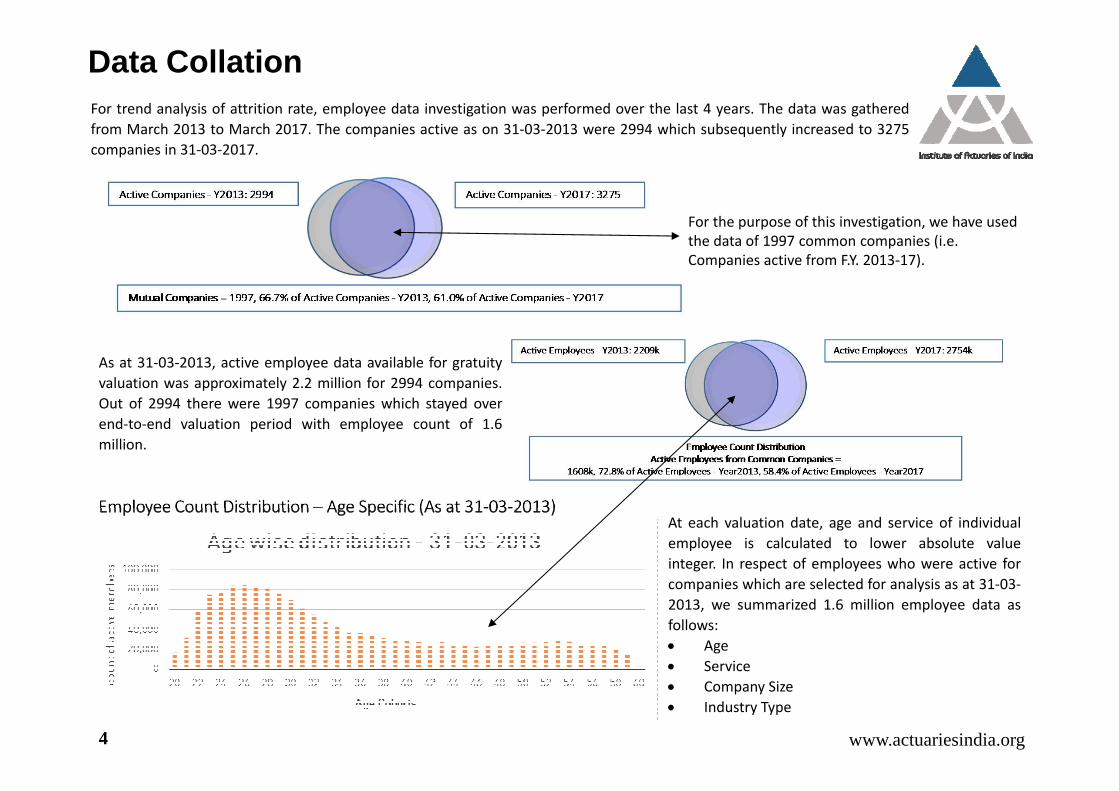
Employee Count Distribution – Age Specific (As at 31‐03‐2013)
For trend analysis of attrition rate, employee data investigation was performed over the last 4 years. The data was gatheredfrom March 2013 to March 2017. The companies active as on 31‐03‐2013 were 2994 which subsequently increased to 3275companies in 31‐03‐2017.
As at 31‐03‐2013, active employee data available for gratuityvaluation was approximately 2.2 million for 2994 companies.Out of 2994 there were 1997 companies which stayed overend‐to‐end valuation period with employee count of 1.6million.
At each valuation date, age and service of individualemployee is calculated to lower absolute valueinteger. In respect of employees who were active forcompanies which are selected for analysis as at 31‐03‐2013, we summarized 1.6 million employee data asfollows: Age Service Company Size Industry Type
For the purpose of this investigation, we have used the data of 1997 common companies (i.e. Companies active from F.Y. 2013‐17).
www.actuariesindia.org4
Attrition Rate – Age Specific
Attrition Rate – Service Specific
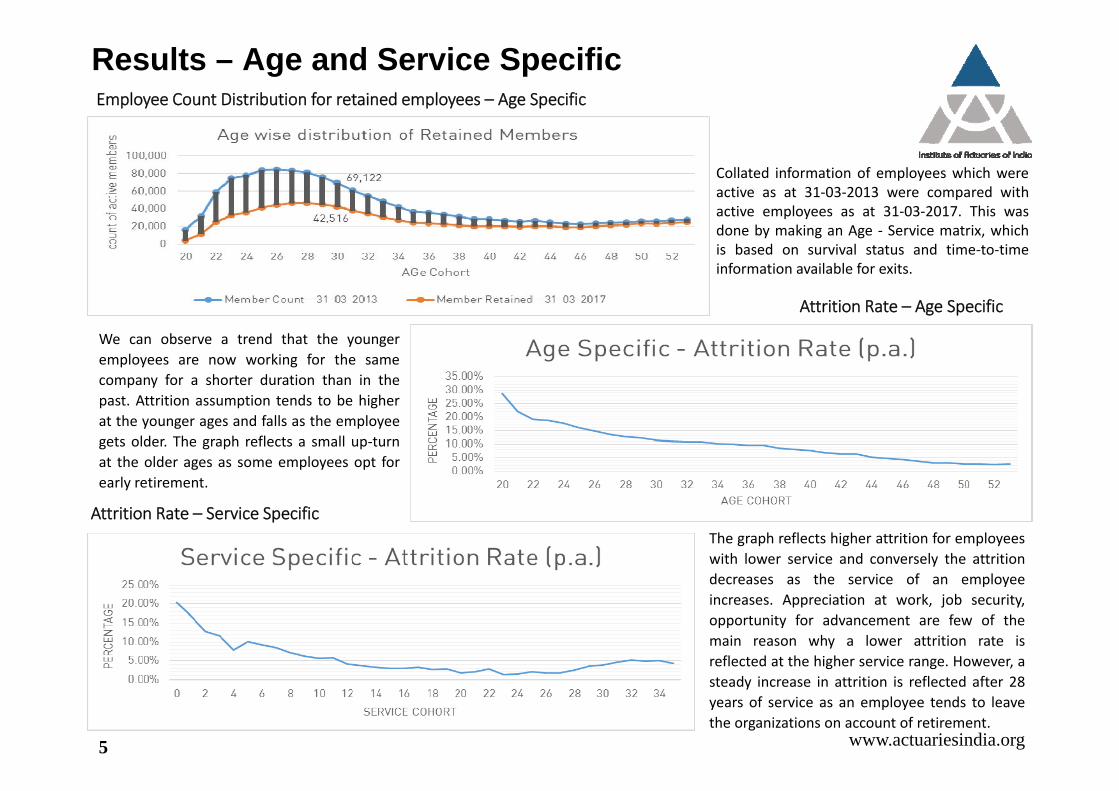
Results – Age and Service SpecificEmployee Count Distribution for retained employees – Age Specific
Collated information of employees which wereactive as at 31‐03‐2013 were compared withactive employees as at 31‐03‐2017. This wasdone by making an Age ‐ Service matrix, whichis based on survival status and time‐to‐timeinformation available for exits.
We can observe a trend that the youngeremployees are now working for the samecompany for a shorter duration than in thepast. Attrition assumption tends to be higherat the younger ages and falls as the employeegets older. The graph reflects a small up‐turnat the older ages as some employees opt forearly retirement.
The graph reflects higher attrition for employeeswith lower service and conversely the attritiondecreases as the service of an employeeincreases. Appreciation at work, job security,opportunity for advancement are few of themain reason why a lower attrition rate isreflected at the higher service range. However, asteady increase in attrition is reflected after 28years of service as an employee tends to leavethe organizations on account of retirement.
www.actuariesindia.org5
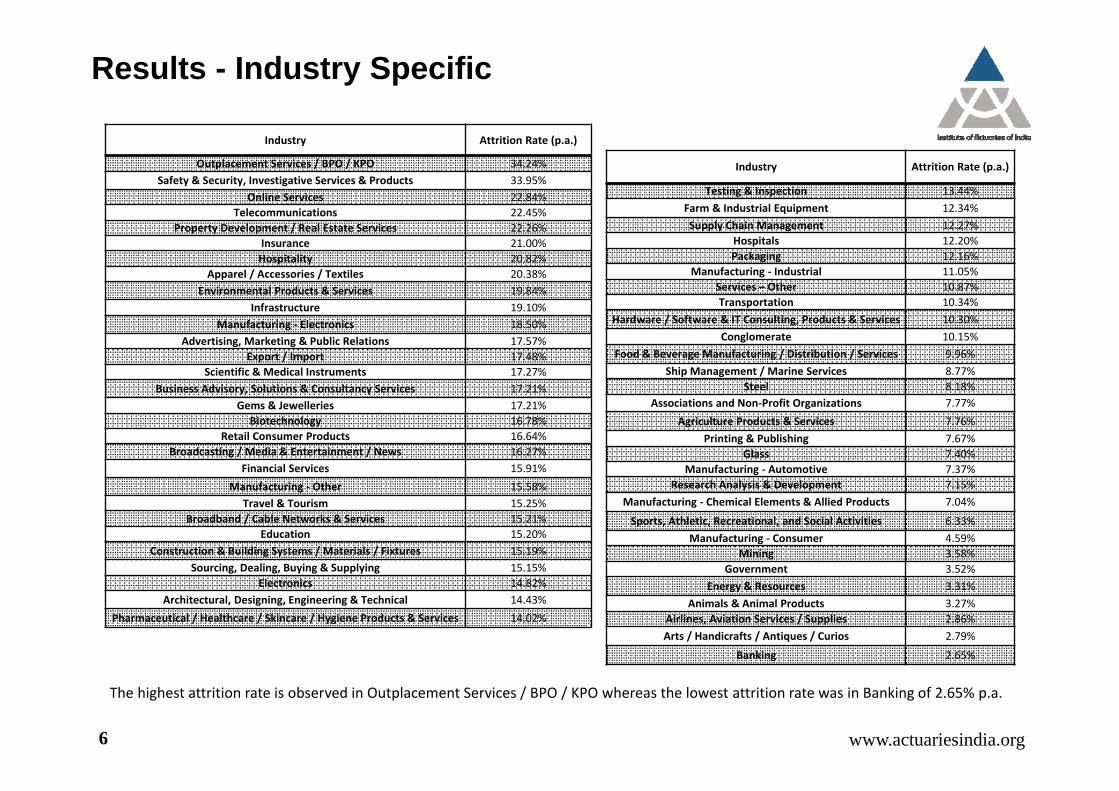
Results - Industry Specific
Industry Attrition Rate (p.a.)
Outplacement Services / BPO / KPO 34.24%Safety & Security, Investigative Services & Products 33.95%
Online Services 22.84%Telecommunications 22.45%
Property Development / Real Estate Services 22.26%Insurance 21.00%Hospitality 20.82%
Apparel / Accessories / Textiles 20.38%Environmental Products & Services 19.84%
Infrastructure 19.10%Manufacturing ‐ Electronics 18.50%
Advertising, Marketing & Public Relations 17.57%Export / Import 17.48%
Scientific & Medical Instruments 17.27%Business Advisory, Solutions & Consultancy Services 17.21%
Gems & Jewelleries 17.21%Biotechnology 16.78%
Retail Consumer Products 16.64%Broadcasting / Media & Entertainment / News 16.27%
Financial Services 15.91%Manufacturing ‐ Other 15.58%
Travel & Tourism 15.25%Broadband / Cable Networks & Services 15.21%
Education 15.20%Construction & Building Systems / Materials / Fixtures 15.19%
Sourcing, Dealing, Buying & Supplying 15.15%Electronics 14.82%
Architectural, Designing, Engineering & Technical 14.43%Pharmaceutical / Healthcare / Skincare / Hygiene Products & Services 14.02%
Industry Attrition Rate (p.a.)
Testing & Inspection 13.44%Farm & Industrial Equipment 12.34%Supply Chain Management 12.27%
Hospitals 12.20%Packaging 12.16%
Manufacturing ‐ Industrial 11.05%Services – Other 10.87%Transportation 10.34%
Hardware / Software & IT Consulting, Products & Services 10.30%Conglomerate 10.15%
Food & Beverage Manufacturing / Distribution / Services 9.96%Ship Management / Marine Services 8.77%
Steel 8.18%Associations and Non‐Profit Organizations 7.77%
Agriculture Products & Services 7.76%Printing & Publishing 7.67%
Glass 7.40%Manufacturing ‐ Automotive 7.37%
Research Analysis & Development 7.15%Manufacturing ‐ Chemical Elements & Allied Products 7.04%
Sports, Athletic, Recreational, and Social Activities 6.33%Manufacturing ‐ Consumer 4.59%
Mining 3.58%Government 3.52%
Energy & Resources 3.31%Animals & Animal Products 3.27%
Airlines, Aviation Services / Supplies 2.86%Arts / Handicrafts / Antiques / Curios 2.79%
Banking 2.65%
The highest attrition rate is observed in Outplacement Services / BPO / KPO whereas the lowest attrition rate was in Banking of 2.65% p.a.
www.actuariesindia.org6
www.actuariesindia.org
Range Attrition Rate (p.a.) Range Attrition Rate (p.a.)
Age Range 1 ‐ [20,30] 17.04% Service Range 1 ‐ [0,1] 20.04%
Age Range 2 ‐ [31,40] 10.38% Service Range 2 ‐ [2,4] 12.63%
Age Range 3 ‐ [41,50] 6.99% Service Range 3 ‐ [5,10] 8.94%
Age Range 4 ‐ [51, and above] 7.97% Service Range 4 ‐ [11,20] 4.22%
Service Range 5 ‐ [21, and above] 4.37%
Range Attrition Rate (p.a.) Range Attrition Rate (p.a.)
Age Range 1 ‐ [20,30] 19.00% Service Range 1 ‐ [0,1] 21.23%
Age Range 2 ‐ [31,40] 10.44% Service Range 2 ‐ [2,4] 13.92%
Age Range 3 ‐ [41,50] 5.88% Service Range 3 ‐ [5,10] 7.87%
Age Range 4 ‐ [51, and above] 5.33% Service Range 4 ‐ [11,20] 4.61%
Service Range 5 ‐ [21, and above] 3.29%
Range Attrition Rate (p.a.) Range Attrition Rate (p.a.)
Age Range 1 ‐ [20,30] 30.49% Service Range 1 ‐ [0,1] 33.65%
Age Range 2 ‐ [31,40] 18.01% Service Range 2 ‐ [2,4] 21.39%
Age Range 3 ‐ [41,50] 13.03% Service Range 3 ‐ [5,10] 11.55%
Age Range 4 ‐ [51, and above] 11.88% Service Range 4 ‐ [11,20] 6.51%
Service Range 5 ‐ [21, and above] 3.79%
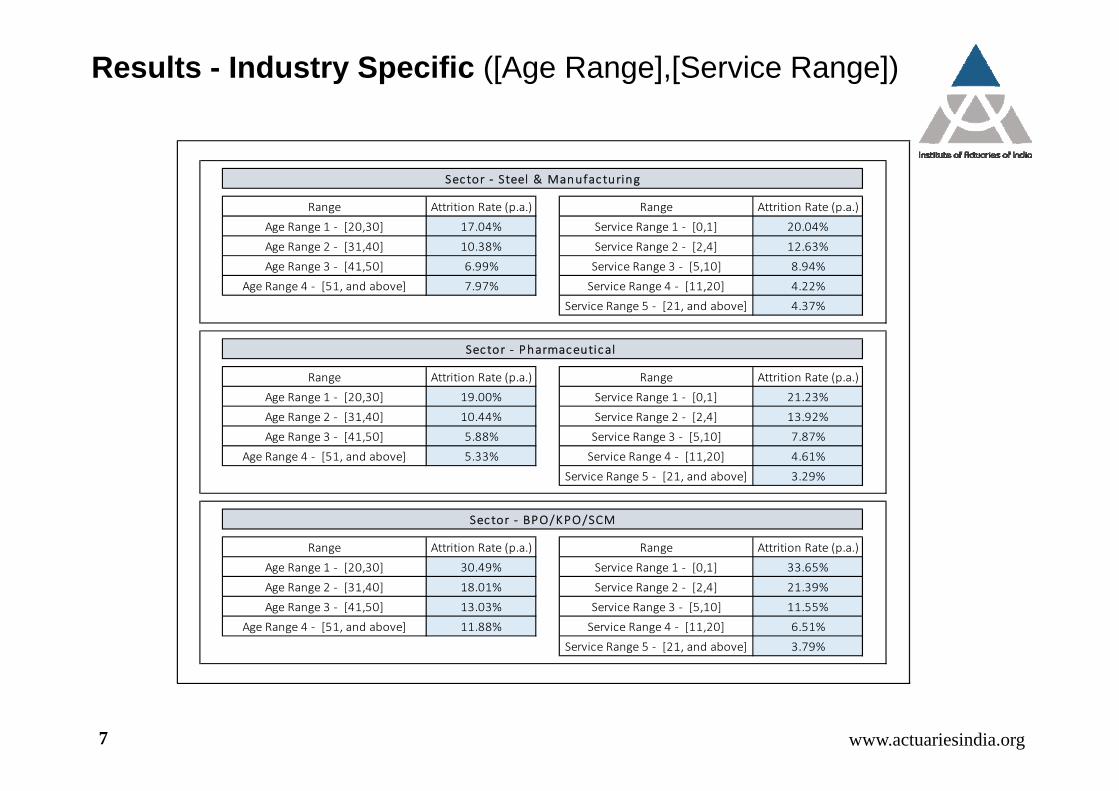
Sector ‐ Steel & Manufacturing
Sector ‐ Pharmaceutical
Sector ‐ BPO/KPO/SCM
Results - Industry Specific ([Age Range],[Service Range])
7
www.actuariesindia.org
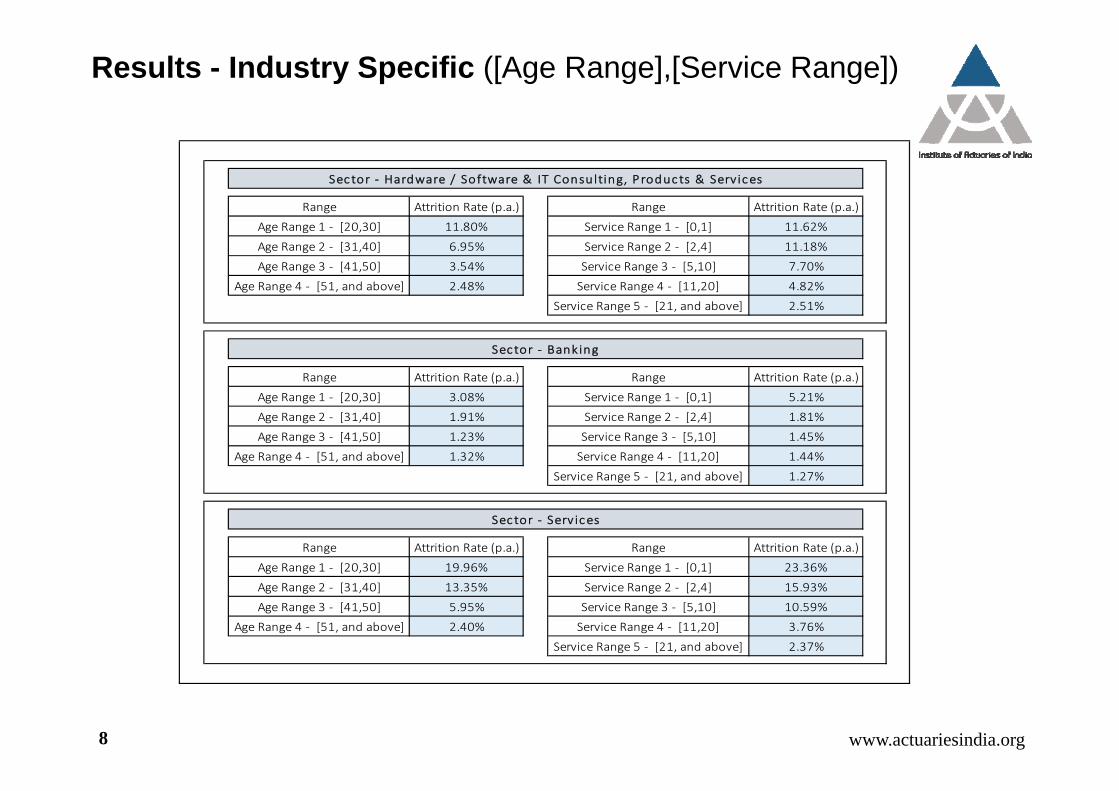
Results - Industry Specific ([Age Range],[Service Range])
Range Attrition Rate (p.a.) Range Attrition Rate (p.a.)
Age Range 1 ‐ [20,30] 11.80% Service Range 1 ‐ [0,1] 11.62%
Age Range 2 ‐ [31,40] 6.95% Service Range 2 ‐ [2,4] 11.18%
Age Range 3 ‐ [41,50] 3.54% Service Range 3 ‐ [5,10] 7.70%
Age Range 4 ‐ [51, and above] 2.48% Service Range 4 ‐ [11,20] 4.82%
Service Range 5 ‐ [21, and above] 2.51%
Range Attrition Rate (p.a.) Range Attrition Rate (p.a.)
Age Range 1 ‐ [20,30] 3.08% Service Range 1 ‐ [0,1] 5.21%
Age Range 2 ‐ [31,40] 1.91% Service Range 2 ‐ [2,4] 1.81%
Age Range 3 ‐ [41,50] 1.23% Service Range 3 ‐ [5,10] 1.45%
Age Range 4 ‐ [51, and above] 1.32% Service Range 4 ‐ [11,20] 1.44%
Service Range 5 ‐ [21, and above] 1.27%
Range Attrition Rate (p.a.) Range Attrition Rate (p.a.)
Age Range 1 ‐ [20,30] 19.96% Service Range 1 ‐ [0,1] 23.36%
Age Range 2 ‐ [31,40] 13.35% Service Range 2 ‐ [2,4] 15.93%
Age Range 3 ‐ [41,50] 5.95% Service Range 3 ‐ [5,10] 10.59%
Age Range 4 ‐ [51, and above] 2.40% Service Range 4 ‐ [11,20] 3.76%
Service Range 5 ‐ [21, and above] 2.37%
Sector ‐ Hardware / Software & IT Consulting, Products & Services
Sector ‐ Banking
Sector ‐ Serv ices
8
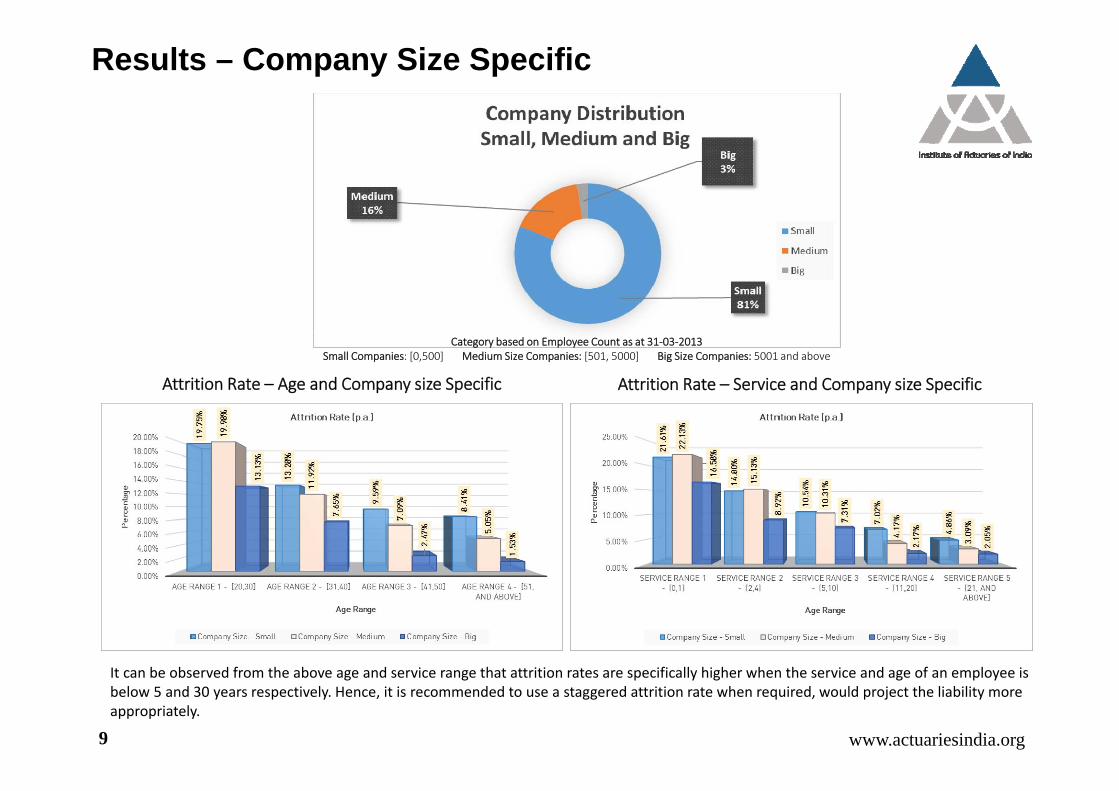
Category based on Employee Count as at 31‐03‐2013Small Companies: [0,500] Medium Size Companies: [501, 5000] Big Size Companies: 5001 and above
Attrition Rate – Age and Company size Specific Attrition Rate – Service and Company size Specific
It can be observed from the above age and service range that attrition rates are specifically higher when the service and age of an employee is below 5 and 30 years respectively. Hence, it is recommended to use a staggered attrition rate when required, would project the liability more appropriately.
Results – Company Size Specific
www.actuariesindia.org9
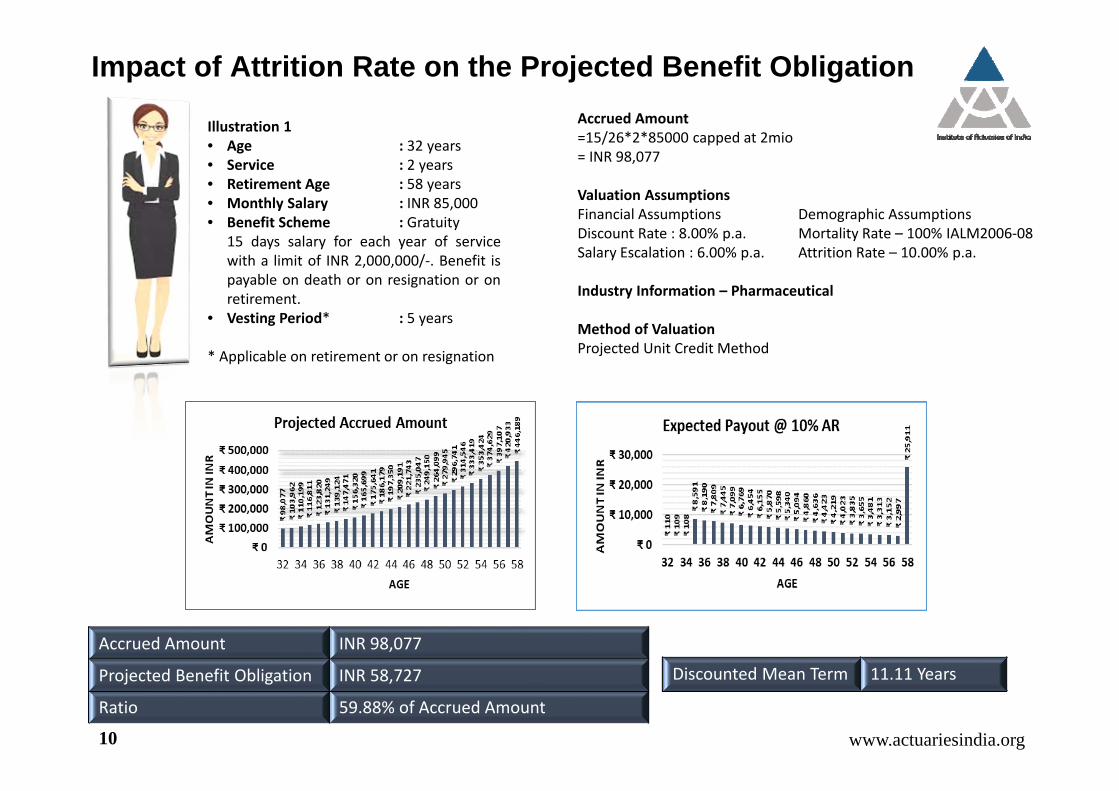
Impact of Attrition Rate on the Projected Benefit Obligation
Illustration 1• Age : 32 years• Service : 2 years• Retirement Age : 58 years• Monthly Salary : INR 85,000• Benefit Scheme : Gratuity
15 days salary for each year of servicewith a limit of INR 2,000,000/‐. Benefit ispayable on death or on resignation or onretirement.
• Vesting Period* : 5 years
* Applicable on retirement or on resignation
Accrued Amount=15/26*2*85000 capped at 2mio= INR 98,077
Valuation AssumptionsFinancial Assumptions Demographic AssumptionsDiscount Rate : 8.00% p.a. Mortality Rate – 100% IALM2006‐08Salary Escalation : 6.00% p.a. Attrition Rate – 10.00% p.a.
Industry Information – Pharmaceutical
Method of ValuationProjected Unit Credit Method
Ratio 59.88% of Accrued Amount
Accrued Amount INR 98,077
Projected Benefit Obligation INR 58,727 Discounted Mean Term 11.11 Years
www.actuariesindia.org10
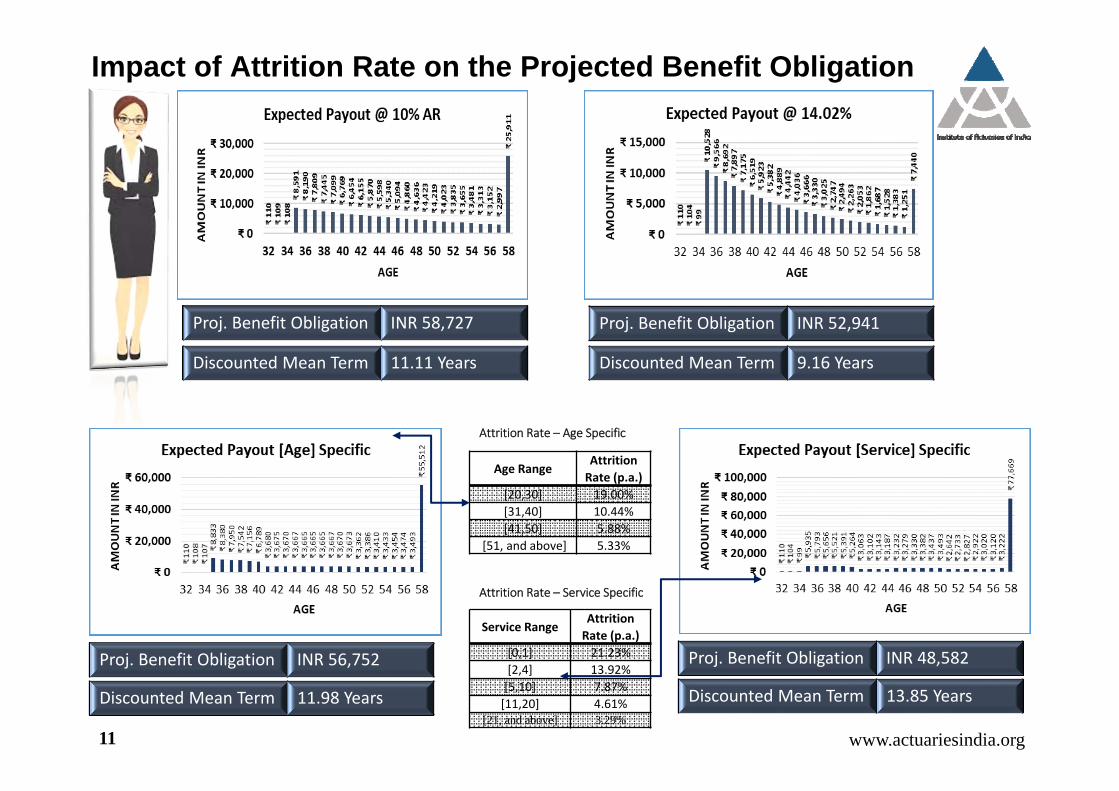
Impact of Attrition Rate on the Projected Benefit Obligation
Proj. Benefit Obligation INR 48,582
Discounted Mean Term 13.85 Years
Proj. Benefit Obligation INR 56,752
Discounted Mean Term 11.98 Years
Proj. Benefit Obligation INR 52,941
Discounted Mean Term 9.16 Years
Proj. Benefit Obligation INR 58,727
Discounted Mean Term 11.11 Years
www.actuariesindia.org
Age RangeAttrition Rate (p.a.)
[20,30] 19.00%[31,40] 10.44%[41,50] 5.88%
[51, and above] 5.33%
Service RangeAttrition Rate (p.a.)
[0,1] 21.23%[2,4] 13.92%[5,10] 7.87%[11,20] 4.61%
[21, and above] 3.29%
Attrition Rate – Age Specific
Attrition Rate – Service Specific
11

Impact of Attrition Rate on the Projected Benefit Obligation
Illustration 2• Age : 44 years• Service : 8 years• Retirement Age : 58 years• Monthly Salary : INR 125,000• Benefit Scheme : Gratuity
20 days salary for each year of service.Benefit is payable on death or onresignation or on retirement.
• Vesting Period* : 5 years
* Applicable on retirement or on resignation
Accrued Amount=20/26*8*125000= INR 769,231
Valuation AssumptionsFinancial Assumptions Demographic AssumptionsDiscount Rate : 8.00% p.a. Mortality Rate – 100% IALM2006‐08Salary Escalation : 6.00% p.a. Attrition Rate – 10.00% p.a.
Industry Information – Pharmaceutical
Method of ValuationProjected Unit Credit Method
Accrued Amount INR 769,231
Projected Benefit Obligation INR 680,889
Ratio 88.52% of Accrued Amount
Discounted Mean Term 7.29 Years
www.actuariesindia.org12
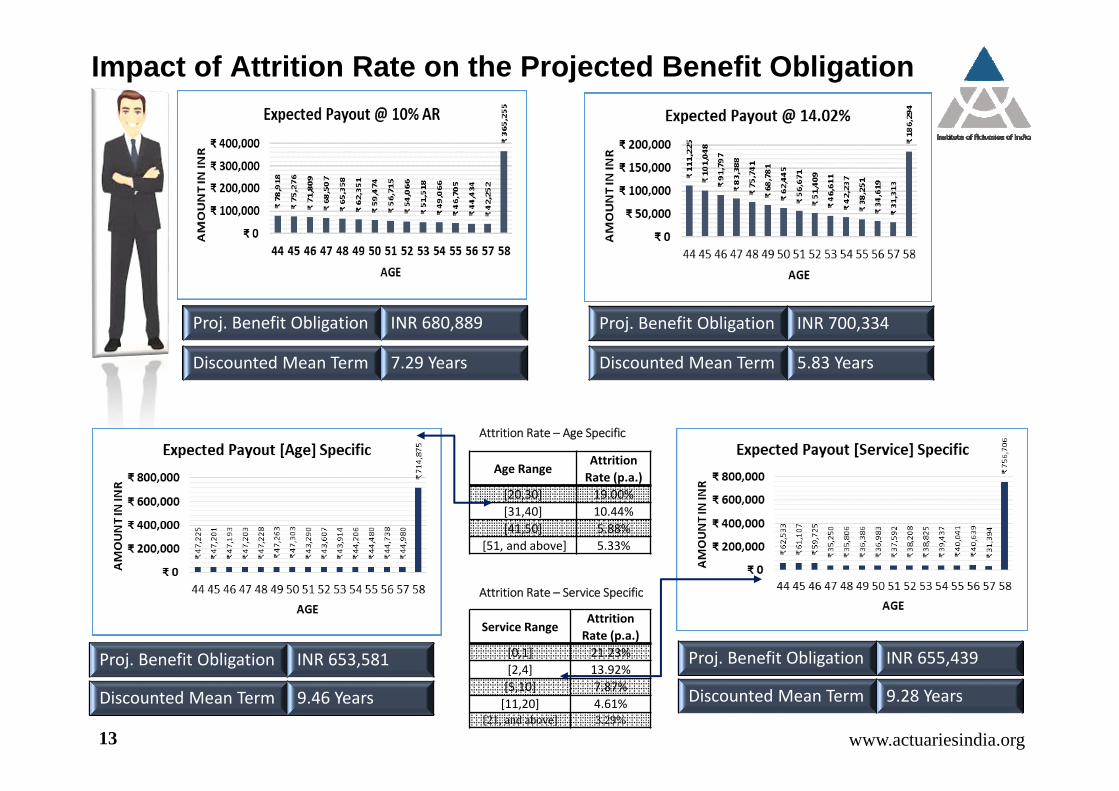
Impact of Attrition Rate on the Projected Benefit Obligation
Proj. Benefit Obligation INR 655,439
Discounted Mean Term 9.28 Years
Proj. Benefit Obligation INR 653,581
Discounted Mean Term 9.46 Years
Proj. Benefit Obligation INR 700,334
Discounted Mean Term 5.83 Years
Proj. Benefit Obligation INR 680,889
Discounted Mean Term 7.29 Years
www.actuariesindia.org
Age RangeAttrition Rate (p.a.)
[20,30] 19.00%[31,40] 10.44%[41,50] 5.88%
[51, and above] 5.33%
Service RangeAttrition Rate (p.a.)
[0,1] 21.23%[2,4] 13.92%[5,10] 7.87%[11,20] 4.61%
[21, and above] 3.29%
Attrition Rate – Age Specific
Attrition Rate – Service Specific
13
The selection of actuarial assumptions is one of the critical parameter for determining employee benefitliabilities as in turn it determines the company’s expense. Choice of appropriate assumptions will help inminimizing volatility in the expenses and liability.
Conclusion
Accounting standard on employee benefits prescribes management’s responsibility to set assumptions, but it is the onus ofthe auditor to express an opinion on annual accounts which should reflect a true and fair view. Therefore they also play amajor role in setting assumptions. We therefore recommend that a discussion between the Company (Finance and HRrepresentatives), the Actuary and the Auditor should occur at an early stage in the valuation process. This ensures allstakeholders are in agreement in this key area.
It should be remembered that since the assumptions are long term in nature (other than discount rate which is driven bymarket yields); we would not expect significant changes in the assumptions year on year. Change should only occur whereprevious assumptions are not reflecting experience or there has been a change in the management’s perception forcompany’s future plans.
In setting the assumption for attrition rate, one must take care that the past may not be always a guide to the future. Even ifthe past experience can be statistically analyzed to produce some meaningful rates, the future experience of withdrawalswill depend on general economic conditions as also the particular conditions affecting the given employer's business.Furthermore, withdrawal rates differ significantly from scheme to scheme and within a scheme from year to year.
www.actuariesindia.org14
?Thank you
www.actuariesindia.org
M/S. K.A.PANDIT
Consultants and Actuaries
www.ka‐pandit.com
kap@ka‐pandit.com
+91‐22‐429 22 250/231
Contact Person Mr. Kartikey Kandoi
kartikey@ka‐pandit.com +91‐22‐429 22 217
Mr. Ganesh Sudrikganesh@ka‐pandit.com +91‐22‐429 22 243
15