auckland council road charging options study: scheme...
TRANSCRIPT

Auckland Council
Auckland Council Road Charging Options Study: Scheme Design and Costing
Vehicle Detection and Identification Technology
1 October 2014
Part B.1. Vehicle Detection and Identification Technology, Draft 20/9/14
Table of Contents
1. Introduction 1
2. Technology overview 2
3. Preferred technologies 12
4. Roadside high level design 23
5. Maintenance and renewal assumptions 28
6. In-vehicle requirements 31
7. Conclusions 32
Annex A – Scope of Deliverable B.1 Technology 34
Annex B – Illustrative designs for the roadside technology 35
Annex C – Motorway charging scheme – main highway gantries 43
Annex D – Illustration of a Wider Cordon Scheme46
Annex E – Gantries vs Side-Mounted Poles and Cameras 49
Annex F – Entry or Exit Charging on Motorways 53

Part B.1. Vehicle Detection and Identification Technology
Glossary
Abbreviation Definition
ANPR Automatic Number Plate Recognition
CCD Charge Coupled Device
DSRC Dedicated Short Range Communications
GNSS Global Navigation Satellite System
GPS Global Positioning System
OCR Optical Character Recognition
RFID Radio Frequency Identification
V2I Vehicle to Infrastructure
V2V Vehicle to Vehicle

Part B.1. Vehicle Detection and Identification Technology 1
1. Introduction
1.1. Purpose of this document
This document sets out an analysis of technology options and their relative strengths and
weaknesses for the scheme options being considered for road charging in Auckland. Annex A
describes the terms of reference for this report.
1.2. Road charging scheme options
In summary the road charging options being considered for Auckland are:
• A motorway charging scheme
• A cordon-based scheme.
Further details of these schemes are set out at Annex B.
1.3. Structure of this document
Section 2 provides an overview of road charging technologies including emerging solutions.
Section 3 proposes preferred technologies identifying the items that are yet to be validated and also
subject to the charging policy of each scheme.
Section 4 provides an indicative roadside design – this is independent of specific supplier products
which may vary the dimensions and capability of the solutions.
Section 5 addresses the maintenance and renewal requirements in general. Individual supplier
products will have differing maintenance requirements and failure rates. At this stage no supplier
solution has been selected.
Section 6 addresses in-vehicle technology requirements.
Section 7 summarises our conclusions on technology.

Part B.1. Vehicle Detection and Identification Technology 2
2. Technology overview
2.1. City schemes/Cordon
Most city schemes (like Auckland) have many access points and rely on cameras to detect vehicle
movements. The most commonly used alternative technology for tolling purposes is tag and
beacon - or Dedicated Short Range Communications (DSRC) – but this has been used primarily to
automatically raise toll plaza barriers (for example, in Oslo, Trondheim). More recently however,
improvements in ANPR have meant that it has become the preferred technology for detecting
vehicles accessing city schemes with toll plaza barriers being removed to allow for “free flow”
conditions.
Developments in optical character recognition (OCR) technology, illumination, vehicle triggering and
tracking, spatial recognition, back office processing and filtering out misreads mean that read rates as
high as 98-99% using ANPR are now feasible. By comparison DSRC tag technology can theoretically
deliver read rates of up to 99.8%; however other human and vehicle related factors can reduce
accuracy, making the overall performance only marginally better than ANPR, when optimally
implemented. But there are also a wide range of factors that can reduce ANPR read rates to
substantially less than DSRC tags. Table 1 indicates elements that contribute to misreads for both
ANPR and DSRC technologies.
Table 1: Factors that affect ANPR and DSRC reads
Items that contribute to plate misreads/errors Items that contribute to tag misreads/errors
• Obscuration by high-sided vehicles
• Dirty and broken plates – particularly rear plates on trucks
• Lighting and sun blinding effects
• Camera mounting arrangements
• No visible front plates on motor-cycles
• Vehicle is on wrong side of road outside camera field of view
• Heavy rain or snow
• Tag has not been fitted correctly
• Tag battery has failed
• Metallised windscreens
• Tag fitted to incorrect vehicle
• Vehicle is on wrong side of the road outside detection area
Hence, for a city scheme, where there is also a need to support occasional users without a tag, and
cameras are still required to gather evidence on non-payers, ANPR can be a more cost effective
option even without considering other factors. The use of tag and beacon technologies is therefore
largely an additional cost that can only be justified if there is strong business case for improved
detection rates. Given the additional cost of issuing and managing tags; this is usually where multiple
detection events are needed to calculate the charge due (for example a distance-based scheme).

Part B.1. Vehicle Detection and Identification Technology 3
Table 2 summarises the technologies adopted by comparable schemes reflecting early use of tags
and increasing adoption of ANPR.
Table 2: Technology adopted by city charging schemes
City Scheme and technology When implemented
Singapore Paper Area Licence 1975
Bergen Cordon: Autopass Tag with toll plaza 1986 manual tolling; electronic from 2004
Oslo Cordon: Autopass Tag with toll plaza From 1991
Trondheim Cordon then area: Manual payment (toll plaza) or Autopass tag
1991 cordon, then area from 1998
Singapore ERP Area: DSRC tag/on-board device 1998
London Area: ANPR detection Feb 2003
Durham Area: Barrier based payment initially, then ANPR based detection
2002
Stockholm Cordon: ANPR with tags from 2006, then just ANPR from 2007
Trial from 2006. Full operation: 2007. To be extended in 2016.
Milan Area: ANPR detection Jan 2012 following the earlier Ecopass environmental zone, 2008 onwards
Gotenborg Cordon: ANPR with a shared back office with Stockholm to minimise costs and delivery risk
Jan 2013
Note the increased use of ANPR-based detection in cities as this technology has improved.
2.2. Motorway schemes
Motorway/expressway tolling schemes are typically quite different and may involve a series of
charges being applied by section. They typically use a mix of technologies including ANPR, DSRC
tags and GPS systems. The majority of GPS-based systems implemented to date are for heavy
goods vehicle charging.
Table 3: Examples of motorway charging/tolling scheme technology
Scheme Technology When implemented
Liber-t: French Autoroutes Tags and manual payments with barriers 1980s
Italian motorways Tag and beacon with barriers 1990
Dartford Crossing, UK Manual payment (toll plaza) or Dart tag until Nov 2014 – when it will move to ANPR-based detection
1991
Toronto ETR 407, Canada Cameras and tag and beacon – open road with gantries 1997
ERP, Singapore Electronic OBUs – open road with gantries 1998
Melbourne City Link, Australia Went live with tag and beacon DSRC with video tolling payments for occasional users – open road with gantries
2000
M6 Toll, UK Barrier-based with manual payments and tags 2003
Salik, Dubai Tag and beacon with RFID OBUs (ISO 18000 6B) and gantries
2007
Dublin M50, Ireland Tag or video payment account or occasional user video payment with gantries
2008
Part B.1. Vehicle Detection and Identification Technology 4
Scheme Technology When implemented
Golden Ears/Port Mann Bridges, Canada/US
Tag and beacon with RFID OBUs (ISO 18000 6B) and more recently 6C tags + video tolls on gantries
2009 Golden Ears
2012 Port Mann
Northern Gateway, NZ ANPR-based detection mounted on gantries 2009
Gauteng Freeway Improvement Project South Africa
Tag and beacon with camera enforcement on gantries 2012
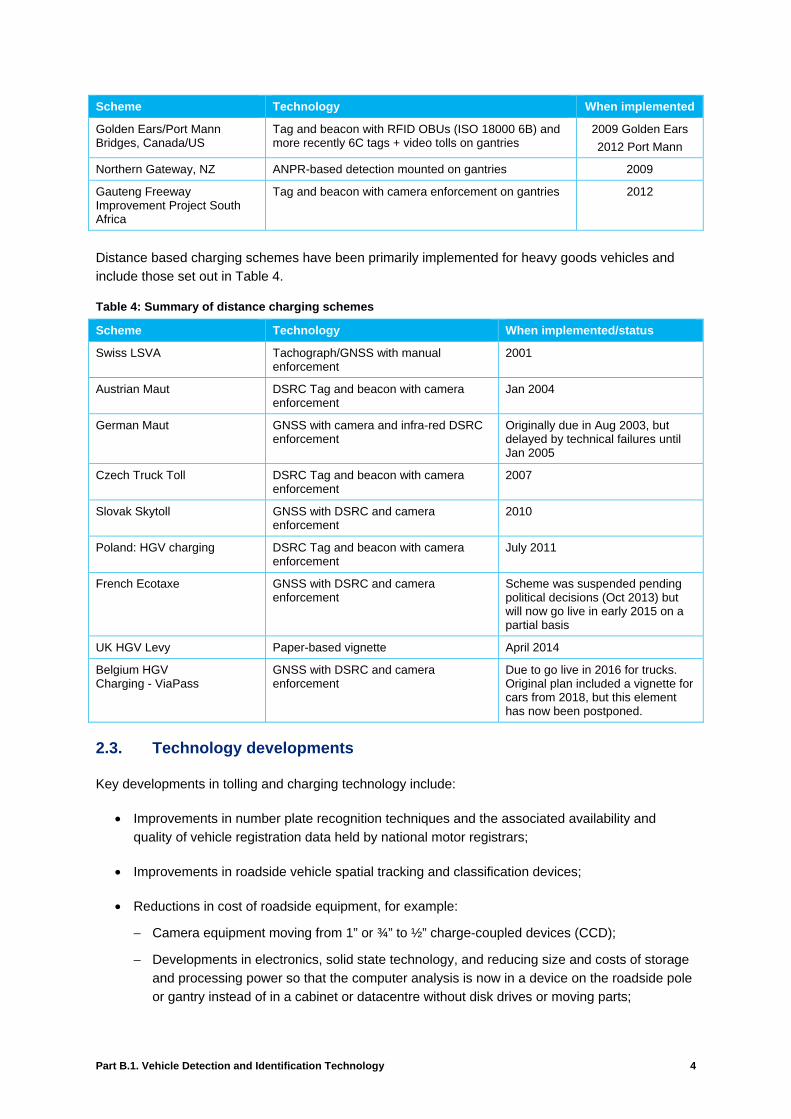
Distance based charging schemes have been primarily implemented for heavy goods vehicles and
include those set out in Table 4.
Table 4: Summary of distance charging schemes
Scheme Technology When implemented/status
Swiss LSVA Tachograph/GNSS with manual enforcement
2001
Austrian Maut DSRC Tag and beacon with camera enforcement
Jan 2004
German Maut GNSS with camera and infra-red DSRC enforcement
Originally due in Aug 2003, but delayed by technical failures until Jan 2005
Czech Truck Toll DSRC Tag and beacon with camera enforcement
2007
Slovak Skytoll GNSS with DSRC and camera enforcement
2010
Poland: HGV charging DSRC Tag and beacon with camera enforcement
July 2011
French Ecotaxe GNSS with DSRC and camera enforcement
Scheme was suspended pending political decisions (Oct 2013) but will now go live in early 2015 on a partial basis
UK HGV Levy Paper-based vignette April 2014
Belgium HGV Charging - ViaPass
GNSS with DSRC and camera enforcement
Due to go live in 2016 for trucks. Original plan included a vignette for cars from 2018, but this element has now been postponed.
2.3. Technology developments
Key developments in tolling and charging technology include:
• Improvements in number plate recognition techniques and the associated availability and
quality of vehicle registration data held by national motor registrars;
• Improvements in roadside vehicle spatial tracking and classification devices;
• Reductions in cost of roadside equipment, for example:
− Camera equipment moving from 1” or ¾” to ½” charge-coupled devices (CCD);
− Developments in electronics, solid state technology, and reducing size and costs of storage
and processing power so that the computer analysis is now in a device on the roadside pole
or gantry instead of in a cabinet or datacentre without disk drives or moving parts;

Part B.1. Vehicle Detection and Identification Technology 5
− Integration between licence plate readers and cameras to create a single unit; and
− Improvements in DSRC tag reader technology,
• Reduction in unit costs of DSRC electronic tags through mass production to bring costs down
towards $15-$20;
• Developments in RFID technology – widely used in the US - to bring RFID tags towards a cost
of $1-$2;
• Improvements in GPS-based devices (e.g. shorter time to first fix, use of confidence data to
rule out rogue fixes) and reductions in unit costs towards $100 and increasing numbers of
satellites overhead to enable positioning fixes.
The primary emerging technology is the vehicle to vehicle (V2V) and vehicle to infrastructure (V2I)
standards which have adopted the 5.9 Hz WAVE standard for communications between vehicles and
with the roadside. Tolling or charging is just one “app” amongst a wide range which V2V and V2I are
expected to support in the next 15-20 years, summarised in Table 5 below.
Table 5: Summary of applications which V2V and V2I are planned to support
Safety
• E-call to a tunnel control room or 111 service
• Warnings on entering or leaving tunnels and at highway intersections
• Obstacle discovery and alerting
• Warning of sudden traffic braking and stopping
• Reporting incidents and accidents
• Lane change warnings
• Highway edge/ tunnel wall impact avoidance
Traffic Management
• Variable speed limits and intelligent speed adaptation
• Adaptive signal control/priority
• Automated intersection control
• Priority for ambulances, fire and police cars
V2V
• Collision avoidance (front to rear and front to front)
• Spatial monitoring of the vehicle relative to other vehicles: trajectory, relative distances, speed of surrounding vehicles.
• Recording accident details (black box)
Driver Assistance
• Guidance to parking locations and destinations
• Parking a vehicle
• Cruise control
• Support to keeping in lane
• Electronic road sign recognition/repeating
Control and Enforcement
• Traffic surveillance
• Speed limit warnings
• Access control and restricting entry
• Checking vehicle/driver credentials/load details
• Commands to pull over
Payments
• Toll collection
• Parking payments
• Freight/loading control
• Usage based insurance
Information
• Maps and navigation
• Fuel stations/electric charging points
• Business locations
• Car related services
In practice, V2V and V2I standards are some way from being implemented in vehicles available today
and there is likely to also be a substantial legacy vehicle fleet on the road even when these solutions
are fitted as standard to new vehicles.

Part B.1. Vehicle Detection and Identification Technology 6
This technology was recently demonstrated at a technology trade show (Computex, Taipei, June
2014) but vehicle manufacturers have not yet committed to a timeline for when this capability will
become part of a standard vehicle fit. Most commentators regard this technology as being over 10
years away.
The one element that may be relevant in the short term is the 5.9 GHz WAVE standard which some
tag and beacon suppliers have adopted to increase the communications range between the tag
reader/beacon and tag/OBU from the ~10 metres allowed by the CEN 5.8 GHz standard, towards 70
metres or more.
2.4. Manual or paper-based schemes
Some cities have used or considered paper or manual based schemes where a paper ticket or
vignette is issued to demonstrate a driver has paid a charge; this can then be inspected by an
enforcement officer. Singapore operated an Area Licence Scheme in this manner between 1975 and
1998. A paper scheme was also explored as an option for London by the ROCOL 1 study. In general
they have only been applied to area schemes or where a blanket charge applies to use roads on a
particular date or period of time, like the vignettes operated for heavy vehicles in Europe.
Our research indicates that the substantial majority of such schemes have become automated in the
past 15-20 years using technology. The primary reasons have been to reduce operating costs,
improve data capture and allow users to have simple-to-operate accounts instead of paying for a
manual ticket each day or period. The only paper based system still operating is in Switzerland where
vignettes are compulsory on all national class 1 and 2 roads. There is only the 1-year vignette valid
from 1 December of the preceding year until 31 January of the following year, i.e. 14 months. The
vignette price does not include driving through the Grand St. Bernhard Tunnel and Munt la Schera
tunnel where a special toll must be paid. The Swiss vignette price is €33 so it can be regarded as
form of levy. It is enforced by the police.
Paper based approaches don’t assist in vehicle detection for either a motorway scheme or a cordon
crossing, although a receipt can be issued where the user “declares” that they have used the
motorway or crossed a cordon. We don’t consider a manual or paper-based solution to be
economically feasible and do not consider it further.
2.5. Suitability of GPS
GPS devices are now widely used for satnav and telematics in vehicles, and in theory these same
devices could be used for road charging. Although GPS is quite a mature solution for navigation and
distance measurement it has a high unit cost in comparison to other OBU options. Also, it is only
accurate insofar as visible satellites, on-board signal processing mapping and back office corrections
permit. These factors generate a range of complexity, cost, installation and approval issues. For
example:
a) To position a vehicle the GPS unit needs to have unobstructed view of a minimum of 4 GPS
satellites in the sky (effectively 3 to provide position in 3 dimensions and a 4th to resolve
timing). On the open road and motorways this is not a significant problem. Hence, many of
the motorway-based charging schemes in Europe and the Heavy Vehicle RUC tax in New
Zealand rely on GPS devices. In urban environments buildings can block the view of the sky
making positioning less accurate. Most satnav devices compensate by having an on-board
1 The Review of Charging Options for London (ROCOL) working group, Government Office for London, March 2000

Part B.1. Vehicle Detection and Identification Technology 7
road map – but this increases complexity and storage requirements and requires the map to
be kept up to date through data downloads.
b) There are signal processing standards for GPS (NMEA data) which allow the quality of a
position reading to be assessed, so that incorrect or low quality data can be discarded.
However, not all chipsets and implementations of available chips make this data available to
the on-board processor – largely because for mass produced basic satnav or telematics uses
such data is not important.
c) To compensate many GPS tracking devices also incorporate a motion-sensor (or
accelerometer) which detects continuing movement and speed and can be used to “fill in the
gaps” where GPS position data is not available and corroborate GPS data. This again
increases the cost and complexity of the device.
d) When initially powering up, a GPS device has a time lag to initially capture its position; this
“time to first fix” can mean the start of a journey may be missed.
e) Where a vehicle is parked underground or for long periods the on-board device needs to store
its last position to accurately determine a starting point – most satnav products don’t do this,
but rely on satellite visibility at the start of the journey.
f) There needs to be a means of gathering journey data off the GPS device to send to the back
office – this is typically done with a mobile communications module running GPRS, 3G or
similar, with a SIM card. This further increases the operating cost and complexity of the
device.
g) The device needs an electricity source as GPS and mobile communications are power hungry
– as a result battery technology (in comparison a DSRC tag battery can last 7-8 years) is not
suitable. The device needs to be installed/plugged in to a power source in the vehicle; using
the “lighter” socket is not sufficiently reliable to ensure the device is always on.
h) For the device to be regarded as “evidentially robust” to support enforcement it would need to
be “type approved or gazetted”. In practice many of the issues of the validity of the position
evidence can be resolved through a customer contractual agreement that they will rely on the
device for measurement. However, if GPS position data was challenged in a court of law
general consensus is that it does not have the same evidential robustness as, say, a
photograph of a vehicle. It may also be impractical for an enforcement authority to inspect a
GPS device for its correct installation and operation (requires powers to enter the vehicle;
also data captured and status may be transitory, though this can be compensated for by
adding logging and security at additional cost). Hence the vast majority of GPS-based
charging schemes rely on image evidence for enforcement, for example, the German Maut
Heavy Vehicle Charging Scheme (live in 2005) and the planned Belgian Viapass scheme
(due to go live in 2016).

Part B.1. Vehicle Detection and Identification Technology 8
i) Tests of GPS based devices have demonstrated that where fine judgements of position are
required data quality is not sufficient:
• A vehicle driving just a few metres outside a cordon boundary may sometimes be
erroneously positioned inside and therefore deemed to have crossed the cordon
(see TfL’s technology trials from 2003-20082);
• A parked vehicle close to a cordon boundary may be detected as being located a
few metres away as the GPS signal wavers. A cordon may need a “buffer zone”.
j) Repeatability of a charge has also been challenging as the same journey repeated multiple
times may be measured as having slightly different distances depending on the GPS data
quality at the time. For this reason most GPS charging schemes divide the road network up
into a set of “zones” each of which has a charge unit. For example, the minimum zone size
used for the German heavy vehicle scheme (the Maut) was a 90m section of motorway
carriageway (or ramp), as there was a risk that smaller units might not be reliably detected by
the GPS on-board unit as the truck travelled on it. This enables a back office to apply a
charge for each zone without the actual distance travelled needing to be measured.
The existing Heavy Vehicle RUC scheme in New Zealand relies on a set of certified devices, which
don’t suffer from some the accuracy issues listed above. They have been tested to deliver sufficient
accuracy for tax collection to measure vehicle miles travelled on public and private roads. These
devices have a high unit cost and are typically used for a range of services including fleet vehicle
management, dispatch and tracking. There is an ongoing charge for the communications. A number
of service providers collect vehicle movement data, agreeing to keep that data private and administer
the collection of the tax.
To precisely locate a vehicle on a particular road, they use their own map data; at present we
understand there is no single reference map of GIS data that could be used as common platform for a
charging scheme across multiple types of GPS device. If the road charging option being considered
for Auckland was limited to a Heavy Vehicle scheme, the current RUC system may be a suitable
option for gathering charging data. However, for mass market vehicle charging, we don’t believe it is a
viable solution because:
• The GPS unit complexity leads to a relatively high unit cost, though costs continue to fall. A
GPS device with fitting and communications may have a minimum capital cost of the order of
$100 with a $5-$6/month operating cost (substantially higher than the 7-year life of a DSRC tag
at ~$25).
• The devices are not fitted on all vehicles as part of standard build and are not inspected on an
annual basis.
• The position data is not evidentially robust for a cordon scheme.
• ANPR cameras are still required for enforcement.
For a national distance-based charging scheme GPS solutions may be cost-effective; however there
are unlikely to be sufficient economies of scale for a local motorway scheme in Auckland.
2 J. Evans, N. Patchett, N. Williams, and A. Kowalski. Assessing the use of GPS for congestion charging in London. Traffic engineering & control, 46 (3):pp. 98.

Part B.1. Vehicle Detection and Identification Technology 9
Some of these factors can be overcome if the same device is also used for other applications (usage
based insurance, e-call, vehicle telematics) and there is an agreement with the customer that they will
be charged on the basis of what the on-board device measures (even if the data gathered may be
slightly incorrect). For comparison, most vehicle odometers are only calibrated to be +/- 4% accurate.
GPS is likely to mature when these the devices are fitted as standard to all vehicles and when costs
reduce.
2.6. Suitability of RFID tags
Like DSRC, RFID technology provides a tag-based solution for identifying vehicles where the tag is
fitted correctly. The main advantages of RFID technology are:
• The tag can be produced much more cheaply than for DSRC – a raw unit cost of $12 for a
DSRC tag might compare with a $1-$2 RFID tag cost making the device almost disposable and
reducing the need to manage the tag as an asset.
• The tag is essentially like a sticker that can be applied to the windscreen. Its slim profile means
that an envelope can be used, simplifying packaging, allowing delivery through letter boxes,
and reducing fulfilment costs.
The main disadvantages are:
• RFID has a less defined and focused radio coverage “footprint” than DSRC – but this may not
matter on a motorway access ramp.
• RFID detection typically requires a large number of antennae to be fitted to an overhead gantry
and may also need additional support from laser triggers and cameras subject to location
design. Figure 1 below illustrates how vehicles passages are detected at Port Mann using a
dual gantry arrangement, front and rear plate reading, loops, lasers and RFID tag reader (see
step 5).
Figure 1: Port Mann vehicle detection passage sequence

Part B.1. Vehicle Detection and Identification Technology 10
RFID is widely adopted for expressway tolling in the US, Taiwan, the Philippines and Turkey and is
being introduced on some river crossings in the UK, primarily to reduce operating costs.
In Auckland, it is unlikely to suit any cordon-based scheme because of the gantry-based infrastructure
required at a detection site, but for a motorway scheme it may provide some operational cost savings
and reduce the setup cost for a user account, in comparison with DSRC tags. However, the
implementation cost per access and exit point is likely to be greater than for DSRC to cover the more
complex gantries and detection equipment. The higher capital cost is likely to be offset by the reduced
operating cost provided there is high take-up of RFID tag accounts.
2.7. Potential solutions
Based on the review above there are four potential technology solutions from which to select options
for Auckland Road Charging:
• ANPR with cameras - for motorway or cordon
• DSRC tag and beacon – for motorway or cordon
• RFID tag and beacon – for motorway only
• GNSS/GPS for motorway only, although this likely to be uneconomic for passenger cars. It
could be a feasible solution for Heavy Vehicles where a distance-based charge in Auckland
was applied.

Part B.1. Vehicle Detection and Identification Technology 11
Table 6 compares the solutions in the context of the Auckland road charging options.
Table 6: Comparison of solutions in context of charging option
Motorway Scheme City Cordon Scheme
ANPR • Already used on Northern Gateway successfully
• Achieving read rate of 97-99% after manual and other checks
• Cameras required anyway for enforcement
ANPR + DSRC • Proven in many countries on expressways/motorways
• Infrastructure may be challenging to place on local residential roads
DSRC • Will not meet occasional user need
• May not meet evidential or enforcement requirements
• Likely to be high volumes of casual users so will not be the only solution required
ANPR + RFID • May reduce operating costs in comparison with an ANPR and DSRC scheme
• Infrastructure unlikely to fit on local roads
RFID • Will not meet occasional user need
• May not meet evidential or enforcement requirements
• Infrastructure unlikely to fit on local roads
• Requires all vehicles to be fitted so will not suit casual users
GNSS/GPS • Can deliver distance based charging
• Will not meet occasional user need
• High cost of OBU $100+ operating costs.
• Evidential nature not clear
• Though established for many telematics apps for hauliers, many HGVs don’t have it. Still to mature as car system integrated with e-call, Usage-Based Insurance and other apps.
• Though many fleets use it to calculate road usage charges for heavy rigid vehicles the payment of such charges is unrelated to the intended road charging scheme.
• Not sufficiently accurate to measure cordon crossing down to a few metres
• May not be accurate/ reliable enough for trips encroaching inside the boundary of over 50m
• Risk vehicles outside are positioned inside occasionally due to GPS errors
Of these options, GNSS/GPS requires relatively expensive in-vehicle equipment and in our
experience it is only suitable for national road charging schemes. We therefore discount it as an
option for a scheme in Auckland. Also, DSRC and RFID by themselves are not options.

Part B.1. Vehicle Detection and Identification Technology 12
3. Preferred technologies
3.1. Key requirements for technology choice
The key issues and challenges for the technology options identified in section 2 are summarised in
Table 7.
Table 7: Summary of key issues for Motorway and Cordon roadside equipment and charging policy
Motorway Cordon
Equipment Issues
Roadside equipment installation
The equipment needs to be capable of:
• Being located on the (multiple) access and exit ramps
• Being maintained safely
The equipment needs to be capable of:
• Meeting aesthetic and ‘streetscape’ expectations on the adjoining residential roads along the boundary
• Being located between driveways, trees etc.
• Fitting with complementary measures on adjoining roads: parking restrictions, segregation of carriageways
• Differentiating between journeys starting or ending at premises just inside or immediately outside the cordon
• Meeting stakeholder expectations and reaction to the proposed equipment
Number of installations required
~ 190- 200 sites for all access (105-115) and exit (75-85) ramps
~ 40 sites
Charging Policy Parameters
Need for multiple captures per trip
Capable of detecting access and exit events to calculate distance
Capable of detecting each cordon crossing
Detection/ read rate
Typically required to be 98-99% or better Typically required to 98-99% or better
Account holders Could be video/ANPR or tag based Could be video/ANPR or tag based
Occasional users Could use video based payment (like Northern Gateway)
Could use Video based payment (like Northern Gateway)
Direction of travel Simple to provide as carriageways already segregated
Requires lane segregation
Distance charge Could be calculated by entry and exit N/a
Time of day Could be calculated on entry time or exit Peak and off-peak often required
Class of vehicle Assumed to be based on registration lookup
Based on registration lookup
Evidence capture Camera based Camera based
Part B.1. Vehicle Detection and Identification Technology 13
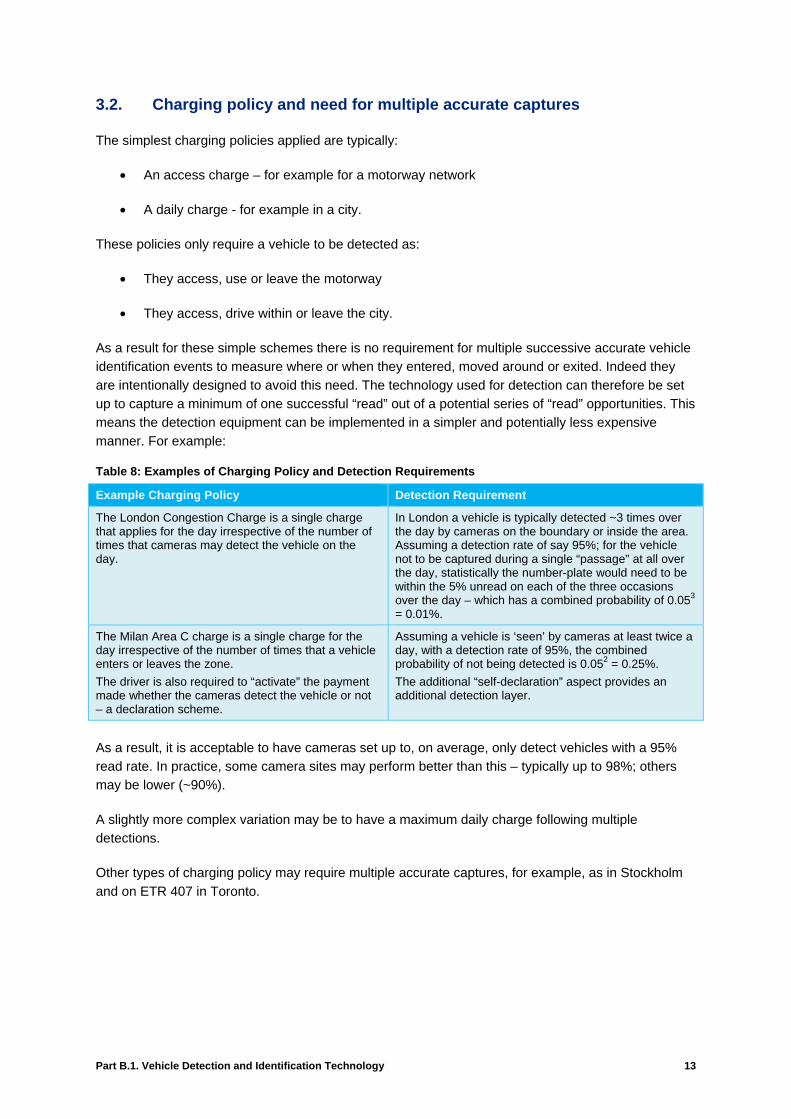
3.2. Charging policy and need for multiple accurate captures
The simplest charging policies applied are typically:
• An access charge – for example for a motorway network
• A daily charge - for example in a city.
These policies only require a vehicle to be detected as:
• They access, use or leave the motorway
• They access, drive within or leave the city.
As a result for these simple schemes there is no requirement for multiple successive accurate vehicle
identification events to measure where or when they entered, moved around or exited. Indeed they
are intentionally designed to avoid this need. The technology used for detection can therefore be set
up to capture a minimum of one successful “read” out of a potential series of “read” opportunities. This
means the detection equipment can be implemented in a simpler and potentially less expensive
manner. For example:
Table 8: Examples of Charging Policy and Detection Requirements
Example Charging Policy Detection Requirement
The London Congestion Charge is a single charge that applies for the day irrespective of the number of times that cameras may detect the vehicle on the day.
In London a vehicle is typically detected ~3 times over the day by cameras on the boundary or inside the area. Assuming a detection rate of say 95%; for the vehicle not to be captured during a single “passage” at all over the day, statistically the number-plate would need to be within the 5% unread on each of the three occasions over the day – which has a combined probability of 0.053 = 0.01%.
The Milan Area C charge is a single charge for the day irrespective of the number of times that a vehicle enters or leaves the zone.
The driver is also required to “activate” the payment made whether the cameras detect the vehicle or not – a declaration scheme.
Assuming a vehicle is ‘seen’ by cameras at least twice a day, with a detection rate of 95%, the combined probability of not being detected is 0.052 = 0.25%.
The additional “self-declaration” aspect provides an additional detection layer.
As a result, it is acceptable to have cameras set up to, on average, only detect vehicles with a 95%
read rate. In practice, some camera sites may perform better than this – typically up to 98%; others
may be lower (~90%).
A slightly more complex variation may be to have a maximum daily charge following multiple
detections.
Other types of charging policy may require multiple accurate captures, for example, as in Stockholm
and on ETR 407 in Toronto.

Part B.1. Vehicle Detection and Identification Technology 14
Table 9: Other examples of more complex charging policy and detection requirements
Example Charging Policy Detection Requirement
The Stockholm Congestion Tax is based on cordon crossing events – a charge of 10, 15 or 20 SEK is applied for each crossing
Each individual crossing event needs to be recorded. Detection is claimed to be in excess of 98% with ANPR supported by manual checks.
ETR 407 in Toronto charges by km travelled, time of day and class of vehicle
As the vehicle accesses and exits the motorway the vehicle registration, time of day and location, as a minimum must be captured reliably. Detection rate is claimed to be in excess of 99% using tag and beacon and ANPR, supported by manual checks. Figure 2 illustrates the detection infrastructure.
Figure 2: Examples of detection infrastructure for single opportunity capture
ETR 407 Single Lane Exit Ramp Detection
Infrastructure (Dundas Street Interchange)
(Source: Google, 2011) Stockholm Camera Detection Point
The leakage rate on ETR407 (un-billable trips – including exempt vehicles) was quoted as falling from
3.8% (2007) to 2.4% (2013) as improvements in camera and detection technology have been made
and more customers have taken up tag accounts (source: 407 ETR, Feb 2014). The majority of
unbillable trips are by exempt vehicles.
ETR 407 has a number of similarities with the proposed motorway charging scheme:
• Comparable length – 100km
• Similar number of access and exit ramps (190 vs 198).

Part B.1. Vehicle Detection and Identification Technology 15
3.3. Cordon
There are two technology options for a cordon scheme:
• ANPR Cameras
• ANPR Cameras + DSRC tag and beacon.
Where a cordon is located on urban and residential roads the key challenge is locating the
infrastructure needed to mount the equipment. For DSRC + ANPR, the gantries typically used are
quite substantial and have a negative impact on the streetscape. ANPR cameras can be mounted at
the side of the road in a less obtrusive manner but their detection performance may not be sufficiently
high to enable a cordon-based charging policy unless it is considered acceptable to have:
a) Revenue loss/non-detection of the order of 4-8%
b) Risk of false positive plate reads.
In this situation there is a choice of three options:
1. Use cameras at the roadside and accept the reduced detection performance and revenue
loss that results. To compensate, the charge level could be increased to offset the possible
leakage, which may be of the order of:
a. 2-4% if the cameras can be set up overhead
b. 5-8% if the cameras are mounted at the side of the road
2. The cordon becomes an “area” scheme and ANPR cameras are used to monitor vehicles
driving in the area – the charge would therefore apply for the day across the area; or
3. ANPR and DSRC equipment is mounted overhead on gantries and cantilevers. Some
aesthetic design approaches can be used to reduce the visual impact but the equipment is
still substantial. On main intersections and highways the impact may be acceptable; on
smaller residential roads the impact may be more significant.

Part B.1. Vehicle Detection and Identification Technology 16
Differences in cost, risk and revenue are summarised below.
Table 10: Relative risks of the technology options for a cordon scheme
Risk/Differentiator 1. Cordon with ANPR 2. Area with ANPR 3. Cordon with ANPR + DSRC
Locating equipment Medium Low
High
Streetscape/ risk of acceptance of infrastructure by stakeholders
Medium-High
(appearance of equipment)
Medium High
(size and scale of equipment to be located)
Detection data quality risk Medium-High Low
(subject to mounting)
Low
User understanding risk Medium Low- Medium Medium
Roadside capital cost Medium-High Medium High
Impact on revenue Medium
(risk of missed transactions)
Medium
(subject to a daily charge applying)
Low
Impact on charge payers Medium High
(movements inside the boundary are charged)
Medium
Technical complexity Medium Low High
Figure 3 illustrates an example configuration for a camera-based detection point.
Figure 3: Illustration of Camera Installation for 2 lane Highway from Roadside Pole

Part B.1. Vehicle Detection and Identification Technology 17
3.4. Motorway
Access and exit ramp detection
There are three technology options for the proposed Motorway scheme:
• ANPR Cameras
• ANPR Cameras + DSRC tag and beacon
• ANPR Cameras + RFID tag and beacon
The latter two require quite similar infrastructure.
It is assumed that equipment would be placed on each access ramp and exit – estimated to be some
190-200 locations. There would be a substantial cost associated with this.
Figure 4 illustrates a pole mounted version for an ANPR solution. An ANPR + DSRC version may be
mountable in a similar manner, subject to the need for overhead instead of side mounting of the
DSRC tag reader and the width of the highway.
The arrangement in Figure 4 aims to capture front plates as vehicles access the motorway. This
arrangement would not capture motorcycles which do not have front plates.
Figure 4: Illustration of layout for ANPR camera on access ramp
Alternatively a gantry could be located across each access or exit ramp, as used on ETR 407 – see
Figure 1. Overhead camera mounting improves number-plate reading and also makes it simpler to
operate with cameras in both directions reading front and back plates. The mounting points would
need to be chosen carefully.
• On the access ramps which have active traffic management typically narrowing to a single
lane.
• On exit ramps operating with 1, 2 or 3 lanes – overhead mounting would generate a better
read rate than side mounting.
• Where there are separate T2 or T3 lanes giving priority access.
Overhead mounting would also allow heavier equipment, such as vehicle classifiers and triggers, as
used on the Northern Gateway motorway. This is a very robust implementation which we understand
achieves a detection rate of 99%. Each site needs to be engineered to get maximum performance.
Low Speed Environment
Vehicles Accelerating on to Main Carriageway
Camera Field of View
CabinetVehicle Hard
Standing
Access Ramp onto Motorway

Part B.1. Vehicle Detection and Identification Technology 18
The more ‘safety margin’ left in when commissioned, the lower the likelihood of degradation. The
setup of a site needs to be “commissioned” and measured.
In addition to improved ANPR read rates, gantries also can be used to mount tag readers for DSRC
or RFID solutions, and are required for the latter technology. This increases the long-term flexibility of
the gantry infrastructure compared to side-mounted poles.
However these operational advantages for gantries come at the price of increased amenity costs and
higher capital costs. Installation of gantries may be physically difficult due to the space requirements
for the gantries themselves, given limited space on some roadsides and around parts of the
motorways, particularly on/off-ramps. Annex E considers further the performance impacts of using
gantries or cantilevers on entry and exit ramps.
There are also signage requirements which have to be met, which limit how close together gantries
can be placed. The physical size of the gantries, and the fact that they go right over the monitored
lanes mean that the visual impact is significant compared to side-mounted poles.
A local trial should be carried out to get locally relevant performance measures on motorways ramps;
the main question to be addressed is whether the charging policy is distance based – requiring a
detection record for each access and exit to calculate distance. If ANPR cameras only achieve a 98%
read rate for a single pass, there may be only a 96% probability that both access and exit event are
captured automatically. However, where an access event is captured without an exit, or exit captured
without an access image, the relevant plate can be used to search for “partial” or similar plate reads
from the pool of less robust image data using the ANPR “confidence” scale that most products apply.
Main carriageway gantries
Instead of having detection points on access and exit ramps, an alternative option is to have detection
equipment across the main motorway carriageway. Our assumption is that not every section of
motorway between intersections would have a gantry. This would mean the scheme would not be a
“closed” system, but could have the following benefits:
• Significantly fewer detection sites – a high level survey of the motorway suggest there may be
56-68 sections of motorway that require a gantry – compared with ~190 access and exit
points, subject to how the majority of the traffic is captured. Annex C provides an indication of
the sections that could be charged
• Better detection rates: equipment would be mounted directly over lanes eg Northern Gateway
However, using gantries across the whole carriageway has some disadvantages:
• Spanning the whole carriageway in a high speed environment requires more robust gantries
at significantly greater unit cost than for ramps, potentially a multiple of $100k per gantry
• The maintenance of the equipment on the gantries requires engineer access, potentially
through a service road – at greater cost
• The charging system will not be “closed” and drivers may have the option of avoiding some
motorway sections with gantries. This could increase the vehicle traffic on minor roads.

Part B.1. Vehicle Detection and Identification Technology 19
For such a system, modelling would be needed to assess whether at an intersection to intersection
level, drivers would divert to avoid paying a charge.
3.5. Tag and beacon costs and benefits
Tag and beacon, as an addition to ANPR, provides benefits where there is the potential to make
savings through:
• High levels of account take up which increases automated charging. It is usual for tag accounts
to attract a charge discount;
• Reduction in manual checking through a tag transaction not requiring validation. In most cases
both the tag ID and vehicle registration will be captured allowing:
− The link between tag and ID and vehicle to be revalidated or challenged each time the
vehicle is identified;
− If a tag battery fails the infrastructure can diagnose this and trigger a new tag being issued
to the account holder,
• Reduced revenue loss - the performance gap between ANPR and ANPR + DSRC may be of
the order of 1-4% depending on the local implementation.
A number of factors contribute to the cost and benefit assessment, for example:
Table 11: Tag and beacon costs and benefits
Cost Benefit
• The costs of the tags and their management
• The capex for the tag reader infrastructure and its opex maintenance
• The charge discount amount for using a tag account
• Whether the infrastructure can be appropriately sited on the highway concerned – single carriageways
• Savings in manual checking
• Reduced revenue loss through undetected vehicles
• More accurate billing – reduced risk of mis-billing due to ‘false positives’ particularly where multiple detection events contribute to a bill
The original business case for tags arose with toll plazas where replacing a manual toll collector
member of staff with automated raising of the barrier by a tag allowed the scheme operator to make
significant savings. However, for open road charging where there are already ANPR accounts, the
incremental benefits for local schemes of issuing tags are more marginal, as follows:
• If the detection rate improvement for a tag is of the order of say 2%, the additional revenue
may not counter balance the extra costs.
• If there is a saving on manual checking because the tag has confirmed the read – then the
saving needs to apply to a high proportion of users to be worthwhile, and allow the manual
check resource to be significantly reduced.
• If there is an additional discount to the customer for using a tag – this is a cost to the scheme
and may drive an overall net loss.

Part B.1. Vehicle Detection and Identification Technology 20
However, where there are multiple transactions involved in a trip and the differential revenue loss
through poorer detection data from ANPR is of the order of 10% or more, then the case may be
different. Table 12 below illustrates a worked example where there are two scenarios: a 2% and a
break-even scenario using tags, and the consequential impact on daily net revenue. Note this
excludes the cost of the extra roadside beacon infrastructure.
Table 12: Illustration of impact on net revenue per day
Impact on detection data quality Low Break-even
Daily trips 400,000 400,000
Charge level for ANPR ($) 2.00 2.00
Tag-equipped trips (%) 70% 70%
Tag trips per day 280,000 280,000
Tag discount on charge 5% 5%
Difference in trip detection data quality 2% 6.13%
ANPR only trips per day 120,000 120,000
Manual checks avoided per day (@33%) 93,333 93,333
- Staff time (hours@300 checks/hour) 311 311
- Staff time (days) 39 39
Staff FTE cost per day - manual checker ($) 200 200
Manual check staff costs avoided per day $7,778 $7,778
Revenue loss through the discount per day $28,000 $28,000
Additional revenue from better detection per day $11,200 $34,321
Tag cost over life ($) 25.00 25.00
Tags issued 1,400,000 1,400,000
Tag life (years) 7 7
Tag estate cost per day ($) $13,699 $13,699
Tag management cost per day (2 staff) ($) $400 $400
Net gain/loss per day -$23,121 -$0
The 2% and break-even examples for detection data quality improvement are only scenarios:
• Based on the experience at Northern Gateway using just ANPR detection for a single
detection event and achieving 98% read rate, we assume that addition of tags would only
improve detection by 1.5-2%.
• For a more complex charging policy, where multiple reads need to be taken and there was,
say a 5% single passage risk of non-detection or misread, and two passage detection events
were required to be able to charge, then that may equate to a 10% impact scenario.
Where the marginal improvement in detection quality is relatively low, a tag-and-beacon solution
imposes a net cost, with the additional net revenue from improved detection exceeded by the
additional costs of the tags and the assumed discount on tag transactions intended to improve
uptake. The tag-and-beacon break-even scenario above shows that a detection improvement of
approximately 6% is needed to break even under the above assumptions; if an RFID solution is used,
based on a $2 tag costs and all else being equal, then this break-even point is closer to 4%.
Part B.1. Vehicle Detection and Identification Technology 21
Under more complex charging regimes (e.g. a distance-based scheme) the improved detection ability
becomes increasingly beneficial. The actual improvement in trip detection ability required to make tag-
and-beacon-based solutions economic will depend on the read rates achievable by ANPR technology
in practice.
Other approaches are also used to compensate for poorer ANPR read rates or to finance the costs of
tags, for example:
• A video toll manual check charge can be applied.
• Tags may have a monthly fee charge to cover financing costs.
Hence, for the Dartford Crossing Freeflow project – a single site river crossing, not unlike Northern
Gateway - it was decided to be silent in the operator procurement specification on whether tags
should be used, but demand an overall read rate of 98%. This allowed the bidding operators to decide
what technology to adopt to minimise leakage.
The substantial majority of tag and beacon schemes operate on expressways, motorways and tolled
crossings where it is more straightforward to mount the detection equipment.
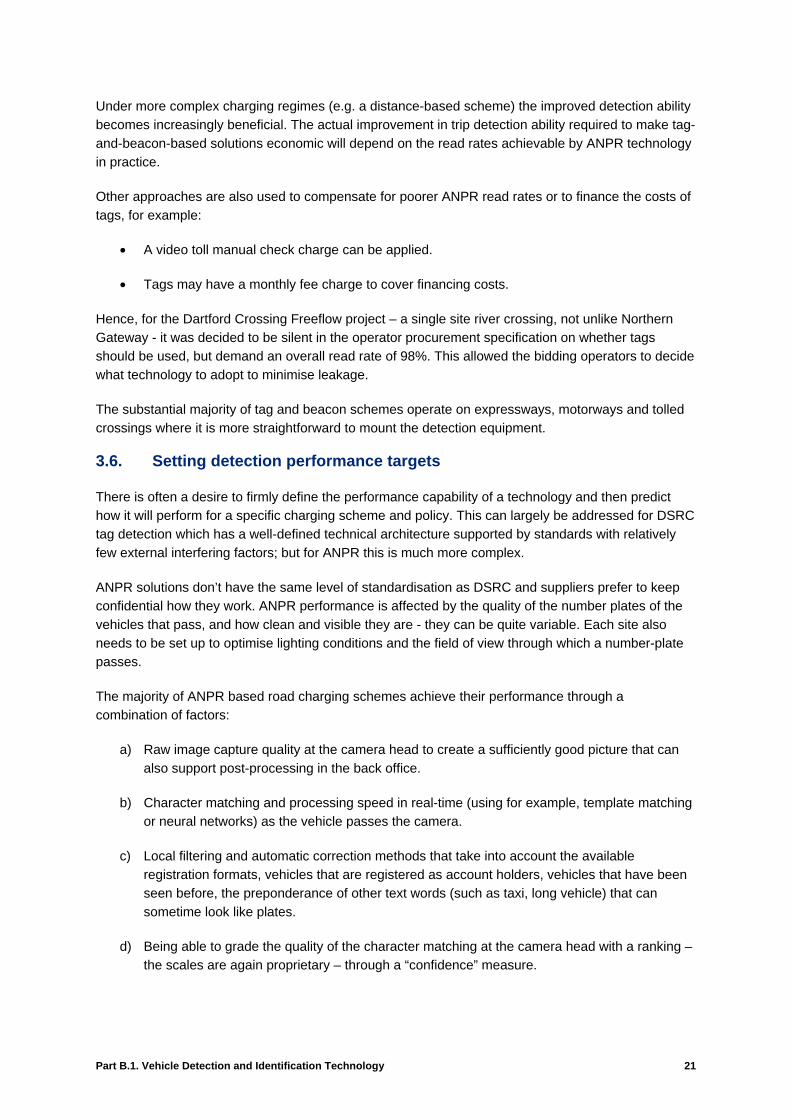
3.6. Setting detection performance targets
There is often a desire to firmly define the performance capability of a technology and then predict
how it will perform for a specific charging scheme and policy. This can largely be addressed for DSRC
tag detection which has a well-defined technical architecture supported by standards with relatively
few external interfering factors; but for ANPR this is much more complex.
ANPR solutions don’t have the same level of standardisation as DSRC and suppliers prefer to keep
confidential how they work. ANPR performance is affected by the quality of the number plates of the
vehicles that pass, and how clean and visible they are - they can be quite variable. Each site also
needs to be set up to optimise lighting conditions and the field of view through which a number-plate
passes.
The majority of ANPR based road charging schemes achieve their performance through a
combination of factors:
a) Raw image capture quality at the camera head to create a sufficiently good picture that can
also support post-processing in the back office.
b) Character matching and processing speed in real-time (using for example, template matching
or neural networks) as the vehicle passes the camera.
c) Local filtering and automatic correction methods that take into account the available
registration formats, vehicles that are registered as account holders, vehicles that have been
seen before, the preponderance of other text words (such as taxi, long vehicle) that can
sometime look like plates.
d) Being able to grade the quality of the character matching at the camera head with a ranking –
the scales are again proprietary – through a “confidence” measure.
Part B.1. Vehicle Detection and Identification Technology 22
e) Using a secondary ANPR processing engine in the back office that carries out an automated
further review of the plate interpretations.
f) Being able to allocate into separate categories or “buckets”, plate reads that are more or less
likely to have been correct and to which one might apply a different grade of audit sampling.
g) Applying a manual review mechanism according to business rules for each grade of “bucket”
that serves to:
i. Inspect and audit the reads that have been made to retain confidence that the bucket
structure is correct;
ii. Correct reads that turn out to be erroneous when inspected;
iii. Validate that lower categories of bucket are actually “rubbish” that can safely be
discarded.
h) Being able to “catch” incorrect reads later in the process – for example when a reminder or
infringement notice is about to be sent out and it becomes clear that the vehicle details held
with the registrar differ from the image captured.
The overall result of these processes after much fine tuning may achieve a read rate of 94-99% on
average across a wide range of vehicle types, conditions and sites. It is not as simple as assigning a
percentage of correct reads to the camera and then corrections to be delivered by manual checkers.

Part B.1. Vehicle Detection and Identification Technology 23
4. Roadside high level design
In this section we set out a high level design for the roadside technology based on our assumptions
about the quantity and location of the cordon and motorway detection sites required.
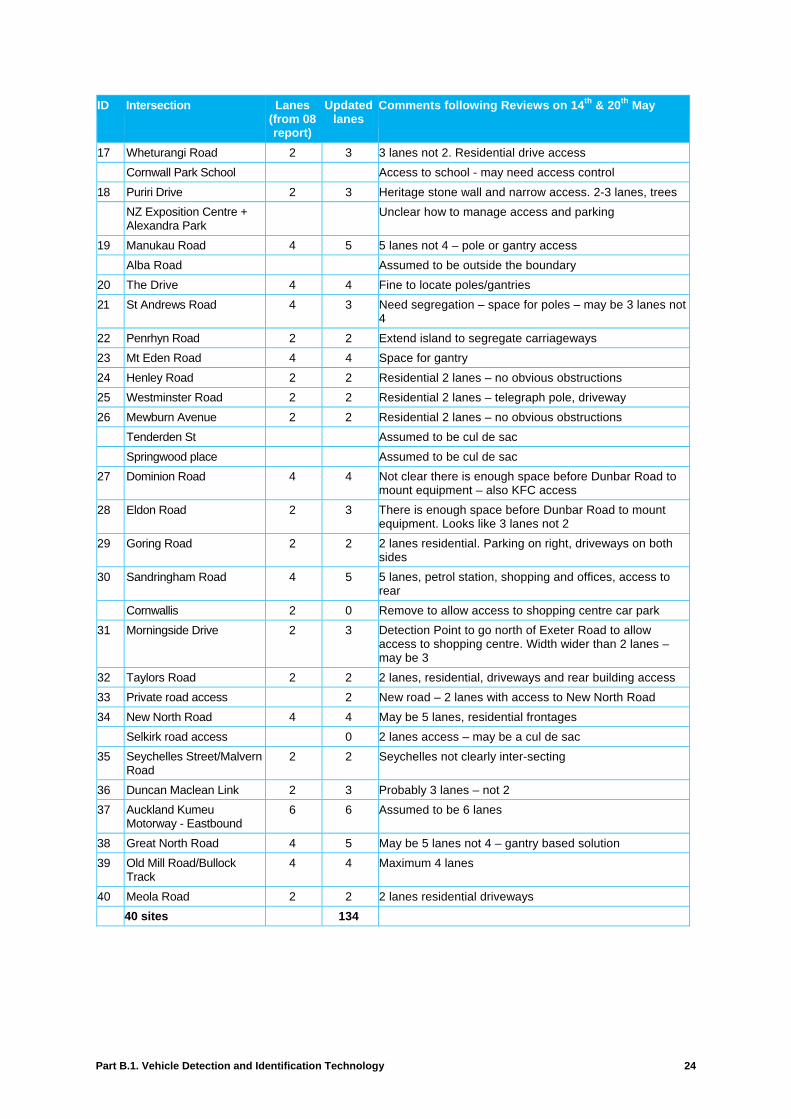
4.1. Cordon sites
Table 13 summarises our notes on the sites relating to a possible “inner” cordon with updated lane
numbers and data from a design in 2008. In practice, each site requires a detailed survey to assess
how it would be covered with detection infrastructure. The roadside equipment is assumed to use
ANPR cameras.
Table 13: Proposed Cordon site summary
ID Intersection Lanes (from 08 report)
Updated lanes
Comments following Reviews on 14th & 20th May
1 Northern Motorway – Southbound
8 8 Assumed to be full width of 8 lanes – 2 x 4 lane gantries
2 Tamaki Drive 4 4 Can be done across 4 lanes – 2 pole model. Bridge/causeway may limit foundation size
3 Orakei Road 4 3 3 lanes not 4. Can be done close to roundabout. 2 poles. Bridge may limit foundation/poles
Kelvin Road 2 0 Cul de sac.
Pukeora Avenue Cul de Sac – assumed outside the scheme
4 Ngapuhi Road 2 3 Driveways – 2-3 lanes. Need segregation
5 Luceme Road 2 2 Need segregation. Driveway + rear access to Cartridge World
6 Upland Road 2 3 3 lanes not 2 – parking space, rear access to bar, but could be done with cameras
7 Remuera Road 4 4 Complex location – intersection – rear access for parking at Church, but do-able with 2 poles or gantry
8 Lochiel Road 2 2 Fine. 2 lanes – space for poles
9 Ascot Avenue 2 4 3-4 lanes – space for poles. Segregation needed
10 St Vincents Avenue/Carmont Street
2 2 Telegraph pole obstruction
11 Ohinerau Street 2 2 Extend island to segregate lanes
12 Clonburn Road 4 2 Exit only onto Green Lane East. Maybe only 2 lanes
13 Southern Motorway – 6 8 8 lanes between Greenlane and St Marks (auxiliary lane in each direction)
14 Marewa Road 2 New site to be covered
Retail/Industrial estate parking access/car wash
New access control may be needed
15 Great South Road 4 6 6 lanes not 4. Rear access to McDonalds. Otherwise fine for gantry solution
16 Tawera Road 2 2 Residential drives and access to homes
Part B.1. Vehicle Detection and Identification Technology 24
ID Intersection Lanes (from 08 report)
Updated lanes
Comments following Reviews on 14th & 20th May
17 Wheturangi Road 2 3 3 lanes not 2. Residential drive access
Cornwall Park School Access to school - may need access control
18 Puriri Drive 2 3 Heritage stone wall and narrow access. 2-3 lanes, trees
NZ Exposition Centre + Alexandra Park
Unclear how to manage access and parking
19 Manukau Road 4 5 5 lanes not 4 – pole or gantry access
Alba Road Assumed to be outside the boundary
20 The Drive 4 4 Fine to locate poles/gantries
21 St Andrews Road 4 3 Need segregation – space for poles – may be 3 lanes not 4
22 Penrhyn Road 2 2 Extend island to segregate carriageways
23 Mt Eden Road 4 4 Space for gantry
24 Henley Road 2 2 Residential 2 lanes – no obvious obstructions
25 Westminster Road 2 2 Residential 2 lanes – telegraph pole, driveway
26 Mewburn Avenue 2 2 Residential 2 lanes – no obvious obstructions
Tenderden St Assumed to be cul de sac
Springwood place Assumed to be cul de sac
27 Dominion Road 4 4 Not clear there is enough space before Dunbar Road to mount equipment – also KFC access
28 Eldon Road 2 3 There is enough space before Dunbar Road to mount equipment. Looks like 3 lanes not 2
29 Goring Road 2 2 2 lanes residential. Parking on right, driveways on both sides
30 Sandringham Road 4 5 5 lanes, petrol station, shopping and offices, access to rear
Cornwallis 2 0 Remove to allow access to shopping centre car park
31 Morningside Drive 2 3 Detection Point to go north of Exeter Road to allow access to shopping centre. Width wider than 2 lanes – may be 3
32 Taylors Road 2 2 2 lanes, residential, driveways and rear building access
33 Private road access 2 New road – 2 lanes with access to New North Road
34 New North Road 4 4 May be 5 lanes, residential frontages
Selkirk road access 0 2 lanes access – may be a cul de sac
35 Seychelles Street/Malvern Road
2 2 Seychelles not clearly inter-secting
36 Duncan Maclean Link 2 3 Probably 3 lanes – not 2
37 Auckland Kumeu Motorway - Eastbound
6 6 Assumed to be 6 lanes
38 Great North Road 4 5 May be 5 lanes not 4 – gantry based solution
39 Old Mill Road/Bullock Track
4 4 Maximum 4 lanes
40 Meola Road 2 2 2 lanes residential driveways
40 sites 134

Part B.1. Vehicle Detection and Identification Technology 25
Across the 40 sites, we assume that a set of generic configurations can be applied:
Table 14: Generic configurations for Cordon sites
Configuration Site Drawing ID (Annex B) Number of Sites
8 lane 2 x 4-lane – Sketch 9 2
6 lane 2 x 3-lane – Sketch 8 2
4/5 lane Sketch 6, 2 x Sketch 5 configured to cover 5th lane
13
2/3 lane 2 x Sketch 4 or Sketch 4 + Sketch 5 23
A question was raised as to whether there was a simpler cordon option to that described above. We
therefore reviewed a further option based on only 15 detection sites, but covering a larger area.
Annex D provides an assessment of the technical feasibility such a wider scheme based on a desktop
review of the road network.
4.2. Motorway sites
The motorway network is assumed to stretch from:
• Northern Gateway; to
• Southern Boundary – Southern Motorway end/State Highway start – SH1N
• The North West boundary is the roundabout at Fred Taylor Drive.
Figure 5Figure 5 illustrates the extent of the motorway network assumed to be in scope.
We conducted a high level survey of the motorway access ramps and exits to estimate the required
lane coverage.
Across the estimated 105 on-ramps and 91 off-ramps, we estimate the total 1, 2 and 3-lane ramps are
as set out in Table 15 below. We assume that a set of illustrative site configurations can be applied.
Sketches for the designs are provided at Annex B.
In addition, full motorway width gantries would be required at the three start and end points on the
motorways that continue onwards:
Table 15: Estimate for Motorway configurations
Configuration Drawing ID (Annex B) Number of Sites
On-ramps
2-lane Sketch 2 or 3 3
1- lane Sketch 1 102
Off-ramps
3-lane Sketch 8 1
2-lane Sketch 2 or 3 11
1-lane Sketch 1 79
Motorway End Points
SH1 Northern End 2 x 2 lanes Sketch 8 1
SH1 Southern End, 2 x 2 lanes Sketch 8 1
SH20A Airport, 2 x 2 lanes Sketch 8 1

Part B.1. Vehicle Detection and Identification Technology 26
Figure 5: Motorway Network in scope
Source: Jacobs

Part B.1. Vehicle Detection and Identification Technology 27
Two variations were also considered:
• Vehicle detection only on entry ramps – thereby imposing a motorway access charge
• Detection only on exit ramps – effectively a charge for access to local roads.
On balance, we conclude that of these variations, using entry ramps for detection and charging is
more feasible. Annex F considers these issues in more detail.
4.3. Roadside services
The equipment at the roadside typically requires the following services:
• Power – this is usually a resilient single phase power source and may need to be of a higher
quality than typical street lighting power needs depending on the specific product.
• Data communications – typically over broadband or fibre to the back office and data centre.
This also requires resilience. We assume this would need to be a cabled link as the data
speed required may be of the order of 2M-10Mbps at each site and there may be privacy
restrictions that prevent use of wireless communications.
• A management and diagnostics function which can be integrated with the camera or within a
separate cabinet. If a cabinet is used then it needs to be secured from potential tampering. It
is usual for each site to have a “heart beat” report that regularly reaffirms that it is working
normally and that the data captured is secure and could not have been interfered with.
The equipment needs to meet ingress protection, environmental and electromagnetic compatibility
requirements for the location. Given temperature variability it is advisable to minimise the number of
moving parts.
Where a gantry, pole or cantilever is used a concrete base is needed and the whole structure needs
to be designed in the context of the weight and ‘windage’ of the equipment to be mounted.

Part B.1. Vehicle Detection and Identification Technology 28
5. Maintenance and renewal assumptions
5.1. General maintenance
Typically roadside equipment would be maintained or inspected every 3 or 6 months; it would be
monitored from a central management console to establish its health and allow system alarms and
failures to be captured.
For cameras, the need for evidential integrity of the records captured would require that there was a
regular ‘heart beat’ message logged, indicating the system was working normally.
Contract performance indicators may also require individual measurement and tuning of each site.
Road traffic accidents and street works may cause additional maintenance tasks for the operator and
maintainer.
Signs and highway markings announcing the scheme will also need to be maintained and refreshed.
5.2. Cordon
At this stage we have not scoped the maintenance requirements for roadside equipment. In general
they would follow typical practice for on-street equipment. We have already identified the challenges
for locating detection equipment on the smaller residential roads and also meeting local streetscape
considerations.
5.3. Motorway
We assume the roadside maintenance regime for a motorway option will follow NZ Transport Agency
requirements for operations on the network and safety.
5.4. Refresh cycle
In general asset lives for cameras and roadside beacons are substantially longer than the contracts in
place to operate them. The need to replace or update them may be driven by:
• Hardware or software obsolescence – but in general this aspect of the asset life would be
assessed at the start of the contract.
• Changes in evidential requirements for enforcement.
• Technology evolution over-taking the asset life.

Part B.1. Vehicle Detection and Identification Technology 29
• Changes in the road network or resurfacing, and the opportunity being available to upgrade
the infrastructure while the road is closed.
• The equipment being unserviceable following a traffic accident, and being upgraded with a
new model.
• A new service provider or maintainer being procured with a new service level and KPI regime.
The cameras implemented in London were initially installed on the basis they had a 7 year asset life;
in practice they were replaced with a new integrated camera and ANPR processor version after 5
years – here technology evolution overtook the asset life. In general the asset life of each product is
manufacturer specific. Elements that tend to fail include:
• Power supplies and related batteries and back-up power.
• Disk drives – in general devices at the roadside using disks should be avoided.
5.5. Operational risks
The most significant operational risks to equipment arise from:
• Roadside environmental challenges – heating, cooling, dust and debris blocking vents.
• Poor commissioning for example, sun-blinding caused by the angle of the sun varying
seasonally and preventing an ANPR camera from working.
• Road traffic accidents where the pole or equipment is damaged or emergency services may
cut through power or a cabinet to make the location safe.
• Incidents that arise when equipment is being serviced or maintained or during street or
nearby building works.
• If the site needs to be relocated where carriageway or building works take place.
Items blocking a camera’s field of view and reducing read rate, can include:
• Trees which have additional growth in the spring and need pruning.
• High-sided parked vehicles.
These issues can be addressed during site survey and design.
The signs announcing the scheme can also be damaged by traffic accidents. Road markings
indicating entrances and exits also need to be maintained.

Part B.1. Vehicle Detection and Identification Technology 30
5.6. Highway governance
How the operational highway is governed to enable installation of equipment and maintenance needs
to be determined. The parties involved are assumed to be:
• Auckland Council
• New Zealand Transport Agency in the case of a motorway scheme
• A scheme operator
• A highway maintainer.
These parties will need to agree roles and responsibilities for operation and maintenance and also
who has powers to collect charging revenue, administration charges and fines as this may vary
depending on whether it is on the motorway or on local roads in Auckland. The legislation will need to
set out the governance structure.

Part B.1. Vehicle Detection and Identification Technology 31
6. In-vehicle requirements
The in-vehicle requirements for each option are as follows:
Table 16: In-vehicle requirements for each option
Detection Solution Requirements
ANPR • No in-vehicle requirements
ANPR + DSRC tag and beacon • For account holders a DSRC tag would be fitted inside the front windscreen. The tag could be provided to the user with a deposit and periodic charge
• There is also the potential for video accounts which are charged at a premium to recognise the lower detection rate and manual checking costs
In terms of user compliance costs there are substantial benefits in not requiring in-vehicle equipment
and making the system easy to use. This has also been the approach on Northern Gateway where
the option of using tags has not been taken up to date.

Part B.1. Vehicle Detection and Identification Technology 32
7. Conclusions
Technology choice
The primary technology choice is between:
• ANPR cameras; or
• ANPR cameras + tag and beacon.
At this stage we have not firmly concluded the technology choice because of the risk of poor detection
performance of ANPR systems and potential impact on revenue loss.
However, we have configured a base case of ANPR cameras at the roadside for each of the cordon
and motorway schemes. Depending on the charging policy to be adopted and performance
requirement there may be a need to add tag and beacon to this configuration. This is more feasible to
do for the motorway charging solution given the streetscape issues with a single cordon.
The main advantages of ANPR cameras are:
• Can be used more flexibly to fit with the urban road network
• Less visually intrusive
• Avoids the additional costs of tags and tag readers.
The main advantages of tag and beacon with ANPR over just ANPR are:
• More accurate detection of vehicles with tags fitted
• Reduced manual checking in the back office leading to reduced operating costs
• Still allows casual users without tags to be served.
Performance challenge
With just ANPR, there is a risk that detection performance will be relatively poor - 98% or less per
vehicle passage (vs ~ 99.8% for tags), resulting in:
• Loss of revenue
• Risk that incorrect reads may result in charges being applied to the wrong account – this can
be reduced through additional manual checking
For reference, Stockholm claims a vehicle detection rate of 98% and Northern Gateway 97-99%; both
schemes use ANPR cameras but are also mounted on overhead gantries to improve detection rates.

Part B.1. Vehicle Detection and Identification Technology 33
Before any performance expectation is set for the cordon, there should be a trial to test vehicle
capture rates.
Similarly, implementing a camera site on a motorway access and exit ramp would provide lessons on
performance and collaboration between the agencies involved at the roadside.
Scheme complexity
In comparison with other schemes the options proposed are relatively complex:
• The cordon scheme has ~40 detection locations – more than double the size of Stockholm and
also in largely residential areas with some significant spatial and aesthetic constraints.
• The motorway scheme has ~190 access and exit ramps – this is a substantial implementation
project. It may be advisable to consider breaking it up into discrete stages.
Alternatively, the analysis at Annex C for a “mainline” gantry-based approach for the motorways –
instead of access and exit ramps - suggests that between 56 and 68 full gantries may be required.
This would still be a substantial project but could also be staged by motorway.
Motorway Scheme
On balance we conclude that based on technology considerations, charging on the motorway is more
feasible than for a cordon scheme.
We have also explored the infrastructure required for charging based on:
A. Entry and exit detection, which would enable a distance based approach but also require the
most infrastructure.
B. Entry detection only – effectively an access charge, which we understand is the preferred
option from a policy point of view.
C. Exit detection only – effectively a charge for motorway users who seek access onto the local
roads, though we have only considered this at a high level.
D. A “mainline” gantry based approach with charging for each section of motorway.
We conclude that options A, B and D are technically feasible. Option C would require further analysis.

Part B.1. Vehicle Detection and Identification Technology 34
Annex A – Scope of Deliverable B.1 Technology
Scope of Deliverable B.1 Technology
An analysis of the range of available vehicle detection and identification technologies, and
recommendations for a preferred technology for a single cordon or motorway road pricing scheme in
Auckland.
Identification of the roadside infrastructure, the associated maintenance and renewal requirements,
and the in-vehicle requirements needed to support the detection and identification technology.

Part B.1. Vehicle Detection and Identification Technology 35
Annex B – Illustrative designs for the roadside technology
Illustrative designs for the roadside technology
Illustrative designs for roadside equipment and camera mountings
• Sketch 1 – Single Lane, Single Camera On-Ramp
• Sketch 2 – Two Lane Access, Dual Camera (Pole)
• Sketch 3 - Two Lane Access, Dual Camera (Gantry)
• Sketch 4 – Residential/Local Road, Single Lane, Pole
• Sketch 5 – Residential/Local Road, Cantilever Pole – 2 x 2 Lanes
• Sketch 6 – Residential/Local Road, 4-Lane Gantry
• Sketch 7 – Residential/Local Road, 2-lane Gantry
• Sketch 8 – Motorway, 3-Lane Gantry
• Sketch 9 – Motorway, 4-Lane Gantry
Assumptions – On-motorway ramps
• Height of 6m
• Gantries will have a clearance of 6 metres
• Over-lane engineer working will require access to the gantry, including hard standing area and
safe vehicle entry/egress
• For ramps which allow vehicle access, one by one, to the motorway under ramp metering, the
detection point will be at the point of the single vehicle lane
• Where possible roadside equipment/cabinets will be placed on local roads to ease engineer
access
• Ramp closures will be required to enable maintenance of equipment to be managed in line with
a protocol to be agreed with NZTA [Note: Maintenance on Northern Gateway takes place every
3 months]
• Frangible poles will be used
• Off ramps will have similar assumptions

Part B.1. Vehicle Detection and Identification Technology 36
Figure 6: Sketch 1 – single lane, single camera on-ramp

Part B.1. Vehicle Detection and Identification Technology 37
Figure 7: Sketch 2 – two lane access, dual camera (pole)

Part B.1. Vehicle Detection and Identification Technology 38
Figure 8: Sketch 3 - two lane access, dual camera (gantry)

Part B.1. Vehicle Detection and Identification Technology 39
Figure 9: Sketch 4 residential/ local road, single lane, pole height 6m

Part B.1. Vehicle Detection and Identification Technology 40
Figure 10: Sketch 5 residential/ local road, cantilever pole - 2 x 2 lanes

Part B.1. Vehicle Detection and Identification Technology 41
Figure 11: Sketch 6 residential/ local road, 4-lane gantry

Part B.1. Vehicle Detection and Identification Technology 42
Figure 12: Sketch 7 residential/ local road, 2-lane gantry; Sketch 8 – motorway, 3-lane gantry; Sketch 9 – motorway, 4-lane gantry

Part B.1. Vehicle Detection and Identification Technology 43
Annex C – Motorway charging scheme – main highway gantries
The following mainline sections of motorway are candidates for having a tolling gantry. In some cases
we may decide a gantry is not needed on that section – identified as a “Not Toll Option”.
SH1
Table 17: SH1 - Main highway gantries
Section From To Not Toll Option?
1 Grand drive Wainui Road
2 Wainui Road Exit 398 Silverdale Yes
3 Exit 398 Exit 410 Oteha Valley Road
4 Exit 410 Exit 412 Greville Rd
5 Exit 412 Exit 414 Upper Harbour & SH18
6 Exit 414 Exit 417 Tristram Avenue
7 Exit 417 Exit 419 Northcote Road
8 Exit 419 Exit 420 Esmonde Rd
9 Exit 420 Exit 421 Onewa Rd
10 Exit 421 Exit 422 Stafford Road
11 Exit 422 Exit 423 Shelly Beach Road
12 Exit 423 Shelly Beach Road Exit 424 Fanshawe St
13 Exit 424 Fanshawe St Exit 425 Cook Street
14 Exit 425 Cook Street Exit 427 Nelson St
15 Exit 427 Nelson St Exit 4-AbC
16 Exit 4-AbC Exit 427 Waitakere Helensville
17 Exit 427 Waitakere Helensville Exit 430 Kyber Pass
18 Exit 430 Kyber Pass Exit 431 Gillies
19 Exit 431 Gillies Marks St
20 Marks St Exit 432 Market Rd
21 Exit 432 Market Rd Exit 433 Green Lane East
22 Exit 433 Green Lane East Tecoma
23 Tecoma Exit 435 Ellerslie Panmuire Yes
24 Exit 435 Ellerslie Panmure Exit 437 South Eastern Highway Yes
25 Exit 437 South Eastern Highway Exit 438 Mt Wellington Highway
26 Exit 438 Mt Wellington Highway Exit 441 Princes St
27 Exit 441 Princes St Exit 443 Highbrook Drive
28 Exit 443 Highbrook Drive Exit 444 East Tamaki Rd
29 Exit 444 East Tamaki Rd Exit 447 Te Irirangi Dr
30 Exit 447 Te Irirangi Dr Exit 448 Manakau Yes
31 Exit 448 Manakau Exit 449 Great South Road Yes
32 Exit 449 Great South Road Exit 451 Hill Road
33 Exit 451 Hill Road Exit 453 Takanini
34 Exit 453 Takanini Exit 458 Papakura
35 Exit 458 Papakura Exit 461 Drury
36 Exit 461 Drury Exit 466 Ramarana

Part B.1. Vehicle Detection and Identification Technology 44
SH16
Table 18: SH16 - Main highway gantries
Section From To Not Toll Option? 1 Fred Taylor Drive Exit 11/10 2 Exit 11/10 Exit 18 Royal Road Makora Park 3 Exit 18 Royal Road Makora Park Exit 16 Lincoln Road 4 Exit 16 Lincoln Road Exit 14 Te Atatu Rd 5 Exit 14 Te Atatu Rd Exit 12 Patiki Road 6 Exit 12 Patiki Road Exit 11 Rosebank Rd Yes 7 Exit 11 Rosebank Rd Exit 8 Great North Road 8 Exit 8 Great North Road Exit 6 St Lukes Road 9 Exit 6 St Lukes Road Exit 5 Newton Rd 10 Exit 5 Newton Rd Exit 4 ABC Yes
SH18
Table 19: SH18 - Main highway gantries
Section From To Not Toll Option?
1 Exit 414 Exit 2 Yes
2 Exit 2 Exit 4
3 Exit 4 Exit 6
4 Exit 6 Exit 8
5 Exit 8 Exit 9
6 Exit 9 Exit 10
7 Exit 10 Exit 11 Yes
SH20
Table 20: SH20 - Main highway gantries
Section From To Not Toll Option?
1 Exit 8 H16 Stoddard Rd
2 Stoddard Rd Exit 18 Dominion Rd
3 Exit 18 Dominion Rd Exit 16 Hilsborough Road
4 Exit 16 Hilsborough Road Exit 15 Queenstown Rd
5 Exit 15 Queenstown Rd Exit 13 Neilson Street
6 Exit 13 Neilson Street Exit 12 Mahunga Dr
7 Exit 12 Mahunga Dr Exit 10 Walmsley Rd
8 Exit 10 Walmsley Rd Exit 9 Airport
9 Exit 9 Airport Exit 7 Massey Road
10 Exit 7 Massey Road Exit 3 Cavendish Drive/Puhinui Rd
11 Exit 3 Cavendish Drive/Puhinui Rd Exit 1 SH1
SH20A
Table 21: SH20A - Main highway gantries
Section From To Not Toll Option?
1 Exit 9 Kirkbride/Massey
2 Kirkbride/Massey Montgomerie Road Yes
3 Montgomerie Road Landing Drive Yes
4 Landing Drive Nixon Rd Yes

Part B.1. Vehicle Detection and Identification Technology 45
Summary
Table 22: Summary - Main highway gantries
Road Sections Optional
SH1 36 5
SH16 10 2
SH18 7 2
SH20 11 0
SH20A 4 3
Total 68 12
On this basis, we estimate that between 56 and 68 full gantries would be required for this option.
On the assumption that each gantry will on average cover 6 lanes, (3 in each direction), we would
require 336-408 lanes to be monitored. If we use 2 cameras per lane – front and rear plate capture –
that would require 672-816 cameras.
The precise number of lanes and cameras would be subject to a full survey.

Part B.1. Vehicle Detection and Identification Technology 46
Annex D – Illustration of a Wider Cordon Scheme
Figure 13 illustrates a potential wider cordon scheme boundary based on the isthmus, with the aim of
reducing the number of detection sites while still potentially meeting the scheme objectives.
Figure 13: Illustration of a Wider Cordon

Part B.1. Vehicle Detection and Identification Technology 47
This scheme is estimated to require only 15 detection points. The choice of boundary on the western
side is most challenging. For example, if we follow a line east of Portage Road, the detection points
would be on:
• Ash Street east of the Wairu junction
• Great North Road west of the junction with Portage Road
• Clark Street just west of the Ulster street junction
• Bolton Street west of the Castlewood junction
• Kinross Street east of the roundabout serving Portage Road
• Connaught Street just east of the junction with Godley Road.
The Ash Street and Bolton Street detection points would need careful planning to fit with drives,
shops, parking and nearby houses. The other sites on the boundary are more straightforward. A full
site survey would be required to confirm feasibility, though the table below provides initial comments
from a desktop review.
No Detection Point Location Lanes Issues & Comments Relative Feasibility
1 Harbour Bridge 3 + 4 • Movement of the lane divider. Bridge mounting
Yes
2 SH16 3+3 • Dual carriageway on a bridge Yes
3 Ash Street east of the Wairu junction
4 • Drives of houses on North side of Ash Street may make aesthetics difficult.
• Room for a gantry
Maybe
4 Great North Road west of the junction with Portage Road
2 • On the bridge (Whau River) may be a suitable location for a gantry
Yes
5 Wolverton Street just west of the Ulster street junction
3 • Clear section for a gantry just east of the Gull petrol station
Yes
6 Bolton Street west of the Castlewood junction
2 • Parking and shops on south side of Bolton Street, Houses & drives on North side
Maybe
7 Kinross Street east of the roundabout serving Portage Road
2 • Clear country road. • Room for gantry
Yes
8 Connaught Street just east of the junction with Godley Road
2 • Clear wooded road. • Room for a gantry
Yes
9 Mangere Bridge 4+4+1 • Bus lane on Southbound. • Room for gantry
Yes
10 Great South Road North of the junction with Portage Road
4 • Clear wide road with space for a gantry
Yes
11 Abattoir Lane where it meets the Great South Road
1.5 • Narrow lane with space for light gantry
Yes
12 Mt Wellington Highway south of the New Brighton junction
2 • Two properties either side with driveways but room for a light gantry.
• Aesthetics may need some
Yes

Part B.1. Vehicle Detection and Identification Technology 48
No Detection Point Location Lanes Issues & Comments Relative Feasibility
attention
13 SH1 north of Exit 441 Princes St
3+3 • Dual carriageway on a bridge Yes
14 South Eastern Highway/ Pakuranga Highway on Waipuna Bridge
2+2 • Dual carriageway on a bridge Yes
15 Lagoon Drive on Panmure Bridge
3 • Aesthetics may need attention - but room for a gantry
Yes
How Does This Compare with the Primary Cordon Option from a Technical Perspective?
Advantages Disadvantages
• Less sites to install reduces project management complexity
• More space at a site permits more effective detection infrastructure – overhead gantries + cameras in both directions over each lane
• Detection rate per passage should be greater on average
• Stakeholders should be less likely to object on aesthetic grounds
• Overall infrastructure capex may be slightly lower.
• Unit site cost will be higher on average
The comparison above does not consider differences in:
• The nearby institutions affected: schools, hospitals, golf courses etc
• Whether stakeholders might object to being close to the boundary
• The traffic volumes across the cordon and therefore revenue raised
• Impacts on driver journeys or congestion
• Communities which are split by the boundary.

Part B.1. Vehicle Detection and Identification Technology 49
Annex E – Gantries vs Side-Mounted Poles and Cameras
The two primary means of mounting detection equipment is on either gantries or side-mounted poles.
There are costs and benefits associated with both of these approaches. The key differences are
summarised in Table 23 below:
Table 23: Comparison of Gantries and Side-mounted Poles
Gantries Side-mounted Poles
Pros
• Better read rates (say 96-98%)
• Able to install cameras facing both ways (so can capture front & back plates)
• Once installed, provide ability to later upgrade to usage of distance based charging or OBUs
• Allows heavier equipment, such as vehicle classifiers and triggers
• Required for RFID technology solution
Pros
• Lower cost
• Lower visual impact
• Easier to fit into urban environment, requiring less space to mount
Cons
• Installation may be physically difficult
• Less likely to match local streetscape, leading to acceptance issues
• Higher capital costs
Cons
• High sided vehicles obscure detection
• Skewed viewing point reduces read quality
• Risk of Lower read rates (say 92-95%)
• Less effective in capturing motorcycle rear plates
Gantry infrastructure is more difficult to fit into local streetscapes and requires additional space to
physically mount, as well as being more expensive to build and maintain. However it is also enhances
detection rates (including motorcycles) and enables improved technical capabilities and greater
flexibility, including the ability to move to OBU-based technology.
Installation of gantries may be physically difficult due to the space requirements for the gantries
themselves, given limited space on some roadsides and around parts of the motorways, particularly
on/off-ramps. There are also signage requirements which have to be met, which limit how close
together gantries can be placed. The physical size of the gantries, and the fact that they go right over
the monitored lanes mean that the visual impact is significant compared to side-mounted poles. This
will be a greater concern for the Cordon charging scheme than the Motorway charging scheme. The
vast majority of open road motorway charging schemes use gantries for equipment mounting.

Part B.1. Vehicle Detection and Identification Technology 50
Overhead camera mounting improves number-plate reading and also makes it simpler to operate with
cameras in both directions reading front and back plates, thereby improving read rates, although the
mounting points need to be chosen carefully. The use of cameras facing both ways enables capture
of both trucks (whose rear plates can be dirty or obscured) so front plate capture is preferred, and
motorcycles (which lack front plates). Gantries therefore provide a better mounting solution in terms of
read rates. Many factors such as road layout, opportunities for obscuration, lighting, plate quality and
back office manual checking approach affect the plates read. Read rate may be of the order of 96-
98% read rate if the cameras are mounted overhead; or 90-96% if the cameras are mounted at the
side of the road.
In addition to improved ANPR read rates, gantries also can be used to mount tag readers for DSRC
or RFID solutions, and are required for the latter technology. This increases the long-term flexibility of
the gantry infrastructure compared to side-mounted poles.
However these operational advantages for gantries come at the price of increased amenity costs and
higher capital costs.
Some of these costs can be mitigated if instead of having detection points on access and exit ramps,
detection equipment is placed across the main motorway carriageway. If not every section of
motorway between intersections has a gantry, it would mean the scheme would not be a “closed”
system, but could have the following benefits:
1. Significantly fewer detection sites – a high level survey of the motorway suggest there may be
56-68 sections of motorway that require a gantry – compared with ~190 access and exit
points, subject to how the majority of the traffic is captured.
2. Better detection rates as equipment would be mounted directly over a lane – as for Northern
Gateway.
However, using gantries across the whole carriageway also has some disadvantages:
1. Spanning the whole carriageway in a high speed environment requires more robust gantries
at significantly greater unit cost than for ramps, potentially a multiple of $100k per gantry.
2. The maintenance of the equipment on the gantries requires engineer access, potentially
through a service road – at greater cost.
3. The charging system may not be “closed” if not all motorway sections have a charging gantry;
drivers may therefore have the option of avoiding some motorway sections with gantries. This
could increase the vehicle traffic on minor roads as drivers divert. Note the estimated 56-68
sites would involve gantries on every section
4. For an “instance” based charging scheme there would need to be some protocols agreed at
the back office such that vehicles passing under multiple gantries on the motorway are not
charged multiple times for a single trip on the motorway. This is easier to manage when only
access points are charged.
The decision whether to use gantries rather than side-mounted poles depends on whether the
improved read rates of the gantry-based infrastructure exceeds the greater capital and amenity costs.

Part B.1. Vehicle Detection and Identification Technology 51
The capital cost savings of side-mounted poles could be smaller than the revenue lost from leakage
due to lower read accuracy. We provide the following illustrative example based on a set of
assumptions:
• If capital savings of side mounting on access and exit ramps are in the order of say $1-12
million depending on the type of scheme (access charge or distance-based) being considered;
• Assuming 400,000 trips per day at a charge of $2 per trip, with charges levied 365 days p.a.,
revenue generated would be $292 million p.a.
Table 24 below summarises an illustration of the potential impact of revenue leakage on net annual
revenue:
Table 24: Illustration of Revenue Leakage
Read rate Annual Net Revenue ($000) Revenue Leakage ($000)
92% $268,640 $23,360
93% $271,560 $20,440
94% $274,480 $17,520
95% $277,400 $14,600
96% $280,320 $11,680
97% $283,240 $8,760
98% $286,160 $5,840
99% $289,080 $2,920
100% $292,000
As shown in Table 24 above:
• If the read rate was 92% (with side mounted cameras) but increased to 98% (gantries) then at
the extreme end, the revenue impact could be as much as $17.5m p.a.
• If the read rate was closer to 95% (100% side mounted) but increased to only 96% (gantries)
than a more modest revenue impact could be expected in the order of around $3m p.a.
• In reality it is likely to be somewhere between these two, say a 2-3% improvement which would
generate a revenue improvement in the order of $6m - $9m p.a.
At these levels of improvement, there would appear to be adequate justification for the additional
infrastructure cost, noting also that gantries enable effective charging of motorcycles. The key
downside is visual amenity, which on a motorway may not be a significant issue.
Where read rate is lower, additional back office processing is required to extract the good reads from
the poor quality data. This has an additional cost.

Part B.1. Vehicle Detection and Identification Technology 52
As an example, Toronto Electronic Toll Road (ETR) 407 in Canada:
• Uses gantries on access and exit ramps and applies a distance-based and time based charge.
Figure 14 illustrates a single lane access with gantries.
• Allows users to have an OBU or pay through camera based detection.
• It also uses full span gantries to provide a charge zoning function and secondary opportunity to
read vehicle plates or validate traffic already captured.
• Camera read rate is not published but is likely to be of the order of 98-99% per vehicle
passage.
It applies two types of charge for video detection:
• A distance based charge depending on the entry and exit points – requiring captures at each
point
• A flat rate access charge if the systems have only detected an access or exit event but cannot
calculate a distance charge.
Figure 14: ETR407 – Dundas Street Access
Source: Google StreetView
A recent presentation on ETR 407 indicated that through a set of refinements “unbillable” trips
reduced from 3.8% to 2.4% over 2007-2013 through detection technology refinements.
This type of tailoring of detection rates and charge structure can also be applied to an Auckland
Motorway scheme to refine the overall revenue.

Part B.1. Vehicle Detection and Identification Technology 53
Annex F – Entry or Exit Charging on Motorways
Feasibility of a Charge on Exit
An option being considered for motorway charging is whether to:
• Charge on entry to the motorway system – an access charge. This is the base proposal for a
charging scheme and would seem logical given that the motorways are the most congested
routes during peak hours; or
• Apply a charge on exit – effectively a charge for accessing local roads.
We have not modelled the impacts of charging on exit, but following a high level review, we consider
a charge on entry is likely to be more practical for the following reasons:
• Driver understanding and resulting behaviour
• Potential traffic impacts on the motorway of an exit charge
• Impact on motorway junctions just outside the charged area
• Infrastructure scale and costs.
We examine each of these points below. An option based on charging at motorway exits would need
each of these points to be assessed in further detail.
Driver understanding
Drivers will need to be aware of the cost they incur as they decide to exit, so will need signs warning
them of this well before they exit – additional signage costs. If any form of time based pricing is used,
the signs will need to be variable – for example a charge structure with four time bands charged at $3,
$2, $1 and $0 would need to be thought through carefully. There would be extra capital expenditure
and operating costs on the variable displays and their management.
The applicable charge for a timed exit events may be affected if vehicles are delayed in exiting the
motorway; we may need to operate a “shoulder period” at charge thresholds where vehicles subject to
a higher charge level are actually charged a lower amount to make up for traffic delays preventing
them from exiting at the time “they had intended”. Say for example at busy time, it takes 3-5 minutes
to queue at an exit ramp, to get of the motorway, then the shoulder period may need to be that
long. If accidents or diversions on the local road network delay exit from the motorway then similar
issues will apply and driver may want to be charged the lesser amount. This could all generate large
volumes of customer queries and correspondence, particularly if we have itemised bills with each exit
event and timestamp recorded, which the customer can subsequently challenge.

Part B.1. Vehicle Detection and Identification Technology 54
Potential Traffic Impacts on the Motorway
As drivers will be more aware of the cost of exiting, close to a price transition point, they may be
tempted to:
• Delay their exit awaiting the cost going down and continue on the motorway to a later junction.
• Drive off the motorway faster as they anticipate the cost increasing – maybe accelerating
towards the detection point to beat the price rise – with potential safety impacts.
This may generate more disruptive motorway traffic flow as drivers slow down, speed up and change
their minds, and should be modelled with a real-time traffic flow tool (like Transyt or Vissim). Such
disruptive vehicle flow may increase emissions from vehicles.
Strategically, the main congestion is currently on the motorways during peak hours. It is not clear
what the benefits and impacts of an exit charge would be.
Impact on motorway junctions just outside the charged area
There is a risk that vehicles may avoid the final charged exit and continue on to the next intersection
just outside the charged area to avoid the exit charge, and then turn back towards their intended
destination, increasing traffic at these first uncharged junctions.
Technology Infrastructure
Regarding the technology there are some additional infrastructure impacts.
At exits, we don’t have the benefit of the ramp metering at entry points, so vehicles may be moving
faster and there may be more instances of multiple lanes at exit ramps.
We may need more cameras and wider ramp gantry structures at exit locations where there are 2 or
more exit lanes:
1. a vehicle may straddle the lanes as it exits so processing may need to consider input from
multiple cameras
2. we may have overlapping camera fields of view, or require cameras to have a wider field of
view (7-8m instead of 3.5-4m) – less products and therefore less supply competition
Depending on the layout of each ramp we may not always be able to locate front plate reading
cameras – we may need to add some rear facing cameras also
This means the design will be more dependent on a survey.