audhesh paswan, ph.d. determining the sampling plan audhesh paswan, ph.d. university of north texas
TRANSCRIPT

Audhesh Paswan, Ph.D.
Determining the Sampling Plan
Audhesh Paswan, Ph.D.
University of North Texas

Audhesh Paswan, Ph.D.
Basic Concepts in Samples Population - the entire group under study as
specified by the objectives of the research project.
Sample - a subset of the population that should represent that entire group.
Sample unit - the basic level of investigation (e.g., household, individual).
Census - an accounting of the complete population.

Audhesh Paswan, Ph.D.
Basic Concepts in Sampling
Sampling error - error in a survey that occurs because a sample is used (caused by two factors).• The method of sample selection• The size of the sample
Sample frame - a list of the population of interest. Sample frame error - the degree to which a
sample frame fails to account for all of the population.

Audhesh Paswan, Ph.D.
Examples of sample frame errors
Phone book Yellow pages Any incomplete population lists

Audhesh Paswan, Ph.D.
Why sample?
A sample is almost always more desirable than a census
Population size and expense. Cannot analyze the huge amount of
data generated by a census.

Audhesh Paswan, Ph.D.
Basic Sampling Methods
Probability samples - members of the population have a known chance (I.e., probability) of being selected into the sample.
Nonprobability samples - the chances (I.e., probabilities) of selecting members from the population of interest into the sample are unknown.

Audhesh Paswan, Ph.D.
Probability Methods - Simple Random Sampling
Probability is known and equal for all members of the population.P(selection)=(sample size)/(population
size) The "Blind Draw" Method The Table of Random Numbers
Method

Audhesh Paswan, Ph.D.
Advantages and Disadvantages
Advantages• Derives unbiased estimates• Valid representation of the population
Disadvantages• Must pre-designate each population
member.• May be difficult to obtain a complete listing.• May be too cumbersome

Audhesh Paswan, Ph.D.
Systematic Sampling One of most prevalent types used Advantage: "economic efficiency" (i.e., quick
and easy). It employs a random starting point Every kth element in the population is designated
for inclusion in the sample (after a random start). Create a sample that is almost identical in
quality to simple random sampling.

Audhesh Paswan, Ph.D.
Systematic Sample
Example 1: Sample the population of phone customers in Denton by taking every 10th number in the phone book. (Be sure to start randomly on one of the first 10 numbers.)
Example 2: Sample every 5th customer
Skip interval = (population list size)/(sample size)

Audhesh Paswan, Ph.D.
How to Take a Systematic Sample
Step 1: Identify a listing of the population that contains an acceptable level of sample frame error.
Step 2: Compute the skip interval.
Step 3: Using random number(s), determine a starting position.
Step 4: Apply the skip interval.
Step 5: Treat the list as "circular."

Audhesh Paswan, Ph.D.
Cluster Sampling
Population is divided into subgroups (cluster)
Each cluster represents the entire population.
Must identify clusters that are identical to the population and to each other.
The parent population is divided into mutually exclusive and exhaustive subsets.

Audhesh Paswan, Ph.D.
Cluster Sampling
Subgroups should be heterogeneous within and
homogeneous between. (i.e., Subsets should
each look representative of the total population.)
Advantages: less cost to obtain a sample; good
for personal interviews (proximity)
Limitations: difficult to find subsets that truly
meet the criteria mentioned above; lower
statistical efficiency (higher error)

Audhesh Paswan, Ph.D.
Area Sampling as a Form of Cluster Sampling
Population subdivided into areas (e.g., cities or
neighborhoods)
One-step approach - one area is selected
randomly; perform a census of the cluster
Two-step approach
• Step 1: Select a random sample of clusters.
• Step 2: Randomly select individuals within the
clusters.

Audhesh Paswan, Ph.D.
How to Take an Area Sampling Using Subdivisions
Step 1: Determine the geographic area to be surveyed, and identify its subdivisions. Each subdivision should be highly similar to all others.
Step 2: Decide on the use of one-step or two-step cluster sampling.
Step 3: Using random numbers, select the subdivisions to be sampled (Assuming two-step).
Step 4: Using some probability method of sample selection, select the members of each chosen subdivision to be included in the sample.

Audhesh Paswan, Ph.D.
Stratified Sampling Separates the population into different subgroups
and then samples all of the subgroups. Does not assume the population has a "normal"
distribution. Addresses "skewed" distribution problems. Weighted mean
Meanpopulation = (meanA)(proportionA)+ (meanB)(proportionB)

Audhesh Paswan, Ph.D.
Stratified Sample
A probability sample distinguished by a two-step procedure:1 Divide the population into mutually exclusive and
collectively exhaustive subsets.2 Take a simple random sample of elements from
each subset (independently). The subsets are called “strata”. Each population member can be assigned to
one and only one stratum.

Audhesh Paswan, Ph.D.
Stratified Sampling
Advantages:• Produces a more concentrated distribution of
estimates (leads to more precise statistics and smaller sampling error); fewer possible sample means that deviate widely from the true population mean.
• Can reduce variation within each stratum, which reduces the error of the estimate
• Guarantees representation of certain subgroups of interest.
Limitation: cost of sampling several strata

Audhesh Paswan, Ph.D.
Bases for Stratification
Strata should be divided by a known characteristic
that is expected to be related to the characteristic of
interest.
Example: If we are interested in magazine
readership, we can stratify on the basis of education
level. This should result in less variation within each
stratum.
The strata should be homogeneous within and
heterogeneous between groups.

Audhesh Paswan, Ph.D.
How to Take a Stratified Sample
Step 1: Be assured that the population's distribution for some key
factor is not bell-shaped and that separate populations exist.
Step 2: Use this factor or some surrogate variable to divide the
population into strata consistent with the separate sub-populations
identified.
Step 3: Select a probability sample from each stratum
Step 4: Examine each stratum for managerially relevant differences.
Step 5: If strata sample sizes are not proportionate to the stratum
sizes in the population, use the weighted mean formula to
estimate the population value(s).

Audhesh Paswan, Ph.D.
Nonprobability Samples
Convenience samples - drawn at the convenience of the interviewer.
Judgement samples - requires and "educated guess" as to who should represent the population.
Referral samples - a.k.a. "snowball samples" Quota samples - a specified quota for various
types of individuals to be interviewed is established.

Audhesh Paswan, Ph.D.
Stratified versus Quota Sample
Similarities:• Population is divided into segments (strata).• Elements are selected from each segment.
Key Difference:• Stratified sampling uses probability methods.• Quota samples are based on a researcher’s
judgment.• Therefore, stratified sampling allows the
establishment of the sampling distribution, confidence intervals and statistical tests.

Audhesh Paswan, Ph.D.
Developing a Sample Plan
Step 1: Define the relevant population
Step 2: Obtain sample frame
Step 3: Design the sample plan
Step 4: Access the population
Step 5: Draw the sample
Step 6: Validate the sample
Step 7: Resample, if necessary.

Audhesh Paswan, Ph.D.
Determining Sample Size

Audhesh Paswan, Ph.D.
Sample Accuracy
How close the sample’s profile is to the true population’s profile
Sample size is not related to representativeness,
Sample size is related to accuracy

Audhesh Paswan, Ph.D.
Methods of Determining Sample Size
Compromise between what is theoretically perfect and what is practically feasible.
Remember, the larger the sample size, the more costly the research.
Why sample one more person than necessary?

Audhesh Paswan, Ph.D.
Methods of Determining Sample Size
Arbitrary• Rule of Thumb (ex. A sample should be at
least 5% of the population to be accurate• Not efficient or economical
Conventional• Follows that there is some “convention” or
number believed to be the right size• Easy to apply, but can end up with too small or
too large of a sample

Audhesh Paswan, Ph.D.
Methods of Determining Sample Size
Cost Basis• based on budgetary constraints
Statistical Analysis• certain statistical techniques require certain
number of respondents Confidence Interval
• theoretically the most correct method

Audhesh Paswan, Ph.D.
Notion of Variability
Great variabilit
y
Little variability
Mean

Audhesh Paswan, Ph.D.
Notion of Variability
Standard Deviation• approximates the average distance away
from the mean for all respondents to a specific question
• indicates amount of variability in sample• ex. compare a standard deviation of 500
and 1000, which exhibits more variability?

Audhesh Paswan, Ph.D.
Measures of Variability
Standard Deviation: indicates the degree of variation or diversity in the values in such as way as to be translatable into a normal curve distribution
Variance = (x-x)2/ (n-1) With a normal curve, the midpoint (apex) of
the curve is also the mean and exactly 50% of the distribution lies on either side of the mean.
i

Audhesh Paswan, Ph.D.
Normal Curve and Standard Deviation
Number ofstandard
deviationsfrom the
mean
Percent ofarea underthe curve
Percent ofarea to theright or left
+/- 1.00 st dev 68% 16%
+/- 1.64 st dev 90% 5%
+/- 1.96 st dev 95% 2.5%
+/- 2.58 st dev 99% 0.5%

Audhesh Paswan, Ph.D.
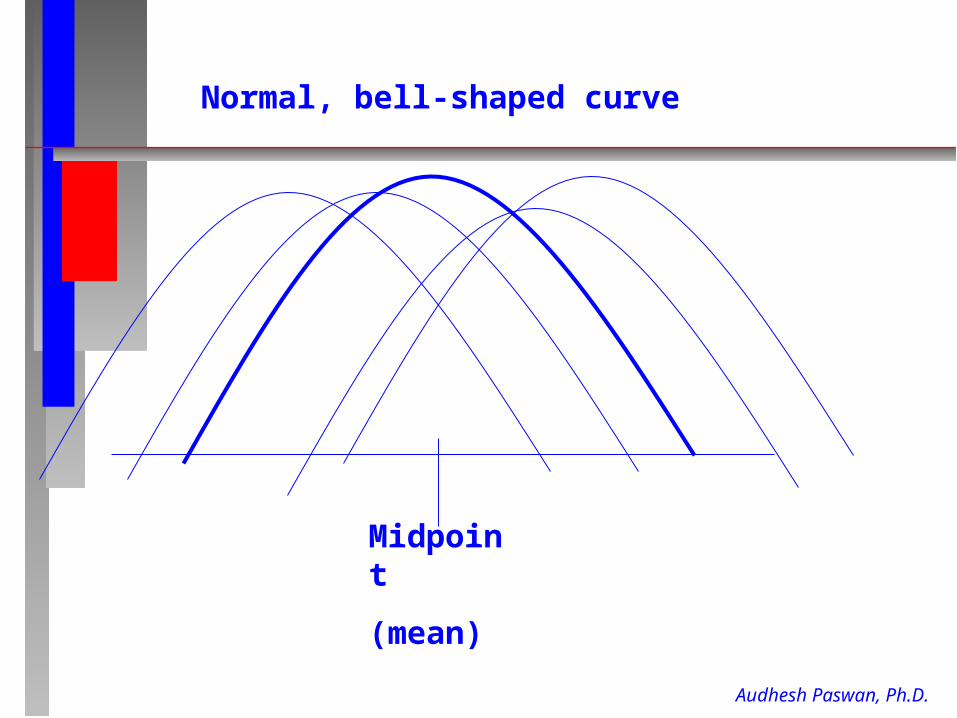
Notion of Sampling Distribution
The sampling distribution refers to what would be found if the researcher could take many, many independent samples
The means for all of the samples should align themselves in a normal bell-shaped curve
Therefore, it is a high probability that any given sample result will be close to but not exactly to the population mean.
Audhesh Paswan, Ph.D.
Midpoint
(mean)
Normal, bell-shaped curve

Audhesh Paswan, Ph.D.
Notion of Confidence Interval
A confidence interval defines endpoints based on knowledge of the area under a bell-shaped curve.
Normal curve• 1.96 times the standard deviation theoretically
defines 95% of the population• 2.58 times the standard deviation theoretically
defines 99% of the population

Audhesh Paswan, Ph.D.
Notion of Confidence Interval
Example• Mean = 12,000 miles• Standard Deviation = 3000 miles
We are confident that 95% of the respondents’ answers fall between 6,120 and 17,880 miles 12,000 + (1.96 * 3000) = 17,880 12,000 - (1.96 * 3000) = 6.120

Audhesh Paswan, Ph.D.
Notion of Standard Error of a Mean Standard error is an indication of how far away
from the true population value a typical sample result is expected to fall.
Formula• S X = s / (square root of n)
• S p = Square root of {(p*q)/ n}– where S p is the standard error of the percentage
– p = % found in the sample and q = (100-p)
– S X is the standard error of the mean
– s = standard deviation of the sample
– n = sample size

Audhesh Paswan, Ph.D.
Computing Sample Size Using The Confidence Interval Approach
To compute sample size, three factors need to be considered: • amount of variability believed to be in the
population• desired accuracy• level of confidence required in your
estimates of the population values

Audhesh Paswan, Ph.D.
Determining Sample Size Using a Mean
Formula: n = (pqz2)/e2
Formula: n = (s2z2)/e2
Where• n = sample size• z = level of confidence (indicated by the number of
standard errors associated with it)• s = variability indicated by an estimated standard
deviation• p = estimated variability in the population• q = (100-p)• e = acceptable error in the sample estimate of the
population

Audhesh Paswan, Ph.D.
Determining Sample Size Using a Mean: An Example
95% level of confidence (1.96) Standard deviation of 100 (from
previous studies) Desired precision is 10 (+ or -) Therefore n = 384
• (1002 * 1.962) / 102

Audhesh Paswan, Ph.D.
Practical Considerations in Sample Size Determination
How to estimate variability in the population• prior research• experience• intuition
How to determine amount of precision desired• small samples are less accurate• how much error can you live with?

Audhesh Paswan, Ph.D.
Practical Considerations in Sample Size Determination
How to calculate the level of confidence desired• risk• normally use either 95% or 99%

Audhesh Paswan, Ph.D.
Determining Sample Size
Higher n (sample size) needed when:• the standard error of the estimate is high
(population has more variability in the sampling distribution of the test statistic)
• higher precision (low degree of error) is needed (i.e., it is important to have a very precise estimate)
• higher level of confidence is required Constraints: cost and access

Audhesh Paswan, Ph.D.
Notes About Sample Size
Population size does not determine sample size.
What most directly affects sample size is the variability of the characteristic in the population.• Example: if all population elements have
the same value of a characteristic, then we only need a sample of one!