audio engineering society convention paper 8616 · skovenborg loudness range – design and...
TRANSCRIPT

Audio Engineering Society
Convention Paper 8616Presented at the 132nd Convention
2012 April 26–29 Budapest, Hungary
This paper was peer-reviewed as a complete manuscript for presentation at this Convention. Additional papers may be obtained by sending request and remittance to Audio Engineering Society, 60 East 42nd Street, New York, New York 10165-2520, USA; also see www.aes.org. All rights reserved. Reproduction of this paper, or any portion thereof, is not permitted without direct permission from the Journal of the Audio Engineering Society.
Loudness Range (LRA) – Design and Evaluation
Esben Skovenborg1
1 TC Electronic A/S, Risskov, DK-8240, Denmark [email protected]
ABSTRACT
Loudness Range (LRA) is a measure of the variation of loudness on a macroscopic time-scale. Essentially, LRA is the difference in loudness level between the soft and loud parts of a programme. In 2009 the algorithm for computing LRA was published by TC Electronic, and was then included in the EBU R-128 recommendation for loudness normalisation. This paper describes the design choices underlying of the LRA algorithm. For each of its parameters the interval of optimal values is presented, supported by analyses of audio examples. Consequences of setting parameter values outside these intervals are also described. Although the LRA has already proven its usefulness in practice, this paper provides background knowledge that could support further refinement and standardisation of the LRA measure.
1. INTRODUCTION
Loudness Range (LRA) is a statistical measure of the difference in loudness level between the soft and loud parts of a programme. This paper describes the design choices underlying the LRA and provides intervals of optimal values for the parameters of the method. The 10 design criteria which guided the development of the LRA measure are presented and provide the context for examining the properties of the LRA algorithm.
The Loudness Range algorithm was first published in 2009 in connection with the work leading to the EBU R128 Recommendation [1]. Since then a need has arisen for consolidating the research, background information and experience underlying the LRA algorithm. This paper intends to address that need.
1.1. Loudness Normalization and The Loudness War
The extensive problems caused by the “louder is better” approach to producing music and broadcast programmes have been the topic of much debate in the past decade [2, 3, 4, 5, 6, 7]; The Loudness War has become a well-established term. Although the reasons why this war still rages on appear complex, one crucial point stands out: The key to disarming the loudness war is the paradigm change from peak-level normalisation to loudness normalization of programmes – that is, the loudness revolution [8, 9]. The focus of this paper, however, is not loudness normalization per se. In this context, the role of the Loudness Range measure is to complement the primary measures of loudness level to be used for programme normalisation.

Skovenborg Loudness Range – Design and Evaluation
AES 132nd Convention, Budapest, Hungary, 2012 April 26–29 Page 2 of 12
1.2. LRA History
In 2006 ITU-R published the initial version of the Recommendation BS.1770: Algorithms to measure audio programme loudness and true-peak audio level [10], specifying a method for measuring the loudness level of broadcast programmes. The method, which is simply yet effective [11], provided the basis for tackling the widespread problems with loudness normalisation – and lack of such – in broadcast programmes.
During 2007, TC Electronic conducted research into different measures of perceptual dynamic range on different time-scales, based on time-varying loudness measurement. One of the outcomes of this research was the loudness descriptor called Consistency, which was first released in the LM5D Loudness Meter in 2008 [12]. Skovenborg & Lund presented the two loudness descriptors Center of Gravity and Consistency in [13]. Note that the Consistency descriptor is equivalent to Loudness Range, as LRA ≈ –2 · Consistency.
In 2008 the European Broadcasting Union (EBU) launched the P/LOUD project group, which was concerned with making the BS.1770 more operational in broadcast applications. Throughout 2009 the P/LOUD gained momentum, and had a number of pioneering European broadcasters as well as several manufacturers of loudness meters/processors as active members, not to mention a hyperactive mailing-list [14].
The P/LOUD group was interested in the loudness descriptors of the LM5D, and consequently TC Electronic agreed to contribute with the algorithms. Hence, in May 2009 TC submitted a full disclosure of the Loudness Range algorithm to the EBU [15].
By mid 2010, EBU published its Technical Document 3342 [16] as part of EBU Technical Recommendation R128: Loudness normalisation and permitted maximum level of audio signals [1], with the LRA as a mandatory part of the EBU Mode requirement set for loudness meters. At the time of writing 45 manufacturers have products that are reportedly EBU Mode compliant [17].
In September 2011 the EBU submitted a proposal for standardisation of the LRA measure to ITU-R, WP6C. At subsequent ITU discussions requests have reportedly been made for further background information concerning the design and parameters of the LRA measure; hopefully this paper will contribute with that.
2. DESIGN CRITERIA
The following design criteria guided the development of the Loudness Range (LRA) measure:
C1. The intuitive definition of LRA: A programme might call for the viewer or listener to turn down the volume during loud passages of the programme, or turn up the volume for the relatively soft passages. Such situations should be objectively detectable by means of an LRA measurement for the programme being too high. On the other hand, if the soft passages of a programme would not seem to be soft enough and the loud passages not loud enough, then this situation should be objectively detectable by means of an LRA for the programme being too low.
C2. In order to measure the somewhat macrodynamic variations outlined in C1, the LRA measure should abstract from the microdynamic variations (e.g. transient information).
C3. The LRA should be a perceptual measure, in the sense that the LRA algorithm should measure changes in loudness variation which are perceivable – also by untrained listeners.
C4. The LRA measure should be statistical, that is, measure overall properties of the programme; in particular, the LRA of an entire programme should not be determined by a single peak value.
C5. LRA should be designed with a suitable precision vs. robustness trade-off, that is, as sensitive as possible while still being robust against background noise, fade-outs, lead-in silence, etc.
C6. LRA should be compatible with ‘all’ genres of programmes – different contents, different durations, different production styles, etc.
C7. LRA should be suitable for use in broadcast applications, such as assessing the dynamics processing requirements for different delivery platforms.
C8. The LRA should employ a measurement unit that is easy to understand; intuitively, an audio engineer might expect the “distance” between something loud and something soft to be expressed on a dB scale or equivalent.

Skovenborg Loudness Range – Design and Evaluation
AES 132nd Convention, Budapest, Hungary, 2012 April 26–29 Page 3 of 12
C9. The LRA should be based on the standardized measure of loudness level, such as defined in ITU-R BS.1770 [18].
C10. The LRA should be independent of absolute level; if a “normalisation-gain” is applied to a programme the measured LRA should be unaffected.
We first presented most of the above criteria in [13], albeit less formally.
2.1. Overview of LRA algorithm
The computation of Loudness Range (LRA) is based on the statistical distribution of measured loudness. Thus, a short but very loud event would not affect the LRA of a longer segment. Similarly the fade-out at the end of a music track, for example, would not increase LRA noticeably. The range of the distribution of loudness levels is determined by estimating the difference between a low and a high percentile of the distribution. LRA furthermore employs a cascaded gating method. Certain types of programme may be, overall, very consistent in loudness, but have some sections with very low loudness, for example only containing background noise. If LRA did not use the gating, such programmes would (incorrectly) get quite a high LRA measurement, due to the relatively large difference in loudness between the regions of background noise and those of normal (foreground) loudness. [16]
2.2. Why not Crest Factor
The crest factor is a measure of the peak-to-average ratio of a signal [19], or in dB, the peak level minus the RMS level. Although the crest factor is traditionally used to characterise periodic or noise signals, it has also been used to measure non-stationary signals such as music.
From an LRA point-of-view the crest factor fails (at least) the LRA design criteria: C2, C3, and C4. The crest factor is neither robust nor perceptual, in the sense defined above, because the peak amplitude of a given signal may change considerably (e.g. by processing with a limiter or certain codecs) even though that change may barely be audible.
The Pleasurize Music Foundation is a commendable initiative trying to battle hyper-compression in current music productions. They use the TT Dynamic Range
Meter [20] to measure the “dynamic range” of music tracks. This measure is in fact a variant of the crest factor which discards the bottom 80% of the RMS values, thereby focussing on the highest levels where hyper-compression and limiting is most evident. So this “dynamic range” measure serves a quite different purpose than the LRA.
Traditionally, terms such as crest factor and dynamic range correspond to measures of technical signal characteristics. The crest factor of a signal determines how much headroom the signal needs. That information is crucial in applications where the programmes or tracks are peak-normalised, such as typical CD productions [6], because a lower crest factor would generally correspond to a higher loudness level. However, as loudness normalisation replaces peak normalisation, the crest factor becomes less relevant. Furthermore, with the introduction of ITU-R BS.1770 and BS.1771 both the programme loudness and true-peak levels have become standard measures in broadcast [21]. Hence, a third measure basically consisting of subtracting the loudness level from the peak level would be redundant.
3. QUALITATIVE ANALYSIS
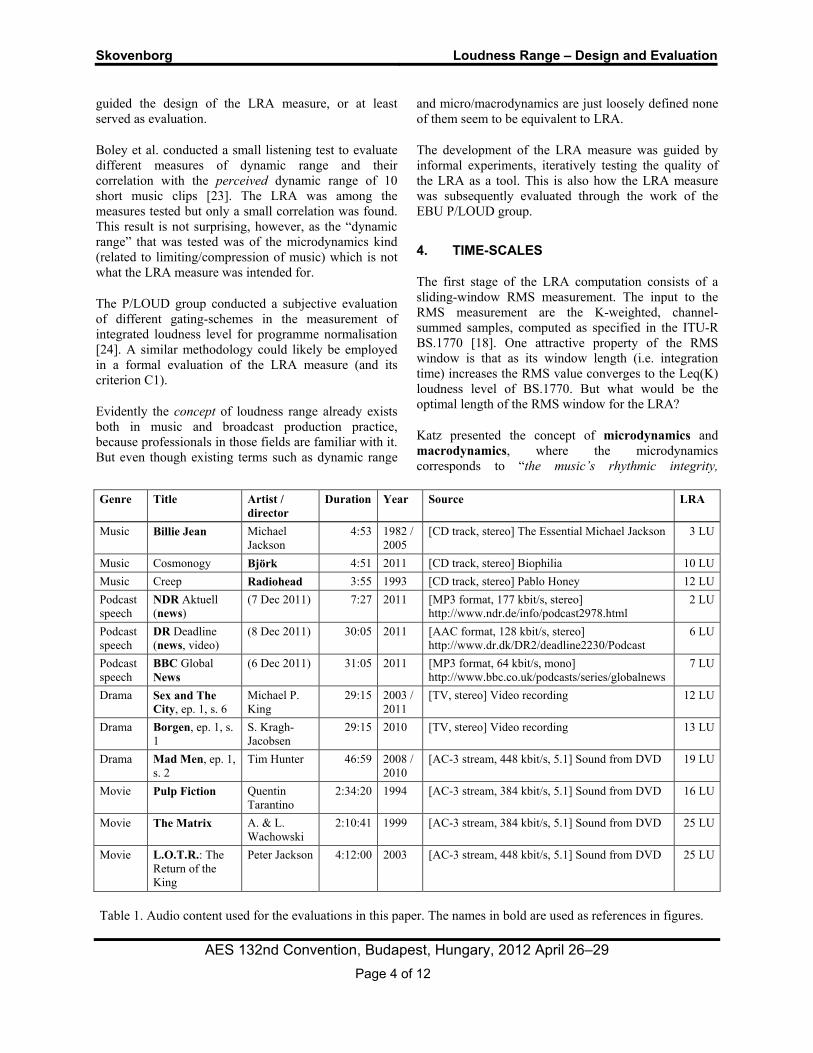
The following sections examine each element of the LRA algorithm, and describe what values of its parameters would yield an LRA measure which is consistent with the design criteria (above). Table 1 lists the 12 example programmes that are used for the analysis.
Whereas some of the LRA design criteria could be evaluated by technical means, especially criterion C1 calls for a listening experiment. Such an experiment might involve the subject listening via a limited reproduction system (e.g. built-in speakers of a TV), and/or with a noisy listening environment. We note that the distributed listening experiment conducted within the NoTube project [22] involves exactly those variables – but NoTube is testing the preferred LRA rather than the LRA itself. The LRA measure is implicitly validated in such experiments, however, as a successful means of controlling an independent variable.
Unlike loudness, the loudness range (as defined in C1) is not an established concept in psychoacoustics. Therefore “subjective” data from listening experiments, or even experimental methodology, is not readily available. Had such data been available it might have
Skovenborg Loudness Range – Design and Evaluation
AES 132nd Convention, Budapest, Hungary, 2012 April 26–29 Page 4 of 12
guided the design of the LRA measure, or at least served as evaluation.
Boley et al. conducted a small listening test to evaluate different measures of dynamic range and their correlation with the perceived dynamic range of 10 short music clips [23]. The LRA was among the measures tested but only a small correlation was found. This result is not surprising, however, as the “dynamic range” that was tested was of the microdynamics kind (related to limiting/compression of music) which is not what the LRA measure was intended for.
The P/LOUD group conducted a subjective evaluation of different gating-schemes in the measurement of integrated loudness level for programme normalisation [24]. A similar methodology could likely be employed in a formal evaluation of the LRA measure (and its criterion C1).
Evidently the concept of loudness range already exists both in music and broadcast production practice, because professionals in those fields are familiar with it. But even though existing terms such as dynamic range
and micro/macrodynamics are just loosely defined none of them seem to be equivalent to LRA.
The development of the LRA measure was guided by informal experiments, iteratively testing the quality of the LRA as a tool. This is also how the LRA measure was subsequently evaluated through the work of the EBU P/LOUD group.
4. TIME-SCALES
The first stage of the LRA computation consists of a sliding-window RMS measurement. The input to the RMS measurement are the K-weighted, channel-summed samples, computed as specified in the ITU-R BS.1770 [18]. One attractive property of the RMS window is that as its window length (i.e. integration time) increases the RMS value converges to the Leq(K) loudness level of BS.1770. But what would be the optimal length of the RMS window for the LRA?
Katz presented the concept of microdynamics and macrodynamics, where the microdynamics corresponds to “the music’s rhythmic integrity,
Genre Title Artist / director
Duration Year Source LRA
Music Billie Jean Michael Jackson
4:53 1982 / 2005
[CD track, stereo] The Essential Michael Jackson 3 LU
Music Cosmonogy Björk 4:51 2011 [CD track, stereo] Biophilia 10 LUMusic Creep Radiohead 3:55 1993 [CD track, stereo] Pablo Honey 12 LUPodcast speech
NDR Aktuell (news)
(7 Dec 2011) 7:27 2011 [MP3 format, 177 kbit/s, stereo] http://www.ndr.de/info/podcast2978.html
2 LU
Podcast speech
DR Deadline (news, video)
(8 Dec 2011) 30:05 2011 [AAC format, 128 kbit/s, stereo] http://www.dr.dk/DR2/deadline2230/Podcast
6 LU
Podcast speech
BBC Global News
(6 Dec 2011) 31:05 2011 [MP3 format, 64 kbit/s, mono] http://www.bbc.co.uk/podcasts/series/globalnews
7 LU
Drama Sex and The City, ep. 1, s. 6
Michael P. King
29:15 2003 / 2011
[TV, stereo] Video recording 12 LU
Drama Borgen, ep. 1, s. 1
S. Kragh-Jacobsen
29:15 2010 [TV, stereo] Video recording 13 LU
Drama Mad Men, ep. 1, s. 2
Tim Hunter 46:59 2008 / 2010
[AC-3 stream, 448 kbit/s, 5.1] Sound from DVD 19 LU
Movie Pulp Fiction Quentin Tarantino
2:34:20 1994 [AC-3 stream, 384 kbit/s, 5.1] Sound from DVD 16 LU
Movie The Matrix A. & L. Wachowski
2:10:41 1999 [AC-3 stream, 384 kbit/s, 5.1] Sound from DVD 25 LU
Movie L.O.T.R.: The Return of the King
Peter Jackson 4:12:00 2003 [AC-3 stream, 448 kbit/s, 5.1] Sound from DVD 25 LU
Table 1. Audio content used for the evaluations in this paper. The names in bold are used as references in figures.

Skovenborg Loudness Range – Design and Evaluation
AES 132nd Convention, Budapest, Hungary, 2012 April 26–29 Page 5 of 12
expression or bounce”, whereas macrodynamics is “the loudness differences between sections of a song” [25]. Although both micro- and macro–dynamics are important properties of broadcast programmes, the design criteria of the LRA points towards macro-dynamics – however in broadcast it might be differences between scenes of a movie rather than sections of a song.
The notion of time-scales is relevant here. We previously described that different loudness information is available at different time-scales [26]. To measure transients and microdynamics a time-scale of (say) 50 ms might be appropriate. On the other hand, if we considered a dynamics processor which could use time-constants in the range 100 ms to 1 s, its effect might be most evident on a 0.5 s or 1 s time-scale. In EBU Mode loudness meters two RMS window lengths are standardised: 0.4 s, called Momentary loudness, and 3.0 s, called Short-term loudness [27].
Figure 1. NDR news podcast
Consider the NDR news podcast, 20 s of which have been analysed using 5 different RMS window lengths between 0.1 s and 10 s (fig. 1). On the shortest time-scale (top graph) the individual words and the modulation inherent in speech are visible in the envelope plot. However, the overall speech segment sounds very homogeneous, so from a Loudness Range point-of-view we would not want this segment to exhibit a large variation, meaning we could not use any of the window lengths shorter than 3 s, in this case.
Figure 2. Billie Jean by Michael Jackson
Fig. 2 shows a similar analysis of the first 8 measures of the song Billie Jean. The first 4 measures contain only drums and percussion, and on the next 4 measures the bass joins them. Even though this well-produced music clip sounds fairly (micro-)dynamic it also sounds quite even in loudness, with a slight increase in loudness when the bass enters.
Figure 3. Pulp Fiction: from 00:06:50 to 00:07:20
If we were interested in the musical dynamics, the 0.1 s or 0.4 s time-scales would seem most appropriate (see also [28]). For instance, the 0.1 s scale could determine the level-difference between the kick- and snare-drum beats, i.e. a sort of “punchyness” measure. But that is not the purpose of the LRA. In order to see the constant

Skovenborg Loudness Range – Design and Evaluation
AES 132nd Convention, Budapest, Hungary, 2012 April 26–29 Page 6 of 12
macrodynamic loudness that we hear, with a slight increase halfway through, we would use the 1 s or 3 s window lengths.
The third example (fig. 3) is a clip from the movie Pulp Fiction – relative loud music plays until halfway through the clip when it changes into a dialog. Both scenes sound relatively even in loudness, but the first scene is noticeably louder than the second. The 3 s time-scale seems ideal for measuring the magnitude of that macrodynamic change; the 1 s time-scale shows the same tendency but more noisily, and the 10 s time-scale blurs the change unnecessarily.
To summarize our findings:
• Interval for the RMS window length: [2, 3] s
• What if the RMS window size is too short? The relevant macro-dynamic variations might drown in micro-dynamic variations such as the modulations naturally inherent in speech and music.
• What if the RMS window size is too long? Some variations that LRA should measure might be blurred by the analysis window itself; large level-shifts would cause relatively long ramps.
5. GATING
The LRA measure employs a cascaded gating scheme which uses an absolute threshold of very low level, in combination with a relative threshold of higher, signal-dependent, level [29, 16]. The purpose of the relative-threshold gating is to gate out any periods of silence or background noise, using a method that is independent of any level-normalisation of the input signal. The lower edge of Loudness Range should not be defined by the noise floor, but should instead correspond to the weakest ‘real’ signal. The purpose of the absolute-threshold gate is to make the conversion from the relative threshold to an absolute level robust against longer periods of silence or low-level background noise. An example implementation of this gating scheme is provided in the Appendix.
When computing the LRA, the relative threshold is set to a certain level below the absolute-threshold gated, integrated loudness level. In fig. 4 the cumulative distribution of loudness levels are plotted, with levels relative to the “abs-gated” level of each programme. This plot illustrates the consequence of choosing
different values for the relative threshold, for 4 different yet characteristic programmes. For example, a relative threshold of -5 LU would seem to work well with the very homogeneous NDR news programme. But a -5 LU threshold would gate out the softer sections of the Radiohead song, thereby limiting the resulting LRA measurement. On the other hand, with a relative threshold of -40 LU the gate would have very little effect on even wide loudness range programmes such as the Lord of the Rings movie (“LOTR”, fig. 4).
• Interval for the relative-threshold of the gating: [-35, -20] LU
• What if the relative-threshold level is too low? Background noise or even the noise floor of the recording, which should have been gated out, would contribute to the loudness distribution of the programme; if sufficiently large proportion of the programme contains such noise then this would be regarded as the “lower edge” of the distribution and the resulting LRA value would be (considerably) larger than intended.
• What if the relative-threshold level is too high? Soft passages of a programme might be regarded as background noise and thus gated out; thereby the loudness distribution, from which the LRA is computed, would be narrower than expected, and the LRA value would be smaller than intended.
Figure 4. Cumulative distribution of loudness levels, relative to the absolute-gated integrated loudness level. A -25 LU relative threshold is shown as an example.

Skovenborg Loudness Range – Design and Evaluation
AES 132nd Convention, Budapest, Hungary, 2012 April 26–29 Page 7 of 12
The absolute threshold, employed by the gating scheme, should be set to a loudness level below which no relevant signals are generally found. The EBU R128 specifies a target loudness level of -23 LUFS1 [1], which corresponds roughly to the 0 LU in fig. 4. Thus, the -40 LU level in the plot would translate to -63 LUFS. Considering the distribution of even Lord of the Rings (the most macrodynamic of our examples) this level would seem a fairly conservative estimate of noise floors in general.
The signal-to-noise ratio (SNR) of professional analog tape recordings could reach about 80 dB in practical broadband applications, whereas the SNR of the compact cassette was between 50 and 70 dB, depending on the noise reduction system etc. [30]. This can provide a rough indication of the relative levels of typical ‘analog’ noise floors.
Note that the absolute-threshold gating is not strictly required for correct operation of the LRA algorithm, but is a safety precaution against situations like an operator measuring the LRA but “leaving the tape running”.
• Interval for the absolute-gating threshold: [-80, -60] LUFS
• What if the absolute-gating threshold level is too low? If the absolute threshold is below the noise floor of a recording then the absolute-threshold gating has no effect, and for example lead-in noise would cause the relative-threshold to be lower than intended.
• What if the absolute-gating threshold level is too high? More than just noise could be gated out by the absolute-threshold gate for wide loudness range programmes, in which case the basis for computing the relative-threshold would be a higher level than expected; this would lead to a relative-threshold which is (slightly) higher than intended.
6. BLOCK OVERLAP
The amount of overlap between consecutive analysis blocks is essentially the time resolution of the analysis. Note that the block overlap may be varied 1 LUFS = Loudness Units Full-Scale (same as LKFS). LU = Loudness Units, relative to the target level. Both LUFS and LU are equivalent to dB.
independently of the block length. Four different yet equivalent terms are commonly used to specify the block overlap (table 2).
Overlap percentage Overlap time Hop size Data rate
0% 0 sec 3 sec 0.333 Hz
50% 1.5 sec 1.5 sec 0.667 Hz
66.67% 2 sec 1 sec 1 Hz
75% 2.25 sec 0.75 sec 1.333 Hz
80% 2.4 sec 0.6 sec 1.667 Hz
Table 2. Four equivalent specifications of block overlap, for block length of 3 s.
A block overlap less than 0% seems unreasonable because some samples would then be discarded. An overlap which is not a fraction of the block length also seems questionable, as not all samples would be represented in equal proportions.
In 2010 the CRC investigated the effect of varying block length and overlap of the LRA measure [31]. One conclusion from their study was that if a minimum block overlap of 66% was used then the possible deviations caused by blocking effects, in measurements of a set of sound files, would be less than 1 LU.
• Interval for the block overlap: [66.67, 75, 80] %
• What if the block overlap is too large? Computational resources might be spent with little or no benefit to the result.
• What if the block overlap is too small? The “phase” of the analysis blocks might affect the measurement of especially very short programmes.
7. PERCENTILES
The cascaded gating procedure eliminates the RMS blocks containing low-level signals, background noise, and silence. What remains are the loudness levels corresponding to the soft as well as loud sounds of the programme, and the LRA then needs to measure the range of levels they span. Due to the robustness and statistical requirements of LRA (criteria C4 and C5), the LRA could not simply use the difference between the highest and the lowest level of the ungated RMS blocks as the LRA.

Skovenborg Loudness Range – Design and Evaluation
AES 132nd Convention, Budapest, Hungary, 2012 April 26–29 Page 8 of 12
Fig. 5 shows the loudness level distributions of the 12 example programmes, after the cascaded gating was applied (with parameters absThresh = -70 LUFS, relThresh = -25 LU). It is evident from these characteristic examples that such loudness distributions do not in general belong to one of the common classes of statistical distributions (e.g. the normal distribution). The loudness distributions may be asymmetrical and even multimodal, such as “Radiohead” and “The Matrix” (fig. 5).
In non-parametric statistics percentiles (analogous to quartiles) are commonly employed to measure the width or ‘variance’ of such distributions. Thus, the LRA is defined as the difference between the estimates of a high and a low percentile of the distribution of loudness levels. [13, 29, 16]
When choosing the particular lower and upper percentiles several trade-offs must be considered. In fig. 5, the vertical red lines indicate the 1, 5, 95, and 99 percentiles of each distribution. The figure reveals that
several of the distributions have a relatively long left tail – even after the gating. (This confirms that using the difference between the maximum and minimum levels as LRA would have been a bad idea.) Such left tails may contain the fade-out of a music track or various noises which are somewhat louder than the noise floor of the recording.
Fig. 6 zooms in on the very top of the cumulative loudness distributions. This plot illustrates the trade-off in choosing the upper percentile, that is, how many LU’s worth are in the top 1%, 2%, 3% etc. of the programmes.
Typically, the right tails of the distributions are very short for music tracks because of the dynamic compression applied. For such distributions it would make little difference whether the maximum level or (say) the 98th percentile was used. But for the drama and movie productions the distributions show that the loudest sounds are rather atypical – so in this case a percentile below 100 would be a more robust choice of the upper percentile for the LRA.
Figure 5. Loudness level distribution of 4 genres × 3 programmes, after gating was applied.

Skovenborg Loudness Range – Design and Evaluation
AES 132nd Convention, Budapest, Hungary, 2012 April 26–29 Page 9 of 12
Pulp Fiction is an extreme example of a movie (fig. 6, lower half): Only 1% of the gated sound accounts for the movie’s maximum loudness levels and 8 LU down from that. A closer investigating reveals that the loudest of that 1% sound corresponds to the few shooting scenes in the movie – which are then noticeably louder than other “typically loud” sound.
Figure 6. Cumulative distributions (upper 8% shown) with levels relative to the maximum loudness level per
segment, after gating.
• Interval for the upper percentile: [95, 99] %
• What if the upper percentile is too high? A few (untypically) high loudness levels might dominate the LRA measurement of an entire programme.
• What if the upper percentile is too low? The LRA measure might be too insensitive to high loudness levels; for longer programmes the proportion above the upper percentile would correspond to a relatively long time (minutes).
The challenge in setting the lower percentile of the LRA measure consists in setting it above the “knee” of the lower tail of the distribution of narrow loudness range programmes (fig. 7, upper half), while not eating into the soft passages of wide loudness range programmes (fig. 7, lower half). With “Billie Jean” a lower percentile of 4% would be sufficient but with the 2 other songs using 6-8% might be better in order for their LRA
values to reflect that they sound like narrow/medium loudness range programmes (and not be too large).
A different trade-off to consider is what the different percentages of a programme mean in terms of absolute time. For example, 5% corresponds to 0.75 s, 9 s, 2.3 min, 6 min, for programme durations of 15 s, 3 min, 45 min, 2 hours, respectively.
Figure 7. Cumulative distributions (lower 12% shown) with levels relative to the minimum loudness level per
segment, after gating.
• Interval for the lower percentile: [4, 10] %
• What if the lower percentile is too high? The LRA of programmes which are very macro-dynamic might be limited (i.e. smaller than expected) because the softest passages were ignored.
• What if the lower percentile is too low? The LRA value of programmes with relatively ‘narrow’ macrodynamics might be considerably exaggerated (i.e. larger than expected) because, for example a long fade-out ended up above the lower percentile.
8. APPLICATIONS
In [13, 29] we described a number of applications of the LRA measure. The Practical guidelines for Production & Implementation of R128 [32] offers an extensive compilation of advice on how the LRA measure is used in practice, and how it complements the other measures

Skovenborg Loudness Range – Design and Evaluation
AES 132nd Convention, Budapest, Hungary, 2012 April 26–29 Page 10 of 12
standardised in R128. It is described how “it had to be ‘educated guesswork’ of experienced audio personnel to decide if a programme would fit into the loudness tolerance window of the intended audience”, but when using LRA to quantify the dynamics of a programme “the guesswork is over – at the end of the measurement period (usually the whole programme), a single number enables the mixer / operator to decide if further dynamic treatment is necessary.”
The guidelines emphasize that “it is impossible to define one maximum value of LRA for all broadcasters and all programmes.” A station’s maximum LRA for specific programming would depend both on the programme genre, on the distribution platform (mobile broadcasting etc.), and on “the average listening environment, age of the target audience, ‘listening comfort zone’ of the consumer and other parameters”.
8.1. Programme Duration
By the LRA design criteria the measure must work for short as well as long programmes. In the analyses, presented above, the LRA worked fine with programmes between 4 minutes and 4 hours. But what happens to the LRA measure as the programme duration approaches 0 seconds?
Consider, for example, a programme of 9 seconds duration. The sliding-window measurement of that could yield only 3 independent samples (i.e. levels), when using a 3 s RMS window. From a statistical point of view, 3 independent samples are a very thin basis on which to estimate a loudness level distribution.
Furthermore, the RMS integration itself may produce level-ramps at the beginning/end of the programme (see Fig. 2). For very short programmes, these ramps could become significant in the loudness distribution. To reduce this issue, the RMS window length could be shortened, or the gating mechanism could employ a ‘look-ahead’ in order to exclude the ramps in addition to the background noise. However, shortening the RMS window would conflict with the findings (section 4) that a 2-3 s window is the most appropriate time-scale for the LRA measure. Shortening the window significantly would transform the LRA into a measure of micro-dynamics which might fail to detect the longer-term variations of a programme.
Perhaps the question is what the Loudness Range concept means for a “programme” of very short
duration? The Practical Guidelines [32](p.12) provides the following advice: “For very short programmes (<30 s) such as commercials, advertisements or trailers, setting a limit for the maximum values of the Momentary or Short-term Loudness Level may provide a better way to control the dynamic properties as a kind of ‘second line of defence’.”
9. CONCLUSION
Loudness Range (LRA) is essentially a statistical measure of the difference in loudness level between the soft and loud parts of a programme. The LRA algorithm was developed by TC Electronic and was published in 2009. The EBU R128 recommends that “The measure Loudness Range shall be used to help decide if dynamic compression is needed (dependent on genre, target audience and transmission platform)”.
This paper describes the design choices underlying of the LRA measure. Each component of the algorithm is examined: the sliding-window RMS measurement, the cascaded gating scheme, and the percentiles of the loudness level distribution. For each parameter of the algorithm an interval of optimal values is presented, substantiated by analyses of characteristic audio examples from 4 different programme genres. The consequences of choosing parameter values above or below these intervals are also described. The parameter values of the LRA measure that has been standardised as part of EBU R128 and EBU Mode loudness meters lie within these recommended intervals.
The development of the LRA measure was guided by 10 design criteria, and this paper demonstrates how the LRA algorithm – with appropriate parameter settings – satisfies these criteria. Evaluation of the LRA measure by means of listening experiments was also discussed.
Although the LRA has already proven its usefulness in numerous products and applications, the background knowledge and analyses provided in this paper could contribute to further evaluation, refinement and standardisation of the LRA measure.
10. ACKNOWLEDGEMENTS
The author wishes to thank Thomas Lund and Søren H. Nielsen for years of fruitful loudness discussions at TC Electronic R&D, as well as the energetic and inspired fellow members of the EBU P/LOUD group.

Skovenborg Loudness Range – Design and Evaluation
AES 132nd Convention, Budapest, Hungary, 2012 April 26–29 Page 11 of 12
11. REFERENCES
[1] EBU (2010) "EBU Technical Recommendation R128 -- Loudness normalisation and permitted maximum level of audio signals", European Broadcasting Union.
[2] Nielsen, S.H. & Lund, T. (1999) "Level Control in Digital Mastering", in Proc. of the AES 107th Convention.
[3] Klar, S. & Spikofski, G. (2002) "On levelling and loudness problems at television and radio broadcast studios", in Proc. of the AES 112th Convention, Munich.
[4] Emmett, J. (2003) "Audio levels - in the new world of digital systems", EBU Technical Review, vol.2003:January.
[5] Moerman, J.P. (2004) "Loudness in TV Sound", in Proc. of the AES 116th Conv.
[6] Vickers, E. (2010) "The Loudness War: Background, Speculation and Recommendations", in Proc. of the 129th AES Convention.
[7] Lund, T. (2011) "ITU-R BS.1770 Revisited", in Proc. of the NAB-2011 Convention.
[8] Camerer, F. (2010) "On the way to Loudness nirvana - audio levelling with EBU R 128", EBU Technical Review, vol.2010:Q3.
[9] Lund, T. (2007) "Distortion Level and in digital broadcasting", EBU Technical Review, vol.2007:April.
[10] ITU-R (2006) "Rec. ITU-R BS.1770, Algorithms to measure audio programme loudness and true-peak audio level.", International Telecommunications Union.
[11] Skovenborg, E. & Nielsen, S.H. (2004) "Evaluation of Different Loudness Models with Music and Speech Material", in Proc. of the AES 117th Convention, San Francisco.
[12] TC Electronic A/S (2008) "LM5D Loudness Meter", Internet URL: http://www.tcelectronic.com/lm5d.asp.
[13] Skovenborg, E. & Lund, T. (2008) "Loudness Descriptors to Characterize Programs and Music
Tracks", in Proc. of the AES 125th Convention, San Francisco.
[14] Camerer, F. (2010) "Loudness - an Audio Levelling Revolution. Report of the scope and work of the EBU-group P/LOUD.", European Broadcasting Union.
[15] Skovenborg, E. (2009) "Loudness Range -- Input document to the EBU P/LOUD", Project Group P/LOUD, European Broadcasting Union.
[16] EBU (2010) "Technical Document 3342: Loudness Range: A measure to supplement loudness normalisation in accordance with EBU R 128.", European Broadcasting Union.
[17] EBU (2011) "EBU Technical - Loudness portal", Internet URL: http://tech.ebu.ch/loudness, European Broadcasting Union.
[18] ITU-R (2011) "Rec. ITU-R BS.1770-2, Algorithms to measure audio programme loudness and true-peak audio level.", International Telecommunications Union.
[19] Hartmann, W.M. (1998) "Signals, Sound, and Sensation", New York: Springer.
[20] Pleasurize Music Foundation (2010) "TT Dynamic Range Meter", Internet URL: http://www.pleasurizemusic.com/.
[21] ITU-R (2006) "Rec. ITU-R BS.1771, Requirements for loudness and true-peak indicating meters", International Telecommunications Union.
[22] Spikofski, G. (2011) "First Results of the User Evaluation on Loudness Harmonisation on the Web [visited 2011-12-01]", Internet URL: http://notube.tv/2011/12/01/first-results-of-the-user-evaluation-on-loudness-harmonisation-on-the-web/.
[23] Boley, J., Lester, M. & Danner, C. (2010) "Measuring Dynamics: Comparing and Contrasting Algorithms for the Computation of Dynamic Range", in Proc. of the AES 129th Convention.
[24] Grimm, E., Skovenborg, E. & Spikofski, G. (2010) "Determining an Optimal Gated Loudness Measurement for TV Sound Normalization", in Proc. of the AES 128th Conv., London.
[25] Katz, B. (2002) "Mastering Audio: The Art and the Science", Oxford: Focal Press.

Skovenborg Loudness Range – Design and Evaluation
AES 132nd Convention, Budapest, Hungary, 2012 April 26–29 Page 12 of 12
[26] Skovenborg, E. & Nielsen, S.H. (2007) "Real-Time Visualisation of Loudness Along Different Time Scales", in Proc. of the 10th Int. Conference on Digital Audio Effects (DAFx-07), Bordeaux, France.
[27] EBU (2011) "Technical Document 3341: Loudness Metering: 'EBU Mode' metering to supplement loudness normalisation in accordance with EBU R 128. (revised Aug. 2011)", European Broadcasting Union.
[28] Deruty, E. (2011) "'Dynamic Range' & The Loudness War", Sound On Sound, vol.2011:Sept.
[29] Skovenborg, E. & Lund, T. (2009) "Loudness Descriptors to Characterize Wide Loudness-Range
Material", in Proc. of the AES 127th Convention, New York.
[30] Eargle, J. (2002) "Handbook of Recording Engineering" (4th. ed.), Springer.
[31] Lavoie, M.C. & Norcross, S.G. (2010) "Loudness Range calculation using varying amounts of overlap [personal correspondence]", Communications Research Center.
[32] EBU (2011) "Technical Document 3343: Practical guidelines for Production and Implementation in accordance with EBU R 128; version 2.0", European Broadcasting Union.
12. APPENDIX
Example source code for computing the Loudness Range (EBU Mode); from EBU Tech. 3342 [16].
% A MATLAB FUNCTION TO COMPUTE LOUDNESS RANGE % -------------------------------------------------------------------- function LRA = LoudnessRange( ShortTermLoudness ) % Input: ShortTermLoudness is a vector of loudness levels, computed % as specified in ITU-R BS.1770 without gating, using a sliding % analysis-window of length 3 s, overlap >= 2 s % Constants ABS_THRES = -70 ; % LUFS (= absolute measure) REL_THRES = -20; % LU (= relative measure) PRC_LOW = 10; % lower percentile PRC_HIGH = 95; % upper percentile % Apply the absolute-threshold gating abs_gate_vec = (ShortTermLoudness >= ABS_THRES); % abs_gate_vec is indices of loudness levels above absolute threshold stl_absgated_vec = ShortTermLoudness(abs_gate_vec); % only include loudness levels that are above gate threshold % Apply the relative-threshold gating (non-recursive definition) n = length(stl_absgated_vec); stl_power = sum(10.^(stl_absgated_vec./10))/n; % undo 10log10, and calculate mean stl_integrated = 10*log10(stl_power); % LUFS rel_gate_vec = (stl_absgated_vec >= stl_integrated + REL_THRES); % rel_gate_vec is indices of loudness levels above relative threshold stl_relgated_vec = stl_absgated_vec( rel_gate_vec ); % only include loudness levels that are above gate threshold % Compute the high and low percentiles of the distribution of values in stl_relgated_vec n = length(stl_relgated_vec); stl_sorted_vec = sort(stl_relgated_vec); % sort elements in ascending order stl_perc_low = stl_sorted_vec(round((n-1)*PRC_LOW/100 + 1)); stl_perc_high = stl_sorted_vec(round((n-1)*PRC_HIGH/100 + 1)); % Compute the Loudness Range measure LRA = stl_perc_high - stl_perc_low; % in LU