audit a04h0018 - reliability of cost and benefit ... · reliability of cost and benefit information...
TRANSCRIPT
UNITED STATES DEPARTMENT OF EDUCATION OFFICE OF INSPECTOR GENERAL
July 30, 2009 Control Number ED-OIG/A04H0018
Danny Harris Chief Information Officer Office of the Chief Information Officer U.S. Department of Education 550 12th St. SW, Room 9112 Washington, DC 20202
Dear Mr. Harris:
The enclosed Final Audit Report, entitled, Reliability of Cost and Benefit Information in the U.S. Department of Education’s Information Technology Investment Exhibit 300s presents the results of the two audits1 we performed on selected U.S. Department of Education (Department) Information Technology (IT) exhibit 300s. The objectives of both audits were to determine whether the cost information presented in the Department’s exhibit 300s, including the estimated benefits of system development efforts, is 1) based on reasonably accurate, reliable, and complete cost and benefit data; and 2) independently validated prior to submission to the Office of Management and Budget (OMB). Our audits covered selected exhibit 300s submitted to OMB through September 2007 for selected IT investments.
For a complete list of acronyms/abbreviations used in this report, see Appendix A.
BACKGROUND
The Department budgeted approximately $587.1 million2 to spend on IT investments for fiscal year (FY) 2008.3 The Department, along with other government agencies, is required to submit an exhibit 300 Capital Asset Plan and Business Case (exhibit 300) to OMB each year for each major IT investment in order to justify funding requests for the investments. Among other things, exhibit
1Audit Control Number (ACN) A04H0019 was a review of selected Federal Student Aid (FSA) IT Investment exhibit 300s, while ACN A04H0018 was a review of selected IT investment exhibit 300s from five other offices within the Department. Since both audits have the same audit objectives and audit findings, and the exhibit 300s reviewed in both audits fall under the ultimate responsibility of the Department’s Office of the Chief Information Officer, we combined the results of both audits into this one report. 2 Of the budgeted amount, $334.5 million was allocated to the five FSA IT investments we reviewed. 3 The source for this figure is the Department’s FY 2009 Budget Exhibit 53.
The Department of Education's mission is to promote student achievement and preparation for global competitiveness by fostering educational excellence and ensuring equal access.

Final Report ED-OIG/A04H0018 Page 2 of 22
300s contain cost, schedule, and performance goals as it relates to the IT project. Also included in exhibit 300s are controls that agencies have established to ensure good project management.
The primary office that develops policies and procedures for IT investment decisions and the exhibit 300 approval process within the Department is the Office of the Chief Information Officer (OCIO). This office advises and assists the Secretary and other senior officers in acquiring IT and managing information resources. It also helps Department officials comply with applicable laws and regulations, such as the Clinger-Cohen Act of 1996 (CCA). OCIO is responsible for providing technical and support services to the Department’s Planning and Investment Review Working Group (PIRWG) and Investment Review Board (IRB). OCIO’s Investment and Acquisition Management Services (IAMS) team is responsible for providing IT investment information and recommendations to the PIRWG and IRB.
The PIRWG assesses the effectiveness of the Department’s IT investment management process and provides recommendations through the Chief Information Officer (CIO) to the IRB for refining and improving the process. The PIRWG uses criteria such as proposals for investments, project funding requests, and project progress and performance to analyze IT investment activities. The IRB is the executive decision-making body for the Department’s IT investment management process. The IRB reviews the IT investment proposals and recommendations of the CIO and finalizes all decisions and corrective actions, ranging from initiation and modification through continuation or termination of an IT investment. The IAMS team is responsible for providing liaison support to IT project managers regarding business case justifications and the gathering and reporting of IT project documentation. The IAMS team also receives, reviews, and coordinates the yearly submission of the exhibit 300s to OMB.
Federal Student Aid (FSA) has an internal IT investment review process for its exhibit 300s prior to submission to the Department. For a description of both the Department’s and FSA’s IT exhibit 300 approval processes, see Appendix B.
The management of IT investments is guided by the CCA, which was designed to ensure that the Federal government’s acquisition and management of IT be operated in the same manner as an efficient and profitable business. The CCA requires the Department and individual programs to use performance based management principles for acquiring IT so that major IT investments are properly planned, implemented, maintained, and evaluated; and accountability for performance is enforced.
OMB provides guidance on management improvement initiatives and policies including capital planning and investment control so that IT investments that directly support agency strategic missions, employ an integrated planning, budgeting, and procurement process consistent with the CCA. OMB Memorandum M-05-234 required all Federal agencies to 1) ensure that cost, schedule, and performance goals were independently validated for all new major IT projects before beginning development; and 2) complete independent validations by March 31, 2006 for ongoing major IT projects with development efforts.
4 OMB Memorandum M-05-23, Improving Information Technology Project Planning and Execution (August 4, 2005).

Final Report ED-OIG/A04H0018 Page 3 of 22
We reviewed 10 IT investments from 6 different offices within the Department, as shown in Table 1. Because FSA is responsible for its administrative, accounting, and financial management functions of all its IT contracts, we performed an audit of FSA’s exhibit 300s separately from other offices within the Department. We selected five investments for review from FSA and one investment from each of the other five offices.
Table 1 – IT Investments Selected for Review Office Investment Name
Office of Planning, Evaluation, and Policy Development (OPEPD) Education Data Exchange Network (EDEN)5
OCIO Education Department Utility for Communications, Applications, and Technical Environment (EDUCATE)6
Office of the Chief Financial Officer (OCFO) Integrated Support Services (ISS) Office of Elementary and Secondary Education (OESE) Migrant Student Information Exchange (MSIX)
Institute of Education Sciences (IES) National Assessment of Educational Progress (NAEP)
FSA
Advance7
Common Services for Borrowers (CSB) Enterprise Information System (EIS) National Student Loan Data System (NSLDS)8
Virtual Data Center (VDC)
For a description of the IT investments reviewed, see Appendix C.
AUDIT RESULTS
We found that the Department did not always report reliable and complete cost data in its exhibit 300s. Specifically, four of the six offices with investments reviewed did not report cumulative project costs9 in exhibit 300s. In addition, four10 of the six offices did not maintain sufficient
5 EDEN was formerly called Performance-Based Data Management Initiative (PBDMI). 6 EDUCATE was formerly called EDNet; Combined Office Automation (COA); and Network Operations (NetOps). 7 In FY 2006, ADvance-Aid Delivery, formerly named Front-End Business Integration, split off into two investments, with one investment remaining ADvance Aid-Delivery and the other investment named ADvance Development. In FY 2007 ADvance Development was renamed ADvance Person Data Management Although two separate exhibit 300s were submitted for ADvance Aid Delivery and ADvance Person Data Management in FY 2007, for reporting purposes, we categorize all iterations of the ADvance investment as ADvance.8 Includes FSA’s NSLDS re-engineering effort, which was later terminated. 9 Cumulative project costs are required in the column labeled “PY-1 and Earlier” in the exhibit 300. Past Year (PY)-1 and Earlier refers to the fiscal year immediately preceding the past year and all years earlier, which we refer to as “cumulative project costs” in this report.10 Three of the four offices were the same in both findings.

Final Report ED-OIG/A04H0018 Page 4 of 22
documentation to support the accuracy, reliability, and completeness of the summary of spending tables included in the exhibit 300s. Of the four offices, two did not maintain sufficient support for the benefits information. Without complete, historical cost information and supporting documentation, we could not verify the estimated costs and benefits information included in the exhibit 300s, nor could we assure that the exhibit 300s reviewed included estimates of all reasonable costs and benefits related to the initiative. As such, the Department and OMB could be making investment decisions based on unreliable cost and benefit information, and without full consideration of the entire cost of the project.
In general, we found that all six offices11 reviewed complied with OMB’s 2005 validation requirements12 for exhibit 300 costs, with the performance of either an independent validation or an Integrated Baseline Review (IBR). An IBR13 is a formal review conducted jointly by the government program manager and technical staff and their contractor counterparts to verify the technical content of the performance measurement baseline and the accuracy of the related resource (budgets) and schedules.
In its comments to the draft audit report, OCIO concurred with the finding and recommendations. OCIO stated that in April 2008, it provided an FY 2010 Exhibit 300 Guidance document to all project managers. However, the guidance was not discussed during our audit, nor was it provided when we updated our audit information in February 2009, at which time we specifically requested any updated information related to the finding and recommendations. Subsequent to receiving OCIO’s comments, we requested a copy of the guidance. In our review of the April 2008 guidance; we found that it addresses reporting cumulative project costs and estimated benefits. However, the guidance does not address the maintenance of supporting cost and benefit information, nor does it include requirements to promote adherence to the guidance, both of which are critical to addressing the finding and recommendations included in this report. OCIO stated that it will address strengthening guidance in the corrective action plan (CAP). The full text of OCIO’s comments is included as an attachment to this report.
FINDING - Inconsistent Reporting of Cumulative Project Costs and Insufficient Documentation in Support of Reported Costs and Benefits
We found that 4 of the 6 selected offices (OCFO, OESE, IES, and FSA) within the Department did not report cumulative project costs in 14 of 55 total exhibit 300s reviewed for the 10 selected investments. Of the 55 exhibit 300s, we judgmentally selected 2714 to verify the accuracy and
11 The only exception was FSA’s Enterprise Information System exhibit 300 submitted in fiscal year 2007. Since this was the only exhibit 300 that did not undergo independent validation out of the 27 exhibit 300s reviewed for supporting documentation, we did not consider it material and, therefore, are not reporting it as a finding. Instead, we informed FSA of the issue at the exit meeting. 12 OMB Memorandum M-05-23, Improving Information Technology Project Planning and Execution (August 4, 2005). 13 According to OMB Memorandum M-05-23, Improving Information Technology Project Planning and Execution (August 2005), IBRs can be done in lieu of independent validation.14 The 27 selected exhibit 300s include the first exhibit 300 submitted to OMB under the 10 investments’ current name; the most recently submitted exhibit 300 under the investments’ current name; and if the investments had former names, we selected the last exhibit 300 submitted under each of the former names.

Final Report ED-OIG/A04H0018 Page 5 of 22
reliability of the costs and benefit information included in the exhibit 300s. We found that 4 of 6 offices (OCIO, OCFO, IES, and FSA) did not maintain sufficient documentation supporting costs in 15 of the 27 exhibit 300s reviewed. In addition, 2 of the 6 offices (OCIO and FSA) did not maintain adequate support for benefits reported in 715 of the 27 exhibit 300s reviewed.
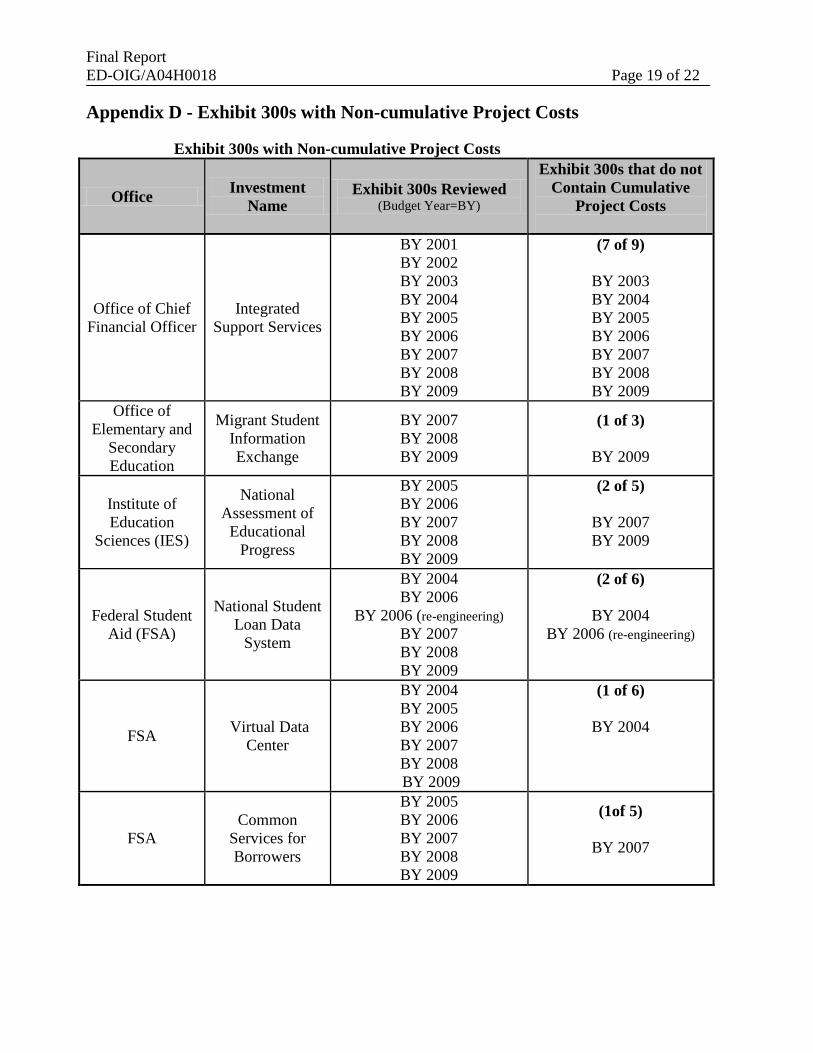
Cumulative Project Costs not Reported in Exhibit 300s In comparing cumulative project costs reported in an investment’s exhibit 300 with the amount reported in the investment’s previous exhibit 300s, we found that OCFO, OESE, IES, and FSA did not report cumulative project costs in 14 of the 44 exhibit 300s reviewed from those 4 offices. Table 2 shows the number of exhibit 300s that do not contain cumulative project costs for each of the four offices in question (OCFO, OESE, IES, and FSA).
Table 2 - Exhibit 300s with Non-cumulative Project Costs
FSA
Office
OCFO OESE IES
Totals
NSLDS VDC
ADvance CSB EIS
Investment Name
ISS MSIX NAEP
6 6 5 5 5
Number of Exhibit 300s Reviewed (a)
9 3 5
44 (a) We also reviewed 5 EDUCATE exhibit 300s and 6 EDEN exhibit 300s, which are not shown in the table
because we did not identify any cumulative cost issues in those exhibit 300s. Therefore, in total we reviewed 55 (44+5+6) exhibit 300s, 14 of which did not contain cumulative project costs for prior years.
(b) The 14 exhibit 300s that did not contain cumulative projects costs are listed in Appendix D.
2 1 0 1 0
Number of Exhibit 300s that do not Contain Cumulative
Project Costs (b)
7 1 2
14
With the exception of NAEP, the project managers16 agreed that for 9 of the 14 exhibit 300s identified, the amounts reported in the cumulative project cost column were not cumulative and were inconsistently reported. FSA’s IT Liaison stated that when the exhibit 300s were first developed, they did not include information from previous contracts or iterations of the investment; but, for newer investments they have tried to capture all expenditures. In addition, according to the December 2006 IRB meeting minutes, the Under Secretary stated that very few project managers were maintaining up-to-date cost information in the Electronic Capital Planning and Investment Controls System (eCPIC), which is a web-based application used to create and maintain exhibit 300s. The Director of the Contract Performance Analysis and Oversight Group stated that the CSB exhibit 300 did not include up-to-date cost information in eCPIC, which resulted in inaccurate cumulative project costs for CSB’s FY 2007 exhibit 300.
15 Of the seven exhibit 300s with unsupported benefit information, six are also included in the number of exhibit 300s that contain unsupported cost information. 16 Project Managers for the ISS and MSIX investments only.

Final Report ED-OIG/A04H0018 Page 6 of 22
The project manager for NAEP agreed that the amounts reported in the cumulative project cost column included in the Budget Year (BY) 2007 NAEP exhibit 300 were not cumulative but did not agree that the reported project costs in the BY 2009 NAEP exhibit 300 were not cumulative. However, because the NAEP project manager did not provide a sufficient explanation for no increase in cumulative project costs reported in the BY 2009 exhibit 300 from that reported in the BY 2008 exhibit 300,17 we classified the BY 2009 exhibit 300 as not including total cumulative project costs.
OMB requires agencies to complete the exhibit 300 summary of spending table. The table includes both estimated project costs and expended costs. The cumulative project cost column of the spending table should include costs incurred since the inception of the project. When noncumulative projects costs or no costs are entered into that column, OMB and other interested parties do not have accurate historical cost information to use in investment funding decisions; and, therefore, may be making decisions based on incomplete project cost data.
Supporting Cost and Benefit Documentation not Maintained for Exhibit 300s In reviewing supporting cost and benefit documentation, or both, for a total of 27 selected exhibit 300s, from 6 Department offices, we found that 4 offices (OCIO, OCFO, IES, and FSA) did not maintain sufficient documentation to adequately support the costs in the summary of spending tables presented in 15 of the exhibit 300s. Of the 15 exhibit 300s with unsupported summary of spending tables, 9 were completely unsupported, 3 were 41 to 68 percent unsupported, and 3 were 12 to 16 percent unsupported. We considered summary of spending tables and benefits information to be adequately supported if at least 90 percent of the costs and benefits were supported with sufficient18 documentation (i.e., a 10 percent threshold).
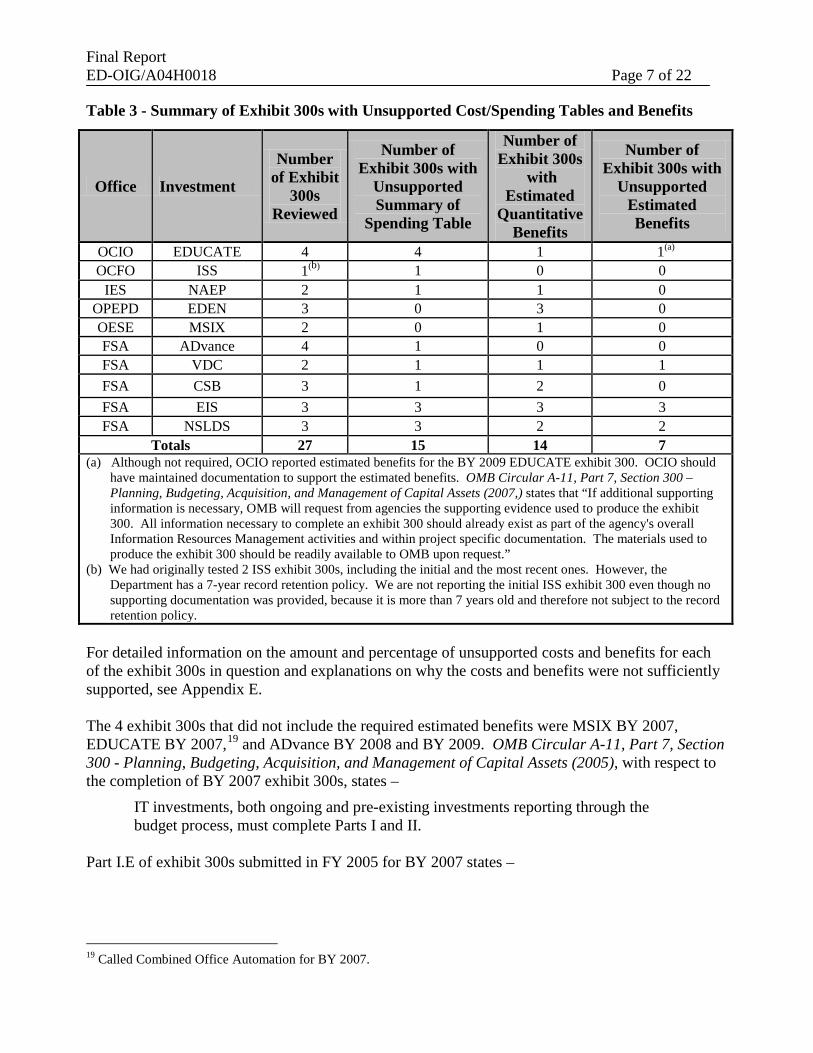
Of the 27 exhibit 300s reviewed, estimated benefits was required to be reported for 20 of the exhibit 300s. However, only 16 of the 20 exhibit 300s contained estimated benefits, as required; and 1 exhibit 300 (BY 2009 EDUCATE) that did not require estimated benefits, actually included estimated benefits. Of the 17 exhibit 300s that contained estimated benefits, 14 contained estimated quantitative benefits, while the other 3 contained qualitative benefits. In reviewing supporting documentation for the 14 exhibit 300s that contained estimated quantitative benefits, we found that 2 offices (OCIO and FSA) did not maintain sufficient documentation to support any of the estimated quantitative benefits presented in 7 of the 14 exhibit 300s. Table 3 on the following page summarizes the number of exhibit 300s, by investment, for which sufficient supporting cost and benefit documentation, or both, was not maintained.
17 Funds used in BY 2008 should have increased the cumulative project cost for the project in the BY 2009 exhibit 300. 18 Examples of sufficient supporting cost and benefit documentation provided to the audit team include task orders, contracts, bids, proposals, Independent Government Cost Estimates, invoices, receiving reports, purchase requisitions, Cost Benefit Analyses, Alternative Analysis Life Cycle Cost Summary, and Net Present Value Tables.
Final Report ED-OIG/A04H0018 Page 7 of 22
Table 3 - Summary of Exhibit 300s with Unsupported Cost/Spending Tables and Benefits
Office Investment
Number of Exhibit
300s Reviewed
Number of Exhibit 300s with
Unsupported Summary of
Spending Table
Number of Exhibit 300s
with Estimated
Quantitative Benefits
Number of Exhibit 300s with
Unsupported Estimated Benefits
OCIO EDUCATE 4 4 1 1(a)
OCFO ISS 1(b) 1 0 0 IES NAEP 2 1 1 0
OPEPD EDEN 3 0 3 0 OESE MSIX 2 0 1 0 FSA ADvance 4 1 0 0 FSA VDC 2 1 1 1 FSA CSB 3 1 2 0 FSA EIS 3 3 3 3 FSA NSLDS 3 3 2 2
Totals 27 15 14 7 (a) Although not required, OCIO reported estimated benefits for the BY 2009 EDUCATE exhibit 300. OCIO should
have maintained documentation to support the estimated benefits. OMB Circular A-11, Part 7, Section 300 – Planning, Budgeting, Acquisition, and Management of Capital Assets (2007,) states that “If additional supporting information is necessary, OMB will request from agencies the supporting evidence used to produce the exhibit 300. All information necessary to complete an exhibit 300 should already exist as part of the agency's overall Information Resources Management activities and within project specific documentation. The materials used to produce the exhibit 300 should be readily available to OMB upon request.”
(b) We had originally tested 2 ISS exhibit 300s, including the initial and the most recent ones. However, the Department has a 7-year record retention policy. We are not reporting the initial ISS exhibit 300 even though no supporting documentation was provided, because it is more than 7 years old and therefore not subject to the record retention policy.
For detailed information on the amount and percentage of unsupported costs and benefits for each of the exhibit 300s in question and explanations on why the costs and benefits were not sufficiently supported, see Appendix E.
The 4 exhibit 300s that did not include the required estimated benefits were MSIX BY 2007, EDUCATE BY 2007,19 and ADvance BY 2008 and BY 2009. OMB Circular A-11, Part 7, Section 300 - Planning, Budgeting, Acquisition, and Management of Capital Assets (2005), with respect to the completion of BY 2007 exhibit 300s, states –
IT investments, both ongoing and pre-existing investments reporting through the budget process, must complete Parts I and II.
Part I.E of exhibit 300s submitted in FY 2005 for BY 2007 states –
19 Called Combined Office Automation for BY 2007.

Final Report ED-OIG/A04H0018 Page 8 of 22
In order to successfully address this area of the business case, you must include three viable alternatives that were compared consistently, identify the alternative chosen, and provide benefits and reasons for your choice.”
In addition, OMB Circular A-11, Part 7, Section 300 - Planning, Budgeting, Acquisition, and Management of Capital Assets (2006 and 2007), with respect to the completion of BY 2008 and BY 2009 exhibit 300s, states –
Part II should be completed only for investments identified as “Planning” or “Full Acquisition,” or “Mixed Life-Cycle” investments… In selecting the best capital asset, you should identify and consider at least three viable alternatives. . . Use the results of your alternatives analysis to complete the following table.
The alternative analysis table includes the reporting of a risk adjusted lifecycle benefits estimate.
OESE and OCIO were required to complete Part I of the BY 2007 exhibit 300s submitted for the MSIX and EDUCATE investments, respectively. However in completing Part I, OESE and OCIO did not provide benefits for the selected alternatives as required by instructions provided in Part I.E of the exhibit 300. In addition, FSA was required to complete Part II of the BY 2008 and BY 2009 exhibit 300s submitted for the ADvance investment. However, FSA did not conduct alternative analyses to include estimated benefits in Part II of the exhibit 300s, as instructed by OMB Circular A-11.
The project managers and other responsible officials for the investments reviewed presented several reasons for not providing sufficient documentation to support estimated costs and benefits presented in exhibit 300s. The reasons provided included – - former project managers who were responsible for the unsupported exhibit 300s no longer work
for the Department, and the supporting documentation could not be located; and - supporting documentation was lost because of a computer hard disk crash.
For 4 of the 5 FSA investments reviewed, staff, other than the project manager, prepared and maintained the exhibit 300s, but did not maintain sufficient documentation supporting the information included in the exhibit 300s. In discussing training with three of the four non-project managers who prepared the exhibit 300s, all three confirmed that the training they received did not address the maintenance of documentation needed to support the cost information reported in exhibit 300s.
The CCA requires agencies to use performance based management principles for acquiring IT so that major IT investments are properly planned, implemented, maintained, and evaluated – enforcing performance accountability. In response to the CCA and other statutes, OMB developed a policy for planning, budgeting, acquiring, and managing Federal capital assets. This policy, set forth in OMB Circular A-11, Part 7, Section 300 – Planning, Budgeting, Acquisition, and Management of Capital Assets (2007) states that –
OMB uses the exhibit 300 to make both quantitative decisions about budgetary resources consistent with the Administration’s program priorities, and qualitative

Final Report ED-OIG/A04H0018 Page 9 of 22
assessments about whether the agency’s programming processes are consistent with OMB policy and guidance. OMB will be evaluating all elements of the business cases and will communicate the results of these evaluations in the course of the budget process. If additional supporting information is necessary, OMB will request from agencies the supporting evidence used to produce the exhibit 300. All information necessary to complete an exhibit 300 should already exist as part of the agency's overall Information Resources Management activities and within project specific documentation. The materials used to produce the exhibit 300 should be readily available to OMB upon request.
The guidance further states that –
Following budget season, agencies should update their agency’s exhibit 300s submitted during budget submission to reflect final Presidential decisions…agencies should continuously maintain updated information about the projects contained in the exhibit 300. OMB may request this information at any time.
According to the Departmental Directive OCIO: 3-108 – IT Investment Management Policy (September 15, 2006), there are three20 groups within the Department with the responsibility for managing, coordinating, and choosing IT investments – IAMS, the IRB, and the PIRWG. However, none of the groups review IT exhibit 300s for accuracy and consistency, nor do they review the documentation used to support the cost information presented in the exhibit 300s. In addition, OCIO does not have written policies for maintaining supporting documentation, nor does it have guidance on what type of documentation is sufficient to support estimated costs presented in exhibit 300s. As a result, OCIO has no controls in place to ensure that sufficient documentation is maintained to support the estimated costs and benefits and cumulative project costs in exhibit 300s.
Inaccurate historical cost information and insufficient supporting documentation for the exhibit 300s reviewed raises questions as to the justification provided for the investment and the resulting management decisions based on this information. The lack of documentation provided in support of cost and benefit information reported in the Department’s exhibit 300s indicates an underlying weakness in the management of IT investments with respect to management’s processes and controls. As a result, the Department and OMB could be making investment decisions based on inaccurate and unreliable cost and benefit information, or both; and may not be considering the entire cost of a project in evaluating competing projects in other categories of investment. Without cumulative project cost information, OMB is not receiving complete and accurate information on investment expenditures to make quantitative decisions about budgetary resources consistent with the Administration’s program priorities and qualitative assessments about whether the Department’s programming processes are consistent with OMB policy and guidance.
In March 2009, the Government Accountability Office (GAO) released a new guide entitled Cost Estimating and Assessment Guide: Best Practices for Developing and Managing Capital Program Costs (GAO-09-3SP). The guide formalizes an approach to cost estimating based on best practices, which is intended to help agencies produce well-documented, comprehensive, accurate, and
20 A description of the responsibilities for each of the three groups – IAMS, IRB, and PIRWG – is included in the Background section of this letter.

Final Report ED-OIG/A04H0018 Page 10 of 22
credible estimates for capital program costs. The guide lays out a multi-step process for developing high-quality trustworthy cost estimates and explains how to manage program costs once a contract has been awarded. The guide is intended to assess the accuracy of agencies’ cost estimates and determine whether programs are on schedule.
Recent legislation, including the Ensuring Continued Access to Student Loans Act of 2008,21 have created a need for new IT investments and increased demand on existing IT investments, or both. As such, it is critical that the Department establish policies and procedures for developing, managing, and documenting investment costs so that both the Department and OMB have accurate and reliable information to use in making investment decisions and in evaluating competing projects. In addition, all Department offices need to obtain and maintain adequate supporting cost documentation to help avoid the issues identified in our audit.
In February 2009, we asked both OCIO and FSA to provide us with documentation regarding any updated information, including policies and procedures, to address the findings and recommendations presented during the exit conferences. OCIO provided documentation for a new process they were implementing called Program Assessment. The purpose of Program Assessment is to measure project management effectiveness and efficiency through the combined analysis of assessment criteria, such as planning, scheduling, and budgeting; business case support and achievement; project management process and tools; and corrective actions and data maintenance. Currently, OCIO is collecting supporting documentation for the Program Assessment of 14 major investment business cases, and plans to analyze those business cases to determine whether active core management functions are in place and whether corrective actions are needed. However, the Program Assessment does not address the documentation issues identified in the report – noncumulative project costs and insufficient documentation of supporting costs and benefits reported in exhibit 300s reviewed. With the potential for new IT investments to address recent legislation, it is critical that OCIO immediately begin maintaining documentation in support of the cost and benefit information included in exhibit 300s to ensure that investment decisions are based on reasonably accurate, reliable, and complete cost and benefit data.
According to FSA's CIO, FSA is revising parts of its IT investment process. FSA provided a February 2009 draft of its Capital Planning and Investment Review Team Charter. However, this charter did not address maintaining sufficient documentation to support the estimated costs and benefits presented in exhibit 300s.
RECOMMENDATIONS
We recommend that OCIO –
1.1 Develop and implement policies and procedures to ensure that IT project managers and other staff involved in the exhibit 300 process are consistent in reporting cumulative project costs years in exhibit 300s.
21Legislation authorizing the Department to purchase Federal student loans from lenders to ensure ongoing liquidity and availability of funds to student loans.

Final Report ED-OIG/A04H0018 Page 11 of 22
1.2 Develop and implement policies and procedures to ensure that IT project managers and other staff involved in the exhibit 300 process maintain accurate, reliable, and complete cost and benefit data to support estimated costs and benefits presented in exhibit 300s, using GAO’s new Cost Estimating and Assessment Guide as a reference.
1.3 Develop and implement policies and procedures that include requirements for compliance that link to performance standards in order to promote adherence to its April 2008 FY 2010 Exhibit 300 Guidance document and all future exhibit 300 guidance documents.
1.4 Ensure that estimated benefits are reported in exhibit 300s when required.
1.5 Require IAMS to request and consider the documentation used to support all exhibit 300s received from the principal offices during its review process.
Auditee Comments In its comments to the draft audit report, OCIO concurred with the finding and recommendations. In response to the recommendations, OCIO stated that, in April 2008, it provided an FY 2010 Exhibit 300 Guidance document to all project managers that addressed the reporting of cumulative project cost, and the performance and reporting of alternatives analyses, including the requirement for benefits associated with each alternative reported. OCIO stated that it will address strengthening guidance and adherence to the guidance in the CAP. In addition, OCIO stated that it will address the creation and management of a document repository for supporting documentation in the CAP.
OIG Response OCIO plans to strengthen the FY2010 Exhibit 300 Guidance document to address the deficiencies identified during our audit period. In strengthening the guidance, OCIO needs to address the maintenance of accurate, reliable, and complete cost and benefit data to support estimated costs and benefits presented in exhibit 300s; and include requirements to promote adherence to the guidance. Unless project managers are held accountable for adhering to the guidance, the deficiencies in exhibit 300s may very well continue. Therefore, we added a new recommendation that OCIO’s current guidance and any future exhibit 300 guidance include requirements for compliance that link to performance standards in order to promote adherence (Recommendation 1.3). In addition, we reiterate the importance of referring to GAO’s Cost Estimating and Assessment Guide when developing the CAP to strengthen OCIO’s guidance; and encourage OCIO to include the information in its exhibit 300 guidance document in written policies and procedures for project managers.

Final Report ED-OIG/A04H0018 Page 12 of 22
OTHER MATTERS
FSA’s Exhibit 300s Were Inconsistent with the Budget Submission
OMB held a meeting in October 2007 with both OCIO and FSA officials to discuss discrepancies OMB identified with FSA’s exhibit 300s submitted for FY 2007 / BY 2009. According to OMB Circular A-11, Part 7, Section 300 – Planning, Budgeting, Acquisition, and Management of Capital Assets (2007) the exhibit 300 must be submitted with an agency’s budget submission and should be fully integrated with an agency’s overall budget submission. In addition, the Department’s IT Investment Management Process Guide (September 2005), states that the OCIO is responsible for working with Budget Services to coordinate the preparation of the IT exhibit 300s to ensure that they reflect funding decisions that were made during the Select Phase22 and that they are developed and submitted in accordance with the budget submission process. Although OMB and Department guidance discusses linking the exhibit 300s with the budget process, neither state that the costs reported in the exhibit 300s must match the corresponding budget submission. However, FSA’s Director of Budget Group stated that based on the discussion with OMB, exhibit 300 cost data and the budget numbers should match at certain times during the year.
According to FSA’s IT Liaison, the exhibit 300 numbers should match with the budget in September, when exhibit 300s are submitted, in December, and during the summer when upfront estimates are needed for investments. FSA’s IT Liaison stated that in previous years, the project managers and other staff worked with FSA’s budget group to ensure that the numbers contained in both the exhibit 300s and the budget matched; however, for FY 2007 FSA received information from the Department’s budget office that the budget and exhibit 300 numbers did not necessarily need to match. According to the IAMS Director, the numbers FSA reported in its FY 2007 exhibit 300s continued to change up until the Department submitted the final versions to OMB. Both the IAMS Director and FSA’s IT Liaison stated that, based on the discussions with OMB, FSA agreed to update and resubmit all of its FY 2007 exhibit 300s to ensure that the budget numbers match the exhibit 300s submitted.
Given the issues that OMB had with FSA’s FY 2007 / BY 2009 exhibit 300s, the Department should clarify its guidance regarding the relationship between the exhibit 300 and budget numbers reported to OMB.
OBJECTIVES, SCOPE, AND METHODOLOGY
The objectives of our audits were to determine whether the cost information presented in the Department’s submission for exhibit 300s, including the estimated benefits of system development
22 The process the Department and Principal Offices use to determine priorities and make decisions about which initiatives (new and ongoing) they will fund and include in the IT portfolio.

Final Report ED-OIG/A04H0018 Page 13 of 22
efforts, is 1) based on reasonably accurate, reliable, and complete cost and benefit data; and 2) independently validated prior to submission to OMB. Our audit covered exhibit 300s submitted to OMB through September 2007 for selected IT investments.
To determine the policies, procedures, and controls over the Department’s IT exhibit 300 process, we obtained and reviewed laws, regulations, policies, procedures, and guides. We also interviewed the Chairman of the IRB, the Chairman of the PIRWG, and the Director of IAMS to determine their policies and procedures for approving/managing exhibit 300s and providing guidance to the project managers. In addition, we interviewed the project managers and other staff responsible for the IT investments and creation of the exhibit 300s included in our review. Within FSA, we interviewed FSA’s CIO, Deputy CIO, and IT Liaison. We also discussed selected aspects of the exhibit 300s process with the OMB’s Assistant General Counsel and a Policy Analyst within OMB’s Office of Information and Regulatory Affairs.
To determine the accuracy, reliability, and completeness of the costs and benefits reported in exhibit 300s, we selected a judgmental sample of 6 of the 7 offices within the Department that were responsible for the preparation of the 29 exhibit 300s submitted to OMB in September 2007 for BY 2009. The selected offices include OPEPD, OCIO, OCFO, OESE, IES, and FSA. The only office that was not chosen for review was the Office of Management (OM) because its exhibit 300 IT investments represented less than $1 million dollars. We then judgmentally selected 10 of the 29 investments for which an exhibit 300 was submitted to OMB in September 2007. From five of the selected offices (OPEPD, OCIO, OCFO, OESE, and IES), we judgmentally selected one IT investment from each office. The investments selected were those that had the highest FY 2009 budget from each office. The selected investments were EDEN, EDUCATE, ISS, MSIX, and NAEP. From the sixth selected office (FSA) we selected five investments for review, by selecting the investments with the highest FY 2009 budget. The five selected investments from FSA include ADvance (which includes ADvance-Aid Delivery and ADvance Person Data Management), CSB, EIS, NSLDS, and VDC.
To determine whether cumulative project costs were reported, as opposed to non-cumulative project costs, we reviewed all exhibit 300s pertaining to the 10 investments selected for review, which totaled 55 exhibit 300s. We compared the cumulative project costs reported in an investment’s exhibit 300 with the cumulative project costs reported in the previous exhibit 300 and questioned any discrepancies. For example, if an investment’s exhibit 300 submitted in 2002 reports $5,000,000 of cumulative project costs and the investment’s exhibit 300 submitted in 2003 reports only $1,000,000 for cumulative project costs, we asked the project manager to explain the difference – whether the figure is an error or whether there is a legitimate reason for the decrease in cumulative project costs.
To determine whether supporting documentation was maintained for the costs and benefits reported in the selected investments’ exhibit 300s, we obtained and reviewed 27 of the exhibit 300s belonging to the 10 selected investments. We selected the first exhibit 300 submitted to OMB under the investments’ current name (provided the exhibit 300 is not more than 7 years old);23 the
23 According to General Record Schedule 27 - Records of the Chief Information Officer, Item 3, IT Capital Investment Records: “…routine and periodic reports on IT capital investments, capital asset plans, business cases for major

Final Report ED-OIG/A04H0018 Page 14 of 22
most recently submitted exhibit 300 under the investment’s current name; and if the investment had former names, selected the last exhibit 300 submitted under each of the former names. In addition, for the selected exhibit 300s that were subject to OMB’s 2005 validation requirements, we obtained and reviewed documentation supporting independent validation of the exhibit 300s or documentation supporting an IBR (which can be done in lieu of independent validation).
Of the $587.1 million that the Department budgeted for IT investments in FY 2008, $501.9 million represented exhibit 300 IT investments and the remaining $85.2 million represented minor investments, for which an exhibit 300 is not required. The investments we selected for review accounted for $386.9 million of the $501.9 million budgeted for exhibit 300 IT investments in FY 2008.
We did not conduct testing of data reliability of computer processed data because we did not rely on any computer processed data to satisfy our audit objectives.
Our audit work was completed in Washington, D.C., and Atlanta, Georgia. We assessed the exhibit 300 investments based on OMB guidance in performance-based project management, as applied to system development projects. We conducted our fieldwork at the applicable Department offices from September 2007 through May 2008. An exit conference was held with selected officials from OPEPD, OCIO, OCFO, OESE, and IES on May 9, 2008. An exit conference was held with selected FSA officials on May 20, 2008. In February 2009, we updated the information in our review and requested that both OCIO and FSA provide us with documentation related to the findings and recommendations presented during the exit conferences, including any updated policies and procedures.
We conducted these performance audits in accordance with generally accepted government auditing standards. Those standards require that we plan and perform audits to obtain sufficient, appropriate evidence to provide a reasonable basis for our findings and conclusions based on our audit objectives. We believe that the evidence obtained provides a reasonable basis for our findings and conclusions based on our audit objectives.
ADMINISTRATIVE MATTERS
Corrective actions proposed (resolution phase) and implemented (closure phase) by your office will be monitored and tracked through the Department’s Audit Accountability and Resolution Tracking System (AARTS). The Department’s policy requires that you develop a final CAP for our review in the automated system within 30 days of the issuance of this report. The CAP should set forth the specific action items, and targeted completion dates, necessary to implement final corrective actions on the findings and recommendations contained in this final audit report. An electronic copy of this report has been provided to your Audit Liaison Officer(s).
investments, systems, acquisitions, or operational assets identified in the agency's capital investment portfolio; and clearance and review records…can be destroyed/deleted when 7 years old or when no longer needed.”

Final Report ED-OIG/A04H0018 Page 15 of 22
In accordance with the Inspector General Act of 1978, as amended, the Office of Inspector General is required to report to Congress twice a year on the audits that remain unresolved after six months from the date of issuance.
Statements that managerial practices need improvements, as well as other conclusions and recommendations in this report, represent the opinions of the Office of Inspector General. Determinations of corrective action to be taken will be made by the appropriate Department of Education officials.
In accordance with the Freedom of Information Act (5 U.S.C. §552), reports issued by the Office of Inspector General are available to members of the press and general public to the extent information contained therein is not subject to exemptions in the Act.
If you have any questions, please call Denise M. Wempe at 404-562-6477.
Sincerely, /s/ Keith West Assistant Inspector General for Audit
Attachment

Final Report ED-OIG/A04H0018 Page 16 of 22
Appendix A – Acronyms/Abbreviations Used in this Report
ACN Audit Control Number BY Budget Year CCA Clinger-Cohen Act of 1996 CIO Chief Information Officer COA Combined Office Automation CSB Common Services for Borrowers CSC Computer Sciences Corporation CAP Corrective Action Plan eCPIC Electronic Capital Planning and Investment Controls Department U.S. Department of Education EDEN Education Data Exchange Network EDUCATE Education Department Utility for Communications, Applications, and Technical Environment EIS Enterprise Information System ELT FSA’s Executive Leadership Team Exhibit 300 Exhibit 300 Capital Asset Plan and Business Case FSA Federal Student Aid FY Fiscal Year GAO Government Accountability Office GCE Government Cost Estimate IAMS Investment and Acquisition Management Services IBR Integrated Baseline Review IES Institute of Education Sciences IGCE Independent Government Cost Estimate IMC FSA’s Investment Management Council IRB Investment Review Board ISS Integrated Support Services IT Information Technology MSIX Migrant Student Information Exchange NAEP National Assessment of Educational Progress NetOps Network Operations NSLDS National Student Loan Data System OCFO Office of the Chief Financial Officer OCIO Office of the Chief Information Officer OESE Office of Elementary and Secondary Education OM Office of Management OMB Office of Management and Budget OPEPD Office of Planning, Evaluation, and Policy Development PBDMI Performance-Based Data Management Initiative PIRWG Planning and Investment Review Working Group PY Past Year VDC Virtual Data Center

Final Report ED-OIG/A04H0018 Page 17 of 22
Appendix B – Information Technology (IT) Investment Exhibit 300 Approval Process
Description of the U.S. Department of Education (Department’s) Exhibit 300 Approval Process
• The Investment and Acquisition Management Services (IAMS) is the group within the Office of the Chief Information Officer (OCIO) that receives the IT exhibit 300s from offices within the Department. IAMS reviews the exhibit 300s to ensure that all questions are answered with a valid/appropriate response. The team then takes the exhibit 300s through two rounds24 of scoring, which is based on strengths and weaknesses identified. IAMS suggests remedies for weaknesses identified; however, the project managers for the affected investments are not required to implement the suggestions.
• After IAMS’s review, the exhibit 300s are passed on to another group within OCIO, called the Planning and Investment Review Working Group (PIRWG). The PIRWG reviews the exhibit 300s for weaknesses and involves several offices of expertise such as the information assurance office, budget service office, and private sector, in order to verify that the information included in the exhibit 300s are valid/appropriate.
• After the PIRWG’s review and approval of all IT exhibit 300s, a portfolio of the exhibit 300s is sent to OCIO’s Investment Review Board (IRB). The portfolio does not contain the actual exhibit 300s because the IRB does not review each individual exhibit 300. Rather, the portfolio contains items such as Business Case Scorecard Summaries and summary sheets25 for each investment included in the portfolio. The IRB reviews the portfolio, minutes from previous IRB meetings, and proposed recommendations from the PIRWG to make the decision on whether to approve or disapprove the entire portfolio. Once the IRB approves the portfolio, OCIO submits the individual exhibit 300s to the Office of Management and Budget.
Description of Federal Student Aid’s (FSA’s) Exhibit 300 Approval Process Prior to Submission to the Department
FSA’s business cases are reviewed internally by both FSA’s Investment Management Council (IMC) and Executive Leadership Team (ELT). Based on FSA’s IT Liaison’s description of the ELT and IMC’s review process, this procedure does not include a review of the documentation supporting the business case. After FSA’s IMC and EMT approve its business case portfolio, it is forwarded to the Department’s PIRWG, which reviews and makes recommendations regarding the investment before forwarding to the Department’s IRB for its review and approval. According to the Director for IAMS, neither OCIO nor the IRB review supporting documentation for costs reported in the business cases. Further, according to the Chairman of the Department’s PIRWG, the working group reviews only the business case and not the supporting documentation.
24 FSA’s Investment Management Council and Executive Leadership Team review and approve all of FSA’s exhibit 300s prior to being forwarded to the Department for scoring.25 Summary sheets generally include estimated and historical costs, scoring, and action items addressing weaknesses identified.

Final Report ED-OIG/A04H0018 Page 18 of 22
Appendix C – Description of the Information Technology Investments Reviewed
• Education Data Exchange Network investment under the Office of Planning, Evaluation, and Policy Development is internet based, and collects elementary and secondary education data from state education agencies, for use in planning, policy, and management at the Federal, State, and local levels.
• Education Department Utility for Communications, Applications, and Technical Environment investment under the Office of the Chief Information Officer is responsible for providing operational services for the Department, such as security and privacy, desktop, helpdesk support, system/data center operations, email, and disaster recovery.
• Integrated Support Services investment under the Office of the Chief Financial Officer is a project responsible for providing support services to the Department’s integrated financial management solution called the Education Central Applications Processing System.
• Migrant Student Information Exchange investment under the Office of Elementary and Secondary Education is a system for providing electronic transfer of student records and determining the number of migratory children in each State.
• National Assessment of Educational Progress investment under the Institute of Education Sciences is a project that involves the creation and coordination of test items and questionnaires used in a variety of assessments for students. It has a web-based component that provides assessment data to parents, teachers, policymakers, and educators involved in establishing curriculum and achievement.
• ADvance investment under Federal Student Aid (FSA) was designed to integrate aid application, origination, disbursement, and funds management in order to support Title IV programs.
• Common Services for Borrowers investment under FSA was designed to re-engineer four separate, business processes into a single integrated system: Direct Loan Servicing System, Debt Management and Collection System, Direct Loan Consolidation System and Conditional Disability Discharge Tracking System / Total and Permanent Disability.
• Enterprise Information System investment under FSA was designed to help improve program integrity, operational efficiency and customer service through improvements in data quality, data access, and data sharing. EIS was to also serve as a systems development initiative that would implement key components within the FSA Target State, with Information Services as the first key component to be implemented.
• National Student Loan Data System investment under FSA was designed to collect, store, and make available data about Title IV aid disbursed and the aid recipients.
• Virtual Data Center investment under FSA provides operations and technical support for FSA’s federally mandated systems and the Title IV delivery systems.
Final Report ED-OIG/A04H0018 Page 19 of 22
Appendix D - Exhibit 300s with Non-cumulative Project Costs
Exhibit 300s with Non-cumulative Project Costs
Office Investment Name
Exhibit 300s Reviewed (Budget Year=BY)
Exhibit 300s that do not Contain Cumulative
Project Costs
Office of Chief Financial Officer
Integrated Support Services
BY 2001 BY 2002 BY 2003 BY 2004 BY 2005 BY 2006 BY 2007 BY 2008 BY 2009
(7 of 9)
BY 2003 BY 2004 BY 2005 BY 2006 BY 2007 BY 2008 BY 2009
Office of Elementary and
Secondary Education
Migrant Student Information Exchange
BY 2007 BY 2008 BY 2009
(1 of 3)
BY 2009
Institute of Education
Sciences (IES)
National Assessment of
Educational Progress
BY 2005 BY 2006 BY 2007 BY 2008 BY 2009
(2 of 5)
BY 2007 BY 2009
Federal Student Aid (FSA)
National Student Loan Data
System
BY 2004 BY 2006
BY 2006 (re-engineering) BY 2007 BY 2008 BY 2009
(2 of 6)
BY 2004 BY 2006 (re-engineering)
FSA Virtual Data Center
BY 2004 BY 2005 BY 2006 BY 2007 BY 2008 BY 2009
(1 of 6)
BY 2004
FSA Common
Services for Borrowers
BY 2005 BY 2006 BY 2007 BY 2008 BY 2009
(1of 5)
BY 2007

Final Report ED-OIG/A04H0018 Page 20 of 22
Appendix E - Exhibit 300s with Unsupported Cost/Spending Tables and Benefits
EDUCATE26 Exhibit 300s with Unsupported Summary of Spending Tables and Benefits (M=Million) (BY = Budget Year)
Network Operations BY 2005 – Spending Table 100% unsupported ($141.9 M) The Office of the Chief Information Officer (OCIO) provided two documents entitled "Responses to PIRWG27 Questions on Fiscal Year 04/05 IT Business Cases." However, neither of the documents included source documents indicating how the estimated costs presented in the exhibit 300 were derived. The two documents contained answers to questions raised by the PIRWG during a May 2003 PIRWG meeting.
Combined Office Automations (COA) BY 2007 – Spending Table 68% unsupported ($219.6 M of $323.9 M) OCIO provided a Computer Sciences Corporation (CSC) bid for the COA project, which contained yearly total project cost amounts; however, the amounts in the bid were lower than the amounts presented in the exhibit 300. OCIO also provided a document, entitled “OMB28
EDNet BY 2008 – Spending Table 100% unsupported ($340.1 M)
Approved Baseline and Actuals Table”; however, there were no explanations or other source documents to indicate how the numbers in the table were derived.
OCIO provided a document entitled “OMB Approved Baseline and Actuals Table”; however, there were no explanations or other source documents to indicate how the numbers in the table were derived. The CSC contract was also provided for support; however, the amounts in the contract did not correspond to the costs in the exhibit 300.
EDUCATE BY 2009 – Spending Table 12% Unsupported ($75.1 M of $608.6 M) Benefits 100% Unsupported ($117 M)
OCIO provided the BY 2008 EDNet exhibit 300, and a Baseline Change Request in support of the Operation and Maintenance Costs for 2007 and past years, and planning costs for 2007. However, the documents did not include source documents, such as invoices or information from a cost accounting system that would indicate how the costs were derived. In addition, OCIO provided a document entitled “Alternatives Analysis Worksheet Select Phase FY 08/09” in support of the estimated benefits presented in the exhibit 300. However, the worksheet is $3 million less than the amount shown on the exhibit 300. In addition, OCIO did not provide any source documents to show how they arrived at the amount inputted into the worksheet as savings (same as benefits).
Integrated Support Services (ISS) Exhibit 300 with Unsupported Summary of Spending Table
ISS BY 2009 – Spending Table 59% Unsupported ($68.6 M of $117.1 M) The Office of the Chief Financial Officer (OCFO) provided hardware and software calculation sheets in support of $56.0 million of operation and maintenance costs incurred prior to 2007. However, the documentation only supported $23.8 million. There was no documentation provided to support the remaining $32.2 million. In support of the combined total of $36.6 million in estimated operation and maintenance costs for years 2010 through 2013, OCFO provided the Government Cost Estimate (GCE) for the new contract; and an excerpt from Project Management Terms: A Working Glossary. However, there were no source documents to indicate how the estimated costs in the GCE were derived.
26 Education Department Utility for Communications, Applications, and Technical Environment 27 Planning and Investment Review Working Group 28 Office of Management and Budget

Final Report ED-OIG/A04H0018 Page 21 of 22
NAEP29 Exhibit 300 with Unsupported Summary of Spending Table
NAEP BY 2005 – Spending Table 100% Unsupported ($61.5 M) The Institute of Education Sciences did not provide support for any of the estimated costs in this exhibit 300. According to the former project manager for NAEP, the documentation for the cost figures in the exhibit 300 was lost when his hard disk crashed in January 2004.
ADvance Exhibit 300 with Unsupported Summary of Spending Table
ADvance Person Data Management BY 2009 – Spending Table 100% Unsupported ($36.1 M) Federal Student Aid (FSA) did not provide any documentation to support the estimated costs in this exhibit 300.
Virtual Data Center (VDC) Exhibit 300s with Unsupported Summary of Spending Table and Benefits
VDC BY 2009 – Spending Table 13% Unsupported ($90.3 M of $687.9 M) FSA provided an Independent Government Cost Estimate (IGCE) to support the exhibit 300 costs; however, it did not adequately support $90.3 million in estimated costs for future years because the IGCE estimate for future year costs was based on assumptions pertaining to the consolidation of investments that never actually happened.
VDC BY 2004 – Benefits 100% Unsupported ($53 M) FSA provided an IGCE to support the estimated benefits and cost savings; however, the IGCE did not include source documents that would indicate how the costs were derived.
Common Services for Borrowers (CSB) Exhibit 300 with Unsupported Summary of Spending Table
CSB BY 2005 – Spending Table 100% Unsupported ($139.9 M) Neither the IGCE, Contractors technical and price proposal, nor CSB Contract Deliverable by Borrower Status provided by FSA supported any of the cost estimates reported in this exhibit 300 because the amounts in the documents provided did not correspond to the costs in the exhibit 300.
EIS30 Exhibit 300s with Unsupported Summary of Spending Tables and Benefits
EIS BY 2005 – Spending Table 100% Unsupported ($29 M) Benefits 100% Unsupported (20 percent improvement in customer service)
FSA provided a Software Proposal for Information Server, Data Integration Vendor Recommendations, and Alternative Analysis Worksheet to support $29 M in planning, acquisition and maintenance costs reported in this exhibit 300; however, none of the documents corresponded to any portion of the $29 M. In addition, none of the documents supported a 20 percent improvement in customer service, which was the reported benefit in the exhibit 300.
29 National Assessment of Educational Progress 30 Enterprise Information System

Final Report ED-OIG/A04H0018 Page 22 of 22
EIS BY 2006 – Spending Table 100% Unsupported ($19.2 M) Benefits 100% Unsupported (20 percent improvement in customer service)
FSA provided a Software Proposal for Information Server, Data Integration Vendor Recommendations, and Alternative Analysis Worksheet to support $19.2 M in operations and maintenance costs reported in this exhibit 300; however, none of the documents corresponded to any portion of the $19.2 M. In addition, none of the documents supported a 20 percent improvement in customer service, which was the reported benefit in the exhibit 300.
EIS BY 2009 – Spending Table 100% Unsupported ($4.5 M) Benefits 100% Unsupported ($35.5 M in Life Cycle Benefits)
FSA provided a Software Proposal for Information Server, Data Integration Vendor Recommendations, and Alternative Analysis Worksheet to support $4.5 M in planning and acquisition costs reported in this exhibit 300; however, none of the documents corresponded to any portion of the $4.5 M. In addition, none of the documents supported the $35.5 M Life Cycle Benefits Estimate, which was the reported benefit in the exhibit 300.
NSLDS31 Exhibit 300s with Unsupported Summary of Spending Tables and Benefits
NSLDS BY 2004 – Spending Table 16% Unsupported ($5.9 M of $37.2 M) Benefits 100% Unsupported ($6 M)
FSA provided a business justification, contract invoices and modifications in support of $31.2 M in estimated operations and maintenance costs; however, these documents did not support the remaining $5.9 M. In addition, FSA did not provide any documentation supporting the $6 M estimated benefits reported in this exhibit 300.
NSLDS BY 2006 – Spending Table 100% Unsupported ($43.3 M) Benefits 100% Unuspported ($30.1 M)
FSA did not provide any documentation to support the estimated costs or benefits reported in this exhibit 300.
NSLDS BY 2009 – Spending Table 41% Unsupported ($40.2 M of $98.9 M) FSA provided a business justification, contract invoices and modifications in support of $58.7 M in planning, operations and maintenance costs; however, these documents did not support the remaining $40.2 M. costs.
31 National Student Loan Data System.


