audit assessment of...april to june 2016 – up east circle 5 1. introduction 1.1. about trai...
TRANSCRIPT

AUDIT & ASSESSMENT OF
QUALITY OF SERVICE
NORTH ZONE – UP-EAST CIRCLE
CELLULAR MOBILE TELEPHONE SERVICE (CMTS)
(APRIL TO JUNE 2016)
PREPARED BY:
PHISTREAM CONSULTING PRIVATE LIMITED (An ISO – 9001:2008 Certified Company)
Office: C – 56A/5, First Floor, Sector – 62, Noida ● Telephone: +91-120-644-7778 ● Email: [email protected]

April to June 2016 – UP East Circle 2
TABLE OF CONTENTS
1. INTRODUCTION ............................................................................................................................................... 5
1.1. ABOUT TRAI ......................................................................................................................................... 5
1.2. ABOUT PHISTREAM CONSULTING PRIVATE LIMITED .................................................................................. 5
1.3. OBJECTIVES .......................................................................................................................................... 5
1.4. COVERAGE ............................................................................................................................................ 6
1.5. SSA & SDCA LIST ................................................................................................................................ 7
1.6. FRAMEWORK USED .............................................................................................................................. 11
2. PMR REPORTS ............................................................................................................................................ 12 2.1. MONTHLY PMR ................................................................................................................................... 13
2.2. AUDIT PARAMETER: NETWORK ............................................................................................................. 14
2.3. DATA EXTRACTION POINTS ................................................................................................................... 14
2.4. AUDIT PROCEDURE .............................................................................................................................. 15
2.5. NETWORK CALCULATION METHODOLOGY .............................................................................................. 16
2.6. 3G VOICE ............................................................................................................................................ 17
2.7. 2G & 3G WIRELESS ............................................................................................................................. 19
3. 3 DAYS LIVE DATA ....................................................................................................................................... 20 3.1. TCBH: SIGNIFICANCE AND SELECTION METHODOLOGY ......................................................................... 20
3.2. CBBH: SIGNIFICANCE AND SELECTION METHODOLOGY ......................................................................... 21
4. CUSTOMER SERVICE PARAMETERS ............................................................................................................... 22 4.1. AUDIT PARAMETERS: CUSTOMER SERVICE ............................................................................................ 22
4.2. CALCULATION METHODOLOGY: CUSTOMER SERVICE PARAMETER .......................................................... 23
4.3. LIVE CALLING: SIGNIFICANCE AND METHODOLOGY ................................................................................ 24
4.4. BILLING COMPLAINTS ........................................................................................................................... 24
4.5. SERVICE COMPLAINTS REQUESTS ........................................................................................................ 25
4.6. LEVEL 1 ............................................................................................................................................... 25
4.7. PROCESS TO TEST LEVEL 1 SERVICE .................................................................................................... 25
4.8. CUSTOMER CARE................................................................................................................................. 27
4.9. INTER OPERATOR CALL ASSESSMENT ................................................................................................... 27
5. DRIVE TEST: SIGNIFICANCE AND METHODOLOGY ........................................................................................... 28 5.1. OPERATOR ASSISTED DRIVE TEST ........................................................................................................ 28
5.2. INDEPENDENT DRIVE TEST ................................................................................................................... 29
5.3. PARAMETERS EVALUATED DURING DRIVE TEST .................................................................................... 30
6. EXECUTIVE SUMMARY .................................................................................................................................. 31 6.1. OPERATORS COVERED ......................................................................................................................... 31
6.2. AUDIT SCHEDULE ................................................................................................................................. 32
6.3. CODES TO READ THE REPORT ............................................................................................................. 32
6.4. 2G VOICE PMR DATA: APRIL ............................................................................................................... 33
6.5. 2G VOICE PMR DATA: MAY ................................................................................................................. 33
6.6. 2G VOICE PMR DATA: JUNE ................................................................................................................ 33
6.7. 2G VOICE PMR DATA: CONSOLIDATED ................................................................................................. 34
6.8. 2G VOICE 3 DAYS LIVE DATA ............................................................................................................... 34
6.9. 2G VOICE 3 DAYS LIVE DATA: APRIL ..................................................................................................... 34
6.10. 2G VOICE 3 DAYS LIVE DATA: MAY ................................................................................................... 35
6.11. 2G VOICE 3 DAYS LIVE DATA: JUNE .................................................................................................. 35
6.12. 3 DAYS LIVE DATA: CONSOLIDATED .................................................................................................. 36
6.13. 3G VOICE PMR: CONSOLIDATED ...................................................................................................... 36

April to June 2016 – UP East Circle 3
6.14. 3G VOICE PMR: APRIL .................................................................................................................... 36
6.15. 3G VOICE PMR: MAY ...................................................................................................................... 37
6.16. 3G VOICE PMR: JUNE ..................................................................................................................... 37
6.17. 3G VOICE 3 DAYS LIVE DATA: CONSOLIDATED .................................................................................. 38
6.18. 3G VOICE 3 DAYS LIVE DATA: APRIL ................................................................................................. 38
6.19. 3G VOICE 3 DAYS LIVE DATA: MAY ................................................................................................... 39
6.20. 3G VOICE 3 DAYS LIVE DATA: JUNE .................................................................................................. 39
6.21. PMR MONTHLY 2G WIRELESS DATA - CONSOLIDATED ......................................................... 40
6.22. PMR MONTHLY 2G WIRELESS DATA – APRIL ........................................................................... 40
6.23. PMR MONTHLY 2G WIRELESS DATA - MAY .............................................................................. 41
6.24. PMR MONTHLY 2G WIRELESS DATA – JUNE ............................................................................. 42
6.25. WIRELESS DATA 3G MONTHLY PMR CONSOLIDATED ........................................................... 42
6.26. WIRELESS DATA 3G MONTHLY PMR – APR .............................................................................. 43
6.27. WIRELESS DATA 3G MONTHLY PMR – MAY ............................................................................. 44
6.28. WIRELESS DATA 3G MONTHLY PMR – JUNE ............................................................................ 44
6.29. 3 DAYS LIVE WIRELESS DATA 2G PMR – APRIL...................................................................... 45
6.30. 3 DAYS LIVE WIRELESS DATA 2G PMR – MAY ........................................................................ 45
6.31. 3 DAYS LIVE WIRELESS DATA 2G PMR – JUNE....................................................................... 46
6.32. 3 DAYS LIVE WIRELESS DATA 2G PMR – CONSOLIDATED .................................................. 46
6.33. 3 DAYS LIVE WIRELESS DATA 3G PMR – APRIL...................................................................... 47
6.34. 3 DAYS LIVE WIRELESS DATA 3G PMR – MAY ........................................................................ 47
6.35. 3 DAYS LIVE WIRELESS DATA 3G PMR – JUNE....................................................................... 48
6.36. 3 DAYS LIVE WIRELESS DATA 3G PMR – CONSOLIDATED ................................................... 49
6.37. POI CONGESTION: CONSOLIDATED ................................................................................................... 49
6.38. POI CONGESTION: APRIL ................................................................................................................. 50
6.39. POI CONGESTION: MAY ................................................................................................................... 50
6.40. POI CONGESTION: JUNE .................................................................................................................. 50
7. CUSTOMER SERVICE DELIVERY .................................................................................................................... 51 7.1. BILLING AND CUSTOMER CARE ............................................................................................................. 51
7.2. LIVE CALLING DATA: CONSOLIDATED .................................................................................................... 52
7.3. 3 DAYS LIVE CALL CENTRE DATA ......................................................................................................... 52
8. L1 CALLING DATA ........................................................................................................................................ 53 8.1. SHAHJAHANPUR ................................................................................................................................... 53
8.2. MIRZAPUR ........................................................................................................................................... 62
8.3. BASTI................................................................................................................................................. 67
9. OPERATOR ASSISTED DRIVE TEST ................................................................................................................ 74 9.1. MAY: SHAHJAHANPUR SSA ............................................................................................................. 74
9.2. DISTANCE COVERED: SHAHJAHANPUR SSA ..................................................................................... 74
9.3. ROUTE MAP: SHAHJAHANPUR SSA: DAY 1 ...................................................................................... 75
9.4. ROUTE MAP: SHAHJAHANPUR SSA: DAY 2 ...................................................................................... 75
9.5. ROUTE MAP: SHAHJAHANPUR SSA: DAY 3 ...................................................................................... 76
9.6. DRIVE TEST OUTCOME ......................................................................................................................... 76
9.7. MAY: MIRZAPUR SSA ....................................................................................................................... 77
9.8. DISTANCE COVERED: MIRZAPUR SSA ............................................................................................... 77
9.9. ROUTE MAP: MIRZAPUR SSA: DAY 1 ................................................................................................. 77
9.10. ROUTE MAP: MIRZAPUR SSA: DAY 2 ............................................................................................. 78
9.11. ROUTE MAP: MIRZAPUR SSA: DAY 3 ............................................................................................. 79
9.12. DRIVE TEST OUTCOME ..................................................................................................................... 79
9.13. BASTI SSA..................................................................................................................................... 80
9.14. DISTANCE COVERED: BASTI SSA .................................................................................................... 80
9.15. ROUTE MAP: BASTI SSA: DAY 1 ....................................................................................................... 80
9.16. ROUTE MAP: BASTI SSA: DAY 2 ....................................................................................................... 81
9.17. ROUTE MAP: BASTI SSA: DAY 3 ....................................................................................................... 82
9.18. DRIVE TEST OUTCOME ..................................................................................................................... 82
10. COUNTER DETAILS ....................................................................................................................................... 83

April to June 2016 – UP East Circle 4
10.1. ERICSSON ....................................................................................................................................... 84
10.2. NSN (NOKIA SIEMENS NETWORK) .................................................................................................... 85
10.3. HUAWEI ........................................................................................................................................... 85
11. BLOCK SCHEMATIC DIAGRAM ....................................................................................................................... 87 11.1. ERICSSON ....................................................................................................................................... 87
11.2. NSN ............................................................................................................................................... 88
11.3. HUAWEI ........................................................................................................................................... 89
12. ABBREVIATIONS ........................................................................................................................................... 90 13. ANNEXURE .................................................................................................................................................. 91 14. KEY FINDINGS ............................................................................................................................................ 122

April to June 2016 – UP East Circle 5
1. INTRODUCTION
1.1. ABOUT TRAI
TRAI's mission is to create and nurture conditions for growth of telecommunications in the country in a
manner and at a pace that will enable India to play a leading role in the emerging global information society.
One of the main objectives of TRAI is to provide a fair and transparent policy environment which promotes
a level playing field and facilitates fair competition.
In pursuance of above objective, TRAI has been issuing regulations, order and directives to deal with the
issues or complaints raised by the operators as well as the consumers. These regulations, order and
directives have helped to nurture the growth of multi operator multi service - an open competitive Junket
from a government owned monopoly. Also, the directions, orders and regulations issued cover a wide
range of subjects including tariff, interconnection and quality of service as well as governance of the
Authority.
TRAI initiated a regulation - The Standard of Quality of Service of Basic Telephone Service (Wireline) and
Cellular Mobile Telephone Service regulations, 2009 (7 of 2009) dated June 20, 2009 and Quality of
Service of Broadband Service Regulations, 2006 (11 of 2006) dated April 6, 2006 that provide the
benchmarks for the parameters on customer perception of service to be achieved by service provider.
In order to assess the above regulations, TRAI has commissioned a third party agency to conduct the audit
of the service providers and check the performance of the operators on the various benchmarks set by
Telecom Regulatory Authority of India (TRAI).
1.2. ABOUT PHISTREAM CONSULTING PRIVATE LIMITED
Phistream Consulting Private Limited is an ISO:9001 certified company who are one of the pioneers in the
field of technical audit, quality assurance and third party inspection services. Established more than a
decade ago in 2004, we aspire to provide longer term savings based on year-on-year productivity. With
our size, we are nimble and aspire to being a full service partner for providing consultancy services.
We have been helping our clients by determining the best solutions and enabling businesses to enjoy the
benefits of top-notch support without distracting their team from the main business focus. Our business
analysts have enough experience to get involved at the requirements gather stage through consulting work
handing off a detailed requirements document to our operations staff who in turn can train our support and
maintenance resources for ongoing engagement.
In keeping with our goal of being a one stop quality assurance and consulting partner, our specialists
employ a strategy and consulting-based implementation methodology and capitalize on strong program
governance to offer a wide range of services for various industry verticals.
1.3. OBJECTIVES
The primary objective of the Audit module is to:
Audit and Assess the Quality of Services being rendered by Basic (Wireline), Cellular Mobile
(Wireless), and Broadband service against the parameters notified by TRAI. (The parameters of
Quality of Services (QoS) have been specified by in the respective regulations published by TRAI).
This report covers the audit results of the audit conducted for Cellular Mobile (Wireless) services in
UP East circle.

April to June 2016 – UP East Circle 6
1.4. COVERAGE
The audit was conducted in UP East Circle covering all SSAs (Secondary Switching Areas).
Image Source: Map of India

April to June 2016 – UP East Circle 7
1.5. SSA & SDCA LIST
S. No. Circle SSA Name SDCA Name
1 UPE Allahabad Allahabad
2 UPE Allahabad Bharwari
3 UPE Allahabad Karchhana (shankergarh)
4 UPE Allahabad Meja (sirsa)
5 UPE Allahabad Phoolpur
6 UPE Allahabad Soraon
7 UPE Azamgarh Azamgarh
8 UPE Azamgarh Ghosi
9 UPE Azamgarh Lalganj
10 UPE Azamgarh MaunathbhanApr
11 UPE Azamgarh Phulpur-i (phulpur)
12 UPE Azamgarh Phulpur-ii (atrawlia)
13 UPE Azamgarh Sagri
14 UPE Bahraich Bahraich-i (bahrailh)
15 UPE Bahraich Bahraich-ii (bhinga)
16 UPE Bahraich Kaisarganh-ii (mahasi)
17 UPE Bahraich Kaisarganj-i (kaiserganj)
18 UPE Bahraich Nanparah-ii (mihinpurwa)
19 UPE Bahraich Nanpara-i (nanpara)
20 UPE Ballia Ballia-i (ballia)
21 UPE Ballia Ballia-ii (raniganj)
22 UPE Ballia Bansdeeh
23 UPE Ballia Rasara
24 UPE Banda Baberu
25 UPE Banda Banda
26 UPE Banda Karvi -i (karvi)
27 UPE Banda Karvi-ii (manikpur)
28 UPE Banda Mau (rajapur)
29 UPE Banda Naraini (attarra)
30 UPE Barabanki Barabanki
31 UPE Barabanki Fatehpur
32 UPE Barabanki Haidergarh
33 UPE Barabanki Ramsanehi ghat
34 UPE Basti Bansi
35 UPE Basti Basti
36 UPE Basti DoJuniyaganj
37 UPE Basti Harraiya
38 UPE Basti Khalilabad -i
39 UPE Basti Khalilabad-ii (mehdawal)
40 UPE Basti Naugarh-i (tetribazar)
41 UPE Basti Naugarh-ii (barhani)

April to June 2016 – UP East Circle 8
42 UPE Deoria Captanganj (khadda)
43 UPE Deoria Captanganj-i (captanganj)
44 UPE Deoria Deoria
45 UPE Deoria Padrauna
46 UPE Deoria Salempur-i (salempur)
47 UPE Deoria Salempur-ii (barhaj)
48 UPE Etawah Auraiya
49 UPE Etawah Bharthana
50 UPE Etawah Bidhuna
51 UPE Etawah Etawah
52 UPE Faizabad Akbarpur-i (akbarpur)
53 UPE Faizabad Akbarpur-ii (jalalpur)
54 UPE Faizabad Bikapur
55 UPE Faizabad Faizabad
56 UPE Faizabad Tanda-ii (baskhari)
57 UPE Faizabad Tandai-i (tanda)
58 UPE Farrukhabad Chhibramau
59 UPE Farrukhabad Farrukhabad (fategarh)
60 UPE Farrukhabad Kaimganj
61 UPE Farrukhabad Kannauj
62 UPE Fatehpur Bindki
63 UPE Fatehpur Fateh-pur-i (fatehpur)
64 UPE Fatehpur Fatehpur-ii (gazipur)
65 UPE Fatehpur Khaga
66 UPE Ghazipur Ghazipur
67 UPE Ghazipur Mohamdabad
68 UPE Ghazipur Saidpur
69 UPE Ghazipur Zamania
70 UPE Gonda Balarampur-i (balrampur)
71 UPE Gonda Balarampur-ii (tulsipur)
72 UPE Gonda Gonda
73 UPE Gonda Tarabganj-i (terabganj)
74 UPE Gonda Tarabganj-ii (colonelganj)
75 UPE Gonda Utraula
76 UPE Gorakhpur Bansgaon -i (bansgaon)
77 UPE Gorakhpur Bansgaon-ii (barhal ganj)
78 UPE Gorakhpur Gorakhpur
79 UPE Gorakhpur Maharajganj
80 UPE Gorakhpur Pharenda-i (compierganj)
81 UPE Gorakhpur Pharenda-ii (anand nagar)
82 UPE Hamirpur Charkhari
83 UPE Hamirpur Hamirpur
84 UPE Hamirpur Mahoba
85 UPE Hamirpur Maudaha

April to June 2016 – UP East Circle 9
86 UPE Hamirpur Rath
87 UPE Hardoi Bilgam-i (madhoganj)
88 UPE Hardoi Bilgram-ii (sandi)
89 UPE Hardoi Hardoi-i (hardoi)
90 UPE Hardoi Hardoi-ii (baghavli)
91 UPE Hardoi Sandila
92 UPE Hardoi Shahabad
93 UPE Jaunpur Jaunpur
94 UPE Jaunpur Kerakat
95 UPE Jaunpur Machlishahar
96 UPE Jaunpur Juniyahu
97 UPE Jaunpur Shahganj
98 UPE Jhansi Chirgaon (moth)
99 UPE Jhansi Garauth
100 UPE Jhansi Jhansi
101 UPE Jhansi Lalitpur-i (lalitpur)
102 UPE Jhansi Lalitpur-ii (talbehat)
103 UPE Jhansi Mauranipur
104 UPE Jhansi Mehraun
105 UPE Kanpur Akbarpur
106 UPE Kanpur Bhognipur (pakhrayan)
107 UPE Kanpur Bilhaur
108 UPE Kanpur Derapur (jhinjak)
109 UPE Kanpur Ghatampur
110 UPE Kanpur Kanpur
111 UPE Lakhimpur kheri Kheri-i (kheri)
112 UPE Lakhimpur kheri Kheri-ii (bhira)
113 UPE Lakhimpur kheri Mohamdi-i (mohamdi)
114 UPE Lakhimpur kheri Mohamdi-ii (maigalganj)
115 UPE Lakhimpur kheri Nighasan-i (palliakalan)
116 UPE Lakhimpur kheri Nighasan-ii (tikonia)
117 UPE Lakhimpur kheri Nighasan-iii (dhaurahra)
118 UPE Lucknow Lucknow
119 UPE Lucknow Malihabad
120 UPE Mainpuri Bhogaon
121 UPE Mainpuri Jasrana
122 UPE Mainpuri Karhal
123 UPE Mainpuri Mainpuri
124 UPE Mainpuri Shikohabad
125 UPE Mirzapur Chunur
126 UPE Mirzapur Dudhi-i (dudhi)
127 UPE Mirzapur Dudhi-ii (pipri)
128 UPE Mirzapur Mirzapur-i (mirzapur)
129 UPE Mirzapur Mirzapur-ii (hallia)

April to June 2016 – UP East Circle 10
130 UPE Mirzapur Robertsganj -ii (obra)
131 UPE Mirzapur Robertsganj-i
132 UPE Orai Jalaun
133 UPE Orai Kalpi
134 UPE Orai Konch
135 UPE Orai Orai
136 UPE Pratapgarh Kunda
137 UPE Pratapgarh Patti
138 UPE Pratapgarh Pratapgarh
139 UPE Raibareilly Dalmau-i (dalmau)
140 UPE Raibareilly Dalmau-ii (lalganj)
141 UPE Raibareilly Raibareli
142 UPE Raibareilly Salon -i (salon)
143 UPE Raibareilly Salon-ii (jais)
144 UPE Sahjahanpur Jalalabad
145 UPE Sahjahanpur Powayan
146 UPE Sahjahanpur Shahjahanpur
147 UPE Sahjahanpur Tilhar
148 UPE Sitapur Biswan
149 UPE Sitapur Misrikh -i (misrikh)
150 UPE Sitapur Misrikh-ii (aurangabad)
151 UPE Sitapur Sidhauli (mahmodabad)
152 UPE Sitapur Sitapur
153 UPE Sultanpur Amethi
154 UPE Sultanpur Kadipur
155 UPE Sultanpur Musafirkhana
156 UPE Sultanpur Sultanpur
157 UPE Unnao Hasanganj
158 UPE Unnao Purwa (bighapur)
159 UPE Unnao Safipur
160 UPE Unnao Unnao
161 UPE Varansi Bhadohi
162 UPE Varansi Chakia
163 UPE Varansi Chandauli (mugalsarai)
164 UPE Varansi Varansi

April to June 2016 – UP East Circle 11
1.6. FRAMEWORK USED
Audit Activities
PMR Reports
Monthly PMR
3 Days Live Data
Customer Service
Drive Test
Operator Assisted
Independent
Level 1 Service
CSD Audit
Billing Complain
Service request
Customer Service
Wireline & Broadband
Billing Complain
Service Request
Level 1 Service
Customer Service
Inter Operator Call Assessment

April to June 2016 – UP East Circle 12
2. PMR REPORTS
Significance and methodology: PMR or Performance Monitoring Reports are generated to assess the
various Quality of Service parameters involved in the mobile telephony service, which indicate the overall
health of service for an operator.
The PMR report for network parameters is taken for each month of the audit quarter and is extracted and
verified in the first week of the subsequent month of the audit month. For example, April 2016 audit data was
collected in the month of May 2016.
The PMR report for customer service parameters is extracted from Customer Service Centre and verified
once every quarter in the subsequent month of the last month of the quarter. For example, data for quarter
ending June 2016 was collected in the month of June 2016.
The raw data extracted from operator’s systems is used to create PMR in the following three formats:
Monthly PMR (Network Parameters)
3 Day Live Measurement Data (Network Parameters)
Customer Service Data
Let us understand these formats in details.
The TSP is intimated about the audit schedule in advance and accordingly the auditor visits the TSP premises to conduct the audit
Raw Data is extracted from the operator’s NOC/OMCR/call centre/billing centre etc. by the auditor with assistance from the operator personnel in order to generate PMR reports (Network/ Billing/ Customer Service etc.)
Calculations are done to generate new PMR from the RAW data
Hard copy of the PMR is duly signed by the auditor and competent authority from operator end.

April to June 2016 – UP East Circle 13
2.1. MONTHLY PMR
This involved calculation of the various Quality of Service network parameters through monthly Performance
Monitoring Reports (PMR). The PMR reports were generated from the data extracted from operator’s
systems by the auditor with the assistance of the operator at the operator’s premises for the month of April,
May and June 2016. The performance of operators on various parameters was assessed against the
benchmarks.
Parameters Includes:
• BTS accumulated downtime • Worst affected BTS due to downtime
Network Availability
• Call Set Up success Rate (CSSR)
Connection Establishment (Accessibility)
• SDCCH/Paging Channel Congestion • TCH Congestion • Point of Interconnection
Network Congestion Parameters
• Call Drop rate • Worst affected cells having more than 3% TCH drop
Connection Maintenance
• % Connections with good voice quality
Voice Quality

April to June 2016 – UP East Circle 14
Y PMR
2.2. AUDIT PARAMETER: NETWORK
Let us now look at the various parameters involved in the audit reports.
2.3. DATA EXTRACTION POINTS
The data is extracted from a terminal/computer connected to OMCR & OSS on the operator network.

April to June 2016 – UP East Circle 15
2.4. AUDIT PROCEDURE
Extracted data is calculated as per the counter details provided by the operators. The details of counters
have been provided in the report. The calculation methodology for each parameter has been stated in the
table given below:
Tender document and latest list of licencees as per TRAI is taken as a reference document for assimilating the presence of operators. All the wireless operators are then informed about
the audit schedule
Audit formats and schedule is shared with the operators in advance. Details include day of the visit and date of 3 day data
collection and other requirements.
Auditors visit the operator's server/exchange/central NOC to extract data from operator's systems. Operator personnel assist
the auditor in extraction process.
The extracted data is validated and verfied by the Auditors.
Auditors then prepare a PMR report from the extracted data with assistance from the operator.

April to June 2016 – UP East Circle 16
2.5. NETWORK CALCULATION METHODOLOGY
Parameter Calculation Methodology
BTS Accumulated Downtime
Sum of downtime of BTSs in a month in hours i.e.
total outage time of all BTSs in hours during a month / (24 x Number of days in a month x
Number of BTSs in the network in licensed service area) x 100
Worst Affected BTS Due to Downtime
(Number of BTSs having accumulated downtime greater than 24 hours in a month / Number of
BTS in
Licensed Service Area) * 100
Call Setup Success Rate (Calls Established / Total Call Attempts) * 100
SDCCH/ Paging Channel Congestion
SDCCH / TCH Congestion% = [(A1 x C1) + (A2 x C2)
+…….+ (An x Cn)] / (A1 + A2 +…+ An)
Where:
A1 = Number of attempts to establish SDCCH / TCH made on day 1
C1 = Average SDCCH / TCH Congestion % on day 1 A2 = Number of attempts to establish
SDCCH / TCH made on day 2
TCH Congestion
C2 = Average SDCCH / TCH Congestion % on day 2 An = Number of attempts to establish
SDCCH / TCH made on day n
Cn = Average SDCCH / TCH Congestion % on day n
POI Congestion
POI Congestion% = [(A1 x C1) + (A2 x C2) +…….+ (An x Cn)] / (A1 + A2 +…+ An) Where:
A1 = POI traffic offered on all POIs (no. of calls) on day 1
C1 = Average POI Congestion % on day 1
A2 = POI traffic offered on all POIs (no. of calls) on day 2
C2 = Average POI Congestion % on day 2
An = POI traffic offered on all POIs (no. of calls) on day n
Cn = Average POI Congestion % on day n
Call Drop Rate Total Calls Dropped / Total Calls Established x 100
Worst Affected Cells having more
than 3%
TCH drop
Total number of cells having more than 3% TCH drop during CBBH/ Total number of cells in the
LSA x 100
Connections with good voice quality No. of voice samples with good voice quality / Total number of samples x 100

April to June 2016 – UP East Circle 17
2.6. 3G VOICE
S. No. Name of Parameter Definition Formula Benchmark
1 Network Availability
a. Total no. of Node B's
in LSA Total no. of Node B's
Licensed in LSA
b. Total downtime of all
Node B's
When all the sector(s) of a Node B's are down for > 60 minutes at an instant in a
whole day
c. No. of Worst
Affected Node B's
Node B'ss having more than 24 hours of Downtime in 3
Days
No. of Node B's having accumulated downtime of >24 hours in a month
<=2% ((No. of Node B's having Accumulated Downtime of > 24 hrs in a month) / Total no. of BTSs in the
licensed service area)*100
d. Node B's
accumulated downtime
Node B's downtime more than 24 hr in 3 days
Total no. of Node B's in the Licensed Service Area
<=2%
Sum of downtime of Node B's in a month in hours i.e. total outage time of all Node B's in
hours in a month
[(Sum of downtime of Node B's in a month in hrs)/(24* no. of days in the month*no. of Node
B's in the licensed service area)]*100
2 Connection Establishment (Accessibility)
a. Call Setup Success
Rate:
It is the % of total no. of call established to the total no.
of call attempt
Total No. of Voice Call Attempts
>=95%
Total No. of Voice Call Establishment
CSSR (Call Setup Success Rate = (Total No. of Voice Call Attempts/ Total No. of Voice Call
Establishment)*100)
b. RRC Congestion:
RRC Congestion rate is the % of Total No. of RRC
Failed Calls to the Total no. of RRC Assigned Calls
RRC Attempts (RRC Connection Access) (A)
<=1% RRC Failed (RRC Connection Access Failed) (B)
RRC Congestion (%) [B/A]*100
c. RAB Congestion:
RAB Congestion rate is the % of Total No. of RAB
Failed Calls to the Total no. of RAB Assigned Calls
RAB Attempts (RAB Setup Access) (C)
<=2% RAB Failed (RAB Setup Access Failed) (D)
RAB Congestion (%) [D/C]*100
3 Connection Maintenance (Retainability)
a. Circuit Switched Voice Drop Rate
It is the % of total no. of Dropped Calls to the total no. of Calls Established
Total Established Calls (A)
<=2% Calls Dropped after Establishment (B)
Call Drop Rate [B/A]*100
b. Total No. of Cells (Sector) <=3%

April to June 2016 – UP East Circle 18
Worst affected cells having more than 3%
Circuit Switched Voice Drop Rate:
It is the % of total no. of Cells having > 3% Circuit
Switched Voice drop to the total no. cells
Total No. of Cells exceeding 3% Circuit Switched Voice Drop Rate in CBBH (Cell Bouncing Busy
Hour)
% of cells having more than 3% Circuit Switched Voice Drop Rate [(No. of cells having Circuit
Switched Voice Drop Rate > 3% during CBBH in 31 days*100) / Total no. of cells in the licensed
service area]
c.
Percentage of connections with
Good Circuit Switched Voice
Quality
It can be defined as the % of Good Voice Quality
Samples to the total No. of Quality Samples
Percentage of connection with Good Circuit Switched Voice Quality
>=95%
4
Total No. of POI’s in Month having >=0.5% POI congestion
Total no. Of POI's which are exceeding the POI
congession more than 0.5 %.
Total No. of call attempts on POI
<=0.5%
Total traffic served on all POIs (Erlang)
Total No. of circuits on all individual POIs
Total number of working POI Service Area wise
Capacity of all POIs
No. of all POI’s having >=0.5% POI congestion
Name of POI not meeting the benchmark (having >=0.5% POI congestion)

April to June 2016 – UP East Circle 19
2.7. 2G & 3G WIRELESS
S. No. Name of Parameter Definition Formula Benchmark
1 Service Activation/
Provisioning
This refers to the activation of services after activation of the SIM. This involves programming the various databases with
the customer's information and any gateways to standard Internet chat or
mail services or any data services.
Total No. of Subscribers for Service Activation (A)
Within 4 Hours with 95%
Success Rate Total Service Activations provided within 4 Hours (B)
Service Activation / Provisioning = (B/A) * 100
2 PDP Context Activation
Success Rate
PDP Context Activation Success Rate is the ratio of total number of successfully
completed PDP context activations to the total attempts of context activation
Total No. of PDP Context Activation Requests (from
SGSN to GGSN) (A)
>=95%
Total No. of PDP Context Activation Success (path created b/w SGSN and
GGSN) (B)
PDP Context Activation Success Rate =(B/A) *100
3 Drop Rate
It measures the inability of Network to maintain a connection and is defined as
the ratio of abnormal disconnects w.r.t. all disconnects.
RNC originated PS Domain Iu Connection Setup
Success (A)
<=5% RNC originated PS Domain Iu Connection Release (B)
Drop Rate = (B/A) * 100

April to June 2016 – UP East Circle 20
3. 3 DAYS LIVE DATA
The main purpose of 3 day live measurement is to evaluate the network parameters on intraday basis. While
the monthly PMR report provides an overall view of the performance of QoS parameters, the 3 day live data
helps looking at intraday performance on the network parameters discussed earlier. All the calculations are
done on the basis of that raw data of 3 days.
The 3 day live data provides a sample of 9 days in a quarter (3 days each month of a quarter) with hourly
performance, which enables the auditor to identify and validate intraday issues for an operator on the Q0S
network parameters. For example, network congestion being faced by an operator during busy/peak hours.
Network related parameters were evaluated for a period of 3 days in each month. 3 day live audit was
conducted for 3 consecutive weekdays for each month. The data was extracted from each operator’s server/
NOC etc. at the end of the 3rd day. The extracted data is then used to create a report (similar to PMR report)
to assess the various QoS parameters.
3.1. TCBH: SIGNIFICANCE AND SELECTION METHODOLOGY
As per QoS regulations 2009 (7 of 2009), Time Consistent Busy Hour” or “TCBH” means the one hour period
starting at the same time each day for which the average traffic of the resource group concerned is greatest
over the days under consideration and such Time Consistent Busy Hour shall be established on the basis
of analysis of traffic data for a period of ninety days.
During audit, the auditors identified from the raw data that the TCBH for the operators in Apr – May – Jun
2016 was the time period as given below:
Aircel Airtel BSNL Idea RCOM CDMA
RCOM GSM
TTSL CDMA
TTSL GSM
Telenor Videocon Vodafone
19:00-20:00
19:00-20:00
19:00-20:00
19:00-20:00
19:00-20:00
19:00-20:00
19:00-20:00
19:00-20:00
19:00-20:00
19:00-20:00
19:00-20:00
Daywise RAW Data is fetched from the operator's OMCR and kept in readable format (preferably in MS- Excel). Data for a period of 90 days is used to identify TCBH.
90 Days period is Junided upon the basis of month of audit. For example, for the audit of June 2016, the 90 day period data used to identify TCBH would be the data of April, May & June 2016.
For each day, the hour in which average traffic of the resource group concerned is greatest for the day will be the 'Busy Hour' for the operator.
The model frequency of te busy hour is calculated for 90 days period and the hour with highest model frequency will beconsidered as TCBH for the operator.
April to June 2016 – UP East Circle 21
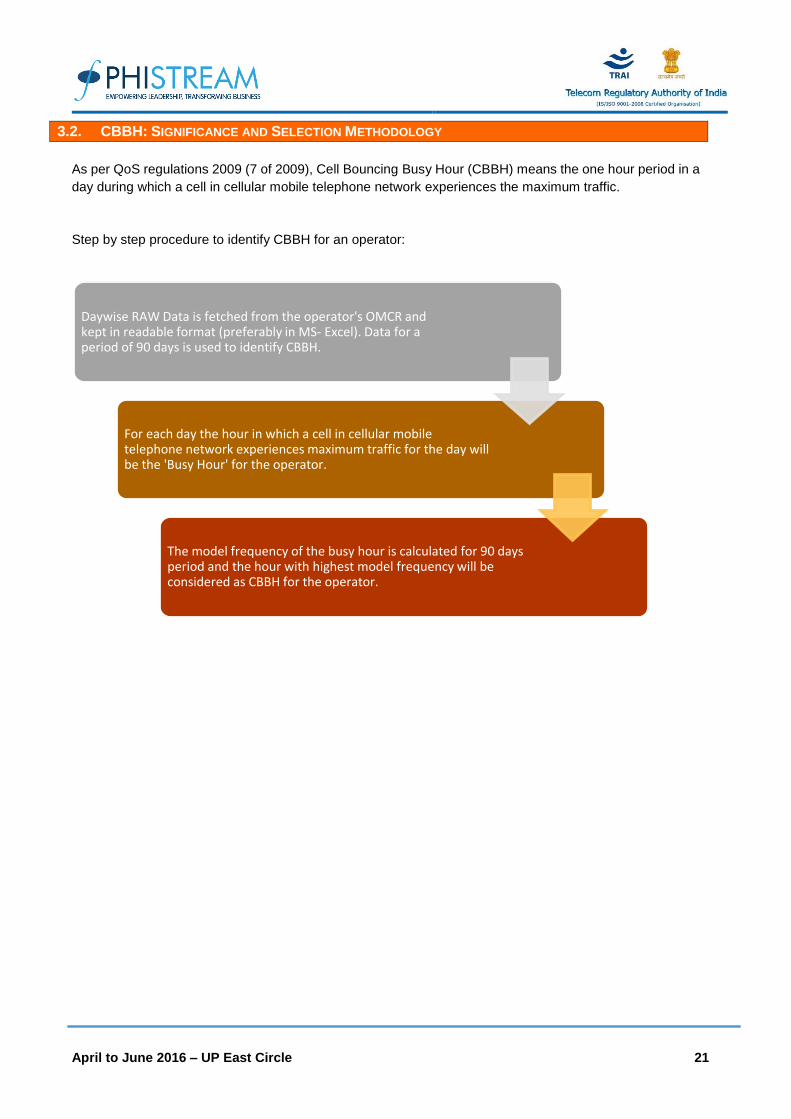
3.2. CBBH: SIGNIFICANCE AND SELECTION METHODOLOGY
As per QoS regulations 2009 (7 of 2009), Cell Bouncing Busy Hour (CBBH) means the one hour period in a
day during which a cell in cellular mobile telephone network experiences the maximum traffic.
Step by step procedure to identify CBBH for an operator:
Daywise RAW Data is fetched from the operator's OMCR and kept in readable format (preferably in MS- Excel). Data for a period of 90 days is used to identify CBBH.
For each day the hour in which a cell in cellular mobile telephone network experiences maximum traffic for the day will be the 'Busy Hour' for the operator.
The model frequency of the busy hour is calculated for 90 days period and the hour with highest model frequency will be considered as CBBH for the operator.

April to June 2016 – UP East Circle 22
4. CUSTOMER SERVICE PARAMETERS
The data to generate PMR report for customer service parameters is extracted at the operator premises and
verified once every quarter in the subsequent month of the last month of the quarter. For example, data for
quarter ending June 2016 was collected in the month of June 2016. To extract the data for customer service
parameters for the purpose of audit, auditors primarily visit the following locations/ departments/ offices at
the operator’s end.
Central Billing Center
Central Customer Service Center
The operators are duly informed in advance about the audit schedule.
The Customer Service Quality Parameters include the following:
Metering and billing credibility (post-paid and prepaid)
Resolution of billing/charging complaints
Period of applying credit/waiver/adjustment to customer’s account
Response time to the customer for assistance
Termination/closure of service
Time taken for refund of security deposit after closures.
Most of the customer service parameters were calculated by averaging over the quarter; however billing
parameters were calculated by averaging over one billing cycle for a quarter. All the parameters have been
described in detail along with key findings of the parameter in the report.
The benchmark values for each parameter have been given in the table below.
4.1. AUDIT PARAMETERS: CUSTOMER SERVICE

April to June 2016 – UP East Circle 23
4.2. CALCULATION METHODOLOGY: CUSTOMER SERVICE PARAMETER
Parameter Calculation Methodology
Metering and billing credibility : Post-paid Total billing complaints received during the relevant billing cycle / Total bills
generated during the relevant billing cycle *100
Metering and billing credibility : Pre-paid Total charging complaints received during the quarter/ Total number of
subscribers reported by the operator at the end of the quarter * 100
Resolution of billing/ charging complaints
(Post-paid + Pre-paid)
There are two benchmarks involved here:
Billing or Charging Complaints resolved in 4 weeks from date of receipt / Total
billing or charging complaints received during the quarter) x 100
Billing or Charging Complaints resolved in 6 weeks from date of receipt / Total
billing or charging complaints received during the quarter) x 100
Period of applying credit waiver Number of cases where credit waiver is applied within 7 days/ total number of
cases eligible for credit waiver * 100
Call centre performance IVR (Calling getting
connected and answered by IVR)
Number of calls connected and answered by
IVR/ All calls attempted to IVR * 100
Call centre performance (Voice to Voice)
Call centre performance Voice to Voice =
(Number of calls answered by operator within 90 seconds/ All calls attempted to
connect to the operator) * 100
The calculation excludes the calls dropped before 90 seconds
Time taken for termination/ closure of service Number of closures done within 7 days/ total number of closure requests * 100
Time taken for refund for deposit after
closures
Number of cases of refund after closure done within 60 days/ total number of
cases of refund after closure * 100

April to June 2016 – UP East Circle 24
4.3. LIVE CALLING: SIGNIFICANCE AND METHODOLOGY
Live calling activity was carried out during the period of June 2016. The data considered for live calling was
for the month prior to the month in which the live calling activity was being conducted. In this case, data of
April 2016 was considered for live calling activity conducted in May 2016.
A detailed explanation of each parameter is explained below:
4.4. BILLING COMPLAINTS
Live calling is done to verify Resolution of billing complaints within stipulated time. The process for this
parameter is stated below:
Auditors request the operator provided the database of all the subscribers who reported billing
complaints in one month prior to the auditor visit. In case of BSNL, data for the complaints from the
subscribers belonging to the sample exchanges is requested specifically.
A sample of 10% or 100 complainants, whichever is less, is selected randomly from the list provided
by operator.
Calls are made by auditors to the sample of subscribers to check and record whether the complaint was
resolved within the timeframes as mentioned in the benchmark.
All the complaints related to billing as per clause 3.7.2 of QoS regulation of 20th June, 2016 were considered
as population for selection of samples.
TRAI Benchmark: Resolution of billing/ charging complaints: 98% within 4 weeks, 100% within 6 weeks.
The auditor visits the operator premises for Live Calling. Theoperators provide the RAW data of customer complaints (billingand services) and also the list of customer service numbers tobe verified through live calling
The auditor makes the live calls using operator SIM to a random sample of subscribers from the RAW data provided to verify the resolution of complaints
The auditor verifies the performance of call centre, level 1services by calling the numbers using operator SIM. The list ofcall centre numbersis provided by the operator.
The auditors also make test calls to subscribers of otheroperators to assess the inter-operator call connectivity in thesame licensed service area

April to June 2016 – UP East Circle 25
4.5. SERVICE COMPLAINTS REQUESTS
“Service request” means a request made to a service provider by its consumer pertaining to his account,
and includes:
A request for change of tariff plan
A request for activation or deactivation of a value added service or a supplementary service or a
special pack
A request for activation of any service available on the service provider’s network
A request for shift or closure or termination of service or for billing details
All the complaints other than billing were covered. A total of 100 calls per service provider for each service
in licensed service area were done by the auditors.
4.6. LEVEL 1
Level 1 is used for accessing special services like emergency services, supplementary services, inquiry and
operator-assisted services.
Level 1 Services include services such as police, fire, ambulance (Emergency services). Test calls were
made from operator SIMs. A total of 195 test calls were made per service provider in each SDCA where the
drive test was conducted in the quarter.
While most of the Level 1 services are toll free, it has been observed that some Level 1 services may not be
toll free. In April, May and June’15, auditor has tried contacting the list of Level 1 services provided by TRAI
as per the NNP (National Numbering Plan).
4.7. PROCESS TO TEST LEVEL 1 SERVICE
During the operator assisted drive test, auditors ask the operator authorized personnel to make 5
calls in each SDCA on the Level 1 Service numbers provided by TRAI. The list contains a description
of the numbers along with dialling code.
Operators might also provide a list of L1 services. To identify emergency L1 service numbers,
auditors check if there is any number that starts with code ‘10’ in that list. If auditors find any
emergency number in addition to the below list, that number is also tested during live calling.
On receiving the list, auditors verify it if the below given list of numbers are active in the service
provider’s network.
If there are any other additional numbers provided by the operator, auditors also do live calling on
those numbers along with below list.
If any of these numbers is not active, then we would write the same in our report, auditors write in
the report.
Post verifying the list, auditors do live calling by equally distributing the calls among the various
numbers and update the results in the live calling sheet.

April to June 2016 – UP East Circle 26
L1 Number Details
100 Police
101 Fire
102 Ambulance
104 Health Information Helpline
108 Emergency and Disaster Management Helpline
138 All India Helpine for Passangers
149 Public Road Transport Utility Service
181 Chief Minister Helpline
182 Indian Railway Security Helpline
1033 Road Accident Management Service
1037 Public Grievance Cell DoT HQ as 'Telecom Consumer Grievance Redressal Helpline'
1056 Emergency Medical Services
106X State of the Art Hospitals - AIIMS
1063 Public Grievance Cell DoT Hq
1064 Anti Corruption Helpline
1070 Relief Commission for Natural Calamities
1071 Air Accident Helpline
1072 Rail Accident Helpline
1073 Road Accident Helpline
1077 Control Room for District Collector
1090 Call Alart ( Crime Branch)
1091 Women Helpline
1097 National AIDS Helpline to NACO
1099 Central Accident and Trauma Services (CATS)
10580 Educational& Vocational Guidance and Counselling
10589 Mother and Child Tracking ( MCTH)
10740 Central Pollution Control Board
10741 Pollution Control Board
1511 Police Related Service for all Metro Railway Project
1512 Prevention of Crime in Railway
1514 National Career Service(NCS)
15100 Free Legal Service Helpline
155304 Municipal Corporations
155214 Labour Helpline
1903 Sashastra Seema Bal (SSB)
1909 National Do Not Call Registry
1912 Complaint of Electricity
1916 Drinking Water Supply
1950 Election Commission of India

April to June 2016 – UP East Circle 27
4.8. CUSTOMER CARE
Live calling is done to verify response time for customer assistance is done to verify the performance of call
centre in terms of:
Calls getting connected and answered by operator’s IVR.
% age of calls answered by operator / voice to voice) within 90 seconds: In 95% of the cases or
more
The process for this parameter is stated below:
Overall sample size is 100 calls per service provider per circle at different points of time, evenly
distributed across the selected exchanges – 50 calls between 1100 HRS to 1400 HRS and 50 calls
between 1600 HRS to 1900 HRS.
Time to answer the call by the operator was assessed from the time interviewer pressed the requisite
button for being assisted by the operator.
All the supplementary services that have any kind of human intervention are to be covered here. It
also includes the IVR assisted services.
4.9. INTER OPERATOR CALL ASSESSMENT
A total of 100 calls per service provider to all the other service providers in a licensed service area were
done for the purpose of audit.
Inter Operator Call
Assessment Aircel Airtel BSNL Idea Reliance CDMA
Reliance GSM
TTSL CDMA
TTSL GSM
Telenor Videocon Vodafone
Aircel - 100% 100% 100% 100% 100% 100% 100% 100% 100% 100%
Airtel 100% - 100% 100% 100% 100% 100% 100% 100% 100% 100%
BSNL 100% 100% - 100% 100% 100% 100% 100% 100% 100% 100%
Idea 100% 100% 100% - 100% 100% 100% 100% 100% 100% 100%
Reliance CDMA 100% 100% 100% 100% - 100% 100% 100% 100% 100% 100%
Reliance GSM 100% 100% 100% 100% 100% - 100% 100% 100% 100% 100%
TTSL CDMA 100% 100% 100% 100% 100% 100% - 100% 100% 100% 100%
TTSL GSM 100% 100% 100% 100% 100% 100% 100% - 100% 100% 100%
Telenor 100% 100% 100% 100% 100% 100% 100% 100% - 100% 100%
Videocon 100% 100% 100% 100% 100% 100% 100% 100% 100% - 100%
Vodafone 100% 100% 100% 100% 100% 100% 100% 100% 100% 100% -

April to June 2016 – UP East Circle 28
5. DRIVE TEST: SIGNIFICANCE AND METHODOLOGY
Drive test, as the name suggests, is conducted to measure the outdoor coverage in a moving vehicle in a
specified network coverage area.
The main purpose of the drive test is to check the health of the mobile network of various operators in the
area in terms of coverage (signal strength), voice quality, call drop rate, call set up success rate etc.
To assess the indoor coverage, the test is also conducted at two static indoor locations in each SSA, such
as Malls, office buildings, shopping complexes, government buildings etc.
There are two types of drive test as mentioned below.
Operator Assisted Drive Test
Independent Drive Test
The main difference between the two is that in the operator assisted, operators participate in the drive test
along with their hardware, software, phones etc. while in the independent drive test PhiStream conducts the
drive test on solitary basis and uses its own hardware. Operators generally do not have any knowledge of
the independent drive test being conducted.
5.1. OPERATOR ASSISTED DRIVE TEST
UP East circle consist of total 32 SSA’s and each SSA needs to be audit in the span of 12 months.
The methodology adopted for the drive test:
3 consecutive days drive test in each SSA. SSA would be defined as per DOT guidelines and month
wise SSA list is finalized by regional TRAI office.
On an average, a minimum of 80 kilometres are covered each day
Route map was designed in such a way that all the major roads, highways and all the important
towns and villages were covered as part of audit.
Special emphasis was given to those areas where the number of complaints received were on the
higher side, if provided by TRAI.
The route is defined in a way that we cover maximum area in the SSA and try to cover maximum
villages and cities within the SSA. The route is designed such that there is no overlap of roads and
we can start from the point from where we had left last day (if possible).
The route was classified as – Within City, Major Roads, Highways, Shopping complex/ Mall and
Office Complex/ Government Building
There were no fixed calls which we need to do for within city, major roads and highways, but a
minimum of 30 calls in each route, i.e., within city, major roads and highways on each day. For
indoors, 20 calls each for shopping and office complex each day preferably in relatively bigger city.
The drive test covered selected cities and adjoining towns/rural areas where the service provider
has commenced service, including congested areas and indoor sites.
The drive test of each mobile network was conducted between 10 am and 8 pm on weekdays.
The Vehicle used in the drive tests was equipped with the test tool that automatically generates calls
on the mobile telephone networks.
The speed of the vehicle was kept at around 30 km/hr.
The holding period of each test call was 120 seconds.
A test call was generated 10 seconds after the previous test call is completed.
Height of the antenna was kept uniform in case of all service providers.

April to June 2016 – UP East Circle 29
5.2. INDEPENDENT DRIVE TEST
The number of independent drive tests to be conducted and their locations are Decided basis TRAI
recommendation.
A minimum of 80 kilometres was traversed during the independent drive test in a SSA. The SSA
would be defined as per BSNL and SSA list will be finalized by regional TRAI office.
Route map was designed in such a way that all the major roads, highways and all the important
towns and villages were covered as part of audit.
Special emphasis was given to those areas where the number of complaints received were on the
higher side, if provided by TRAI.
The route is defined in a way that we cover maximum area in the SSA and try to cover maximum
villages and cities within the SSA. The route is designed such that there is no overlap of roads (if
possible).
The route was classified as – Within city, Major Roads, Highways, Shopping complex/ Mall and
Office Complex/ Government Building
There were no fixed calls which we need to do for within city, major roads and highways, but a
minimum of 30 calls in each route, i.e., within city, major roads and highways on each day. For
indoors, 20 calls each for shopping and office complex each day preferably in relatively bigger city.
The drive test covered selected cities and adjoining towns/rural areas where the service provider
has commenced service, including congested areas and indoor sites.
The drive test of each mobile network was conducted between 10 am and 8 pm on weekdays.
The Vehicle used in the drive tests was equipped with the test tool that automatically generates calls
on the mobile telephone networks.
The speed of the vehicle was kept at around 30 km/hr.
The holding period of each test call was 120 seconds.
A test call was generated 10 seconds after the previous test call is completed.
Height of the antenna was kept uniform in case of all service providers.

April to June 2016 – UP East Circle 30
5.3. PARAMETERS EVALUATED DURING DRIVE TEST
The parameters which were captured during the drive test include. Below are the parameters which are
captured for the GSM and CDMA operators.
Coverage-Signal strength (GSM)
Total calls made (A)
Number of calls with signal strength between 0 to -75 dBm
Number of calls with signal strength between 0 to -85 dBm
Number of calls with signal strength between 0 to -95 dBm
Coverage-Signal strength (CDMA)
Total Ec/Io BINS (A)
Total Ec/Io BINS with less than –15 (B)
Low Interference = [1 - (B/A)] x 100
Voice quality (GSM)
Total RxQual Samples– A
RxQual samples with 0-5 value – B
%age samples with good voice quality = B/A x 100
Voice quality (CDMA)
Total FER BINs (forward FER) – A
FER BINs with 0-2 value (forward FER) – B
FER BINs with 0-4 value (forward FER) – C
%age samples with FER bins having 0-2 value (forward FER) = B/A x 100
%age samples with FER bins having 0-4 value (forward FER) = C/A x 100
No. of FER samples with value > 4 = [A-C]
Call setup success rate
Total number of call attempts – A
Total Calls successfully established – B
Call success rate (%age) = (B/A) x 100
Blocked calls
100% - Call Set up Rate
Call drop rate
Total Calls successfully established – A
Total calls dropped after being established – B
Call Drop Rate (%age) = (B/A) x 100

April to June 2016 – UP East Circle 31
6. EXECUTIVE SUMMARY
The objective assessment of Quality of Service (QoS) carried out gives an insight into the overall
performance of various operators in the UP East Circle, with a parameter wise performance evaluation as
compared to TRAI benchmark.
6.1. OPERATORS COVERED
TSP No. of cells BTS BSC MSC+GMSC Node B RNC
AIRCEL 10732 3550 30 4+1 1142 6
AIRTEL 31131 10314 110 48 NA NA
BSNL 3954 6405 78 28 1318 20
IDEA 26063 8651 48 11+3 3415 6
RCOM CDMA 3427 1139 8 5+3 NA NA
RCOM GSM 6216 2081 19 3+1 NA NA
TTSL CDMA 943 314 5 2+2 NA NA
TTSL GSM 6635 2218 21 4 NA NA
TELENOR 14672 4885 37 14 NA NA
VODAFONE 40145 10145 140 20 3363 12
Note: Node B & RNC is Junked as Not Applicable (N.A.) for the services providers who do not have 3G services licence in the circle.
Name of Operator Number of Subscriber (as on 31st Jun 2016)
Aircel 7042603
Airtel 21108697
BSNL 8268228
Idea 10784627
RCOM CDMA 2268154
RCOM GSM 7025091
TTSL CDMA 154591
TTSL GSM 4709829
Telenor 12595116
Vodafone 19489146

April to June 2016 – UP East Circle 32
6.2. AUDIT SCHEDULE
OPERATOR 3 Days Live April 2016 Apr-16 May-16 Jun-16
AIRCEL 8th Apr 2016 6th May 2016 8th Jun 2016 8th July 2016
AIRTEL 12th Apr 2016 18th May 2016 14th Jun 2016 12th July 2016
BSNL 14th Apr 2016 24th May 2016 16th Jun 2016 14th July 2016
IDEA 11th Apr 2016 9th May 2016 11th Jun 2016 11th July 2016
RCOM 13th Apr 2016 16th May 2016 15th Jun 2016 13th July 2016
TTSL 7th Apr 2016 9th May 2016 9th Jun 2016 7th July 2016
VIDEOCON 20th Apr 2016 17th May 2016 11th Jun 2016 20th July 2016
TELENOR 12th Apr 2016 16th May 2016 14th Jun 2016 12th July 2016
VODAFONE 6th Apr 2016 13th May 2016 10th Jun 2016 6th July 2016
Note: Audit schedule mentioned above is for the PMR audit for the last month. 3 day live monitoring for the current month was carried along with the PMR audit.
6.3. CODES TO READ THE REPORT
Colour codes to read the report:
Not meeting the
benchmark
NA Not Applicable
DNA Data Not Available During The Audit

April to June 2016 – UP East Circle 33
6.4. 2G VOICE PMR DATA: APRIL
6.5. 2G VOICE PMR DATA: MAY
6.6. 2G VOICE PMR DATA: JUNE
Benchmark AIRCEL AIRTEL BSNL IDEA RCOM CDMA RCOM GSM TELENOR TTSL CDMA TTSL GSM VODAFONE
Sum of downtime of BTSs in a
month in hrs. in the licensed
service area
≤ 2% 0.11% 0.55% 1.95% 0.27% 0.02% 0.02% 0.30% 0.06% 0.20% 0.08%
No. of BTSs having accumulated
downtime of >24 hours in a month≤ 2% 0.34% 1.84% 1.79% 0.83% 0.09% 0.14% 0.41% 0.00% 0.45% 0.22%
Call Set-up Success Rate (Within
Licensee own network≥ 95% 98.80% 96.07% 98.43% 99.19% 98.14% 96.88% 94.48% 97.77% 95.98% 98.54%
SDDCH/Paging chl. Congestion ≤ 1% 0.72% 0.79% 0.63% 0.71% NA 0.43% 1.51% 0.00% 0.78% 0.33%
TCH Congestion ≤ 2% 0.64% 0.71% 1.37% 0.74% 0.60% 0.93% 4.48% 0.12% 1.28% 1.46%
Call Drop Rate (%age) ≤ 2% 0.53% 0.76% 1.38% 0.81% 0.18% 0.10% 1.33% 0.15% 0.53% 0.55%
Worst Affected cell having more
than 3% TCH drop≤ 3% 2.51% 2.87% 2.64% 2.85% 1.58% 0.33% 7.50% 1.92% 2.84% 1.71%
%age of connection with good
voice quality≥ 95% 97.05% 95.67% 96.50% 97.37% 99.56% 99.15% 95.15% 99.97% 96.81% 96.60%
Apr-16
Network Availability
Connection
Establishment
(Accessibility)
Connection
Maintenance
(Retainability)
Network Parameters Name of Service Provider
Benchmark AIRCEL AIRTEL BSNL IDEA RCOM CDMA RCOM GSM TELENOR TTSL CDMA TTSL GSM VODAFONE
Sum of downtime of BTSs in a
month in hrs. in the licensed
service area
≤ 2% 0.36% 0.66% DNA 0.41% 0.04% 0.03% 0.29% 0.17% 0.38% 0.13%
No. of BTSs having accumulated
downtime of >24 hours in a month≤ 2% 1.94% 1.89% DNA 0.74% 0.18% 0.29% 1.13% 0.64% 1.40% 0.06%
Call Set-up Success Rate (Within
Licensee own network≥ 95% 99.06% 96.18% 98.88% 99.00% 97.65% 97.07% 95.02% 98.07% 95.09% 98.41%
SDDCH/Paging chl. Congestion ≤ 1% 0.69% 0.72% 0.65% 0.68% NA 0.44% 1.48% 0.00% 0.92% 0.46%
TCH Congestion ≤ 2% 0.77% 0.64% 2.02% 0.91% 0.57% 0.87% 3.89% 0.15% 1.84% 1.59%
Call Drop Rate (%age) ≤ 2% 0.50% 0.87% 1.06% 0.95% 0.31% 0.11% 1.47% 0.14% 0.45% 0.57%
Worst Affected cell having more
than 3% TCH drop≤ 3% 2.49% 2.83% 2.66% 2.54% 1.99% 0.39% 8.54% 1.96% 3.17% 2.60%
%age of connection with good
voice quality≥ 95% 97.43% 97.18% DNA 97.12% 99.64% 99.10% 94.51% 99.97% 96.70% 95.34%
May-16
Network ParametersName of Service Provider
Network Availability
Connection
Establishment
(Accessibility)
Connection
Maintenance
(Retainability)
Benchmark AIRCEL AIRTEL BSNL IDEA RCOM CDMA RCOM GSM TELENORTTSL CDMATTSL GSM VODAFONE
Sum of downtime of BTSs in a
month in hrs. in the licensed
service area
≤ 2% 0.25% 0.64% 1.74% 0.31% 0.01% 0.02% 0.51% 0.36% 0.34% 0.14%
No. of BTSs having accumulated
downtime of >24 hours in a month≤ 2% 0.93% 1.91% 1.73% 0.56% 0.09% 0.10% 0.86% 0.96% 0.90% 0.05%
Call Set-up Success Rate (Within
Licensee own network≥ 95% 99.03% 96.35% 98.43% 99.35% 98.10% 92.31% 96.03% 97.99% 93.57% 98.26%
SDDCH/Paging chl. Congestion ≤ 1% 0.58% 0.47% 0.62% 0.52% NA 81.65% 1.28% 0.00% 1.05% 0.38%
TCH Congestion ≤ 2% 0.93% 0.62% 1.78% 0.61% 0.53% 1.97% 2.89% 0.66% 2.79% 1.74%
Call Drop Rate (%age) ≤ 2% 0.63% 0.88% 1.69% 1.15% 0.29% 0.14% 1.47% 0.13% 0.62% 0.81%
Worst Affected cell having more
than 3% TCH drop≤ 3% 2.98% 2.80% 1.84% 2.34% 0.35% 0.39% 9.09% 2.10% 3.72% 3.44%
%age of connection with good
voice quality≥ 95% 97.47% 97.09% 96.50% 97.18% 99.54% 98.74% 94.50% 99.97% 96.30% 95.96%
Jun-16
Network ParametersName of Service Provider
Network Availability
Connection
Establishment
(Accessibility)
Connection
Maintenance
(Retainability)

April to June 2016 – UP East Circle 34
6.7. 2G VOICE PMR DATA: CONSOLIDATED
6.8. 2G VOICE 3 DAYS LIVE DATA
A three day live measurement was conducted to measure the QoS provided by the operators. It was seen
from the live data collected, that the performance of the operators across all parameters more or less
corroborated with the audit data collected.
6.9. 2G VOICE 3 DAYS LIVE DATA: APRIL
Benchmark AIRCEL AIRTEL BSNL IDEA RCOM CDMA RCOM GSM TELENOR TTSL CDMA TTSL GSM VODAFONE
Sum of downtime of BTSs in a
month in hrs. in the licensed
service area
≤ 2% 0.05% 0.23% 1.76% 0.35% 0.02% 0.02% 0.28% 0.00% 0.20% 0.10%
No. of BTSs having accumulated
downtime of >24 hours in a month≤ 2% 0.08% 0.01% 0.10% 0.03% 0.00% 0.00% 0.41% 0.00% 0.00% 0.00%
Call Set-up Success Rate (Within
Licensee own network≥ 95% 98.83% 96.12% 98.29% 99.30% 98.90% 98.10% 94.18% 98.35% 96.55% 98.55%
SDDCH/Paging chl. Congestion ≤ 1% 0.57% 0.71% 0.59% 0.49% NA 0.31% 1.28% 0.00% 0.25% 0.26%
TCH Congestion ≤ 2% 0.77% 0.70% 1.71% 0.65% 0.13% 0.89% 4.79% 0.14% 1.20% 1.45%
Call Drop Rate (%age) ≤ 2% 0.51% 0.80% 1.70% 0.81% 0.15% 0.09% 1.39% 0.05% 0.60% 0.60%
Worst Affected cell having more
than 3% TCH drop≤ 3% 2.61% 2.90% 2.49% 2.79% 4.43% 0.92% 8.03% 2.07% 2.97% 2.10%
%age of connection with good
voice quality≥ 95% 96.78% 97.36% 96.66% 97.42% 99.61% 99.16% 95.17% 99.44% 96.80% 96.56%
Apr-16
Network Parameters Name of Service Provider
Network Availability
Connection
Establishment
(Accessibility)
Connection
Maintenance
(Retainability)
Benchmark AIRCEL AIRTEL BSNL IDEA RCOM CDMA RCOM GSM TELENOR TTSL CDMA TTSL GSM VODAFONE
Sum of downtime of BTSs in a
month in hrs. in the licensed
service area
≤ 2% 0.24% 0.61% 1.95% 0.33% 0.02% 0.02% 0.37% 0.20% 0.30% 0.12%
No. of BTSs having accumulated
downtime of >24 hours in a month≤ 2% 1.07% 1.88% 1.79% 0.71% 0.12% 0.18% 0.80% 0.53% 0.92% 0.11%
Call Set-up Success Rate (Within
Licensee own network≥ 95% 98.96% 96.20% 98.66% 99.18% 97.96% 95.42% 95.18% 97.94% 94.88% 98.40%
SDDCH/Paging chl. Congestion ≤ 1% 0.66% 0.66% 0.64% 0.64% NA 27.50% 1.43% 0.00% 0.92% 0.39%
TCH Congestion ≤ 2% 0.78% 0.66% 1.69% 0.75% 0.57% 1.26% 3.75% 0.31% 1.97% 1.60%
Call Drop Rate (%age) ≤ 2% 0.55% 0.84% 1.22% 0.97% 0.26% 0.12% 1.42% 0.14% 0.54% 0.65%
Worst Affected cell having more
than 3% TCH drop≤ 3% 2.66% 2.83% 2.65% 2.58% 1.31% 0.37% 8.38% 1.99% 3.25% 2.58%
%age of connection with good
voice quality≥ 95% 97.32% 96.65% 96.50% 97.22% 99.58% 98.99% 94.72% 99.97% 96.61% 95.97%
Network Availability
Connection
Establishment
(Accessibility)
Connection
Maintenance
(Retainability)
Consolidated
Network ParametersName of Service Provider

April to June 2016 – UP East Circle 35
6.10. 2G VOICE 3 DAYS LIVE DATA: MAY
6.11. 2G VOICE 3 DAYS LIVE DATA: JUNE
Benchmark AIRCEL AIRTEL BSNL IDEA RCOM CDMA RCOM GSM TELENOR TTSL CDMA TTSL GSM VODAFONE
Sum of downtime of BTSs in a
month in hrs. in the licensed
service area
≤ 2% 0.23% 0.55% 1.89% 0.30% 0.03% 0.02% 0.19% 0.00% 0.20% 0.08%
No. of BTSs having accumulated
downtime of >24 hours in a month≤ 2% 0.03% 0.00% 0.18% 0.00% 0.00% 0.00% 0.00% 0.00% 0.00% 0.00%
Call Set-up Success Rate (Within
Licensee own network≥ 95% 99.18% 96.57% 97.03% 98.28% 95.54% 97.71% 95.02% 98.10% 96.24% 98.82%
SDDCH/Paging chl. Congestion ≤ 1% 0.51% 0.68% 0.98% 0.77% NA 0.50% 1.42% 0.00% 0.50% 0.31%
TCH Congestion ≤ 2% 0.63% 0.55% 2.97% 1.61% 2.12% 1.03% 3.99% 0.15% 1.34% 1.18%
Call Drop Rate (%age) ≤ 2% 0.45% 0.81% 1.81% 1.11% 0.29% 0.09% 1.35% 0.13% 0.42% 0.58%
Worst Affected cell having more
than 3% TCH drop≤ 3% 2.38% 2.86% 2.73% 2.51% 1.92% 0.24% 7.70% 1.76% 2.58% 2.05%
%age of connection with good
voice quality≥ 95% 97.61% 97.36% 96.66% 96.73% 99.40% 99.09% 94.42% 99.97% 96.74% 96.80%
Connection
Maintenance
(Retainability)
May-16
Network ParametersName of Service Provider
Network Availability
Connection
Establishment
(Accessibility)
Benchmark AIRCEL AIRTEL BSNL IDEA RCOM CDMARCOM GSMTELENORTTSL CDMATTSL GSMVODAFONE 0
Sum of downtime of BTSs in a
month in hrs. in the licensed
service area
≤ 2% 0.31% 0.56% 1.93% 0.42% 0.06% 0.00% 0.38% 0.23% 0.42% 0.12% 0.00%
No. of BTSs having accumulated
downtime of >24 hours in a month≤ 2% 0.00% 0.00% 0.28% 0.01% 0.00% 0.00% 0.00% 0.00% 0.00% 0.01% 0.00%
Call Set-up Success Rate (Within
Licensee own network≥ 95% 99.04% 96.59% 98.33% 99.33% 97.90% 95.06% 95.40% 98.74% 94.55% 98.16% 0.00%
SDDCH/Paging chl. Congestion ≤ 1% 0.76% 0.53% 0.65% 0.55% NA 0.51% 1.67% 0.00% 0.82% 0.43% 0.00%
TCH Congestion ≤ 2% 0.84% 0.56% 1.67% 0.63% 0.61% 1.05% 3.41% 0.13% 2.41% 1.84% 0.00%
Call Drop Rate (%age) ≤ 2% 0.50% 0.87% 1.93% 1.02% 0.29% 0.14% 1.60% 0.10% 0.54% 0.92% 0.00%
Worst Affected cell having more
than 3% TCH drop≤ 3% 2.62% 2.81% 0.32% 2.63% 1.40% 0.57% 9.00% 1.68% 3.32% 3.96% 0.00%
%age of connection with good
voice quality≥ 95% 97.46% 97.09% 96.62% 97.33% 99.36% 98.99% 94.29% 99.97% 96.60% 95.50% 0.00%
Jun-16
Network ParametersName of Service Provider
Network Availability
Connection
Establishment
(Accessibility)
Connection
Maintenance
(Retainability)

April to June 2016 – UP East Circle 36
6.12. 3 DAYS LIVE DATA: CONSOLIDATED
6.13. 3G VOICE PMR: CONSOLIDATED
6.14. 3G VOICE PMR: APRIL
Benchmark AIRCEL AIRTEL BSNL IDEA VODAFONE
Sum of downtime of BTSs in a month in hrs. in
the licensed service area≤ 2% 0.32% 0.49% 1.32% 0.36% 0.37%
No. of BTSs having accumulated downtime of >24
hours in a month≤ 2% 1.25% 1.87% 1.82% 1.46% 0.82%
Call Set-up Success Rate (Within Licensee own
network≥ 95% 97.81% 99.83% 97.04% 99.64% 99.81%
RRC Congestion: ≤ 1% 0.14% 0.25% 0.92% 0.58% 0.20%
RAB Congestion: ≤ 2% 0.01% 0.17% 0.97% 0.14% 0.03%
Circuit Switched Voice Drop Rate ≤ 2% 0.50% 0.43% 1.25% 0.52% 0.26%
Worst affected cells having more than 3% Circuit
Switched Voice Drop Rate:≤ 3% 5.03% 2.07% 2.83% 2.07% 2.20%
Percentage of connections with Good Circuit
Switched Voice Quality≥ 95% 99.74% 98.42% 96.50% 98.68% 99.00%
Connectio
n
Maintenan
ce
(Retainabil
ity)
Consolidated
Network ParametersName of Service Provider
Network
Availability
Connectio
n
Establish
ment
(Accessibi
Benchmark AIRCEL AIRTEL BSNL IDEA VODAFONE
Sum of downtime of BTSs in a month in hrs. in
the licensed service area≤ 2% 0.12% 0.53% 1.32% 0.35% 0.30%
No. of BTSs having accumulated downtime of >24
hours in a month≤ 2% 0.26% 1.86% 1.82% 1.73% 1.44%
Call Set-up Success Rate (Within Licensee own
network≥ 95% 97.88% 99.77% 97.04% 99.57% 99.86%
RRC Congestion: ≤ 1% 0.06% 0.36% 0.92% 0.67% 0.01%
RAB Congestion: ≤ 2% 0.01% 0.23% 0.97% 0.21% 0.01%
Circuit Switched Voice Drop Rate ≤ 2% 0.48% 0.46% 1.25% 0.51% 0.23%
Worst affected cells having more than 3% Circuit
Switched Voice Drop Rate:≤ 3% 5.10% 2.12% 2.83% 2.55% 1.86%
Percentage of connections with Good Circuit
Switched Voice Quality≥ 95% 99.75% 97.99% 96.50% 98.82% 99.00%
Apr-16
Network ParametersName of Service Provider
Network
Availability
Connectio
n
Establish
ment
(AccessibiConnectio
n
Maintenan
ce
(Retainabil
ity)
Benchmark AIRCEL AIRTEL BSNL IDEA RCOM CDMA RCOM GSM TELENOR TTSL CDMA TTSL GSM VODAFONE
Sum of downtime of BTSs in a
month in hrs. in the licensed
service area
≤ 2% 0.20% 0.45% 1.82% 0.36% 0.04% 0.02% 0.29% 0.08% 0.27% 0.10%
No. of BTSs having accumulated
downtime of >24 hours in a month≤ 2% 0.04% 0.00% 0.14% 0.02% 0.00% 0.00% 0.14% 0.00% 0.00% 0.00%
Call Set-up Success Rate (Within
Licensee own network≥ 95% 99.02% 96.43% 97.66% 98.97% 97.44% 96.96% 94.87% 98.40% 95.78% 98.51%
SDDCH/Paging chl. Congestion ≤ 1% 0.62% 0.64% 0.79% 0.60% NA 0.44% 1.46% 0.00% 0.52% 0.33%
TCH Congestion ≤ 2% 0.75% 0.60% 2.34% 0.96% 0.95% 0.99% 4.06% 0.14% 1.65% 1.49%
Call Drop Rate (%age) ≤ 2% 0.49% 0.82% 1.75% 0.98% 0.25% 0.11% 1.45% 0.10% 0.52% 0.70%
Worst Affected cell having more
than 3% TCH drop≤ 3% 2.54% 2.86% 2.61% 2.64% 2.58% 0.57% 8.24% 1.84% 2.96% 2.70%
%age of connection with good
voice quality≥ 95% 97.28% 97.27% 96.66% 97.16% 99.46% 99.08% 94.63% 99.80% 96.71% 96.29%
Connection
Maintenance
(Retainability)
Consolidated
Network ParametersName of Service Provider
Network Availability
Connection
Establishment
(Accessibility)

April to June 2016 – UP East Circle 37
6.15. 3G VOICE PMR: MAY
6.16. 3G VOICE PMR: JUNE
Benchmark AIRCEL AIRTEL BSNL IDEA VODAFONE
Sum of downtime of BTSs in a month in hrs. in
the licensed service area≤ 2% 0.49% 0.46% 1.99% 0.42% 0.40%
No. of BTSs having accumulated downtime of >24
hours in a month≤ 2% 2.63% 1.84% 1.67% 1.46% 0.61%
Call Set-up Success Rate (Within Licensee own
network≥ 95% 97.70% 99.85% 96.33% 99.59% 99.76%
RRC Congestion: ≤ 1% 0.26% 0.29% 0.94% 0.62% 0.27%
RAB Congestion: ≤ 2% 0.01% 0.15% 1.01% 0.13% 0.07%
Circuit Switched Voice Drop Rate ≤ 2% 0.52% 0.43% 1.15% 0.50% 0.26%
Worst affected cells having more than 3% Circuit
Switched Voice Drop Rate:≤ 3% 5.31% 2.13% 2.74% 1.87% 2.25%
Percentage of connections with Good Circuit
Switched Voice Quality≥ 95% 99.75% 98.64% 96.50% 98.72% 99.00%
Connectio
n
Maintenan
ce
(Retainabil
ity)
May-16
Network ParametersName of Service Provider
Network
Availability
Connectio
n
Establish
ment
(Accessibi
Benchmark AIRCEL AIRTEL BSNL IDEA VODAFONE
Sum of downtime of BTSs in a month in hrs. in
the licensed service area≤ 2% 0.36% 0.49% 1.32% 0.32% 0.42%
No. of BTSs having accumulated downtime of >24
hours in a month≤ 2% 0.87% 1.92% 1.59% 1.19% 0.40%
Call Set-up Success Rate (Within Licensee own
network≥ 95% 97.84% 99.86% 97.10% 99.75% 99.83%
RRC Congestion: ≤ 1% 0.10% 0.12% 0.87% 0.45% 0.32%
RAB Congestion: ≤ 2% 0.01% 0.14% 1.02% 0.07% 0.01%
Circuit Switched Voice Drop Rate ≤ 2% 0.51% 0.41% 1.17% 0.54% 0.29%
Worst affected cells having more than 3% Circuit
Switched Voice Drop Rate:≤ 3% 4.68% 1.96% 2.83% 1.80% 2.49%
Percentage of connections with Good Circuit
Switched Voice Quality≥ 95% 99.74% 98.63% 96.50% 98.50% 98.99%
Jun-16
Network ParametersName of Service Provider
Network
Availability
Connectio
n
Establish
ment
(AccessibiConnectio
n
Maintenan
ce
(Retainabil
ity)

April to June 2016 – UP East Circle 38
6.17. 3G VOICE 3 DAYS LIVE DATA: CONSOLIDATED
6.18. 3G VOICE 3 DAYS LIVE DATA: APRIL
Benchmark AIRCEL AIRTEL BSNL IDEA VODAFONE
Sum of downtime of BTSs in a month in hrs. in
the licensed service area≤ 2% 0.17% 0.28% 1.84% 0.55% 0.30%
No. of BTSs having accumulated downtime of
>24 hours in a month≤ 2% 0.00% 0.00% 0.68% 0.15% 0.00%
Call Set-up Success Rate (Within Licensee own
network≥ 95% 97.90% 99.80% 96.94% 99.74% 99.86%
RRC Congestion: ≤ 1% 0.08% 0.43% 0.93% 0.57% 0.01%
RAB Congestion: ≤ 2% 0.00% 0.20% 0.90% 0.07% 0.01%
Circuit Switched Voice Drop Rate ≤ 2% 0.46% 0.59% 1.14% 0.48% 0.22%
Worst affected cells having more than 3%
Circuit Switched Voice Drop Rate:≤ 3% 5.49% 1.92% 2.84% 2.54% 1.85%
Percentage of connections with Good Circuit
Switched Voice Quality≥ 95% 99.74% 97.95% DNA 98.81% 98.99%
Apr-16
Network ParametersName of Service Provider
Network
Availability
Connection
Establishment
(Accessibility)
Connection
Maintenance
(Retainability)
Benchmark AIRCEL AIRTEL BSNL IDEA VODAFONE
Sum of downtime of BTSs in a month in hrs. in
the licensed service area≤ 2% 0.26% 0.42% 1.68% 0.40% 0.27%
No. of BTSs having accumulated downtime of
>24 hours in a month≤ 2% 0.03% 0.00% 0.53% 0.05% 0.00%
Call Set-up Success Rate (Within Licensee own
network≥ 95% 97.80% 99.83% 96.94% 99.71% 99.77%
RRC Congestion: ≤ 1% 0.27% 0.25% 0.88% 0.55% 0.34%
RAB Congestion: ≤ 2% 0.00% 0.17% 0.89% 0.11% 0.08%
Circuit Switched Voice Drop Rate ≤ 2% 0.48% 0.47% 1.12% 0.49% 0.26%
Worst affected cells having more than 3%
Circuit Switched Voice Drop Rate:≤ 3% 5.42% 2.01% 2.79% 2.33% 2.16%
Percentage of connections with Good Circuit
Switched Voice Quality≥ 95% 99.75% 98.54% DNA 98.76% 98.99%
Connection
Maintenance
(Retainability)
Consolidated
Network ParametersName of Service Provider
Network
Availability
Connection
Establishment
(Accessibility)

April to June 2016 – UP East Circle 39
6.19. 3G VOICE 3 DAYS LIVE DATA: MAY
6.20. 3G VOICE 3 DAYS LIVE DATA: JUNE
Benchmark AIRCEL AIRTEL BSNL IDEA VODAFONE
Sum of downtime of BTSs in a month in hrs. in
the licensed service area≤ 2% 0.10% 0.46% 1.51% 0.11% 0.28%
No. of BTSs having accumulated downtime of
>24 hours in a month≤ 2% 0.00% 0.00% 0.38% 0.00% 0.00%
Call Set-up Success Rate (Within Licensee own
network≥ 95% 97.53% 99.77% 96.94% 99.56% 99.64%
RRC Congestion: ≤ 1% 0.70% 0.19% 0.84% 0.61% 0.99%
RAB Congestion: ≤ 2% 0.01% 0.23% 0.88% 0.18% 0.21%
Circuit Switched Voice Drop Rate ≤ 2% 0.47% 0.43% 1.11% 0.46% 0.22%
Worst affected cells having more than 3%
Circuit Switched Voice Drop Rate:≤ 3% 5.19% 2.13% 2.74% 1.87% 1.90%
Percentage of connections with Good Circuit
Switched Voice Quality≥ 95% 99.75% 98.75% DNA 98.84% 99.00%
Connection
Maintenance
(Retainability)
May-16
Network ParametersName of Service Provider
Network
Availability
Connection
Establishment
(Accessibility)
Benchmark AIRCEL AIRTEL BSNL IDEA VODAFONE
Sum of downtime of BTSs in a month in hrs. in
the licensed service area≤ 2% 0.50% 0.52% 1.59% 0.55% 0.25%
No. of BTSs having accumulated downtime of
>24 hours in a month≤ 2% 0.09% 0.00% 0.00% 0.00% 0.00%
Call Set-up Success Rate (Within Licensee own
network≥ 95% 97.99% 99.93% 96.64% 99.82% 99.81%
RRC Congestion: ≤ 1% 0.02% 0.13% 0.63% 0.48% 0.02%
RAB Congestion: ≤ 2% 0.00% 0.07% 0.94% 0.08% 0.01%
Circuit Switched Voice Drop Rate ≤ 2% 0.51% 0.40% 0.94% 0.53% 0.32%
Worst affected cells having more than 3%
Circuit Switched Voice Drop Rate:≤ 3% 5.59% 1.97% 2.67% 2.58% 2.73%
Percentage of connections with Good Circuit
Switched Voice Quality≥ 95% 99.75% 98.91% DNA 98.62% 98.99%
Jun-16
Network ParametersName of Service Provider
Network
Availability
Connection
Establishment
(Accessibility)
Connection
Maintenance
(Retainability)

April to June 2016 – UP East Circle 40
6.21. PMR MONTHLY 2G WIRELESS DATA - CONSOLIDATED
6.22. PMR MONTHLY 2G WIRELESS DATA – APRIL
S. No. Name of Parameter Benchmark AIRCEL AIRTEL BSNL IDEA RCOM CDMA RCOM GSM TELENOR TTSL CDMA TTSL GSM VODAFONE
1
i)Total No. of Subscribers for Service
Activation (A)1330904 DNA DNA 854226 9028 204918 528263 27 198 DNA
ii)Total Service Activations provided within
4 Hours (B)1326366 DNA DNA 854226 9021 204911 507126 26 197 DNA
iii)Service Activation / Provisioning = (B/A) *
100
Within 4 Hours
with 95%
Success Rate
99.60% DNA DNA 100.00% 3399.97% 100.00% 95.91% 98.61% 99.47% DNA
2
i)Total No. of PDP Context Activation
Requests (from SGSN to GGSN) (A)238806480 646299869 56205284 565617601 DNA DNA 397387757 8175594 DNA 707562697
ii)
Total No. of PDP Context Activation
Success (path created b/w SGSN and
GGSN) (B)
237088807 645696867 56115072 564538975 DNA DNA 390940009 7888150 DNA 705639158
iii)PDP Context Activation Success Rate
=(B/A) *100>=95% 99.26% 99.91% 99.84% 99.81% 98.22% 99.84% 98.33% 96.49% DNA 99.73%
3
i)RNC originated PS Domain Iu
Connection Setup Success (A)1854613618 79571129884 DNA 15028599135 11569646 769246991 3233744286 DNA 1389924964 2365122616
ii)RNC originated PS Domain Iu
Connection Release (B)12053773 852342009 DNA 208248331 98273 29356747 31786643 DNA 28843048 114162410
iii) Drop Rate = (B/A) * 100 <=5% 0.65% 1.07% DNA 1.40% 0.82% 3.81% 0.98% DNA 2.07% 4.82%
Drop Rate
ConsolidatedCellular Mobile Telephone Services
Network Service Quality Parameter
Service Activation/ Provisioning
PDP Context Activation Success Rate
S. No. Name of Parameter Benchmark AIRCEL AIRTEL BSNL IDEARCOM
CDMARCOM GSM TELENOR TTSL CDMA TTSL GSM VODAFONE
1
i)Total No. of Subscribers for Service
Activation (A)1098264 DNA DNA 707706 20463 179858 387429 32 178 DNA
ii)Total Service Activations provided within
4 Hours (B)1086685 DNA DNA 707706 20444 179847 370392 32 176 DNA
iii)Service Activation / Provisioning = (B/A) *
100
Within 4 Hours with 95%
Success Rate98.95% DNA DNA 100.00% 99.91% 99.99% 95.60% 100.00% 98.88% DNA
2
i)Total No. of PDP Context Activation
Requests (from SGSN to GGSN) (A)232713307 673345558 DNA 571608732 DNA DNA 374462592 7865175 DNA 731891288
ii)
Total No. of PDP Context Activation
Success (path created b/w SGSN and
GGSN) (B)
228448304 672841620 DNA 570362352 DNA DNA 363593793 7592060 DNA 728353931
iii)PDP Context Activation Success Rate
=(B/A) *100>=95% 98.17% 99.93% DNA 99.78% 98.26% 99.81% 97.10% 96.53% 100.00% 99.52%
3
i)RNC originated PS Domain Iu
Connection Setup Success (A)1832035021 7.651E+10 DNA 21670491372 21782793 738066954 2964297538 DNA 1446418750 2269097611
ii)RNC originated PS Domain Iu
Connection Release (B)12452719 771314695 DNA 292983754 192350 25151100 27955992 DNA 30372550.2 99993596
iii) Drop Rate = (B/A) * 100 <=5% 0.68% 1.01% DNA 1.35% 0.88% 3.41% 0.94% DNA 2.10% 4.41%
Apr-16Cellular Mobile Telephone Services
Network Service Quality Parameter
Service Activation/ Provisioning
PDP Context Activation Success Rate
Drop Rate

April to June 2016 – UP East Circle 41
6.23. PMR MONTHLY 2G WIRELESS DATA - MAY
S. No. Name of Parameter Benchmark AIRCEL AIRTEL BSNL IDEA RCOM CDMA RCOM GSM TELENOR TTSL CDMA TTSL GSM VODAFONE
1
i)Total No. of Subscribers for Service
Activation (A)1521875 DNA DNA 984844 6155 214948 630057 24 213 DNA
ii)Total Service Activations provided within
4 Hours (B)1520222 DNA DNA 984844 6155 214941 612257 23 212 DNA
iii)Service Activation / Provisioning = (B/A) *
100
Within 4 Hours
with 95%
Success Rate
99.89% DNA DNA 100.00% 100.00% 100.00% 97.17% 95.83% 99.53% DNA
2
i)Total No. of PDP Context Activation
Requests (from SGSN to GGSN) (A)249788479 645377735 57164106.29 629314030 NA NA 444413947 8408074 DNA 742930795
ii)
Total No. of PDP Context Activation
Success (path created b/w SGSN and
GGSN) (B)
249632466 644769580 57067657 628362496 NA NA 440377374 8107240 DNA 741807668
iii)PDP Context Activation Success Rate
=(B/A) *100>=95% 99.94% 99.91% 99.83% 99.85% 98.18% 99.87% 99.09% 96.42% 99.99% 99.85%
3
i)RNC originated PS Domain Iu
Connection Setup Success (A)2013268247 84504789263 DNA 12223864456 10289993 780157767 3327555402 DNA 1468657037 2417273261
ii)RNC originated PS Domain Iu
Connection Release (B)12388378 922652881 DNA 164964442 81665.00 30812877 32696090 DNA 31339450 126755470
iii) Drop Rate = (B/A) * 100 <=5% 0.62% 1.09% DNA 1.35% 0.79% 3.95% 0.98% DNA 2.13% 5.24%
Drop Rate
May-16Cellular Mobile Telephone Services
Network Service Quality Parameter
Service Activation/ Provisioning
PDP Context Activation Success Rate
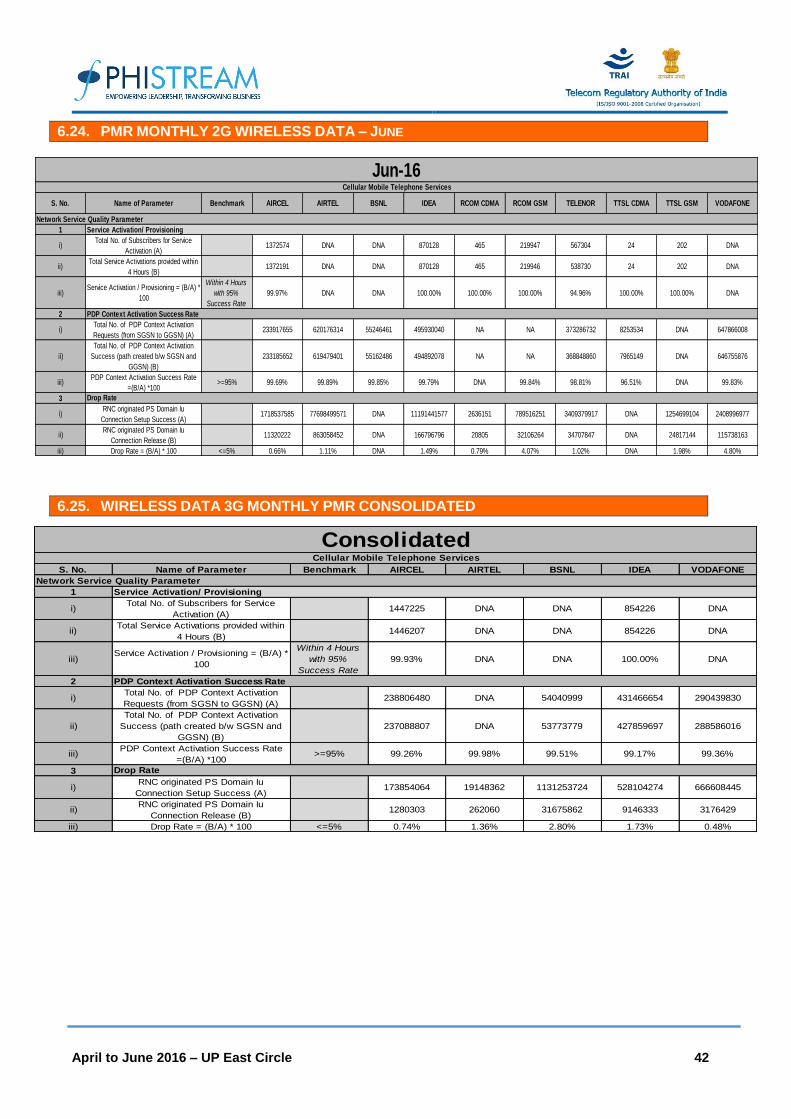
April to June 2016 – UP East Circle 42
6.24. PMR MONTHLY 2G WIRELESS DATA – JUNE
6.25. WIRELESS DATA 3G MONTHLY PMR CONSOLIDATED
S. No. Name of Parameter Benchmark AIRCEL AIRTEL BSNL IDEA RCOM CDMA RCOM GSM TELENOR TTSL CDMA TTSL GSM VODAFONE
1
i)Total No. of Subscribers for Service
Activation (A)1372574 DNA DNA 870128 465 219947 567304 24 202 DNA
ii)Total Service Activations provided within
4 Hours (B)1372191 DNA DNA 870128 465 219946 538730 24 202 DNA
iii)Service Activation / Provisioning = (B/A) *
100
Within 4 Hours
with 95%
Success Rate
99.97% DNA DNA 100.00% 100.00% 100.00% 94.96% 100.00% 100.00% DNA
2
i)Total No. of PDP Context Activation
Requests (from SGSN to GGSN) (A)233917655 620176314 55246461 495930040 NA NA 373286732 8253534 DNA 647866008
ii)
Total No. of PDP Context Activation
Success (path created b/w SGSN and
GGSN) (B)
233185652 619479401 55162486 494892078 NA NA 368848860 7965149 DNA 646755876
iii)PDP Context Activation Success Rate
=(B/A) *100>=95% 99.69% 99.89% 99.85% 99.79% DNA 99.84% 98.81% 96.51% DNA 99.83%
3
i)RNC originated PS Domain Iu
Connection Setup Success (A)1718537585 77698499571 DNA 11191441577 2636151 789516251 3409379917 DNA 1254699104 2408996977
ii)RNC originated PS Domain Iu
Connection Release (B)11320222 863058452 DNA 166796796 20805 32106264 34707847 DNA 24817144 115738163
iii) Drop Rate = (B/A) * 100 <=5% 0.66% 1.11% DNA 1.49% 0.79% 4.07% 1.02% DNA 1.98% 4.80%
Jun-16Cellular Mobile Telephone Services
Network Service Quality Parameter
Service Activation/ Provisioning
PDP Context Activation Success Rate
Drop Rate
S. No. Name of Parameter Benchmark AIRCEL AIRTEL BSNL IDEA VODAFONE
1
i)Total No. of Subscribers for Service
Activation (A)1447225 DNA DNA 854226 DNA
ii)Total Service Activations provided within
4 Hours (B)1446207 DNA DNA 854226 DNA
iii)Service Activation / Provisioning = (B/A) *
100
Within 4 Hours
with 95%
Success Rate
99.93% DNA DNA 100.00% DNA
2
i)Total No. of PDP Context Activation
Requests (from SGSN to GGSN) (A)238806480 DNA 54040999 431466654 290439830
ii)
Total No. of PDP Context Activation
Success (path created b/w SGSN and
GGSN) (B)
237088807 DNA 53773779 427859697 288586016
iii)PDP Context Activation Success Rate
=(B/A) *100>=95% 99.26% 99.98% 99.51% 99.17% 99.36%
3
i)RNC originated PS Domain Iu
Connection Setup Success (A)173854064 19148362 1131253724 528104274 666608445
ii)RNC originated PS Domain Iu
Connection Release (B)1280303 262060 31675862 9146333 3176429
iii) Drop Rate = (B/A) * 100 <=5% 0.74% 1.36% 2.80% 1.73% 0.48%
ConsolidatedCellular Mobile Telephone Services
Network Service Quality Parameter
Service Activation/ Provisioning
PDP Context Activation Success Rate
Drop Rate

April to June 2016 – UP East Circle 43
6.26. WIRELESS DATA 3G MONTHLY PMR – APR
S. No. Name of Parameter Benchmark AIRCEL AIRTEL BSNL IDEA VODAFONE
1
i)Total No. of Subscribers for Service
Activation (A)DNA DNA DNA 707706 DNA
ii)Total Service Activations provided within
4 Hours (B)DNA DNA DNA 707706 DNA
iii)Service Activation / Provisioning = (B/A) *
100
Within 4 Hours with 95%
Success RateDNA DNA DNA 100.00% DNA
2
i)Total No. of PDP Context Activation
Requests (from SGSN to GGSN) (A)232713307 DNA 54037594 438062972 295839508
ii)
Total No. of PDP Context Activation
Success (path created b/w SGSN and
GGSN) (B)
228448304 DNA 53985012 434277350 293055489
iii)PDP Context Activation Success Rate
=(B/A) *100>=95% 98.17% 99.97% 99.90% 99.14% 99.06%
3
i)RNC originated PS Domain Iu
Connection Setup Success (A)166889708 17296106 1131253724 523443300 623930220
ii)RNC originated PS Domain Iu
Connection Release (B)1152405 272560 31675862.3 8861433 2788125
iii) Drop Rate = (B/A) * 100 <=5% 0.69% 1.58% 2.80% 1.69% 0.45%
Apr-16Cellular Mobile Telephone Services
Network Service Quality Parameter
Service Activation/ Provisioning
PDP Context Activation Success Rate
Drop Rate

April to June 2016 – UP East Circle 44
6.27. WIRELESS DATA 3G MONTHLY PMR – MAY
6.28. WIRELESS DATA 3G MONTHLY PMR – JUNE
S. No. Name of Parameter Benchmark AIRCEL AIRTEL BSNL IDEA VODAFONE
1
i)Total No. of Subscribers for Service
Activation (A)1521875 DNA DNA 984844 DNA
ii)Total Service Activations provided within
4 Hours (B)1520222 DNA DNA 984844 DNA
iii)Service Activation / Provisioning = (B/A) *
100
Within 4 Hours
with 95%
Success Rate
99.89% DNA DNA 100.00% DNA
2
i)Total No. of PDP Context Activation
Requests (from SGSN to GGSN) (A)249788479 DNA 57179083 474398532 304301465
ii)
Total No. of PDP Context Activation
Success (path created b/w SGSN and
GGSN) (B)
249632466 DNA 56772635 469951976 302987546
iii)PDP Context Activation Success Rate
=(B/A) *100>=95% 99.94% 99.98% 99.29% 99.06% 99.57%
3
i)RNC originated PS Domain Iu
Connection Setup Success (A)177997559 21697629 DNA 554178296 703722483
ii)RNC originated PS Domain Iu
Connection Release (B)1258427 334034 DNA 9729417 3367958
iii) Drop Rate = (B/A) * 100 <=5% 0.71% 1.54% DNA 1.76% 0.48%
May-16Cellular Mobile Telephone Services
Network Service Quality Parameter
Service Activation/ Provisioning
D
Drop Rate
S. No. Name of Parameter Benchmark AIRCEL AIRTEL BSNL IDEA VODAFONE
1
i)Total No. of Subscribers for Service
Activation (A)1372574 DNA DNA 870128 DNA
ii)Total Service Activations provided within
4 Hours (B)1372191 DNA DNA 870128 DNA
iii)Service Activation / Provisioning = (B/A) *
100
Within 4 Hours
with 95%
Success Rate
99.97% DNA DNA 100.00% DNA
2
i)Total No. of PDP Context Activation
Requests (from SGSN to GGSN) (A)233917655 DNA 50906320.82 381938458 271178516
ii)
Total No. of PDP Context Activation
Success (path created b/w SGSN and
GGSN) (B)
233185652 DNA 50563690 379349765 269715012
iii)PDP Context Activation Success Rate
=(B/A) *100>=95% 99.69% 99.99% 99.33% 99.32% 99.46%
3
i)RNC originated PS Domain Iu
Connection Setup Success (A)176674925 18451350 DNA 506691226 672172633
ii)RNC originated PS Domain Iu
Connection Release (B)1430077 179587 DNA 8848150 3373203
iii) Drop Rate = (B/A) * 100 <=5% 0.81% 0.97% DNA 1.75% 0.50%
Jun-16Cellular Mobile Telephone Services
Network Service Quality Parameter
Service Activation/ Provisioning
PDP Context Activation Success Rate
Drop Rate

April to June 2016 – UP East Circle 45
6.29. 3 DAYS LIVE WIRELESS DATA 2G PMR – APRIL
6.30. 3 DAYS LIVE WIRELESS DATA 2G PMR – MAY
S. No. Name of Parameter Benchmark AIRCEL AIRTEL BSNL IDEARCOM
CDMARCOM GSM TELENOR TTSL CDMA TTSL GSM VODAFONE
1
i) Total No. of Subscribers for Service Activation (A) DNA DNA DNA 47154 531 19296 35807 DNA DNA DNA
ii) Total Service Activations provided within 4 Hours (B) DNA DNA DNA 47154 531 19293 34164 DNA DNA DNA
iii) Service Activation / Provisioning = (B/A) * 100Within 4 Hours with 95%
Success RateDNA DNA DNA 100.00% 100.00% 99.98% 95.41% DNA DNA DNA
2
i)Total No. of PDP Context Activation Requests (from
SGSN to GGSN) (A)22258693 67279626 DNA 54030048 DNA DNA 34975439 794514 468395 69526286
ii)Total No. of PDP Context Activation Success (path
created b/w SGSN and GGSN) (B)22255326 67218169 DNA 53972226 DNA DNA 34947963 766532 468086 69389547
iii) PDP Context Activation Success Rate =(B/A) *100 >=95% 99.98% 99.91% DNA 99.89% 98.56% 99.84% 99.92% 96.48% 99.93% 99.80%
3
i)RNC originated PS Domain Iu Connection Setup
Success (A)183928535 7409566325 DNA 1143322048 12516399 77611727 323833683 DNA 96869544 222222561
ii) RNC originated PS Domain Iu Connection Release (B) 1153687 73102303 DNA 15480604 135919 2581106 4193868 DNA 1969723 10384993
iii) Drop Rate = (B/A) * 100 <=5% 0.63% 0.99% DNA 1.35% 1.09% 3.33% 1.30% DNA 2.03% 4.67%
Drop Rate
Apr-16
Cellular Mobile Telephone Services
Network Service Quality Parameter
Service Activation/ Provisioning
PDP Context Activation Success Rate
S. No. Name of Parameter Benchmark AIRCEL AIRTEL BSNL IDEA RCOM CDMARCOM
GSMTELENOR
TTSL
CDMATTSL GSM VODAFONE
1
i) Total No. of Subscribers for Service Activation (A) DNA DNA DNA 49812 531 44300 74855 DNA DNA DNA
ii) Total Service Activations provided within 4 Hours (B) DNA DNA DNA 49812 531 44300 73250 DNA DNA DNA
iii) Service Activation / Provisioning = (B/A) * 100Within 4 Hours with
95% Success RateDNA DNA DNA 100.00% 100.00% 100.00% 97.86% DNA DNA DNA
2
i)Total No. of PDP Context Activation Requests (from
SGSN to GGSN) (A)24224794 61344076 DNA 58581304 NA NA 42662949 830216 DNA 70994397
ii)Total No. of PDP Context Activation Success (path
created b/w SGSN and GGSN) (B)24223840 61281204 DNA 58507142 NA NA 42526419 799798 DNA 70921133
iii) PDP Context Activation Success Rate =(B/A) *100 >=95% 100.00% 99.90% DNA 99.87% 98.87% 99.77% 99.68% 96.34% 100.00% 99.90%
3
i)RNC originated PS Domain Iu Connection Setup
Success (A)195004852 7912937918 DNA 1.156E+09 1113839 76496539 300542911 DNA 151790304 253260309
ii) RNC originated PS Domain Iu Connection Release (B) 1091965 87157659 DNA 13298542 7273 2983279 2559801 DNA 3154747 11302090
iii) Drop Rate = (B/A) * 100 <=5% 0.56% 1.10% DNA 1.15% 0.65% 3.90% 0.85% DNA 2.08% 4.46%
May-16
Cellular Mobile Telephone Services
Network Service Quality Parameter
Service Activation/ Provisioning
PDP Context Activation Success Rate
Drop Rate

April to June 2016 – UP East Circle 46
6.31. 3 DAYS LIVE WIRELESS DATA 2G PMR – JUNE
6.32. 3 DAYS LIVE WIRELESS DATA 2G PMR – CONSOLIDATED
S. No. Name of Parameter Benchmark AIRCEL AIRTEL BSNL IDEA RCOM CDMA RCOM GSM TELENORTTSL
CDMATTSL GSM VODAFONE
1
i) Total No. of Subscribers for Service Activation (A) DNA DNA DNA 41512 183 8664 65233 DNA DNA DNA
ii) Total Service Activations provided within 4 Hours (B) DNA DNA DNA 41512 183 8664 63532 DNA DNA DNA
iii) Service Activation / Provisioning = (B/A) * 100Within 4 Hours with 95%
Success RateDNA DNA DNA 100.00% 100.00% 100.00% 97.39% DNA DNA DNA
2
i)Total No. of PDP Context Activation Requests (from SGSN to GGSN)
(A)DNA 65318053 DNA 58690572 DNA DNA 45700348 875025 DNA 63748862
ii)Total No. of PDP Context Activation Success (path created b/w SGSN
and GGSN) (B)DNA 65268003 DNA 58619618 DNA DNA 42285662 843752 DNA 63688411
iii) PDP Context Activation Success Rate =(B/A) *100 >=95% DNA 99.92% DNA 99.88% 98.79% 99.92% 92.53% 96.43% 99.95% 99.91%
3
i) RNC originated PS Domain Iu Connection Setup Success (A) DNA 7834658202 DNA 1328281804 1118084 75354532 322976083 DNA 134144459 236471968
ii) RNC originated PS Domain Iu Connection Release (B) DNA 85955582 DNA 21609609 9458 2929749 3387598 DNA 2983429 11873704
iii) Drop Rate = (B/A) * 100 <=5% DNA 1.10% DNA 1.63% 0.85% 3.89% 1.05% 2.22% 5.02%
Jun-16
Cellular Mobile Telephone Services
Network Service Quality Parameter
Service Activation/ Provisioning
PDP Context Activation Success Rate
B
S. No. Name of Parameter Benchmark AIRCEL AIRTEL BSNL IDEARCOM
CDMARCOM GSM TELENOR
TTSL
CDMATTSL GSM VODAFONE
1
i) Total No. of Subscribers for Service Activation (A) DNA DNA DNA 46159.33333 415 24086.66667 58631.66667 DNA DNA DNA
ii) Total Service Activations provided within 4 Hours (B) DNA DNA DNA 46159.33333 415 24085.66667 56982 DNA DNA DNA
iii) Service Activation / Provisioning = (B/A) * 100
Within 4
Hours
with 95%
Success
Rate
DNA DNA DNA 100.00% 100.00% 99.99% 96.89% DNA DNA DNA
2
i)Total No. of PDP Context Activation Requests (from SGSN to
GGSN) (A)23241743.5 64647251.67 DNA 57100641.33 DNA DNA 41112912 833251.7 468395 68089848.33
ii)Total No. of PDP Context Activation Success (path created b/w
SGSN and GGSN) (B)23239583 64589125.33 DNA 57032995.33 DNA DNA 39920014.67 803360.7 468086 67999697
iii) PDP Context Activation Success Rate =(B/A) *100 >=95% 99.99% 99.91% DNA 99.88% 98.74% 99.84% 97.38% 96.41% 99.96% 99.87%
3
i) RNC originated PS Domain Iu Connection Setup Success (A) 189466694 7719054148 DNA 1209158149 4916107 76487599 315784226 DNA 127601436 237318279
ii) RNC originated PS Domain Iu Connection Release (B) 1122826 82071848 DNA 16796252 50883 2831378 3380422 DNA 2702633 11186929
iii) Drop Rate = (B/A) * 100 <=5% 0.59% 1.06% DNA 1.38% 0.86% 3.70% 1.07% DNA 2.11% 4.72%
Service Activation/ Provisioning
PDP Context Activation Success Rate
Drop Rate
CONSOLIDATED
Cellular Mobile Telephone Services
Network Service Quality Parameter

April to June 2016 – UP East Circle 47
6.33. 3 DAYS LIVE WIRELESS DATA 3G PMR – APRIL
6.34. 3 DAYS LIVE WIRELESS DATA 3G PMR – MAY
S. No. Name of Parameter Benchmark AIRCEL AIRTEL BSNL IDEAVODAFO
NE
1
i) Total No. of Subscribers for Service Activation (A) DNA DNA DNA 47154 DNA
ii)Total Service Activations provided within 4 Hours
(B)DNA DNA DNA 47154 DNA
iii) Service Activation / Provisioning = (B/A) * 100Within 4 Hours with
95% Success RateDNA DNA DNA 100.00% DNA
2
i)Total No. of PDP Context Activation Requests
(from SGSN to GGSN) (A)22258693 DNA 10723615 42869934 28669250
ii)Total No. of PDP Context Activation Success
(path created b/w SGSN and GGSN) (B)22255326 DNA 10690670 42529602 28530575
iii)PDP Context Activation Success Rate =(B/A)
*100>=95% 99.98% 99.99% 99.69% 99.21% 99.52%
3
i)RNC originated PS Domain Iu Connection Setup
Success (A)16803020 645399.3 112720200 50420518 69521245
ii)RNC originated PS Domain Iu Connection
Release (B)112462 10156.72 3385399 852338 339950
iii) Drop Rate = (B/A) * 100 <=5% 0.67% 1.57% 3.00% 1.69% 0.49%
Apr-16
Cellular Mobile Telephone Services
Network Service Quality Parameter
Service Activation/ Provisioning
PDP Context Activation Success Rate
Drop Rate
S. No. Name of Parameter Benchmark AIRCEL AIRTEL BSNL IDEA VODAFONE
1
i)Total No. of Subscribers for Service
Activation (A)DNA DNA DNA 49812 DNA
ii)Total Service Activations provided
within 4 Hours (B)DNA DNA DNA 49812 DNA
iii)Service Activation / Provisioning =
(B/A) * 100
Within 4 Hours with
95% Success RateDNA DNA DNA 100.00% DNA
2
i)Total No. of PDP Context Activation
Requests (from SGSN to GGSN) (A)24224794 DNA 5503959 44674138 27867448
ii)
Total No. of PDP Context Activation
Success (path created b/w SGSN
and GGSN) (B)
24223840 DNA 5493702 44327240 27757234
iii)PDP Context Activation Success
Rate =(B/A) *100>=95% 100.00% DNA 99.81% 99.22% 99.60%
3
i)RNC originated PS Domain Iu
Connection Setup Success (A)17772660 DNA 113571424 61325351 68646911
ii)RNC originated PS Domain Iu
Connection Release (B)108602 DNA 3340008 997432 297713
iii) Drop Rate = (B/A) * 100 <=5% 0.61% DNA 2.94% 1.63% 0.43%
May-16
Cellular Mobile Telephone Services
Network Service Quality Parameter
Service Activation/ Provisioning
PDP Context Activation Success Rate
Drop Rate

April to June 2016 – UP East Circle 48
6.35. 3 DAYS LIVE WIRELESS DATA 3G PMR – JUNE
S. No. Name of Parameter Benchmark AIRCEL AIRTEL BSNL IDEA VODAFONE
1
i)Total No. of Subscribers for Service
Activation (A)DNA DNA DNA 41512 DNA
ii)Total Service Activations provided within
4 Hours (B)DNA DNA DNA 41512 DNA
iii)Service Activation / Provisioning = (B/A)
* 100
Within 4 Hours with
95% Success RateDNA DNA DNA 100.00% DNA
2
i)Total No. of PDP Context Activation
Requests (from SGSN to GGSN) (A)23717925 DNA DNA 45167672 27372948
ii)
Total No. of PDP Context Activation
Success (path created b/w SGSN and
GGSN) (B)
23715551 DNA DNA 44812760 27225985
iii)PDP Context Activation Success Rate
=(B/A) *100>=95% 99.99% DNA DNA 99.21% 99.46%
3
i)RNC originated PS Domain Iu
Connection Setup Success (A)16731209 DNA DNA 58966103 67571465
ii)RNC originated PS Domain Iu
Connection Release (B)147415 DNA DNA 1037833 340936
iii) Drop Rate = (B/A) * 100 <=5% 0.88% DNA DNA 1.76% 0.50%
Jun-16
Cellular Mobile Telephone Services
Network Service Quality Parameter
Service Activation/ Provisioning
PDP Context Activation Success Rate
Drop Rate

April to June 2016 – UP East Circle 49
6.36. 3 DAYS LIVE WIRELESS DATA 3G PMR – CONSOLIDATED
6.37. POI CONGESTION: CONSOLIDATED
S. No. Name of Parameter Benchmark AIRCEL AIRTEL BSNL IDEA VODAFONE
1
i) Total No. of Subscribers for Service Activation (A) DNA DNA DNA 46159 DNA
ii) Total Service Activations provided within 4 Hours (B) DNA DNA DNA 46159 DNA
iii) Service Activation / Provisioning = (B/A) * 100
Within 4
Hours with
95% Success
Rate
DNA DNA DNA 100.00% DNA
2
i)Total No. of PDP Context Activation Requests (from SGSN to
GGSN) (A)23400471 DNA 8113787 44237248 27969882
ii)Total No. of PDP Context Activation Success (path created
b/w SGSN and GGSN) (B)23398239 DNA 8092186 43889867 27837931
iii) PDP Context Activation Success Rate =(B/A) *100 >=95% 99.99% 99.99% 99.75% 99.21% 99.53%
3
i) RNC originated PS Domain Iu Connection Setup Success (A) 17102296 645399 113145812 56903991 68579874
ii) RNC originated PS Domain Iu Connection Release (B) 122826 10157 3362703 962534 326200
iii) Drop Rate = (B/A) * 100 <=5% 0.72% 1.57% 2.97% 1.69% 0.48%
CONSOLIDATED
Cellular Mobile Telephone Services
Network Service Quality Parameter
Service Activation/ Provisioning
PDP Context Activation Success Rate
Drop Rate
S. No. Name of Parameter Benchmark AIRCEL AIRTEL BSNL IDEARCOM
CDMA
RCOM
GSMTELENOR
TTSL
CDMATTSL GSM
VODAFON
E
Total No. of call attempts on POI 3930662 7605824 2926171 8772155 823282 1264017 5581885 1845226 323864 14303484
Total traffic served on all POIs
(Erlang) 82987 116003 728222 191472 15902 29328 104752 33225 5608 348746
Total No. of circuits on all
individual POIs 121182 189249 104140 316543 56826 49642 191370 74322 10347 607961
Total number of working POI
Service Area wise117 154 1132 342 144 51 31 160 19 44
Capacity of all POIs 115147 183335 70280 303955 43148 46462 182241 67333 9484 614004
No. of all POI’s having >=0.5%
POI congestion0 0 0 0 0 0 0 0 0 0
Name of POI not meeting the
benchmark (having >=0.5% POI
congestion)
NIL NIL NIL NIL NIL NIL NIL NIL NIL NIL
Consolidated
Monthly TRAI Network Performance Report of Cellular Mobile Telephone Service - Network Service
7
Total No. of POI’s in Month having < = 0.5% POI congestion

April to June 2016 – UP East Circle 50
6.38. POI CONGESTION: APRIL
6.39. POI CONGESTION: MAY
6.40. POI CONGESTION: JUNE
S. No. Name of Parameter Benchmark AIRCEL AIRTEL BSNL IDEA RCOM CDMA RCOM GSM TELENOR TTSL CDMA TTSL GSM VODAFONE
Total No. of call attempts on POI 3660643 7976756 3762696 8654762 870845 1246398 5244992 2060628 348345 14048974
Total traffic served on all POIs
(Erlang) 78216 123026 757852 188091 16977 28856 101401 37609 5445 343775
Total No. of circuits on all
individual POIs 114697 187818 140969 313942 57437 49165 190470 76056 10345 609853
Total number of working POI
Service Area wise112 155 93 333 139 53 31 160 20 44
Capacity of all POIs 108972 181857 93442 301486 43131 46014 181763 71353 9480 615915
No. of all POI’s having >=0.5%
POI congestion0 0 0 0 0 0 0 0 0 0
Name of POI not meeting the
benchmark (having >=0.5% POI
congestion)
NIL NIL NIL NIL NIL NIL NIL NIL NIL NIL
1
Total No. of POI’s in Month having < = 0.5% POI congestion
Monthly TRAI Network Performance Report of Cellular Mobile Telephone Service - Network Service
S. No. Name of Parameter Benchmark AIRCEL AIRTEL BSNL IDEA RCOM CDMA RCOM GSM TELENOR TTSL CDMA TTSL GSM VODAFONE
Total No. of POI’s in Month
Total No. of call attempts on POI 4155767 7904550 2089647 9018145 859757 1148520 5977492 1991754 317242 14452610
Total traffic served on all POIs
(Erlang) 86593 119790 698592 196444 16922 27091 108352 36285 5635 350106
Total No. of circuits on all
individual POIs 123972 187377 67311 317856 57917 48460 190778 73625 10345 604589
Total number of working POI
Service Area wise119 155 2171 345 148 50 31 160 20 44
Capacity of all POIs 117792 181413 47118 305200 44271 45443 182211 65322 9480 610597
No. of all POI’s having >=0.5%
POI congestion0 0 0 0 0 0 0 0 0 0
Name of POI not meeting the
benchmark (having >=0.5% POI
congestion)
NIL NIL NIL NIL NIL NIL NIL NIL NIL NIL
May-16
Monthly TRAI Network Performance Report of Cellular Mobile Telephone Service - Network Service
7
S. No. Name of Parameter Benchmark AIRCEL AIRTEL BSNL IDEA RCOM CDMA RCOM GSM TELENOR TTSL CDMA TTSL GSM VODAFONE
Total No. of call attempts on POI 3975578 6936167 DNA 8643558 739245 1397132 5523170 1483296 306005 14408867
Total traffic served on all POIs
(Erlang) 84152 105195 DNA 189880 13807 32037 104504 25781 5744 352359
Total No. of circuits on all
individual POIs 124876 192553 DNA 317832 55125 51300 192862 73284 10352 609441
Total number of working POI
Service Area wise119 153 DNA 349 144 51 31 160 17 43
Capacity of all POIs 118679 186734 DNA 305179 42043 47928 182748 65324 9494 615499
No. of all POI’s having >=0.5%
POI congestion0 0 0 0 0 0 0 0 0 1
Name of POI not meeting the
benchmark (having >=0.5% POI
congestion)
NIL NIL NIL NIL NIL NIL NIL NIL NIL NIL
Jun-16
Monthly TRAI Network Performance Report of Cellular Mobile Telephone Service - Network Service
7
Total No. of POI’s in Month having < = 0.5% POI congestion

April to June 2016 – UP East Circle 51
7. CUSTOMER SERVICE DELIVERY
7.1. BILLING AND CUSTOMER CARE
Name of Service Provider
Customer Care & Grievances Redressal
% of Complaints addressed at call centre level
% of Complaints addressed by Appellate Authority
Benchmark AIRCEL 100.00% 100.00% AIRTEL 98.05% 100.00% BSNL DNA DNA IDEA 100.00% 100.00%
RCOM CDMA 100.00% 100.00% RCOM GSM 100.00% 100.00% TELENOR DNA NIL
TTSL CDMA 99.85% 100.00% TTSL GSM 98.94% 79.07%
VODAFONE 100.00% NIL
Termination & Closures
Time taken for refund of
deposits after closures:
Benchmark
Postpaid
Subscribers
Prepaid
Subscribers
%age complaints
resolved within
4 weeks
%age
complaints
resolved
within 6 weeks
%age of where
credit/waiver is
received within one
week
% of Termination/
Closure of service
within 7 days (100 %)
Cleared over a period of <60 days
(100%)
%age of calls
answered by
the IVR
%age of call
answered by the
operators ( voice to
voice) within 90
seconds
Benchmark ≤ 0.1% ≤ 0.1% ≥ 98% = 100% = 100% = 100% = 100% ≥ 95% ≥ 95%AIRCEL 0.00% 0.00% NA NA 100.00% 100.00% 100.00% 98.28% 95.57%AIRTEL 0.01% 0.00% 100.00% 100.00% 100.00% 100.00% 100.00% 100.00% 77.03%BSNL DNA DNA DNA DNA DNA DNA DNA DNA DNAIDEA 0.04% 0.04% 100.00% 100.00% 100.00% 100.00% 100.00% 95.70% 99.74%
RCOM CDMA 0.09% 0.04% 100.00% 100.00% 100.00% 100.00% 85.93% 99.13% 88.15%RCOM GSM 0.08% 0.09% 100.00% 100.00% 100.00% 100.00% 76.26% 99.57% 93.74%TELENOR NA 0.02% NA NA 100.00% NA NA 99.04% 98.63%
TTSL CDMA 0.00% 0.00% NA NA 100.00% 100.00% 100.00% NA 99.77%TTSL GSM 0.00% 0.00% 100.00% 100.00% 100.00% 69.59% 100.00% 99.73% 97.56%VODAFONE 0.08% 0.01% 100.00% 100.00% 100.00% 100.00% 100.00% 100.00% 98.85%
Name of Service Provider
Metering and Billing
credibilityBilling Complaints
Response time to customer for
assistance

April to June 2016 – UP East Circle 52
7.2. LIVE CALLING DATA: CONSOLIDATED
Name of Service Provider
Metering and Billing (Service Request) Response time to customer for
Assistanse
Total Calls Attempted
No. of Subscribers
reached
Compalints/ Request
attended to satisfaction
% of Complaints/ Request attended
to satisfaction
Accessibility of call centre /
Customer care
%age of call answered by the
operators ( voice to voice) within 90
seconds
Benchmark ≥ 95% ≥ 95%
AIRCEL 80 49 45 91.84% 100.00% 96.00%
AIRTEL 211 119 115 96.64% 100.00% 100.00%
BSNL 357 250 227 90.80% 100.00% 100.00%
IDEA 345 200 198 99.00% 100.00% 100.00%
RCOM CDMA NA NA NA NA NA NA
RCOM GSM 230 179 168 93.85% 100.00% 94.00%
TELENOR 329 200 193 96.50% 97.00% 97.00%
TTSL CDMA 3 3 3 100.00% 100.00% 100.00%
TTSL GSM 300 122 119 97.54% 100.00% 100.00%
VODAFONE 224 190 168 88.42% 100.00% 98.00%
7.3. 3 DAYS LIVE CALL CENTRE DATA
Response time to customer assistance
OPERATOR
Total no of calls attempted to customer care/Call center
Total no. of calls successfully established to customer care/Call center
% age of Accessibility of
Call centre
Total Calls reached to operator for (Voice to Voice)
Total number of calls answered by the operator (Voice to voice) within 90 seconds
% age calls answered by the operator within
90 seconds
DAYS AVERAGE
OPERATOR >=95% >=95%
AIRCEL 727727 716357 98.44% 159694 156885 98.24%
AIRTEL 152494 152494 100.00% 279190 274769 98.42%
BSNL DNA DNA DNA DNA DNA DNA
IDEA 851987 851987 100.00% 255685 255638 99.98%
RCOM CDMA 21616 21349 98.76% 4900 4706 96.04%
RCOM GSM 182015 180942 99.41% 38126 37621 98.68%
TELENOR DNA DNA DNA DNA DNA DNA
TTSL CDMA DNA DNA DNA 198 197 99.49%
TTSL GSM 22198 21798 98.20% 32471 32111 98.89%
Vodafone DNA DNA DNA DNA DNA DNA

April to June 2016 – UP East Circle 53
8. L1 CALLING DATA
L1 Calling data covers all the SDCA covered across the four operator assisted drive tests:
Shahjahanpur: 4th May to 6th May 2016
Mirzapur: 25th May 2016 to 27th May 2016
Basti : 15th June to 17th June
8.1. SHAHJAHANPUR
AIRCEL
SR. NO. EMERGENCY NUMBER CALLS MADE Tilhar Jalalabad Powayan Hardoi Turn
1 100 5 √ √ √ √
2 101 5 √ √ √ √
3 102 5 √ √ √ √
4 104 5 × × × ×
5 108 5 √ √ √ √
6 138 5 × × × ×
7 149 5 × × × ×
8 181 5 × × × ×
9 182 5 √ √ √ √
10 1033 5 × × × ×
11 1037 5 × × × ×
12 1056 5 × × × ×
13 1060 5 × × × ×
14 1063 5 × × × ×
15 1064 5 × × × ×
16 1070 5 × × × ×
17 1071 5 × × × ×
18 1072 5 × × × ×
19 1073 5 √ × × √
20 1077 5 × × × ×
21 1090 5 √ √ √ √
22 1091 5 √ √ √ √
23 1097 5 √ √ √ √
24 1099 5 × × × ×
25 10580 5 × × × ×
26 10589 5 × × × ×
27 10740 5 × × × ×
28 10741 5 × × × ×
29 1511 5 × × × ×
30 1512 5 × × × ×
31 1514 5 × × × ×
32 15100 5 × × × ×
33 155304 5 × × × ×
34 155214 5 √ √ √ √
35 1903 5 √ √ √ √
36 1909 5 √ √ √ ×
37 1912 5 × × √ √
38 1916 5 × × × ×
39 1950 5 √ √ × ×

April to June 2016 – UP East Circle 54
AIRTEL
SR. NO. EMERGENCY
NUMBER CALLS MADE
Shajahnpur Hardoi Mod
Ram Leela Maidan
1 100 5 √ √ √
2 101 5 √ √ √
3 102 5 √ √ √
4 108 5 √ √ √
5 138 5 √ √ √
6 149 5 √ √ √
7 181 5 √ √ √
8 182 5 √ √ √
9 1071 5 √ √ √
10 1072 5 √ √ √
11 1073 5 √ 3 √
12 15100 5 √ √ √
13 155214 5 √ √ √
14 1903 5 √ √ √
15 1909 5 √ √ √
16 1912 5 √ √ √
17 1916 5 √ √ √
18 1950 5 √ √ √
19 1090 5 √ √ √
20 1091 5 √ √ √
21 1097 5 √ √ √
22 1552 5 √ √ √
23 102 5 × × ×
24 149 5 × × ×
25 1037 5 × × ×
26 1056 5 × × ×
27 1060 5 × × ×
28 1064 5 × × ×
29 1071 5 × × ×
30 1073 5 × × ×
31 1090 5 × × ×
32 1099 5 × × ×
33 10580 5 × × ×
34 10589 5 × × ×
35 10740 5 × × ×
36 10741 5 × × ×
37 1511 5 × × ×
38 1514 5 × × ×
39 1916 5 × × ×

April to June 2016 – UP East Circle 55
BSNL
SR. NO.
EMERGENCY NUMBER
CALLS MADE
TILHAR JALLALABAD POWAYA SHAHJAHANPUR
1 100 5 √ √ √ √
2 101 5 √ √ √ √
3 102 5 √ √ √ √
4 104 5 × × × ×
5 108 5 × × × ×
6 138 5 √ √ √ √
7 149 5 √ √ √ √
8 181 5 × × × ×
9 182 5 × × × ×
10 1033 5 √ √ √ √
11 1037 5 × × × ×
12 1056 5 × × × ×
13 1060 5 × × × ×
14 1063 5 × × × ×
15 1064 5 × × × ×
16 1070 5 × × × ×
17 1071 5 × × × ×
18 1072 5 × × × ×
19 1073 5 × × × ×
20 1077 5 × × × ×
21 1090 5 √ √ √ √
22 1091 5 × × × ×
23 1097 5 × × × ×
24 1099 5 × × × ×
25 10580 5 × × × ×
26 10589 5 × × × ×
27 10740 5 × × × ×
28 10741 5 × × × ×
29 1511 5 × × × ×
30 1512 5 × × × ×
31 1514 5 × × × ×
32 15100 5 √ √ √ √
33 155304 5 × × × ×
34 155214 5 × × × ×
35 1903 5 √ √ √ √
36 1909 5 √ √ √ √
37 1912 5 √ √ √ √
38 1916 5 × × × ×
39 1950 5 × × × ×

April to June 2016 – UP East Circle 56
IDEA
SR. NO. EMERGENCY
NUMBER CALLS MADE
Kannoj Chibramau Kaimganj Farukhabad
1 100 5 √ √ √ √
2 101 5 √ √ √ √
3 102 5 √ √ √ √
4 104 5 × × × ×
5 108 5 √ √ √ √
6 138 5 √ √ √ √
7 149 5 × × × ×
8 181 5 × × × ×
9 182 5 × × × ×
10 1033 5 × × × ×
11 1037 5 × × × ×
12 1056 5 × × × ×
13 1060 5 × × × ×
14 1063 5 × × × ×
15 1064 5 × × × ×
16 1070 5 × × × ×
17 1071 5 × × × ×
18 1072 5 × × × ×
19 1073 5 × × × ×
20 1077 5 × × × ×
21 1090 5 √ √ √ √
22 1091 5 × × × ×
23 1097 5 √ √ √ √
24 1099 5 × × × ×
25 10580 5 × × × ×
26 10589 5 × × × ×
27 10740 5 × × × ×
28 10741 5 × × × ×
29 1511 5 × × × ×
30 1512 5 √ √ √ √
31 1514 5 × × × ×
32 15100 5 × × × ×
33 155304 5 × × × ×
34 155214 5 × × × ×
35 1903 5 √ √ √ √
36 1909 5 √ √ √ √
37 1912 5 × × × ×
38 1916 5 × × × ×
39 1950 5 √ √ √ √
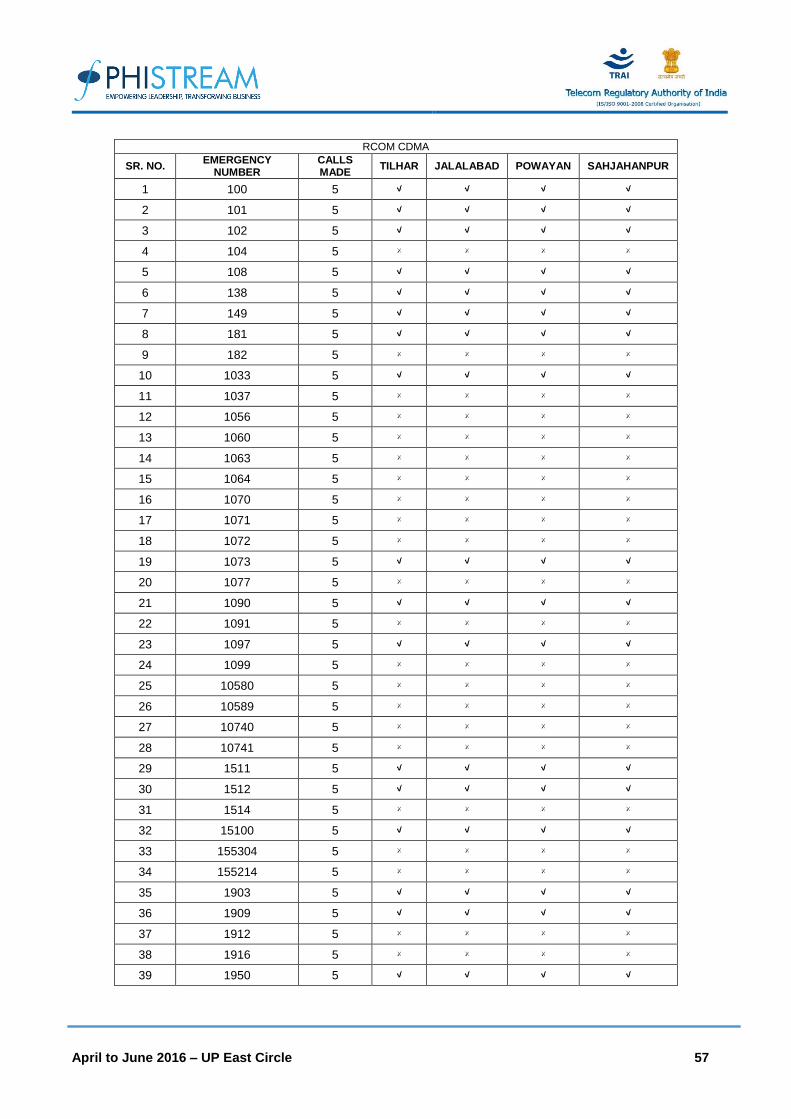
April to June 2016 – UP East Circle 57
RCOM CDMA
SR. NO. EMERGENCY
NUMBER CALLS MADE
TILHAR JALALABAD POWAYAN SAHJAHANPUR
1 100 5 √ √ √ √
2 101 5 √ √ √ √
3 102 5 √ √ √ √
4 104 5 × × × ×
5 108 5 √ √ √ √
6 138 5 √ √ √ √
7 149 5 √ √ √ √
8 181 5 √ √ √ √
9 182 5 × × × ×
10 1033 5 √ √ √ √
11 1037 5 × × × ×
12 1056 5 × × × ×
13 1060 5 × × × ×
14 1063 5 × × × ×
15 1064 5 × × × ×
16 1070 5 × × × ×
17 1071 5 × × × ×
18 1072 5 × × × ×
19 1073 5 √ √ √ √
20 1077 5 × × × ×
21 1090 5 √ √ √ √
22 1091 5 × × × ×
23 1097 5 √ √ √ √
24 1099 5 × × × ×
25 10580 5 × × × ×
26 10589 5 × × × ×
27 10740 5 × × × ×
28 10741 5 × × × ×
29 1511 5 √ √ √ √
30 1512 5 √ √ √ √
31 1514 5 × × × ×
32 15100 5 √ √ √ √
33 155304 5 × × × ×
34 155214 5 × × × ×
35 1903 5 √ √ √ √
36 1909 5 √ √ √ √
37 1912 5 × × × ×
38 1916 5 × × × ×
39 1950 5 √ √ √ √

April to June 2016 – UP East Circle 58
RCOM GSM
SR. NO. EMERGENCY
NUMBER CALLS MADE
TILHAR JALALABAD POWAYAN SAHJAHANPUR
1 100 5 √ √ √ √
2 101 5 √ √ √ √
3 102 5 √ √ √ √
4 104 5 × × × ×
5 108 5 √ √ √ √
6 138 5 √ √ √ √
7 149 5 √ √ √ √
8 181 5 √ √ √ √
9 182 5 × × × ×
10 1033 5 √ √ √ √
11 1037 5 × × × ×
12 1056 5 × × × ×
13 1060 5 × × × ×
14 1063 5 × × × ×
15 1064 5 × × × ×
16 1070 5 × × × ×
17 1071 5 × × × ×
18 1072 5 × × × ×
19 1073 5 √ √ √ √
20 1077 5 × × × ×
21 1090 5 √ √ √ √
22 1091 5 × × × ×
23 1097 5 √ √ √ √
24 1099 5 × × × ×
25 10580 5 × × × ×
26 10589 5 × × × ×
27 10740 5 × × × ×
28 10741 5 × × × ×
29 1511 5 √ √ √ √
30 1512 5 √ √ √ √
31 1514 5 × × × ×
32 15100 5 √ √ √ √
33 155304 5 × × × ×
34 155214 5 × × × ×
35 1903 5 √ √ √ √
36 1909 5 √ √ √ √
37 1912 5 × × × ×
38 1916 5 × × × ×
39 1950 5 √ √ √ √

April to June 2016 – UP East Circle 59
TATA CDMA
SR. NO. EMERGENCY
NUMBER CALLS MADE
TILHAR JALALABAD PUWAYAN SHAHJAHAPUR
1 100 5 √ √ √ √
2 101 5 √ √ √ ×
3 102 5 √ √ √ √
4 104 5 √ √ √ √
5 108 5 √ √ × √
6 138 5 × × × ×
7 149 5 √ × × ×
8 181 5 √ √ √ √
9 182 5 √ √ × √
10 1033 5 × √ × ×
11 1037 5 √ √ √ √
12 1056 5 √ √ √ √
13 1060 5 × × × ×
14 1063 5 × × × ×
15 1064 5 √ × √ √
16 1070 5 √ × √ √
17 1071 5 √ × √ √
18 1072 5 √ × √ √
19 1073 5 √ × √ √
20 1077 5 √ × √ √
21 1090 5 √ √ √ √
22 1091 5 √ √ √ √
23 1097 5 √ √ √ ×
24 1099 5 √ √ √ ×
25 10580 5 × × × ×
26 10589 5 × × × ×
27 10740 5 × × × ×
28 10741 5 × × × ×
29 1511 5 × × × ×
30 1512 5 × × × ×
31 1514 5 × × × ×
32 15100 5 √ √ √ √
33 155304 5 × × × ×
34 155214 5 × × × ×
35 1903 5 × √ √ ×
36 1909 5 √ √ √ ×
37 1912 5 × × × ×
38 1916 5 × × × ×
39 1950 5 × × × ×

April to June 2016 – UP East Circle 60
TATA GSM
SR. NO. EMERGENCY
NUMBER
CALLS MADE
Lilhar Jalalabad Puwayan Shahjahapur
1 100 5 √ √ √ √
2 101 5 √ √ √ √
3 102 5 √ √ √ √
4 104 5 × × × ×
5 108 5 √ √ √ √
6 138 5 √ √ √ √
7 149 5 × √ √ √
8 181 5 √ √ √ √
9 182 5 × × × ×
10 1033 5 √ √ √ √
11 1037 5 × √ × ×
12 1056 5 × √ × ×
13 1060 5 × × × ×
14 1063 5 × × × ×
15 1064 5 × × × ×
16 1070 5 × × × ×
17 1071 5 × × × ×
18 1072 5 × × × ×
19 1073 5 × √ √ √
20 1077 5 √ √ √ √
21 1090 5 √ × √ √
22 1091 5 × × √ ×
23 1097 5 √ √ √ ×
24 1099 5 × × × ×
25 10580 5 × × × ×
26 10589 5 × × × ×
27 10740 5 × × × ×
28 10741 5 × × × ×
29 1511 5 √ × × ×
30 1512 5 × × × ×
31 1514 5 × × × ×
32 15100 5 × √ × ×
33 155304 5 × × × ×
34 155214 5 × × × ×
35 1903 5 × √ √ √
36 1909 5 × × × ×
37 1912 5 × × √ ×
38 1916 5 × × × ×
39 1950 5 × × × ×

April to June 2016 – UP East Circle 61
VODAFONE
SR. NO. EMERGENCY
NUMBER CALLS MADE
Tilhar Jalalabad Puwayan Shahjhanpur
1 100 5 √ √ √ √
2 101 5 × × √ √
3 102 5 √ √ √ √
4 104 5 × × × ×
5 108 5 √ √ √ √
6 138 5 × × √ √
7 149 5 × × × ×
8 181 5 √ √ √ √
9 182 5 × × × ×
10 1033 5 × × × ×
11 1037 5 × × × ×
12 1056 5 × × × ×
13 1060 5 × × × ×
14 1063 5 √ √ √ √
15 1064 5 × × × ×
16 1070 5 × × × ×
17 1071 5 × × × ×
18 1072 5 × × × ×
19 1073 5 × × × ×
20 1077 5 × × × ×
21 1090 5 √ √ √ √
22 1091 5 √ √ √ √
23 1097 5 √ √ √ √
24 1099 5 × × × ×
25 10580 5 × × × ×
26 10589 5 × × × ×
27 10740 5 × × × ×
28 10741 5 × × × ×
29 1511 5 × × × ×
30 1512 5 × × × ×
31 1514 5 × × × ×
32 15100 5 √ √ √ √
33 155304 5 × × × ×
34 155214 5 √ √ √ √
35 1903 5 √ √ √ ×
36 1909 5 √ √ √ √
37 1912 5 × × × ×
38 1916 5 × × × ×
39 1950 5 √ √ × ×

April to June 2016 – UP East Circle 62
8.2. MIRZAPUR
AIRCEL
SR. NO. EMERGENCY
NUMBER CALLS MADE
Mirzapur Renukoot Birla
Temple
1 100 5 √ √ √
2 101 5 √ √ √
3 102 5 √ √ √
4 104 5 × × ×
5 108 5 √ √ √
6 138 5 × × ×
7 149 5 × × ×
8 181 5 × × ×
9 182 5 √ √ √
10 1033 5 × × ×
11 1037 5 × × ×
12 1056 5 × × ×
13 1060 5 × × ×
14 1063 5 × × ×
15 1064 5 × × ×
16 1070 5 × × ×
17 1071 5 × × ×
18 1072 5 × × ×
19 1073 5 √ × ×
20 1077 5 √ × ×
21 1090 5 √ √ √
22 1091 5 √ × ×
23 1097 5 √ √ ×
24 1099 5 × × ×
25 10580 5 × × ×
26 10589 5 × × ×
27 10740 5 × × ×
28 10741 5 × × ×
29 1511 5 × × ×
30 1512 5 × × ×
31 1514 5 × × ×
32 15100 5 × × ×
33 155304 5 × × ×
34 155214 5 √ × ×
35 1903 5 √ × ×
36 1909 5 √ √ √
37 1912 5 √ × ×
38 1916 5 × × ×
39 1950 5 √ × ×

April to June 2016 – UP East Circle 63
AIRTEL
SR. NO. EMERGENCY
NUMBER CALLS MADE
Mirzapur Robersganj Obera
1 100 5 √ √ √
2 101 5 √ √ √
3 102 5 √ √ √
4 105 5 √ √ √
5 138 5 √ √ √
6 149 5 √ √ √
7 181 5 √ √ √
8 182 5 √ √ √
9 1071 5 √ √ √
10 1072 5 √ √ √
11 1073 5 √ √ √
12 15100 5 √ √ √
13 155214 5 √ √ √
14 1903 5 √ √ √
15 1909 5 √ √ √
16 1912 5 √ √ √
17 1916 5 √ √ √
18 1950 5 √ √ √
19 1090 5 √ √ √
20 1091 5 √ √ √
21 1097 5 √ √ √
22 1552 5 √ √ √
23 102 5 × × ×
24 149 5 × × ×
25 1037 5 × × ×
26 1056 5 × × ×
27 1060 5 × × ×
28 1064 5 × × ×
29 1071 5 × × ×
30 1073 5 × × ×
31 1090 5 × × ×
32 1099 5 × × ×
33 10580 5 × × ×
34 10589 5 × × ×
35 10740 5 × × ×
36 10741 5 × × ×
37 1511 5 × × ×
38 1514 5 × × ×
39 1916 5 × × ×

April to June 2016 – UP East Circle 64
IDEA
SR. NO. EMERGENCY
NUMBER CALLS MADE
Mirzapur Robertsganj Renukoot
1 100 5 √ √ √
2 101 5 √ √ √
3 102 5 √ √ √
4 104 5 × × ×
5 108 5 √ √ √
6 138 5 √ √ √
7 149 5 × × ×
8 181 5 × × ×
9 182 5 √ √ √
10 1033 5 √ √ √
11 1037 5 × × ×
12 1056 5 × × ×
13 1060 5 × × ×
14 1063 5 × × ×
15 1064 5 × × ×
16 1070 5 × × ×
17 1071 5 × × ×
18 1072 5 √ √ √
19 1073 5 √ √ √
20 1077 5 × × ×
21 1090 5 √ √ √
22 1091 5 × × ×
23 1097 5 √ √ √
24 1099 5 × × ×
25 10580 5 × × ×
26 10589 5 × × ×
27 10740 5 × × ×
28 10741 5 × × ×
29 1511 5 × × ×
30 1512 5 √ √ √
31 1514 5 × × ×
32 15100 5 × × ×
33 155304 5 × × ×
34 155214 5 × × ×
35 1903 5 √ √ √
36 1909 5 √ √ √
37 1912 5 × × ×
38 1916 5 × × ×
39 1950 5 √ √ √

April to June 2016 – UP East Circle 65
RCOM CDMA
SR. NO. EMERGENCY
NUMBER CALLS MADE
Mirzapur Robertsganj Renukoot
1 100 5 √ √ √
2 101 5 √ √ √
3 102 5 √ √ ×
4 104 5 × × ×
5 108 5 √ √ √
6 138 5 √ × ×
7 149 5 √ √ √
8 181 5 √ √ √
9 182 5 √ × ×
10 1033 5 × × ×
11 1037 5 × × ×
12 1056 5 × × ×
13 1060 5 √ √ √
14 1063 5 × × ×
15 1064 5 × × ×
16 1070 5 × × ×
17 1071 5 × × ×
18 1072 5 √ √ √
19 1073 5 × × ×
20 1077 5 × × ×
21 1090 5 √ √ √
22 1091 5 × × ×
23 1097 5 √ √ √
24 1099 5 × × ×
25 10580 5 × × ×
26 10589 5 × × ×
27 10740 5 × × ×
28 10741 5 × × ×
29 1511 5 √ √ √
30 1512 5 × √ √
31 1514 5 √ √ √
32 15100 5 × × ×
33 155304 5 × × ×
34 155214 5 × × ×
35 1903 5 √ √ √
36 1909 5 √ √ √
37 1912 5 × √ √
38 1916 5 × × ×
39 1950 5 √ √ √

April to June 2016 – UP East Circle 66
RCOM GSM
SR. NO. EMERGENCY
NUMBER CALLS MADE
Mirzapur Robertsganj Renukoot
1 100 5 √ √ √
2 101 5 √ √ √
3 102 5 √ √ ×
4 104 5 × × ×
5 108 5 √ √ √
6 138 5 √ × ×
7 149 5 √ √ √
8 181 5 √ √ √
9 182 5 √ × ×
10 1033 5 × × ×
11 1037 5 × × ×
12 1056 5 × × ×
13 1060 5 √ √ √
14 1063 5 × × ×
15 1064 5 × × ×
16 1070 5 × × ×
17 1071 5 × × ×
18 1072 5 √ √ √
19 1073 5 × × ×
20 1077 5 × × ×
21 1090 5 √ √ √
22 1091 5 × × ×
23 1097 5 √ √ √
24 1099 5 × × ×
25 10580 5 × × ×
26 10589 5 × × ×
27 10740 5 × × ×
28 10741 5 × × ×
29 1511 5 √ √ √
30 1512 5 × √ √
31 1514 5 √ √ √
32 15100 5 × × ×
33 155304 5 × × ×
34 155214 5 × × ×
35 1903 5 √ √ √
36 1909 5 √ √ √
37 1912 5 × √ √
38 1916 5 × × ×
39 1950 5 √ √ √

April to June 2016 – UP East Circle 67
8.3. BASTI
Aircel
SR. NO.
EMERGENCY NUMBER
CALLS MADE
KHALILABAD DUMARIYAGANJ CHHABNI
BAZAR
1 100 5 √ √ √
2 101 5 √ √ √
3 102 5 √ √ √
4 104 5 × × ×
5 108 5 √ √ √
6 138 5 × × ×
7 149 5 × × ×
8 181 5 × × ×
9 182 5 √ √ √
10 1033 5 × × ×
11 1037 5 × × ×
12 1056 5 × × ×
13 1060 5 × × ×
14 1063 5 × × ×
15 1064 5 × × ×
16 1070 5 × × ×
17 1071 5 × × ×
18 1072 5 √ √ ×
19 1073 5 √ √ √
20 1077 5 √ × ×
21 1090 5 √ √ √
22 1091 5 √ × ×
23 1097 5 √ √ ×
24 1099 5 × × ×
25 10580 5 × × ×
26 10589 5 × × ×
27 10740 5 × × ×
28 10741 5 × × ×
29 1511 5 × × ×
30 1512 5 × × ×
31 1514 5 × × ×
32 15100 5 × × ×
33 155304 5 × × ×
34 155214 5 √ × ×
35 1903 5 √ √ √
36 1909 5 √ √ √
37 1912 5 √ × ×
38 1916 5 × × ×
39 1950 5 √ × ×

April to June 2016 – UP East Circle 68
Airtel
SR. NO. EMERGENCY
NUMBER CALLS MADE
Methwal Dumariya Gaung
1 100 5 √ √
2 101 5 √ √
3 102 5 √ √
5 108 5 √ √
6 138 5 √ √
7 149 5 √ √
8 181 5 √ √
8 182 5 √ √
9 1077 5 √ √
10 1090 5 √ √
11 1091 5 √ √
12 1512 5 √ √
13 15100 5 √ √
14 155214 5 √ √
15 1903 5 √ √
16 1909 5 √ √
17 1950 5 √ √
18 1912 5 √ √
19 104 0 × ×
20 1033 0 × ×
21 1037 0 × ×
22 1056 0 × ×
23 1060 0 × ×
24 1063 0 × ×
25 1064 0 × ×
26 1070 0 × ×
27 1071 0 × ×
28 1072 0 × ×
29 1073 0 × ×
30 1097 0 × ×
31 1099 0 × ×
32 10580 0 × ×
33 10589 0 × ×
34 10740 0 × ×
35 10741 0 × ×
36 1511 0 × ×
37 1514 0 × ×
38 155304 0 × ×
39 1916 0 × ×

April to June 2016 – UP East Circle 69
IDEA
SR. NO. EMERGENCY NUMBER CALLS MADE
Khalilabad Domariyaganj Chhawani
1 100 5 √ √ √
2 101 5 √ √ √
3 102 5 √ √ √
4 104 5 × × ×
5 108 5 √ √ √
6 138 5 × × ×
7 149 5 × × ×
8 181 5 × × ×
9 182 5 × × ×
10 1033 5 √ √ √
11 1037 5 × × ×
12 1056 5 × × ×
13 1060 5 × × ×
14 1063 5 × × ×
15 1064 5 × × ×
16 1070 5 × × ×
17 1071 5 × × ×
18 1072 5 × × ×
19 1073 5 × × ×
20 1077 5 × × ×
21 1090 5 √ √ √
22 1091 5 × × ×
23 1097 5 √ √ √
24 1099 5 × × ×
25 1511 5 × × ×
26 1512 5 × × ×
27 1514 5 × × ×
28 1903 5 √ √ √
29 1909 5 √ √ √
30 1912 5 × × ×
31 1916 5 × × ×
32 1950 5 √ √ √
33 10580 5 × × ×
34 10589 5 × × ×
35 10740 5 × × ×
36 10741 5 × × ×
37 15100 5 × × ×
38 155214 5 × × ×
39 155304 5 × × ×

April to June 2016 – UP East Circle 70
Telenor
SR. NO. EMERGENCY
NUMBER CALLS MADE
Sant Kabir Nagar Doomariyaganj Basti
1 100 5 √ √ √
2 101 5 × × √
3 102 5 √ √ √
4 104 5 × × ×
5 108 5 √ √ √
6 138 5 × × ×
7 191 5 × × ×
8 181 5 √ √ √
9 182 5 × × ×
10 1033 5 × × ×
11 1037 5 × × ×
12 1056 5 × × ×
13 1060 5 × × ×
14 1063 5 × × ×
15 1064 5 × × ×
16 1070 5 × × ×
17 1071 5 × × ×
18 1072 5 × × ×
19 1073 5 × × ×
20 1077 5 √ √ √
21 1090 5 √ √ √
22 1091 5 × × ×
23 1097 5 × × ×
24 1099 5 × × ×
25 10580 5 × × ×
26 10589 5 × × ×
27 10740 5 × × ×
28 10741 5 × × ×
29 1511 5 × × ×
30 1512 5 × × ×
31 1514 5 × × ×
32 15100 5 × × ×
33 155304 5 × × ×
34 155214 5 × × ×
35 1903 5 × × ×
36 1909 5 √ √ √
37 1912 5 × × ×
38 1916 5 × × ×
39 1950 5 √ √ √

April to June 2016 – UP East Circle 71
TTSL CDMA
SR. NO. EMERGENCY
NUMBER CALLS MADE
Khalilabad Domariya Ganj Basti
1 100 5 √ No Coverage √
2 101 5 √ No Coverage √
3 102 5 √ No Coverage √
4 104 5 √ No Coverage √
5 108 5 √ No Coverage √
6 138 5 √ No Coverage √
7 149 5 √ No Coverage √
8 181 5 × No Coverage ×
9 182 5 × No Coverage ×
10 1033 5 × No Coverage ×
11 1037 5 √ No Coverage √
12 1056 5 √ No Coverage √
13 1060 5 √ No Coverage √
14 1063 5 × No Coverage ×
15 1064 5 × No Coverage ×
16 1070 5 √ No Coverage √
17 1071 5 √ No Coverage √
18 1072 5 √ No Coverage ×
19 1073 5 √ No Coverage ×
20 1077 5 × No Coverage ×
21 1090 5 √ No Coverage √
22 1091 5 × No Coverage √
23 1097 5 √ No Coverage √
24 1099 5 × No Coverage √
25 10580 5 √ No Coverage ×
26 10589 5 √ No Coverage ×
27 10740 5 × No Coverage ×
28 10741 5 × No Coverage ×
29 1511 5 √ No Coverage √
30 1512 5 √ No Coverage √
31 1514 5 × No Coverage ×
32 15100 5 √ No Coverage √
33 155304 5 × No Coverage ×
34 155214 5 × No Coverage ×
35 1903 5 √ No Coverage ×
36 1909 5 √ No Coverage √
37 1912 5 × No Coverage ×
38 1916 5 × No Coverage ×
39 1950 5 × No Coverage ×

April to June 2016 – UP East Circle 72
TTSL GSM
SR. NO. EMERGENCY
NUMBER CALLS MADE
Khalilabad Domariya Ganj Chhawani
1 100 5 √ √ √
2 101 5 √ √ √
3 102 5 √ √ √
4 104 5 √ √ √
5 108 5 √ √ √
6 138 5 √ √ √
7 149 5 √ √ √
8 181 5 √ √ √
9 182 5 × √ √
10 1033 5 √ √ √
11 1037 5 × √ √
12 1056 5 × √ √
13 1060 5 × × ×
14 1063 5 × × ×
15 1064 5 × × ×
16 1070 5 × √ √
17 1071 5 √ √ ×
18 1072 5 × √ ×
19 1073 5 √ √ ×
20 1077 5 √ √ √
21 1090 5 √ √ √
22 1091 5 × √ √
23 1097 5 √ √ ×
24 1099 5 × √ √
25 10580 5 × × ×
26 10589 5 × × ×
27 10740 5 × × ×
28 10741 5 × × ×
29 1511 5 × × ×
30 1512 5 × × ×
31 1514 5 × × ×
32 15100 5 × √ √
33 155304 5 × × √
34 155214 5 × × ×
35 1903 5 × √ ×
36 1909 5 × √ ×
37 1912 5 × √ ×
38 1916 5 × × ×
39 1950 5 × × ×

April to June 2016 – UP East Circle 73
Vodafone
SR. NO. EMERGENCY
NUMBER CALLS MADE
Near Mehdawal
Dumariaganj Haraiya
1 100 5 √ √ √
2 101 5 √ √ √
3 102 5 √ √ √
4 104 5 × √ √
5 108 5 √ √ √
6 138 5 × × ×
7 149 5 × × ×
8 181 5 × × ×
9 182 5 × × ×
10 1033 5 × × ×
11 1037 5 × × ×
12 1056 5 × × ×
13 1060 5 × × ×
14 1063 5 × × ×
15 1064 5 × × ×
16 1070 5 × × ×
17 1071 5 × × ×
18 1072 5 × × ×
19 1073 5 × × ×
20 1077 5 √ × √
21 1090 5 √ √ √
22 1091 5 √ √ √
23 1097 5 √ √ √
24 1099 5 × × ×
25 10580 5 × × ×
26 10589 5 × × ×
27 10740 5 × × ×
28 10741 5 × × ×
29 1511 5 × × ×
30 1512 5 × × ×
31 1514 5 × × ×
32 15100 5 × × √
33 155304 5 × × ×
34 155214 5 × × √
35 1903 5 × × √
36 1909 5 √ √ √
37 1912 5 × × ×
38 1916 5 × × ×
39 1950 5 × × ×

April to June 2016 – UP East Circle 74
9. OPERATOR ASSISTED DRIVE TEST
The drive test was conducted simultaneously for all the operators present in the UP East circle. As
per the new directive given by TRAI headquarters, drive test for the month of April, May and June,
2016 were conducted at a SSA level. Drive test was conducted for three days in each SSA and the
selection of routes ensured that the maximum towns, villages, highways are covered as part of drive
test. The routes were selected on basis of the complaints received from the customers. The auditors
were present in vehicles of every operator. The holding period for all test calls was 120 seconds and
the gap between calls was 10 seconds.
For measuring voice quality RxQual samples for GSM operators and Frame Error Rate (FERs) for
CDMA service providers were measured. RxQual greater than 5 meant that the sample was not of
appropriate voice quality and for CDMA operators FERs of more than 4 were considered bad. Call
drops were measured by the number of calls that were dropped to the total number of calls established
during the drive test. Similarly CSSR was measured as the ratio of total calls established to the total
call attempts made. Signal strength was measured in Dbm with strength > -75dbm for indoor, -85 dbm
for in-vehicle and > -95 dbm outdoor routes. Below is the schedule and operators involved in the
drive test for the UP East circle.
9.1. MAY: SHAHJAHANPUR SSA
Month Name of SSA covered Drive Test Schedule
May 2016 SHAHJAHANPUR May 4, 2016 to May 6, 2016
9.2. DISTANCE COVERED: SHAHJAHANPUR SSA
Drive Test Distance Covered Day 1 Day 2 Day 3
SHAHJAHANPUR SSA 135 km 178 km 110 km
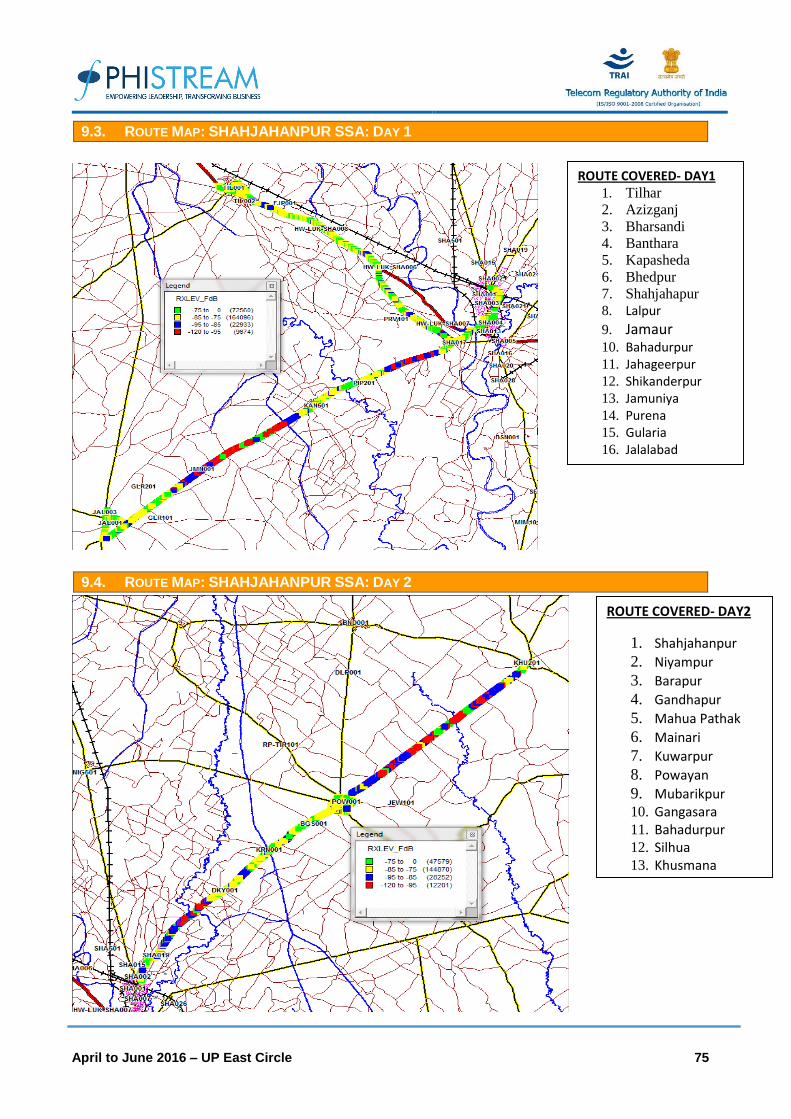
April to June 2016 – UP East Circle 75
9.3. ROUTE MAP: SHAHJAHANPUR SSA: DAY 1
9.4. ROUTE MAP: SHAHJAHANPUR SSA: DAY 2
ROUTE COVERED- DAY1 1. Tilhar
2. Azizganj
3. Bharsandi
4. Banthara
5. Kapasheda
6. Bhedpur
7. Shahjahapur
8. Lalpur
9. Jamaur
10. Bahadurpur 11. Jahageerpur 12. Shikanderpur 13. Jamuniya
14. Purena
15. Gularia
16. Jalalabad
ROUTE COVERED- DAY2
1. Shahjahanpur
2. Niyampur
3. Barapur
4. Gandhapur
5. Mahua Pathak
6. Mainari
7. Kuwarpur
8. Powayan
9. Mubarikpur 10. Gangasara
11. Bahadurpur 12. Silhua
13. Khusmana

April to June 2016 – UP East Circle 76
9.5. ROUTE MAP: SHAHJAHANPUR SSA: DAY 3
9.6. DRIVE TEST OUTCOME
Aircel Airtel Idea TELENOR
Bsnl Rcom GSM
Rcom CDMA
Tata CDMA
Tata GSM VODAFONE
Total Calls Attempt (A) 479 501 510 443 688 393 411 297 409 457
Total Calls Blocked (B) 2 5 5 2 88 1 0 0 1 1
Blocked Call Rate in % (B*100/A)
0.42% 1.00% 0.98% 0.45%
12.79% 0.25% 0.00% 0.00%
0.2% 0.22%
Total Calls Established ('C) 477 496 503 441 564 392 411 293 408 456
Total Calls Drop (D) 0 0 0 1 14 2 3 0 0 0
Dropped Calls Rate in % (D*100/C)
0.00% 0.00% 0.00% 0.22%
2.48% 0.51% 0.73%
0.00%
0.00% 0.00%
Call Setup Success Rate in % (C*100/A)
99.58% 99.00% 98.63% 99.55%
81.98% 99.75% 100.00%
98.65%
99.76% 99.78%
Handover Success Rate % (total HO Success * 100/Total
HO attempt) 100% 99.8% 99.80% 99.18%
84.44% 100% 100.00%
100%
100% 100%
ROUTE COVERED- DAY3
1. Jalal Nagar
2. Ram Nagar Colony
3. Parzai
4. Taran Tickey
5. Shahjahanpur
6. Bijlipura 7. Sabji Mandi 8. South City
9. Misripur 10. Jamuthi 11. Ballia
12. Chauthera
13. Badshahnagar

April to June 2016 – UP East Circle 77
9.7. MAY: MIRZAPUR SSA
Month Name of SSA covered Drive Test Schedule
May 2016 MIRZAPUR May 25, 2016 to May 27, 2016
9.8. DISTANCE COVERED: MIRZAPUR SSA
Drive Test Distance Covered Day 1 Day 2 Day 3
MIRZAPUR SSA 135 km 190 km 170 km
9.9. ROUTE MAP: MIRZAPUR SSA: DAY 1
Route Covered- Day 1
1 Mirzapur Station
2 Mirzapur
3 Laalganj
4 Halia
5 Halia Market
6 SBI
7 PNB

April to June 2016 – UP East Circle 78
9.10. ROUTE MAP: MIRZAPUR SSA: DAY 2
Route Covered- Day 2
1 BSNL Office
2 Chunar Market
3 Ghantaghar
4 Police Station
5 Tahsil
6 Nagarnigam
7 Rudhauli
8 Dharamshala
9 Ahrura
10 Robertganj
11 Renukoot

April to June 2016 – UP East Circle 79
9.11. ROUTE MAP: MIRZAPUR SSA: DAY 3
9.12. DRIVE TEST OUTCOME
Aircel Airtel Idea TELENOR RCOM GSM RCOM CDMA VODAFONE
Total Calls Attempt (A) 218 467 443 357 212 213 528
Total Calls Blocked (B) 1 3 7 10 5 0 4
Blocked Call Rate in % (B*100/A) 0.46% 0.64% 1.58% 2.80% 2.36% 0.00% 0.76%
Total Calls Established ('C) 217 464 436 347 207 213 524
Total Calls Drop (D) 0 1 2 1 0 1 0
Dropped Calls Rate in % (D*100/C) 0.00% 0.22% 0.46% 0.29% 0.00% 0.47% 0.00%
Call Setup Success Rate in % (C*100/A)
99.54% 99.36% 98.42% 97.20% 97.64% 100.00% 99.24%
Handover Success Rate % (total HO Success * 100/Total HO
attempt) 98.83% 99.5% 97.30% 98.52% 99.65% 100.00% 98.26%
Route Covered- Day 3
1 Birla Temple
2 Renukoot
3 Rihand Dam
4 Pipri
5 Murdhawa Mod
6 Obra
7 Dudhi
8 Yindhamganj
9 Kon

April to June 2016 – UP East Circle 80
9.13. BASTI SSA
Month Name of SSA covered Drive Test Schedule
JUNE BASTI 15th June – 17th June
9.14. DISTANCE COVERED: BASTI SSA
Drive Test Distance Covered Day 1 Day 2 Day 3
Basti SSA 170 km 200 km 130 km
9.15. ROUTE MAP: BASTI SSA: DAY 1

April to June 2016 – UP East Circle 81
9.16. ROUTE MAP: BASTI SSA: DAY 2

April to June 2016 – UP East Circle 82
9.17. ROUTE MAP: BASTI SSA: DAY 3
9.18. DRIVE TEST OUTCOME
TELENOR Aircel Airtel MTS IDEA RCOM GSM TTSL GSM TTSL CDMA Vodafone
Total Calls Attempt (A) 411 420 540
DNA 540 DNA 388 179 680
Total Calls Blocked (B) 4 1 6 DNA 6 DNA 1 0 2
Blocked Call Rate in % (B*100/A) 0.97% 0.24 1.11% DNA 1.11% DNA 0.26% 0.00% 0.29%
Total Calls Established ('C) 407 419 534 DNA 534 DNA 386 178 678
Total Calls Drop (D) 0 0 0 DNA 0 DNA 0 1 1
Dropped Calls Rate in % (D*100/C) 0.00 0.00 0.00% DNA 0.00% DNA 0.00% 0.56% 0.15% Call Setup Success Rate in %
(C*100/A) 99.03 99.76 98.89% DNA 98.89% DNA 99.48% 99.44% 99.71%
Handover Success Rate % (total HO Success * 100/Total HO attempt)
99.40 97.14 98.5% DNA 98.5% DNA 100.0% 100.0% 100.00%

April to June 2016 – UP East Circle 83
10. COUNTER DETAILS
Sl
No. KPI Formula with Counter Description
1 CSSR= (No of established Calls / No of Attempted Calls)%
No of established Calls = ([Assignment Requests]-([Failed Assignments (Signaling Channel)]+[Failed Assignments during MOC on the A Interface (Including Directed Retry)]+[Failed Assignments during MTC on the A Interface (Including Directed Retry)]+[Failed Assignments during Emergency Call on the A Interface (Including Directed Retry)] +[Failed Assignments during Call Re-establishment on the A Interface (Including Directed Retry)]+[Failed Mode Modify Attempts (MOC) (TCHF)]+[Failed Mode Modify Attempts (MTC) (TCHF)]+[Failed Mode Modify Attempts (Emergency Call) (TCHF)]+[Failed Mode Modify Attempts (Call Re-establishment) (TCHF)]+[Failed Mode Modify Attempts (MOC) (TCHH)]+[Failed Mode Modify Attempts (MTC) (TCHH)]+[Failed Mode Modify Attempts (Call Re-establishment) (TCHH)]))/No of Attempted Calls = ([Assignment Requests (Signaling Channel) (TCH)] + [Assignment Requests (Signaling Channel) (SDCCH)] + [Assignment Requests (TCHF Only)] + [Assignment Requests (TCHH Only)] + [Assignment Requests (TCHF Preferred, Channel Type Unchangeable)] + [Assignment Requests (TCHH Preferred, Channel Type Unchangeable)] + [Assignment Requests (TCHF or TCHH, Channel Type Unchangeable)] + [Assignment Requests (TCHF Preferred, Channel Type Changeable)] + [Assignment Requests (TCHH Preferred, Channel Type Changeable)] + [Assignment Requests (TCHF or TCHH, Channel Type Changeable)])
2 SDCCH congestion= (SDCCH Failure/SDCCH attempts)%
SDCCH Failure= ([Channel Assignment Failures (All Channels Busy or Channels Unconfigured) in Immediate Assignment Procedure (SDCCH)] + [Failed Internal Intra-Cell Handovers (No Channel Available) (SDCCH)] + [Number of Unsuccessful Incoming Internal Inter-Cell Handovers (No Channel Available) (SDCCH)] + [Failed Incoming External Inter-Cell Handovers (No Channel Available) (SDCCH)])/SDCCH attempts = ([Channel Assignment Requests in Immediate Assignment Procedure (SDCCH)] + [Internal Intra-Cell Handover Requests (SDCCH)] + [Number of Incoming Internal Inter-Cell Handover Requests (SDCCH) (900/850/810-900/850/810)] + [Number of Incoming Internal Inter-Cell Handover Requests (SDCCH) (1800/1900-1800/1900)] + [Number of Incoming Internal Inter-Cell Handover Requests (SDCCH) (900/850/810-1800/1900)] + [Number of Incoming Internal Inter-Cell Handover Requests (SDCCH) (1800/1900-900/850/810)] + [Incoming External Inter-Cell Handover Requests (SDCCH) (900/850/810-900/850/810)] + [Incoming External Inter-Cell Handover Requests (SDCCH) (1800/1900-1800/1900)] + [Incoming External Inter-Cell Handover Requests (SDCCH) (900/850/810-1800/1900)] + [Incoming External Inter-Cell Handover Requests (SDCCH) (1800/1900-900/850/810)])
3 TCH congestion= (TCH Failures /TCH Attempts)%
TCH Failures= ((Failed TCH Seizures due to Busy TCH (Signaling Channel)+([Failed Assignments (First Assignment, No Channel Available in Assignment Procedure)]+[Failed Assignments (First Assignment, No Channel Available in Directed Retry Procedure)]+[Failed Assignments (Reconnection to Old Channels, No Channel Available in Assignment)]+[Failed Assignments (Reconnection to Old Channels, No Channel Available in Directed Retry)])/TCH Attempts = ([Assignment Requests (Signaling Channel) (TCH)] + [Assignment Requests (Signaling Channel) (SDCCH)] + [Assignment Requests (TCHF Only)] + [Assignment Requests (TCHH Only)] + [Assignment Requests (TCHF Preferred, Channel Type Unchangeable)] + [Assignment Requests (TCHH Preferred, Channel Type Unchangeable)] + [Assignment Requests (TCHF or TCHH, Channel Type Unchangeable)] + [Assignment Requests (TCHF Preferred, Channel Type Changeable)] + [Assignment Requests (TCHH Preferred, Channel Type Changeable)] + [Assignment Requests (TCHF or TCHH, Channel Type Changeable)])
4 Call Drop Rate= (The total no of dropped calls*100)/Total no of calls successfully established (where traffic channel is allotted)
The total no of dropped calls= ([Call Drops on Radio Interface in Stable State (Traffic Channel)] + [Call Drops on Radio Interface in Handover State (Traffic Channel)] + [Call Drops Due to No MR from MS for a Long Time (Traffic Channel)] + [Call Drops due to Abis Terrestrial Link Failure (Traffic Channel)] + [Call Drops due to Equipment Failure (Traffic Channel)] + [Call Drops due to Forced Handover (Traffic Channel)] + [Call Drops due to local switching Start Failure] + [Call Drops

April to June 2016 – UP East Circle 84
due to Failures to Return to Normal Call from local switching])/Total no of calls successfully established (where traffic channel is allotted) = ([Assignment Requests]-([Failed Assignments (Signaling Channel)]+[Failed Assignments during MOC on the A Interface (Including Directed Retry)]+[Failed Assignments during MTC on the A Interface (Including Directed Retry)]+[Failed Assignments during Emergency Call on the A Interface (Including Directed Retry)] +[Failed Assignments during Call Re-establishment on the A Interface (Including Directed Retry)]+[Failed Mode Modify Attempts (MOC) (TCHF)]+[Failed Mode Modify Attempts (MTC) (TCHF)]+[Failed Mode Modify Attempts (Emergency Call) (TCHF)]+[Failed Mode Modify Attempts (Call Re-establishment) (TCHF)]+[Failed Mode Modify Attempts (MOC) (TCHH)]+[Failed Mode Modify Attempts (MTC) (TCHH)]+[Failed Mode Modify Attempts (Call Re-establishment) (TCHH)])
5 Call Drop Rate= (No of cells having call drop rate >3% during CBBH in a month*100)/Total no of cells in the licensed service area
Above formula with counters being used in CBBH.
6 Connection with good quality voice= (Connection with good quality voice/Total voice samples)%
Connection with good quality voice = ((Number of MRs on Downlink TCHF (Receive Quality Rank 0)+Number of MRs on Downlink TCHF (Receive Quality Rank 1)+Number of MRs on Downlink TCHF (Receive Quality Rank 2)+Number of MRs on Downlink TCHF (Receive Quality Rank 3)+Number of MRs on Downlink TCHF (Receive Quality Rank 4)+Number of MRs on Downlink TCHF (Receive Quality Rank 5)+Number of MRs on Downlink TCHH (Receive Quality Rank 0)+Number of MRs on Downlink TCHH (Receive Quality Rank 1)+Number of MRs on Downlink TCHH (Receive Quality Rank 2)+Number of MRs on Downlink TCHH (Receive Quality Rank 3)+Number of MRs on Downlink TCHH (Receive Quality Rank 4)+Number of MRs on Downlink TCHH (Receive Quality Rank 5)) /Total voice samples= ((Number of MRs on Downlink TCHF (Receive Quality Rank 0)+Number of MRs on Downlink TCHF (Receive Quality Rank 1)+Number of MRs on Downlink TCHF (Receive Quality Rank 2)+Number of MRs on Downlink TCHF (Receive Quality Rank 3)+Number of MRs on Downlink TCHF (Receive Quality Rank 4)+Number of MRs on Downlink TCHF (Receive Quality Rank 5)+Number of MRs on Downlink TCHF (Receive Quality Rank 6)+Number of MRs on Downlink TCHF (Receive Quality Rank 7)+Number of MRs on Downlink TCHH (Receive Quality Rank 0)+:Number of MRs on Downlink TCHH (Receive Quality Rank 1)+Number of MRs on Downlink TCHH (Receive Quality Rank 2)+Number of MRs on Downlink TCHH (Receive Quality Rank 3)+Number of MRs on Downlink TCHH (Receive Quality Rank 4)+Number of MRs on Downlink TCHH (Receive Quality Rank 5)+Number of MRs on Downlink TCHH (Receive Quality Rank 6)+Number of MRs on Downlink TCHH (Receive Quality Rank 7))
10.1. ERICSSON
Sl
No. KPI Ericsson
1 CSSR= (No of established Calls / No of Attempted Calls)%
CSSR (No of established Calls / No of Attempted Calls)=(TCASSALL/TASSALL)*100
2 SDCCH congestion= (SDCCH Failure/SDCCH attempts)%
SDCCH congestion (SDCCH Failure/SDCCH attempts)% = (CCONGS/CCALLS)*100
3 TCH congestion= (TCH Failures /TCH Attempts)%
TCH congestion (TCH Failures /TCH Attempts)%= (CNRELCONG+TNRELCONG)/TASSALL)*100
4 Call Drop Rate= (The total no of dropped calls*100)/Total no of calls successfully established (where traffic channel is allotted)
Call Drop Rate (Total no dropped calls/No of established calls)%= (TNDROP)/TCASSALL*100
5 Call Drop Rate= (No of cells having call drop rate >3% during CBBH in a month*100)/Total no of cells in the licensed service area
Above formula with counters being used in CBBH.

April to June 2016 – UP East Circle 85
6 Connection with good quality voice= (Connection with good quality voice/Total voice samples)%
Connection with good quality voice (Connection with good quality voice samples 0-5 /Total voice samples)= 100 * (QUAL50DL + QUAL40DL + QUAL30DL + QUAL20DL + QUAL10DL + QUAL00DL) / (QUAL70DL + QUAL60DL + QUAL50DL + QUAL40DL + QUAL30DL + QUAL20DL + QUAL10DL + QUAL00DL)
Ericsson Counters Counter Counter Description TCASSALL Number of assignment complete messages on TCH for all MS classes TASSALL Number of first assignment attempts on TCH for all MS classes. CNRELCONG Number of released connections on SDCCH due to TCH or Transcoder (TRA) congestion. TNRELCONG Number of released TCH signalling connections due to transcoder resource congestion during immediate assignment
on TCH CCONGS Congestion counter for SDCCH. Stepped per congested allocation attempt. CCALLS Channel allocation attempt counter on SDCCH. TNDROP The total number of dropped TCH Connections. QUAL00DL Number of quality 0 reported on downlink. QUAL10DL Number of quality 1 reported on downlink. QUAL20DL Number of quality 2 reported on downlink. QUAL30DL Number of quality 3 reported on downlink. QUAL40DL Number of quality 4 reported on downlink. QUAL50DL Number of quality 5 reported on downlink. QUAL60DL Number of quality 6 reported on downlink. QUAL70DL Number of quality 7 reported on downlink
10.2. NSN (NOKIA SIEMENS NETWORK)
Sl No.
KPI NSN
1 CSSR= (No of established Calls / No of Attempted Calls)%
CSSR= 100-100*((SDCCH_BUSY_ATT)-(TCH_SEIZ_DUE_SDCCH_CON) + (SDCCH_RADIO_FAIL)+(SDCCH_RF_OLD_HO)+(SDCCH_USER_ACT)+(SDCCH_BCSU_RESET)+(SDCCH_NETW_ACT)+(SDCCH_BTS_FAIL)+(SDCCH_LAPD_FAIL)+ (BLCK_8I_NOM)/ {(CH_REQ_MSG_REC)+(PACKET_CH_REQ)}-{(GHOST_CCCH_RES)-(REJ_SEIZ_ATT_DUE_DIST)}
2 SDCCH congestion= (SDCCH Failure/SDCCH attempts)%
SDCCH congestion = (sdcch_busy_att - .tch_seiz_due_sdcch_con)/{(CH_REQ_MSG_REC)+(PACKET_CH_REQ)}-{(GHOST_CCCH_RES)-(REJ_SEIZ_ATT_DUE_DIST)}
3 TCH congestion= (TCH Failures /TCH Attempts)%
TCH congestion = BLCK_8I_NOM / {(TCH_NORM_SEIZ)+(MSC_I_SDCCH_TCH_AT)+(BSC_I_SDCCH_TCH_AT)}
4 Call Drop Rate= (The total no of dropped calls*100)/Total no of calls successfully established (where traffic channel is allotted)
TCH Drop = ( drop_after_tch_assign)-(tch_re_est_release) / {(TCH_NORM_SEIZ)+(MSC_I_SDCCH_TCH_AT)+(BSC_I_SDCCH_TCH_AT)}
5 Call Drop Rate= (No of cells having call drop rate >3% during CBBH in a month*100)/Total no of cells in the licensed service area
Above formula with counters being used in CBBH.
6 Connection with good quality voice= (Connection with good quality voice/Total voice samples)%
Connection with good quality voice= (FREQ_DL_QUAL0+FREQ_DL_QUAL1+FREQ_DL_QUAL2+FREQ_DL_QUAL3+FREQ_DL_QUAL4+FREQ_DL_QUAL5) / (FREQ_DL_QUAL0+FREQ_DL_QUAL1+FREQ_DL_QUAL2+FREQ_DL_QUAL3+FREQ_DL_QUAL4+FREQ_DL_QUAL5+FREQ_DL_QUAL6+FREQ_DL_QUAL7)
10.3. HUAWEI
SR .NO
KPI HUAWEI FORMULA
1 CALL SETUP SUCCES (NUM)
[Successful CS IS-95 Orig Call Setups + Successful CS IS-2000 Orig Call Setups + Successful CS IS-95 Term Call Setups + Successful CS IS-2000 Term Call Setups] ([1157628567] + [1157628587] + [1157628568] + [1157628588] )
2 CALL SETUP SUCCES (DEN)
[CS IS-95 Orig Attempts + CS IS-2000 Orig Attempts + CS IS-95 Term Attempts + CS IS-2000 Term Attempts] ([1157628553] + [1157628573] + [1157628554] + [1157628574] )

April to June 2016 – UP East Circle 86
3 CALL SETUP SUCCESS RATE (%)
CALL SETUP SUCCES (NUM) / CALL SETUP SUCCES (DEN) * 100\
4 CALL DROP RATE (NUM)
[CS IS-95 Call Drops (Too many Erasure frames) + CS IS-2000 Call Drops (Too many Erasure frames) + CS IS-95 Call Drops (No reverse frame received) + CS IS-2000 Call Drops (No reverse frame received) + CS IS-95 Call Drops (Abis interface abnormal) + CS IS-2000 Call Drops (Abis interface abnormal) + CS IS-95 Call Drops (A2 interface abnormal) + CS IS-2000 Call Drops (A2 interface abnormal) + CS IS-95 Call Drops (HHO fail) + CS IS-2000 Call Drops (HHO fail) + CS IS-95 Call Drops (Other causes) + CS IS-2000 Call Drops (Other causes)] ([1157628608] + [1157628614] + [1157628609] + [1157628615] + [1157628610] + [1157628616] + [1157628611] + [1157628617] + [1157628612] + [1157628618] + [1157628613] + [1157628619])
5 CALL DROP RATE(DEN)
[Successful CS IS-95 Orig Call Setups + Successful CS IS-2000 Orig Call Setups + Successful CS IS-95 Term Call Setups + Successful CS IS-2000 Term Call Setups + CS IS-95 Successful Incoming Hard HOs + CS IS-2000 Successful Incoming Hard HOs] [1157628619]) x 100/([1157628567] + [1157628587] + [1157628568] + [1157628588] + [1157628569] + [1157628589]) ]
6 Call DROP Rate CALL DROP RATE (NUM) / CALL DROP RATE(DEN) * 100\
7 RF BLOCK RATE (NUM)
{[(TCH Assignment Requests-CS Orig-IS95[Times] + TCH Assignment Requests-CS Orig-IS2000[Times] + TCH Assignment Requests-CS Term-IS95[Times] + TCH Assignment Requests-CS Term-IS2000[Times]) - (Successful TCH Assignments-CS Orig-IS95[Times] + Successful TCH Assignments-CS Orig-IS2000[Times] + Successful TCH Assignments-CS Term-IS95[Times] + Successful TCH Assignments-CS Term-IS2000[Times] )] {[(1157628621 + 1157628628 + 1157628635+ 1157628642)
8 RF BLOCK RATE (DEN)
[((TCH Assignment Requests-CS Orig-IS95[Times] + TCH Assignment Requests-CS Orig-IS2000[Times] + TCH Assignment Requests-CS Term-IS95[Times] + TCH Assignment Requests-CS Term-IS2000[Times]))]} [(1157628621 + 1157628628 + 1157628635+ 1157628642)]}
9 RF BLOCK RATE
RF BLOCK RATE (NUM) / RF BLOCK RATE (DEN) *100
10 Call Quality (RFER)
CS Reverse Link Average FER of Carrier[%

April to June 2016 – UP East Circle 87
11. BLOCK SCHEMATIC DIAGRAM
11.1. ERICSSON

April to June 2016 – UP East Circle 88
11.2. NSN

April to June 2016 – UP East Circle 89
11.3. HUAWEI

April to June 2016 – UP East Circle 90
12. ABBREVIATIONS
Following terms/abbreviations have been used in this report. This section provides meaning of the abbreviations
used in the report.
TRAI – Telecom Regulatory Authority of India
QoS – Quality of Service
JFM’16 – Refers to the quarter of April, May and June 2016
SSA – Secondary Switching Area
NOC – Network Operation Center
OMC – Operations and Maintenance Center
MSC – Mobile Switching Center
PMR – Performance Monitoring Reports
TCBH – Time Consistent Busy Hour
CBBH - Cell Bouncing Busy Hour
BTS – Base Transceiver Station
CSSR – Call Setup Success Rate
TCH – Traffic Channel
SDCCH – Standalone Dedicated Control Channel
CDR – Call Drop Rate
FER – Frame Error Rate
SIM – Subscriber Identity Module
GSM – Global System for Mobile
CDMA – Code Division Multiple Access
NA – Not Applicable
NC – Non Compliance
POI – Point of Interconnection
IVR – Interactive Voice Response
STD – Standard Trunk Dialling
ISD – International Subscriber Dialling

January to March 2016 – UP East Circle 91
13 ANNEXURE
13.1. 2G VOICE PMR DATA: CONSOLIDATED
Benchmark AIRCEL AIRTEL BSNL IDEA RCOM CDMA RCOM GSM TELENOR TTSL CDMA TTSL GSM VODAFONE
Sum of downtime of BTSs in a
month in hrs. in the licensed
service area
≤ 2% 0.24% 0.61% 1.95% 0.33% 0.02% 0.02% 0.37% 0.20% 0.30% 0.12%
No. of BTSs having accumulated
downtime of >24 hours in a month≤ 2% 1.07% 1.88% 1.79% 0.71% 0.12% 0.18% 0.80% 0.53% 0.92% 0.11%
Call Set-up Success Rate (Within
Licensee own network≥ 95% 98.96% 96.20% 98.66% 99.18% 97.96% 95.42% 95.18% 97.94% 94.88% 98.40%
SDDCH/Paging chl. Congestion ≤ 1% 0.66% 0.66% 0.64% 0.64% NA 27.50% 1.43% 0.00% 0.92% 0.39%
TCH Congestion ≤ 2% 0.78% 0.66% 1.69% 0.75% 0.57% 1.26% 3.75% 0.31% 1.97% 1.60%
Call Drop Rate (%age) ≤ 2% 0.55% 0.84% 1.22% 0.97% 0.26% 0.12% 1.42% 0.14% 0.54% 0.65%
Worst Affected cell having more
than 3% TCH drop≤ 3% 2.66% 2.83% 2.65% 2.58% 1.31% 0.37% 8.38% 1.99% 3.25% 2.58%
%age of connection with good
voice quality≥ 95% 97.32% 96.65% 96.50% 97.22% 99.58% 98.99% 94.72% 99.97% 96.61% 95.97%
Network Availability
Connection
Establishment
(Accessibility)
Connection
Maintenance
(Retainability)
Consolidated
Network ParametersName of Service Provider

January to March 2016 – UP East Circle 92
13.2. 3G VOICE PMR: CONSOLIDATED
Benchmark AIRCEL AIRTEL BSNL IDEA VODAFONE
Sum of downtime of BTSs in a month in hrs. in
the licensed service area≤ 2% 0.32% 0.49% 1.32% 0.36% 0.37%
No. of BTSs having accumulated downtime of >24
hours in a month≤ 2% 1.25% 1.87% 1.82% 1.46% 0.82%
Call Set-up Success Rate (Within Licensee own
network≥ 95% 97.81% 99.83% 97.04% 99.64% 99.81%
RRC Congestion: ≤ 1% 0.14% 0.25% 0.92% 0.58% 0.20%
RAB Congestion: ≤ 2% 0.01% 0.17% 0.97% 0.14% 0.03%
Circuit Switched Voice Drop Rate ≤ 2% 0.50% 0.43% 1.25% 0.52% 0.26%
Worst affected cells having more than 3% Circuit
Switched Voice Drop Rate:≤ 3% 5.03% 2.07% 2.83% 2.07% 2.20%
Percentage of connections with Good Circuit
Switched Voice Quality≥ 95% 99.74% 98.42% 96.50% 98.68% 99.00%
Connectio
n
Maintenan
ce
(Retainabil
ity)
Consolidated
Network ParametersName of Service Provider
Network
Availability
Connectio
n
Establish
ment
(Accessibi

January to March 2016 – UP East Circle 93
13.3. BILLING AND CUSTOMER CARE
Termination & Closures
Time taken for refund of
deposits after closures:
Benchmark
Postpaid
Subscribers
Prepaid
Subscribers
%age complaints
resolved within
4 weeks
%age
complaints
resolved
within 6 weeks
%age of where
credit/waiver is
received within one
week
% of Termination/
Closure of service
within 7 days (100 %)
Cleared over a period of <60 days
(100%)
%age of calls
answered by
the IVR
%age of call
answered by the
operators ( voice to
voice) within 90
seconds
Benchmark ≤ 0.1% ≤ 0.1% ≥ 98% = 100% = 100% = 100% = 100% ≥ 95% ≥ 95%AIRCEL 0.00% 0.00% NA NA 100.00% 100.00% 100.00% 98.28% 95.57%AIRTEL 0.01% 0.00% 100.00% 100.00% 100.00% 100.00% 100.00% 100.00% 77.03%BSNL DNA DNA DNA DNA DNA DNA DNA DNA DNAIDEA 0.04% 0.04% 100.00% 100.00% 100.00% 100.00% 100.00% 95.70% 99.74%
RCOM CDMA 0.09% 0.04% 100.00% 100.00% 100.00% 100.00% 85.93% 99.13% 88.15%RCOM GSM 0.08% 0.09% 100.00% 100.00% 100.00% 100.00% 76.26% 99.57% 93.74%TELENOR NA 0.02% NA NA 100.00% NA NA 99.04% 98.63%
TTSL CDMA 0.00% 0.00% NA NA 100.00% 100.00% 100.00% NA 99.77%TTSL GSM 0.00% 0.00% 100.00% 100.00% 100.00% 69.59% 100.00% 99.73% 97.56%VODAFONE 0.08% 0.01% 100.00% 100.00% 100.00% 100.00% 100.00% 100.00% 98.85%
Name of Service Provider
Metering and Billing
credibilityBilling Complaints
Response time to customer for
assistance

January to March 2016 – UP East Circle 94
13.4. PMR COMPARISON (TSP VS. AUDIT AGENCY): NETWORK PARAMETERS

January to March 2016 – UP East Circle 95
13.4.1. SUM OF DOWNTIME OF BTSS IN A MONTH IN HRS. IN THE LICENSED SERVICE AREA
AIRCEL AIRTEL BSNL IDEARCOMCDMA
RCOMGSM
TELENOR
TTSLCDMA
TTSLGSM
VODAFONE
PMR Audit 2G Audit Agency(PCPL) 0.24% 0.61% 1.95% 0.33% 0.02% 0.02% 0.37% 0.20% 0.30% 0.12%
PMR Audit 2G TSP 0.24% 0.62% 1.86% 0.33% 0.02% 0.02% 0.40% 0.20% 0.18% 0.12%
3 Day Live Audit 2G 0.20% 0.45% 1.82% 0.36% 0.04% 0.02% 0.29% 0.08% 0.27% 0.10%
Benchmark ≤ 2% 2.00% 2.00% 2.00% 2.00% 2.00% 2.00% 2.00% 2.00% 2.00% 2.00%
0.2
4%
0.6
1%
1.9
5%
0.3
3%
0.0
2%
0.0
2%
0.3
7% 0.2
0%
0.3
0% 0.1
2%
0.2
4%
0.6
2%
1.8
6%
0.3
3%
0.0
2%
0.0
2%
0.4
0% 0.2
0%
0.1
8%
0.1
2%
0.2
0%
0.4
5%
1.8
2%
0.3
6%
0.0
4%
0.0
2%
0.2
9% 0.0
8%
0.2
7% 0.1
0%
0.00%
0.50%
1.00%
1.50%
2.00%
2.50%
Sum of downtime of BTSs in a month in hrs. in the licensed service area

January to March 2016 – UP East Circle 96
13.4.2. NO. OF BTSS HAVING ACCUMULATED DOWNTIME OF >24 HOURS IN A MONTH
AIRCEL AIRTEL BSNL IDEARCOMCDMA
RCOMGSM
TELENOR TTSL CDMA TTSL GSM VODAFONE
PMR Audit 2G Audit Agency(PCPL) 1.07% 1.88% 1.79% 0.71% 0.12% 0.18% 0.80% 0.53% 0.92% 0.11%
PMR Audit 2G TSP 1.07% 1.87% 1.84% 0.71% 0.09% 0.18% 0.80% 0.32% 0.89% 0.11%
3 Day Live Audit 2G 0.04% 0.00% 0.14% 0.02% 0.00% 0.00% 0.14% 0.00% 0.00% 0.00%
Benchmark ≤ 2% 2.00% 2.00% 2.00% 2.00% 2.00% 2.00% 2.00% 2.00% 2.00% 2.00%
1.0
7%
1.8
8%
1.7
9%
0.7
1%
0.1
2%
0.1
8%
0.8
0%
0.5
3%
0.9
2%
0.1
1%
1.0
7%
1.8
7%
1.8
4%
0.7
1%
0.0
9%
0.1
8%
0.8
0%
0.3
2%
0.8
9%
0.1
1%
0.0
4%
0.0
0%
0.1
4%
0.0
2%
0.0
0%
0.0
0%
0.1
4%
0.0
0%
0.0
0%
0.0
0%
0.00%
0.50%
1.00%
1.50%
2.00%
2.50%
No. of BTSs having accumulated downtime of >24 hours in a month

January to March 2016 – UP East Circle 97
13.4.3. CALL SET-UP SUCCESS RATE (WITHIN LICENSEE OWN NETWORK)
AIRCEL AIRTEL BSNL IDEARCOMCDMA
RCOMGSM
TELENOR TTSL CDMA TTSL GSM VODAFONE
PMR Audit 2G Audit Agency(PCPL) 98.96% 96.20% 98.66% 99.18% 97.96% 95.42% 95.18% 97.94% 94.88% 98.40%
PMR Audit 2G TSP 98.96% 96.15% 98.58% 99.18% 97.97% 95.42% 95.18% 97.94% 95.57% 98.40%
3 Day Live Audit 2G 99.02% 96.43% 97.66% 98.97% 97.44% 96.96% 94.87% 98.40% 95.78% 98.51%
Benchmark ≤ 2% 95.00% 95.00% 95.00% 95.00% 95.00% 95.00% 95.00% 95.00% 95.00% 95.00%
98
.96
%
96
.20
%
98
.66
%
99
.18
%
97
.96
%
95
.42
%
95
.18
%
97
.94
%
94
.88
%
98
.40
%
98
.96
%
96
.15
%
98
.58
%
99
.18
%
97
.97
%
95
.42
%
95
.18
%
97
.94
%
95
.57
%
98
.40
%
99
.02
%
96
.43
%
97
.66
%
98
.97
%
97
.44
%
96
.96
%
94
.87
%
98
.40
%
95
.78
%
98
.51
%
92.00%
93.00%
94.00%
95.00%
96.00%
97.00%
98.00%
99.00%
100.00%
Call Set-up Success Rate (Within Licensee own network

January to March 2016 – UP East Circle 98
13.4.4. SDDCH/PAGING CHL. CONGESTION
AIRCEL AIRTEL BSNL IDEARCOMCDMA
RCOMGSM
TELENOR
TTSLCDMA
TTSLGSM
VODAFONE
PMR Audit 2G Audit Agency(PCPL) 0.66% 0.66% 0.64% 0.64% 0.00% 0.56% 1.43% 0.00% 0.92% 0.39%
PMR Audit 2G TSP 0.66% 0.73% 0.63% 0.64% 0.00% 0.56% 1.43% 0.00% 0.92% 0.39%
3 Day Live Audit 2G 0.62% 0.64% 0.79% 0.60% 0.00% 0.44% 1.46% 0.00% 0.52% 0.33%
Benchmark ≤ 2% 1.00% 1.00% 1.00% 1.00% 1.00% 1.00% 1.00% 1.00% 1.00% 1.00%
0.6
6%
0.6
6%
0.6
4%
0.6
4%
0.0
0%
0.5
6%
1.4
3%
0.0
0%
0.9
2%
0.3
9%
0.6
6%
0.7
3%
0.6
3%
0.6
4%
0.0
0%
0.5
6%
1.4
3%
0.0
0%
0.9
2%
0.3
9%
0.6
2%
0.6
4%
0.7
9% 0
.60
%
0.0
0%
0.4
4%
1.4
6%
0.0
0%
0.5
2% 0
.33
%
0.00%
0.20%
0.40%
0.60%
0.80%
1.00%
1.20%
1.40%
1.60%
SDDCH/Paging chl. Congestion

January to March 2016 – UP East Circle 99
13.4.5. TCH CONGESTION
AIRCEL AIRTEL BSNL IDEARCOMCDMA
RCOMGSM
TELENOR TTSL CDMA TTSL GSM VODAFONE
PMR Audit 2G Audit Agency(PCPL) 0.78% 0.66% 1.69% 0.75% 0.57% 1.26% 3.75% 0.31% 1.97% 1.60%
PMR Audit 2G TSP 0.78% 0.67% 1.71% 0.75% 0.56% 1.26% 3.75% 0.31% 1.97% 1.60%
3 Day Live Audit 2G 0.75% 0.60% 2.34% 0.96% 0.95% 0.99% 4.06% 0.14% 1.65% 1.49%
Benchmark ≤ 2% 2.00% 2.00% 2.00% 2.00% 2.00% 2.00% 2.00% 2.00% 2.00% 2.00%
0.7
8%
0.6
6%
1.6
9%
0.7
5%
0.5
7%
1.2
6%
3.7
5%
0.3
1%
1.9
7% 1
.60
%
0.7
8%
0.6
7%
1.7
1%
0.7
5%
0.5
6%
1.2
6%
3.7
5%
0.3
1%
1.9
7% 1
.60
%
0.7
5%
0.6
0%
2.3
4%
0.9
6%
0.9
5%
0.9
9%
4.0
6%
0.1
4%
1.6
5%
1.4
9%
0.00%
0.50%
1.00%
1.50%
2.00%
2.50%
3.00%
3.50%
4.00%
4.50%
TCH Congestion

January to March 2016 – UP East Circle 100
13.4.6. CALL DROP RATE (%AGE)
AIRCEL AIRTEL BSNL IDEARCOMCDMA
RCOMGSM
TELENOR TTSL CDMA TTSL GSM VODAFONE
PMR Audit 2G Audit Agency(PCPL) 0.55% 0.84% 1.22% 0.97% 0.26% 0.12% 1.42% 0.14% 0.54% 0.65%
PMR Audit 2G TSP 0.55% 0.83% 1.38% 0.97% 0.26% 0.12% 1.42% 0.19% 0.42% 0.64%
3 Day Live Audit 2G 0.49% 0.82% 1.75% 0.98% 0.25% 0.11% 1.45% 0.10% 0.52% 0.70%
Benchmark ≤ 2% 2.00% 2.00% 2.00% 2.00% 2.00% 2.00% 2.00% 2.00% 2.00% 2.00%
0.5
5%
0.8
4%
1.2
2%
0.9
7%
0.2
6% 0.1
2%
1.4
2%
0.1
4%
0.5
4%
0.6
5%
0.5
5%
0.8
3%
1.3
8%
0.9
7%
0.2
6% 0.1
2%
1.4
2%
0.1
9%
0.4
2%
0.6
4%0.4
9%
0.8
2%
1.7
5%
0.9
8%
0.2
5% 0.1
1%
1.4
5%
0.1
0%
0.5
2%
0.7
0%
0.00%
0.50%
1.00%
1.50%
2.00%
2.50%
Call Drop Rate (%age)

January to March 2016 – UP East Circle 101
13.4.7. WORST AFFECTED CELL HAVING MORE THAN 3% TCH DROP
AIRCEL AIRTEL BSNL IDEARCOMCDMA
RCOM GSM TELENOR TTSL CDMA TTSL GSM VODAFONE
PMR Audit 2G Audit Agency(PCPL) 2.66% 2.83% 2.65% 2.58% 1.31% 0.37% 8.38% 1.99% 3.25% 2.58%
PMR Audit 2G TSP 2.66% 2.84% 2.40% 2.57% 1.28% 0.37% 8.24% 1.99% 3.25% 2.58%
3 Day Live Audit 2G 2.54% 2.86% 2.61% 2.64% 2.58% 0.57% 8.24% 1.84% 2.96% 2.70%
Benchmark ≤ 2% 3.00% 3.00% 3.00% 3.00% 3.00% 3.00% 3.00% 3.00% 3.00% 3.00%
2.6
6%
2.8
3%
2.6
5%
2.5
8%
1.3
1%
0.3
7%
8.3
8%
1.9
9%
3.2
5% 2
.58
%
2.6
6%
2.8
4%
2.4
0%
2.5
7%
1.2
8%
0.3
7%
8.2
4%
1.9
9%
3.2
5% 2.5
8%
2.5
4%
2.8
6%
2.6
1%
2.6
4%
2.5
8%
0.5
7%
8.2
4%
1.8
4%
2.9
6%
2.7
0%
0.00%
1.00%
2.00%
3.00%
4.00%
5.00%
6.00%
7.00%
8.00%
9.00%
Worst Affected cell having more than 3% TCH drop

January to March 2016 – UP East Circle 102
13.4.8. %AGE OF CONNECTION WITH GOOD VOICE QUALITY
AIRCEL AIRTEL BSNL IDEARCOMCDMA
RCOMGSM
TELENOR
TTSLCDMA
TTSLGSM
VODAFONE
PMR Audit 2G Audit Agency(PCPL) 97.32% 96.65% 96.50% 97.22% 99.58% 98.99% 94.72% 99.97% 96.61% 95.97%
PMR Audit 2G TSP 97.32% 96.50% 96.50% 97.22% 99.64% 98.99% 94.72% 99.83% 97.24% 95.97%
3 Day Live Audit 2G 97.28% 97.27% 96.66% 97.16% 99.46% 99.08% 94.63% 99.80% 96.71% 96.29%
Benchmark ≤ 2% 95.00% 95.00% 95.00% 95.00% 95.00% 95.00% 95.00% 95.00% 95.00% 95.00%
97
.32
% 96
.65
%
96
.50
%
97
.22
%
99
.58
%
98
.99
%
94
.72
%
99
.97
%
96
.61
%
95
.97
%
97
.32
% 96
.50
%
96
.50
%
97
.22
%
99
.64
%
98
.99
%
94
.72
%
99
.83
%
97
.24
%
95
.97
%
97
.28
%
97
.27
%
96
.66
%
97
.16
%
99
.46
%
99
.08
%
94
.63
%
99
.80
%
96
.71
%
96
.29
%
91.00%
92.00%
93.00%
94.00%
95.00%
96.00%
97.00%
98.00%
99.00%
100.00%
%Age of connection with good voice quality

January to March 2016 – UP East Circle 103
13.5. PMR COMPARISON (TSP VS. AUDIT AGENCY): 3G NETWORK PARAMETERS
Benchmark AIRCEL AIRTEL BSNL IDEA VODAFONE
Agency 0.32% 0.49% 1.32% 0.36% 0.37%
TSP 0.32% 0.50% 1.33% 0.33% 0.37%
Agency 1.25% 1.87% 1.82% 1.46% 0.82%
TSP 1.25% 1.86% 1.73% 1.55% 0.82%
Agency 97.81% 99.83% 97.04% 99.64% 99.81%
TSP 97.81% 99.82% 96.33% 99.63% 99.81%
Agency 0.14% 0.25% 0.92% 0.58% 0.20%
TSP 0.14% 0.30% 0.90% 0.60% 0.20%
Agency 0.01% 0.17% 0.97% 0.14% 0.03%
TSP 0.01% 0.18% 1.10% 0.17% 0.03%
Agency 0.50% 0.43% 1.25% 0.52% 0.26%
TSP 0.50% 0.44% 1.47% 0.52% 0.26%
Agency 5.03% 2.07% 2.83% 2.07% 2.20%
TSP 5.03% 2.11% 0.93% 2.25% 2.20%
Agency 99.74% 98.42% 96.50% 98.68% 99.00%
TSP 99.75% 98.35% 96.50% 98.72% 99.00%
Connection
Maintenance
(Retainability)
Circuit Switched Voice Drop Rate ≤ 2%
Worst affected cells having more
than 3% Circuit Switched Voice Drop
Rate:
≤ 3%
Percentage of connections with Good
Circuit Switched Voice Quality≥ 95%
Connection
Establishment
(Accessibility)
Call Set-up Success Rate (Within
Licensee own network≥ 95%
RRC Congestion: ≤ 1%
RAB Congestion: ≤ 2%
PMR Report Comparison between Audit Agency and TSP
Network ParametersName of Service Provider
Network
Availability
Sum of downtime of BTSs in a month
in hrs. in the licensed service area≤ 2%
No. of BTSs having accumulated
downtime of >24 hours in a month≤ 2%

January to March 2016 – UP East Circle 104
13.5.1. SUM OF DOWNTIME OF BTSS IN A MONTH IN HRS. IN THE LICENSED SERVICE AREA
Airtel Aircel Idea Vodafone BSNL
PMR Audit 3G Audit Agency(PCPL) 0.32% 0.49% 1.32% 0.36% 0.37%
PMR Audit 3G TSP 0.32% 0.50% 1.33% 0.33% 0.37%
3 Day Live Audit 3G 0.26% 0.42% 1.68% 0.40% 0.27%
Benchmark ≤ 2% 2.00% 2.00% 2.00% 2.00% 2.00%
0.3
2%
0.4
9%
1.3
2%
0.3
6%
0.3
7%
0.3
2%
0.5
0%
1.3
3%
0.3
3%
0.3
7%0.2
6%
0.4
2%
1.6
8%
0.4
0% 0.2
7%
0.00%
0.50%
1.00%
1.50%
2.00%
2.50%
Sum of downtime of BTSs in a month in hrs. in the licensed service area

January to March 2016 – UP East Circle 105
13.5.2. NO. OF BTSS HAVING ACCUMULATED DOWNTIME OF >24 HOURS IN A MONTH
Airtel Aircel Idea Vodafone BSNL
PMR Audit 3G Audit Agency(PCPL) 1.25% 1.87% 1.82% 1.46% 0.82%
PMR Audit 3G TSP 1.25% 1.86% 1.73% 1.55% 0.82%
3 Day Live Audit 3G 0.03% 0.00% 0.53% 0.05% 0.00%
Benchmark ≤ 2% 2.00% 2.00% 2.00% 2.00% 2.00%
1.2
5%
1.8
7%
1.8
2%
1.4
6%
0.8
2%
1.2
5%
1.8
6% 1.7
3% 1
.55
%
0.8
2%
0.0
3%
0.0
0%
0.5
3%
0.0
5%
0.0
0%
0.00%
0.50%
1.00%
1.50%
2.00%
2.50%
No. of BTSs having accumulated downtime of >24 hours in a month

January to March 2016 – UP East Circle 106
13.5.3. CALL SET-UP SUCCESS RATE (WITHIN LICENSEE OWN NETWORK)
Airtel Aircel Idea Vodafone BSNL
PMR Audit 3G Audit Agency(PCPL) 97.81% 99.83% 97.04% 99.64% 99.81%
PMR Audit 3G TSP 97.81% 99.82% 96.33% 99.63% 99.81%
3 Day Live Audit 3G 97.80% 99.83% 96.94% 99.71% 99.77%
Benchmark ≤ 2% 95.00% 95.00% 95.00% 95.00% 95.00%
97
.81
%
99
.83
%
97
.04
%
99
.64
%
99
.81
%
97
.81
%
99
.82
%
96
.33
%
99
.63
%
99
.81
%
97
.80
%
99
.83
%
96
.94
%
99
.71
%
99
.77
%
92.00%
93.00%
94.00%
95.00%
96.00%
97.00%
98.00%
99.00%
100.00%
Call Set-up Success Rate (Within Licensee own network)

January to March 2016 – UP East Circle 107
13.5.4. RRC CONGESTION
Airtel Aircel Idea Vodafone BSNL
PMR Audit 3G Audit Agency(PCPL) 0.14% 0.25% 0.92% 0.58% 0.20%
PMR Audit 3G TSP 0.14% 0.30% 0.90% 0.60% 0.20%
3 Day Live Audit 3G 0.27% 0.25% 0.88% 0.55% 0.34%
Benchmark ≤ 2% 1.00% 1.00% 1.00% 1.00% 1.00%
0.1
4%
0.2
5%
0.9
2%
0.5
8%
0.2
0%
0.1
4%
0.3
0%
0.9
0%
0.6
0%
0.2
0%
0.2
7%
0.2
5%
0.8
8%
0.5
5%
0.3
4%
0.00%
0.20%
0.40%
0.60%
0.80%
1.00%
1.20%
RRC Congestion

January to March 2016 – UP East Circle 108
13.5.5. RAB CONGESTION
Airtel Aircel Idea Vodafone BSNL
PMR Audit 3G Audit Agency(PCPL) 0.01% 0.17% 0.97% 0.14% 0.03%
PMR Audit 3G TSP 0.01% 0.18% 1.10% 0.17% 0.03%
3 Day Live Audit 3G 0.00% 0.17% 0.89% 0.11% 0.08%
Benchmark ≤ 2% 2.00% 2.00% 2.00% 2.00% 2.00%
0.0
1%
0.1
7%
0.9
7%
0.1
4%
0.0
3%
0.0
1%
0.1
8%
1.1
0%
0.1
7%
0.0
3%
0.0
0%
0.1
7%
0.8
9%
0.1
1%
0.0
8%
0.00%
0.50%
1.00%
1.50%
2.00%
2.50%
RAB Congestion

January to March 2016 – UP East Circle 109
13.5.6. CIRCUIT SWITCHED VOICE DROP RATE
Airtel Aircel Idea Vodafone BSNL
PMR Audit 3G Audit Agency(PCPL) 0.50% 0.43% 1.25% 0.52% 0.26%
PMR Audit 3G TSP 0.50% 0.44% 1.47% 0.52% 0.26%
3 Day Live Audit 3G 0.48% 0.47% 1.12% 0.49% 0.26%
Benchmark ≤ 2% 2.00% 2.00% 2.00% 2.00% 2.00%
0.5
0%
0.4
3%
1.2
5%
0.5
2%
0.2
6%
0.5
0%
0.4
4%
1.4
7%
0.5
2%
0.2
6%
0.4
8%
0.4
7%
1.1
2%
0.4
9%
0.2
6%
0.00%
0.50%
1.00%
1.50%
2.00%
2.50%
Circuit Switched Voice Drop Rate

January to March 2016 – UP East Circle 110
13.5.7. WORST AFFECTED CELLS HAVING MORE THAN 3% CIRCUIT SWITCHED VOICE DROP RATE
Airtel Aircel Idea Vodafone BSNL
PMR Audit 3G Audit Agency(PCPL) 5.03% 2.07% 2.83% 2.07% 2.20%
PMR Audit 3G TSP 5.03% 2.11% 0.93% 2.25% 2.20%
3 Day Live Audit 3G 5.42% 2.01% 2.79% 2.33% 2.16%
Benchmark ≤ 2% 3.00% 3.00% 3.00% 3.00% 3.00%
5.0
3%
2.0
7%
2.8
3% 2
.07
%
2.2
0%
5.0
3%
2.1
1%
0.9
3%
2.2
5%
2.2
0%
5.4
2%
2.0
1%
2.7
9%
2.3
3%
2.1
6%
0.00%
1.00%
2.00%
3.00%
4.00%
5.00%
6.00%
Worst affected cells having more than 3% Circuit Switched Voice Drop Rate

January to March 2016 – UP East Circle 111
13.5.8. PERCENTAGE OF CONNECTIONS WITH GOOD CIRCUIT SWITCHED VOICE QUALITY
Airtel Aircel Idea Vodafone BSNL
PMR Audit 3G AuditAgency(PCPL)
99.74% 98.42% 96.50% 98.68% 99.00%
PMR Audit 3G TSP 99.75% 98.35% 96.50% 98.72% 99.00%
3 Day Live Audit 3G 99.75% 98.54% 0.00% 98.76% 98.99%
Benchmark ≤ 2% 95.00% 95.00% 95.00% 95.00% 95.00%
99
.74
%
98
.42
%
96
.50
%
98
.68
%
99
.00
%
99
.75
%
98
.35
%
96
.50
%
98
.72
%
99
.00
%
99
.75
%
98
.54
%
0.0
0%
98
.76
%
98
.99
%
0.00%
10.00%
20.00%
30.00%
40.00%
50.00%
60.00%
70.00%
80.00%
90.00%
100.00%
Percentage of connections with Good Circuit Switched Voice Quality

January to March 2016 – UP East Circle 112
13.6. PMR COMPARISON (TSP VS. AUDIT AGENCY): CSD PARAMETERS

January to March 2016 – UP East Circle 113
13.6.1. POSTPAID SUBSCRIBERS
AIRCEL AIRTEL BSNL IDEA RCOM CDMA RCOM GSM TELENOR TTSL CDMA TTSL GSM VODAFONE
Agency(PCPL) 0.00% 0.01% 0.00% 0.04% 0.09% 0.08% 0.00% 0.00% 0.00% 0.08%
TSP 0.00% 0.00% 0.09% 0.04% 0.09% 0.08% 0.00% 0.00% 0.00% 0.08%
Benchmark ≤ 0.1% 0.10% 0.10% 0.10% 0.10% 0.10% 0.10% 0.10% 0.10% 0.10% 0.10%
0.0
0%
0.0
1% 0
.00
%
0.0
4%
0.0
9% 0
.08
%
0.0
0%
0.0
0%
0.0
0%
0.0
8%
0.0
0%
0.0
0%
0.0
9%
0.0
4%
0.0
9% 0
.08
%
0.0
0%
0.0
0%
0.0
0%
0.0
8%
0.00%
0.02%
0.04%
0.06%
0.08%
0.10%
0.12%
Metering and Billing Credibility : Postpaid

January to March 2016 – UP East Circle 114
13.6.2. PREPAID SUBSCRIBERS
AIRCEL AIRTEL BSNL IDEA RCOM CDMA RCOM GSM TELENOR TTSL CDMA TTSL GSM VODAFONE
Agency(PCPL) 0.00% 0.00% 0.00% 0.04% 0.04% 0.09% 0.02% 0.00% 0.00% 0.01%
TSP 0.00% 0.00% 0.09% 0.04% 0.04% 0.09% 0.02% 0.00% 0.00% 0.01%
Benchmark ≤ 0.1% 0.10% 0.10% 0.10% 0.10% 0.10% 0.10% 0.10% 0.10% 0.10% 0.10%
0.0
0%
0.0
0%
0.0
0%
0.0
4%
0.0
4%
0.0
9%
0.0
2%
0.0
0%
0.0
0%
0.0
1%0
.00
%
0.0
0%
0.0
9%
0.0
4%
0.0
4%
0.0
9%
0.0
2%
0.0
0%
0.0
0%
0.0
1%
0.00%
0.02%
0.04%
0.06%
0.08%
0.10%
0.12%
Metering and Billing Credibility : Prepaid

January to March 2016 – UP East Circle 115
13.6.3. %AGE COMPLAINTS RESOLVED WITHIN 4 WEEKS
AIRCEL AIRTEL BSNL IDEARCOMCDMA
RCOMGSM
TELENORTTSL
CDMATTSLGSM
VODAFONE
Agency(PCPL) 0% 100% 0% 100% 100% 100% 0% 0% 100% 100%
TSP 100% 100% 100% 100% 100% 100% 100% 100% 100% 100%
Benchmark ≥ 98% 98% 98% 98% 98% 98% 98% 98% 98% 98% 98%
0%
10
0%
0%
10
0%
10
0%
10
0%
0%
0%
10
0%
10
0%
10
0%
10
0%
10
0%
10
0%
10
0%
10
0%
10
0%
10
0%
10
0%
10
0%
0%10%20%30%40%50%60%70%80%90%
100%
%Age complaints resolved within 4 weeks

January to March 2016 – UP East Circle 116
13.6.4. %AGE COMPLAINTS RESOLVED WITHIN 6 WEEKS
AIRCEL AIRTEL BSNL IDEARCOMCDMA
RCOMGSM
TELENORTTSL
CDMATTSL GSM
VODAFONE
Agency(PCPL) 0% 100% 0% 100% 100% 100% 0% 0% 100% 100%
TSP 100% 100% 100% 100% 100% 100% 100% 100% 100% 100%
Benchmark = 100% 100% 100% 100% 100% 100% 100% 100% 100% 100% 100%
0%
10
0%
0%
10
0%
10
0%
10
0%
0%
0%
10
0%
10
0%
10
0%
10
0%
10
0%
10
0%
10
0%
10
0%
10
0%
10
0%
10
0%
10
0%
0%
10%
20%
30%
40%
50%
60%
70%
80%
90%
100%
%Age complaints resolved within 6 weeks

January to March 2016 – UP East Circle 117
13.6.5. %AGE OF WHERE CREDIT/WAIVER IS RECEIVED WITHIN ONE WEEK
AIRCEL AIRTEL BSNL IDEA RCOM CDMA RCOM GSM TELENOR TTSL CDMA TTSL GSM VODAFONE
Agency(PCPL) 100% 100% 0% 100% 100% 100% 100% 100% 100% 100%
TSP 100% 100% 100% 100% 100% 100% 0% 100% 100% 100%
Benchmark = 100% 100% 100% 100% 100% 100% 100% 100% 100% 100% 100%
10
0%
10
0%
10
0%
10
0%
10
0%
10
0%
10
0%
10
0%
10
0%
10
0%
10
0%
10
0%
10
0%
10
0%
10
0%
10
0%
10
0%
10
0%
90%
91%
92%
93%
94%
95%
96%
97%
98%
99%
100%
%Age of where credit/waiver is received within one week
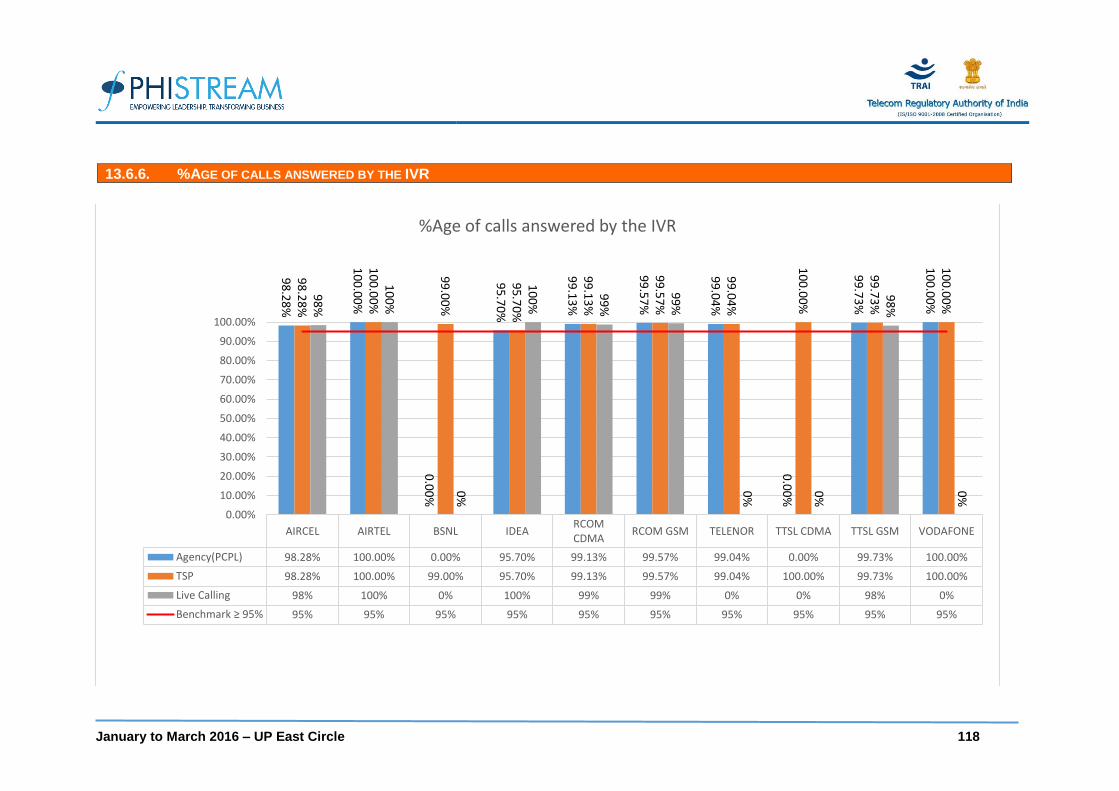
January to March 2016 – UP East Circle 118
13.6.6. %AGE OF CALLS ANSWERED BY THE IVR
AIRCEL AIRTEL BSNL IDEARCOMCDMA
RCOM GSM TELENOR TTSL CDMA TTSL GSM VODAFONE
Agency(PCPL) 98.28% 100.00% 0.00% 95.70% 99.13% 99.57% 99.04% 0.00% 99.73% 100.00%
TSP 98.28% 100.00% 99.00% 95.70% 99.13% 99.57% 99.04% 100.00% 99.73% 100.00%
Live Calling 98% 100% 0% 100% 99% 99% 0% 0% 98% 0%
Benchmark ≥ 95% 95% 95% 95% 95% 95% 95% 95% 95% 95% 95%
98
.28
%
10
0.0
0%
0.0
0%
95
.70
%
99
.13
%
99
.57
%
99
.04
%
0.0
0%
99
.73
%
10
0.0
0%
98
.28
%
10
0.0
0%
99
.00
%
95
.70
%
99
.13
%
99
.57
%
99
.04
%
10
0.0
0%
99
.73
%
10
0.0
0%
98
%
10
0%
0%
10
0%
99
%
99
%
0%
0%
98
%
0%
0.00%
10.00%
20.00%
30.00%
40.00%
50.00%
60.00%
70.00%
80.00%
90.00%
100.00%
%Age of calls answered by the IVR

January to March 2016 – UP East Circle 119
13.6.7. %AGE OF CALL ANSWERED BY THE OPERATORS ( VOICE TO VOICE) WITHIN 90 SECONDS
AIRCEL AIRTEL BSNL IDEARCOMCDMA
RCOM GSM TELENOR TTSL CDMA TTSL GSM VODAFONE
Agency(PCPL) 95.57% 77.03% 0.00% 99.74% 88.15% 93.74% 98.63% 99.77% 97.56% 98.85%
TSP 95.57% 76.93% 97.14% 99.74% 88.15% 93.74% 98.63% 99.77% 97.56% 98.86%
Live Calling 98.24% 98.42% 0.00% 99.98% 96.04% 98.68% 0.00% 99.49% 98.89% 0.00%
Benchmark ≥ 95% 95% 95% 95% 95% 95% 95% 95% 95% 95% 95%
95
.57
%
77
.03
%
0.0
0%
99
.74
% 88
.15
%
93
.74
%
98
.63
%
99
.77
%
97
.56
%
98
.85
%
95
.57
%
76
.93
%
97
.14
%
99
.74
% 88
.15
%
93
.74
%
98
.63
%
99
.77
%
97
.56
%
98
.86
%
98
.24
%
98
.42
%
0.0
0%
99
.98
%
96
.04
%
98
.68
%
0.0
0%
99
.49
%
98
.89
%
0.0
0%
0.00%
10.00%
20.00%
30.00%
40.00%
50.00%
60.00%
70.00%
80.00%
90.00%
100.00%
%Age of call answered by the operators ( voice to voice) within 90 seconds

January to March 2016 – UP East Circle 120
13.6.8. % OF TERMINATION/ CLOSURE OF SERVICE WITHIN 7 DAYS (100 %)
AIRCEL AIRTEL BSNL IDEARCOMCDMA
RCOMGSM
TELENORTTSL
CDMATTSL GSM
VODAFONE
Agency(PCPL) 100% 100% 0% 100% 100% 100% 0% 100% 70% 100%
TSP 100% 100% 100% 100% 100% 100% 0% 100% 100% 100%
Benchmark = 100% 100% 100% 100% 100% 100% 100% 100% 100% 100% 100%
10
0%
10
0%
10
0%
10
0%
10
0%
10
0%
10
0%
10
0%
10
0%
10
0%
10
0%
10
0%
10
0%
10
0%
10
0%
10
0%
80%
82%
84%
86%
88%
90%
92%
94%
96%
98%
100%
%Age of Termination/ Closure of service within 7 days

January to March 2016 – UP East Circle 121
13.6.9. CLEARED OVER A PERIOD OF <60 DAYS (100%)
AIRCEL AIRTEL BSNL IDEA RCOM CDMA RCOM GSM TELENOR TTSL CDMA TTSL GSM VODAFONE
Agency(PCPL) 100% 100% 0% 100% 86% 76% 0% 100% 100% 100%
TSP 100% 100% 100% 100% 86% 76% 0% 100% 100% 100%
Benchmark = 100% 100% 100% 100% 100% 100% 100% 100% 100% 100% 100%
10
0%
10
0%
0%
10
0%
86
%
76
%
0%
10
0%
10
0%
10
0%
10
0%
10
0%
10
0%
10
0%
86
%
76
%
0%
10
0%
10
0%
10
0%
0%
20%
40%
60%
80%
100%
120%
Cleared over a period of <60 days

January to March 2016 – UP East Circle 122
14 KEY FINDINGS
NETWORK FINDINGS (2G): TTSL GSM has parameter value of 94.88% and has failed to meet the benchmark of ≥ 95% Call set-up Success rate (within Licensee
own network)
Telenor has parameter value of 3.75% and has failed to meet the benchmark of ≤ 2% for TCH Congestion
Telenor has parameter value of 8.38% and has failed to meet the benchmark of ≤ 3% for Worst affected cell having more than 3% TCH drop
TTSL GSM has parameter value of 3.25% and has failed to meet the benchmark of ≤ 3% for Worst affected cell having more than 3% TCH drop
Telenor has parameter value of 94.72% and has failed to meet the benchmark of ≥ 95% for percentage of connection with good voice quality.
NETWORK FINDINGS (3G): AIRCEL has parameter value of 5.03% and has failed to meet the benchmark of ≤ 3% for Worst affected cell having more than 3% TCH
drop
CUSTOMER SERVICE DELIVERY: TTSL GSM has parameter value of 69.59% and has failed to meet the benchmark of = 100% for Percentage of termination/closure of
service within 7 days
RCOM CDMA has parameter value of 85.93% and has failed to meet the benchmark of = 100% for refund of deposits after closure cleared over a period of < 60 days
RCOM GSM has parameter value of 76.26% and has failed to meet the benchmark of = 100% for refund of deposits after closure cleared over a period of < 60 days
AIRTEL has parameter value of 77.03% and has failed to meet the benchmark of ≥ 95% for Percentage of call answered by the operators ( voice to voice) within 90 seconds
RCOM CDMA has parameter value of 88.15% and has failed to meet the benchmark of ≥ 95% for Percentage of call answered by the operators ( voice to voice) within 90 seconds
RCOM GSM has parameter value of 93.74% and has failed to meet the benchmark of ≥ 95% for Percentage of call answered by the operators ( voice to voice) within 90 seconds

AUDIT & ASSESSMENT OF
QUALITY OF SERVICE
NORTH ZONE – UP-EAST CIRCLE
WIRELINE & BROADBAND SERVICES (APRIL TO JUNE 2016)
PREPARED BY:
PHISTREAM CONSULTING PRIVATE LIMITED (An ISO – 9001:2008 Certified Company)
Office: C – 56A/5, First Floor, Sector – 62, Noida ● Telephone: +91-120-644-7778 ● Email: [email protected]

April to June 2016 – UP East Circle 2
TABLE OF CONTENTS
1. INTRODUCTION ............................................................................................................................................... 3
1.1. ABOUT TRAI ......................................................................................................................................... 3
1.2. ABOUT PHISTREAM CONSULTING PRIVATE LIMITED .................................................................................. 3
1.3. OBJECTIVES .......................................................................................................................................... 3
1.4. COVERAGE ............................................................................................................................................ 4
1.5. FRAMEWORK USED ................................................................................................................................ 5
2. BASIC TELEPHONE SERVICE (WIRELINE) AND BROADBAND SERVICES ............................................................... 6 2.1. WIRELINE SERVICE PARAMETER ............................................................................................................. 6
2.2. BROADBAND SERVICE PARAMETER ......................................................................................................... 7
3. EXECUTIVE SUMMARY : BASIC (WIRELINE) ...................................................................................................... 9 3.1. BASIC (WIRELINE) .................................................................................................................................. 9
3.2. SERVICE PROVIDER PERFORMANCE REPORT BASED ON QUARTERLY MEASUREMENT
DATA VERIFICATION FOR BASIC TELEPHONE SERVICE (WIRELINE) PROVIDERS ............................. 10
3.3. SERVICE PROVIDER PERFORMANCE REPORT BASED ON 3 DAYS LIVE MEASUREMENT
DATA VERIFICATION FOR BASIC TELEPHONE SERVICE (WIRELINE) PROVIDERS ............................. 11
3.4. KEY FINDINGS: BASIC TELEPHONE SERVICES (WIRELINE) ...................................................... 11
3.5. INTER OPERATOR CALL ASSESSMENT (WIRELINE) ................................................................... 12
3.6. 9.5 LEVEL-1 LIVE CALLING (WIRELINE) ......................................................................................... 12
3.7. CUSTOMER CARE / HELPLINE ASSESSMENT (WIRELINE SERVICES) ...................................... 13
3.8. GRAPHICAL REPRESENTATION .................................................................................................... 14
4. EXECUTIVE SUMMARY : BROADBAND............................................................................................................. 19 4.1. QUALITY OF SERVICE AUDIT OF BROADBAND SERVICE PROVIDERS ....................................................... 19
4.2. QUARTERLY MEASURMENT DATA FOR BROADBAND SERVICE PROVIDERS ......................... 20
4.3. SERVICE PROVIDER PERFORMANCE REPORT BASED ON 3 DAYS MEASUREMENT DATA
VERIFICATION FOR BROADBAND SERVICE PROVIDERS ...................................................................... 23
4.4. KEY FINDINGS: BROADBAND SERVICES ...................................................................................... 27
4.5. CUSTOMER CARE / HELPLINE ASSESSMENT .............................................................................. 27
4.6. LIVE CALLING FOR BILLING COMPLIANTS ................................................................................... 28
4.7. GRAPHICAL REPRESENTATION .................................................................................................... 28
5. ABBREVIATIONS ........................................................................................................................................... 36

April to June 2016 – UP East Circle 3
1. INTRODUCTION
1.1. ABOUT TRAI
TRAI's mission is to create and nurture conditions for growth of telecommunications in the country in a
manner and at a pace that will enable India to play a leading role in the emerging global information
society. One of the main objectives of TRAI is to provide a fair and transparent policy environment which
promotes a level playing field and facilitates fair competition.
In pursuance of above objective, TRAI has been issuing regulations, order and directives to deal with the
issues or complaints raised by the operators as well as the consumers. These regulations, order and
directives have helped to nurture the growth of multi operator multi service - an open competitive Junket
from a government owned monopoly. Also, the directions, orders and regulations issued cover a wide
range of subjects including tariff, interconnection and quality of service as well as governance of the
Authority.
TRAI initiated a regulation - The Standard of Quality of Service of Basic Telephone Service (Wireline)
and Cellular Mobile Telephone Service regulations, 2009 (7 of 2009) dated June 20, 2009 and Quality of
Service of Broadband Service Regulations, 2006 (11 of 2006) dated April 6, 2006 that provide the
benchmarks for the parameters on customer perception of service to be achieved by service provider.
In order to assess the above regulations, TRAI has commissioned a third party agency to conduct the
audit of the service providers and check the performance of the operators on the various benchmarks set
by Telecom Regulatory Authority of India (TRAI).
1.2. ABOUT PHISTREAM CONSULTING PRIVATE LIMITED
Phistream Consulting Private Limited is an ISO: 9001 certified company who are one of the pioneers in
the field of technical audit, quality assurance and third party inspection services. Established more than a
decade ago in 2004, we aspire to provide longer term savings based on year-on-year productivity. With
our size, we are nimble and aspire to being a full service partner for providing consultancy services.
We have been helping our clients by determining the best solutions and enabling businesses to enjoy the
benefits of top-notch support without distracting their team from the main business focus. Our business
analysts have enough experience to get involved at the requirements gather stage through consulting
work handing off a detailed requirements document to our operations staff who in turn can train our
support and maintenance resources for ongoing engagement.
In keeping with our goal of being a one stop quality assurance and consulting partner, our specialists
employ a strategy and consulting-based implementation methodology and capitalize on strong program
governance to offer a wide range of services for various industry verticals.
1.3. OBJECTIVES
The primary objective of the Audit module is to:
Audit and Assess the Quality of Services being rendered by Basic (Wireline), Cellular Mobile
(Wireless), and Broadband service against the parameters notified by TRAI. (The parameters of
Quality of Services (QoS) have been specified by in the respective regulations published by TRAI).
This report covers the audit results of the audit conducted for Cellular Mobile (Wireless) services in
UP East circle.

April to June 2016 – UP East Circle 4
1.4. COVERAGE
The audit was conducted in UP East Circle covering all SSAs (Secondary Switching Areas).
Image Source: Map of India

April to June 2016 – UP East Circle 5
1.5. FRAMEWORK USED
Audit Activities
PMR Reports
Monthly PMR
3 Days Live Data
Customer Service
Drive Test
Operator Assisted
Independent
Level 1 Service
CSD Audit
Billing Complain
Service request
Customer Service
Wireline & Broadband
Billing Complain
Service Request
Level 1 Service
Customer Service
Inter Operator Call Assessment

April to June 2016 – UP East Circle 6
2. BASIC TELEPHONE SERVICE (WIRELINE) AND BROADBAND SERVICES
2.1. WIRELINE SERVICE PARAMETER
S. No. Name of Parameter Benchmark
1 Fault incidences (Fault incidences subscribers / month)
≤ 7
2 Fault repair by next working day
For urban areas: By next working day: ≥85% and within 5 days: 100%. For rural and hilly areas: By next working day: ≥75% and within 7days: 100%. Rent Rebate: Faults pending for >3 days and ≤7 days: Rent rebate for 7 days. Faults pending for >7 days and ≤15 days: Rent rebate for 15 days. Faults pending for> 15 days: rent rebate for one month.
3 Mean Time To Repair (MTTR) ≤ 10 Hrs
4 Point of Interconnection (POI) Congestion (on individual POI)
≤ 0.5%
5 Metering and billing credibility – post paid Not more than 0.1% of bills issued should be disputed over a billing cycle
6 Metering and billing credibility –- pre-paid Not more than 1 complaint per 1000 customers, i.e. 0.1% complaints for metering, charging, credit, and validity
7 Resolution of billing / charging complaints ≥ 98% within 4 weeks 100% within 6 weeks
8 Period of applying credit/ waiver/ adjustment to customer’s account from the date of resolution of complaints
Within one week of resolution of complaint
9
Response Time to the customer for assistance
(a) Accessibility of call centre/ customer care ≥ 95%
(b)Percentage of calls answered by the operators (voice to voice) within 60 seconds
≥ 95%
10 Termination/ closure of service ≤ 7
11 Time taken for refund of deposits after closures 100% within 60 days.

April to June 2016 – UP East Circle 7
2.2. BROADBAND SERVICE PARAMETER
S. No. Name of Parameter Benchmark
1 Service provisioning\ Activation
100% cases in ≤ 15 working days (subject to technical feasibility). In all cases where payment towards installation charge & security deposit is taken and the Broadband connection is not provided within 15 working days, a credit at the rate ofRs.10/ per day, subject to a maximum of installation charge or equivalent usage allowance shall be given to the customer, at the time of issue of first bill.
2 Fault Repair\Restoration Time
By next working day: > 90% and within 3 working days: 99% Rebate: (a) Faults Pending for > 3 working days and < 7 working days: rebate equivalent to 7 days of minimum monthly charge or equivalent usage allowance (b) Faults Pending for > 7 working days and < 15 working days: rebate equivalent to 15 days of minimum monthly charge or equivalent usage allowance (c) Faults Pending for > 15 working to one month of minimum monthly usage allowance.
3
Billing Performance
• Billing complaints per 100 bills issued <2%
• %age of Billing Complaints Resolved 100% within 4 weeks
• Time taken for refund of deposits after closure 100% within 60 days
4 Response time to the customer assitance
% age of calls answered by operator (Voice to Voice) Within 60 seconds > 60% Within 90 seconds > 80%
5
Bandwidth Utilization/ throughput
a) Bandwidth Utilization
i) POP to ISP Gateway Node (Intra – Network) Links.
<80% link(s)/route bandwidth utilization during peak hours (TCBH). ii) ISP Gateway
Node to IGSP / NIXI upstream links for international connectivity.
b) Broadband connection speed (download).
Subscribed Broadband Connection Speed to be met >80% from ISP Node to User.
6 Service Availability / Uptime for all users > 98%
7 Packet Loss (for wired broadband access) <1%
8
Network Latency (for wired broadband access)
• User reference point at POP\ ISP gateway node to international gateway.
<120 msec
• User reference point at ISP Gateway Node to international nearest NAP port abroad.
<350 msec
• User reference point at ISP Gateway Node to international nearest NAP port abroad
<800 msec

April to June 2016 – UP East Circle 8
9 Customer perception of services
a % satisfied with the provision of services. >90%
b % satisfied with the billing performance. >90%
c % satisfied with help services >90%
d % satisfied with network performance, reliability and availability
>85%
e % satisfied with maintainability >85%
f % satisfied with Overall customer satisfaction >85%
g
% satisfied
>85% Customer satisfaction with offered supplementary services such as allocation of static/fixed IP addresses, email-id’s.

April to June 2016 – UP East Circle 9
3. EXECUTIVE SUMMARY : BASIC (WIRELINE)
The objective assessment of Quality of Service (QoS) carried out gives an insight into the overall
performance of various wireline operators in the UP East Circle, with a parameter wise performance
evaluation as compared to TRAI benchmark.
3.1. BASIC (WIRELINE)
The QoS audit for basic (wire line) service was undertaken for assessment of quarterly performance of the
service providers for quarter ended June-2016.
Sampling has been done for each service provider separately as per TRAI Guideline. In an LSA, sample has
been included all POPs located in 10% of SDCAs in the LSA or 10 SDCAs, whichever is more, subject to
maximum of the number of SDCAs covered by the service provider in the LSA. SDCAs selected should be
evenly spread over the LSA and shall include major population centers. List and details of POPs shall be
obtained from NOC/ISP Node of the operators. The performance of the Service providers against each
parameter has been evaluated by taking average of performance value of each parameter for all the
exchanges of the respective service providers. The averaged value of each parameter has been tabulated as
follows.
For BSNL exchanges, performance against each parameter has been evaluated by taking average of performance value
of each parameter for all the audited exchanges. The average value of each parameter has been tabulated as follows:
Sr. No Service Provider
Circle Audit Location Total Exchange (Urban+Rural)
No. of Urban/Rural Exchanges Covered
for audit
Total SDCA Coverd for
audit
3 AIRTEL Rajasthan BHARTI AIRTEL LIMITED, LUCKNOW, UP 1 1 1
1 BSNL Rajasthan LUCKNOW,ALLAHABAD 2131 170 16
2 RCL Rajasthan DAKC, MUMBAI 1 1 1
4 TTSL Rajasthan ALLAHABAD 1 1 1
Total Exchanges at present 2133 172 18

April to June 2016 – UP East Circle 10
3.2. SERVICE PROVIDER PERFORMANCE REPORT BASED ON QUARTERLY
MEASUREMENT DATA VERIFICATION FOR BASIC TELEPHONE SERVICE (WIRELINE) PROVIDERS
AVERAGED QUARTERLY (APR TO JUNE 16) AUDIT DATA FOR WIRELINE (BASIC) SERVICES – UPE CIRCLE
Wireline Audit Data Benchmark
Audit Period
BHARTI AIRTEL
BSNL RCL TTL
S/ N Name of Parameter WIRELINE SERVICE PROVIDERS
1 Fault incidences
% of (No. of faults/100 subscribers /month) < 7% Quarterly DNA 3.70% 0.04% 1.62%
2
Faults Repair/Restoration Time
% of fault repair by next working day (Urban Area) >85% Quarterly 87.89% 90% 100% 100%
% of fault repair Within 5 days (Urban Area) 100% Quarterly 100% 100% 100% 100%
% of fault repair by next working day (Rural & hilly Area) >75% Quarterly DNA 90% DNA DNA
% of fault repair Within 7 days (Rural & hilly Area) 100% Quarterly DNA 100% DNA DNA
Mean time to Repair(MTTR) ≤10 Hrs Quarterly 6.11 NP 5.4 1.74
3
Rent Rebate
Fault pending > 3 days & <7 days Rebate for 7 days Quarterly 263 0 0 0
Fault Pending > 7 days & < 15 days Rebate for 15 days Quarterly 0 0 0 0
Fault pending > 15 days Rebate for 1 month Quarterly 0 0 0 0
4
Metering & Billing Credibility
% of disputed Bills over bills issued (Post Paid ) < 0.1% Quarterly 0.00% 0.00% 0.00% 0.10%
% of Pre-paid Charging Complaints < 0.1% Quarterly DNA DNA DNA DNA
% of billing complaints (for post paid customer) / Charging/Credit/Validity (for Pre paid customer) resolved within 4
weeks 98% within 4 weeks Quarterly 100% 100% 100% 100%
% of billing complaints (for post paid customer) / Charging/Credit/Validity (for Pre paid customer) resolved within 6
weeks
100% within 6 weeks
Quarterly 100% 100% 100% 100%
Period of applying credit/Waiver/Adjustment to customers account from the date of resolution of complaints
<=1 week Quarterly 100% 100% 100% 100%
5 POI Congestion
No. of POI’s having congestion >0.5%
Quarterly 0 0 0 0
6
Response Time to customer for assistance
% Accessibility of Call centre /customer Care (Total call attempt*100/ Total call successfully established)
>=95% Quarterly 100% 97.95% 96.80% DNA
% age of calls answered by the operators (voice to voice) within 90 seconds.
>=95% Quarterly 91.00% 97.80% 98.7 DNA
7
Customer care(promptness in attending to customers request)
Termination / Closures 100% within
<=7days Quarterly 100% 100% 100% DNA
Time taken for refunds of deposit after 100% within 60 days Quarterly 100% 100% 100% DNA
closures

April to June 2016 – UP East Circle 11
3.3. SERVICE PROVIDER PERFORMANCE REPORT BASED ON 3 DAYS LIVE
MEASUREMENT DATA VERIFICATION FOR BASIC TELEPHONE SERVICE (WIRELINE) PROVIDERS
3 DAYS LIVE DATA FOR WIRELINE (BASIC) SERVICES – UPE CIRCLE
3 days live Wireline Audit Data Benchmark
Audit Period
BHARTI AIRTEL
BSNL RCL TTL
S/ N Name of Parameter WIRELINE SERVICE PROVIDERS
1 POI Congestion
No. of POI’s having congestion >0.5%
Live 0 0 0 0
2
Response Time to customer for assistance
A) Total no of calls attempted to customer care /Call center
Live 8696 10192 1614 DNA
B) Total no. of calls successfully established to customer care/Call center
Live 8696 9982 1574 DNA
C) % Accessibility of Call centre /customer Care >=95% Live 100% 97.94% 98.52% DNA
(Total call attempt*100/ Total call successfully established)
D) Total Calls reached to agent desk for Voice to Voice (Total call attempt)
Live 854 1701 1574 DNA
E) Total number of calls answered by the operator (Voice to voice) within 90 seconds
Live 779 1698 1556 DNA
F) % age of calls answered by the operators (voice to voice) within 90 seconds >=95% Live 91.22% 99.82% 99% DNA
(E *100/ D)
3.4. KEY FINDINGS: BASIC TELEPHONE SERVICES (WIRELINE)
Fault Incidences: The audit of the service providers revealed that the performance of all service providers was well
within the benchmark against the benchmark of < 7 %.
Fault Repair/Restoration Time: All Operators met the benchmark on this parameter.
Mean Time to Repair: All operators met the benchmark for MTTR.
Metering and Billing performance: For this parameter also, the performance of the service providers was found well
within the compliance benchmarks.
POI Congestion: All operators were found meeting the benchmark for this parameter. Response Time to Customer for assistance: For percentage of calls getting connected to call centre, the
performance of all service providers was within the benchmark of >95%. With respect to the parameter of calls answered by operator (voice to voice), the performance of all service providers was within the benchmark of >95%.
Termination/Closures: For this parameter, the performance of all the service providers was within the prescribed
benchmark.
Time taken for refund of deposit: For this parameter, the performance of all the service providers was within the
prescribed benchmark.

April to June 2016 – UP East Circle 12
3.5. INTER OPERATOR CALL ASSESSMENT (WIRELINE)
Inter operator call assessment with a sample of 2x50 test calls for each Service provider operating in UPE
Circle during the time 1000 to 1300 Hrs and 1500 to 1700 was carried out by auditors. The test calls were
made from one operator to another within the same licensed area to judge the ease of connectivity amongst
the operators.
INTER OPERATOR CALL ASSESSMENT BASED ON LIVE MEASUREMENT
Calling Operators Circle Name Total No. of calls Made BHARTI AIRTEL BSNL RCL TTL
BHARTI AIRTEL UPE 100 -- 100% 100% 100%
BSNL UPE 100 100% -- 100% 100%
RCL UPE 100 100% 100% -- 100%
TTL UPE 100 100% 100% 100% --
VODAFONE UPE 100 100% 100% 100% 100%
The result of the testing revealed that the inter connection performance among the operators was quite
satisfactory. Thus there was no remarkable problem in interconnection from one operator to other operators.
3.6. 9.5 LEVEL-1 LIVE CALLING (WIRELINE)
SR. NO. EMERGENCY
NUMBER CIRCLE BSNL RCL TSL
1 100 UP East √ √ √
2 101 UP East √ √ √
3 102 UP East √ √ √
4 104 UP East √ √ √
5 108 UP East √ √ √
6 138 UP East √ √ √
7 149 UP East × × ×
8 181 UP East √ √ √
9 182 UP East √ √ √
10 1033 UP East √ √ √
11 1037 UP East × × ×
12 1056 UP East × × ×
13 1060 UP East × × ×
14 1063 UP East × × ×
15 1064 UP East × × ×
16 1070 UP East × × ×
17 1071 UP East × × ×
18 1072 UP East √ √ √
19 1073 UP East × × ×
20 1077 UP East × × ×

April to June 2016 – UP East Circle 13
21 1090 UP East × × ×
22 1091 UP East × × ×
23 1097 UP East √ √ √
24 1099 UP East × × ×
25 10580 UP East × × ×
26 10589 UP East × × ×
27 10740 UP East × × ×
28 10741 UP East × × ×
29 1511 UP East × × ×
30 1512 UP East × × ×
31 1514 UP East × × ×
32 15100 UP East √ √ √
33 155304 UP East × × ×
34 155214 UP East × × ×
35 1903 UP East √ √ √
36 1909 UP East √ √ √
37 1912 UP East √ √ √
38 1916 UP East × × ×
39 1950 UP East √ √ √
3.7. CUSTOMER CARE / HELPLINE ASSESSMENT (WIRELINE SERVICES)
LIVE CALLING TO CALL CENTRE
Parameters Benchmark Circle Name
BHARTI AIRTEL
BSNL RCL TTL
Total No. of calls Attempted UPE 100 100 100 100
A) Total no of calls attempted to customer care/Call center UPE 100 100 100 100
B) Total no. of calls successfully established to customer care/Call center UPE 100 100 100 100
C) % Accessibility of Call centre /customer Care (Total call attempt*100/ Total call successfully established)
>=95% UPE 100.00% 100.00% 100.00% 100.00%
D) Total Calls reached to agent desk for Voice to Voice (Total call attempt) UPE 100 100 100 100
E) Total number of calls answered by the operator (Voice to voice) within 90 seconds UPE 100 100 100 100
F) % age of calls answered by the operators (voice to voice) within 90 seconds (E *100/ D)
>=95% UPE 100.00% 100.00% 100.00% 100.00%
In case of calls answered by operators (voice to voice), when test calls were made to the call centers of different service
providers, 100% of calls were answered by the call center operators within stipulated time in the network of Airtel, RCL,
Vodafone, BSNL and TTL.

April to June 2016 – UP East Circle 14
3.8. GRAPHICAL REPRESENTATION
BHARTI AIRTEL BSNL RCL TTL
(No. of faults/100 subscribers/month)
2.12% 3.70% 0.04% 1.62%
Benchmark 7% 7% 7% 7% 7%
2.12%
3.70%
0.04%
1.62%
0.00%
1.00%
2.00%
3.00%
4.00%
5.00%
6.00%
7.00%
8.00%
No. of faults/100 subscribers /month
BHARTIAIRTEL
BSNL RCL TTL
Fault repair by next workingday(Urban Area)
87.89% 90.00% 100.00% 100.00%
Benchmark >85% 85% 85% 85% 85%
87.89%90.00%
100.00% 100.00%
75.00%
80.00%
85.00%
90.00%
95.00%
100.00%
Fault repair by next working day(Urban Area)
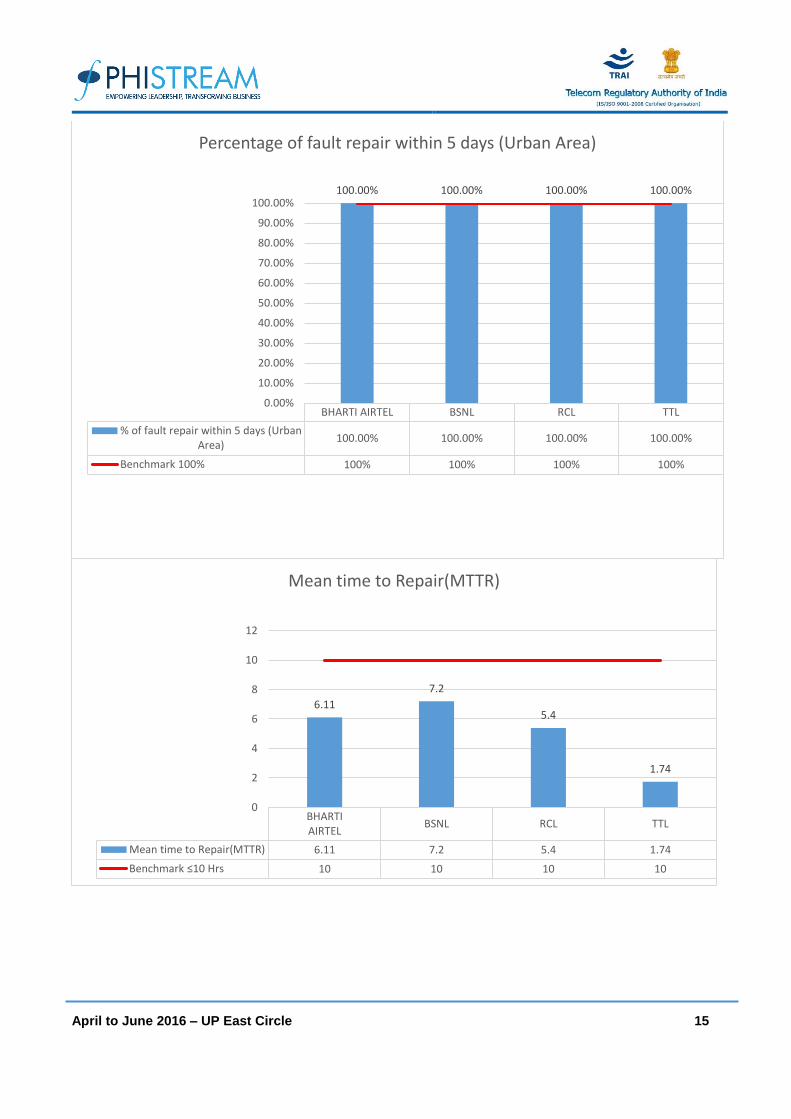
April to June 2016 – UP East Circle 15
BHARTI AIRTEL BSNL RCL TTL
% of fault repair within 5 days (UrbanArea)
100.00% 100.00% 100.00% 100.00%
Benchmark 100% 100% 100% 100% 100%
100.00% 100.00% 100.00% 100.00%
0.00%
10.00%
20.00%
30.00%
40.00%
50.00%
60.00%
70.00%
80.00%
90.00%
100.00%
Percentage of fault repair within 5 days (Urban Area)
BHARTIAIRTEL
BSNL RCL TTL
Mean time to Repair(MTTR) 6.11 7.2 5.4 1.74
Benchmark ≤10 Hrs 10 10 10 10
6.11
7.2
5.4
1.74
0
2
4
6
8
10
12
Mean time to Repair(MTTR)

April to June 2016 – UP East Circle 16
BHARTIAIRTEL
BSNL RCL TTL
% of disputed Bills over billsissued (Post Paid )
0.02% 0.00% 0.00% 0.00%
Benchmark < 0.1% 0.10% 0.10% 0.10% 0.10%
0.02%
0.00% 0.00% 0.00%0.00%
0.02%
0.04%
0.06%
0.08%
0.10%
0.12%
Metering & Billing Performance
BHARTI AIRTEL BSNL RCL TTL
% of billing complaints resolvedwithin 4 weeks
100.00% 100.00% 100.00% 100.00%
Benchmark < 98% 98.00% 98.00% 98.00% 98.00%
100.00% 100.00% 100.00% 100.00%
97.00%
97.50%
98.00%
98.50%
99.00%
99.50%
100.00%
Percentage of billing complaints resolved within 4 weeks

April to June 2016 – UP East Circle 17
BHARTIAIRTEL
BSNL RCL TTL
% of billing complaints resolvedwithin 6 weeks
100.00% 100.00% 100.00% 100.00%
Benchmark < 100% 100.00% 100.00% 100.00% 100.00%
100.00% 100.00% 100.00% 100.00%
0.00%
10.00%
20.00%
30.00%
40.00%
50.00%
60.00%
70.00%
80.00%
90.00%
100.00%
Percentage of billing complaints resolved within 6 weeks
BHARTI AIRTEL BSNL RCL TTL
Termination / Closures 100.00% 100.00% 100.00% 100.00%
Time taken for refunds of depositafter closures
100.00% 100.00% 100.00% 100.00%
Benchmark < 100% 100.00% 100.00% 100.00% 100.00%
10
0.0
0%
10
0.0
0%
10
0.0
0%
10
0.0
0%
10
0.0
0%
10
0.0
0%
10
0.0
0%
10
0.0
0%
0.00%
10.00%
20.00%
30.00%
40.00%
50.00%
60.00%
70.00%
80.00%
90.00%
100.00%
Customer care(promptness in attending to customers request)

April to June 2016 – UP East Circle 18
BHARTI AIRTEL BSNL RCL TTL
Accessibility of Callcentre/customer Care
100.00% 95.00% 96.80% 100.00%
Benchmark >=95% 95.00% 95.00% 95.00% 95.00%
100.00%
95.00%
96.80%
100.00%
92.00%
93.00%
94.00%
95.00%
96.00%
97.00%
98.00%
99.00%
100.00%
Accessibility of Call centre/customer Care
BHARTI AIRTEL BSNL RCL TTL
% age of calls answered byoperator(voice to voice) within 90
seconds91.24% 96.27% 98.70% 97.54%
Benchmark >=95% 95.00% 95.00% 95.00% 95.00%
91.24%
96.27%
98.70%97.54%
86.00%
88.00%
90.00%
92.00%
94.00%
96.00%
98.00%
100.00%
Percentage of calls answered by operator(voice to voice) within 90 seconds

April to June 2016 – UP East Circle 19
4. EXECUTIVE SUMMARY : BROADBAND
The objective assessment of Quality of Service (QoS) carried out gives an insight into the overall
performance of various broadband operators in the Rajasthan Circle, with a parameter wise performance
evaluation as compared to TRAI benchmark.
4.1. QUALITY OF SERVICE AUDIT OF BROADBAND SERVICE PROVIDERS
Phistream has to conduct the audit and assessment of Quality of Service of Broadband Service only in
respect of the service providers who are having broadband subscriber base of more than 10,000 subscribers
in their licensed service area as per TRAI guideline; Sampling shall be done for each service provider
separately. In an LSA, sample shall include all POPs located in 10% of SDCAs in the LSA or 10 SDCAs,
whichever is more, subject to maximum of the number of SDCAs covered by the service provider in the LSA.
SDCAs selected should be evenly spread over the LSA and shall include major population centers. List and
details of POPs shall be obtained from NOC/ISP Node of the operators. A service areal circle in the
contracted Zone shall be audited only once in a year.
Discussion with the private broadband service providers reveals that there is no concept of their PoPs on
SDCA basis; they are maintaining their entire data on centralized basis so audit has been done for the
centralized data.
Audit was done for the following Broadband service Providers in Rajasthan circle.
SL. NO. NAME OF BROADBAND SERVICE PROVIDERS
LOCATION OF AUDIT / POP
1 BHARTI AIRTEL BHARTI AIRTEL LIMITED, LUCKNOW, UP
2 BSNL BARABANKI, LAKHIMPUR KHIRI, FAIZABAD SSA
3 RCL DAKC, MUMBAI
4 TIKONA TIKONA, LUCKNOW, UP
5 PACENET BROADBAND PACENET INDIA PVT LTD,
S-23,AJAY ENCLAVE, NEAR SUBHASH NAGAR METRO STATION, NEW DELHI

April to June 2016 – UP East Circle 20
4.2. QUARTERLY MEASURMENT DATA FOR BROADBAND SERVICE PROVIDERS
AVERAGED QUARTERLY (APR TO JUNE-16) AUDIT DATA FOR BROADBAND SERVICES
Broadband Audit Data Bench- mark
Circle Name
BHARTI-AIRTEL
BSNL RCL TIKONA DEN
NETWORKS PACENET
S/ N Name of Parameter BROADBAND SERVICE PROVIDERS
1
Service Provisioning/Activation Time
A) No of connections registered during the period UPE 3415 1127 913 5899 796 211
B) Total number of connections provided within 15 days of registration on demand during the period
UPE 3415 1127 913 5899 796 207
C) % age of connections provided within 15 days of registration on demand (subject to technical feasibility)
<15 days UPE 100.00% 100.00% 100.00% 100.00% 100.00% 98.10%
D)Total number of connections provided after 15 days of registration on demand
UPE 0 0 0 0 0 0
E) %age of connections provided after 15 days of registration on demand
UPE 0.00% 0.00% 0.00% 0.00% 0.00% 0.00%
F) In all cases where payment towards installation charge & SD is taken and the Broadband connection is not provided within 15 working days
credit @ Rs.10/ per
day. UPE 0 0 0 0 0 0
2
Fault Repair/Restoration Time
A) Total number of faults registered during the period UPE 6063 954 964 12979 1890 79
B) Total number of faults repaired by next working day UPE 5550 899 964 11718 1689 79
C) % age of faults repaired by next working day
>90% UPE 91.54% 94.23% 100.00% 90.28% 89.37% 100.00%
D) Total number of faults repaired within three working days
UPE 6005 954 964 12914 1884 79
E)% age of faults repaired within three working days
≥99% UPE 99.04% 100.00% 100.00% 99.50% 99.68% 100.00%
3
Rent Rebate
A) Faults Pending for > 3 working days and < 7 working days: (Rebate equivalent to 7 days of minimum monthly charge or equivalent usage allowance)
UPE 0 0 0 291 0 0

April to June 2016 – UP East Circle 21
B) Faults Pending for > 7 working days and < 15 working days: (Rebate equivalent to 15 days of minimum monthly charge or equivalent usage allowance)
UPE 0 0 0 231 0 0
C) Faults Pending for > 15 working days:(Rebate equivalent to one month of minimum monthly charge or equivalent usage allowance)
UPE 0 0 0 77 0 0
4
Billing Performance
A) Total bills generated during period UPE 131018 8242 37004 62888 DNA 853
B) Total complaints received from customers/ Bills disputed UPE 12 0 42 584 DNA 0
C) Billing complaints per 100 bills issued
<2% UPE 0.01% 0.00% 0.11% 0.93% DNA 0.00%
D) Total number of complaints resolved in 4 weeks from date of receipt
UPE 12 0 42 584 DNA 0
E) %age billing complaints resolved in 4 weeks
100% UPE 100.00% 100.00% 100.00% 100 DNA 100.00%
F) Total number of cases requiring refund of deposits after closure
UPE 320 47 6 20 DNA 0
G) Total number of cases where refund was made in <60 days UPE 320 43 6 20 DNA 0
H) Percentage cases in which refund received within 60 days
100% UPE 100.00% 91.49% 100.00% 100.00% DNA 100.00%
5
Response time to the customer for assistance % age of calls answered by operator (Voice to Voice)
A) Total number of calls received by the operator UPE 72776 81360 98281 122322 311819 24
B) Total number of calls answered by the operator within 60 seconds
UPE 59702 77487 93118 79525 21720 24
C) % age calls answered by the operator in 60 seconds
>60% UPE 82.04% 95.24% 94.75% 65.01% 72.79% 100.00%
D) Total number of calls answered by the operator within 90 seconds
UPE 62976 79936 93864 102162 231983 24
E) % age calls answered by the operator within 90 seconds
>80% UPE 86.53% 98.25% 95.51% 83.52% 80.42% 100.00%
6 Bandwidth Utilization/ Throughput: (If on any link(s) / route bandwidth utilization exceeds 90%, then network is considered to have congestion. For
this additional provisioning of Bandwidth on immediate basis, but not later than one month, is mandated.) < 80% link(s) / route bandwidth utilization during peak hours (TCBH).
6.1
POP to ISP Gateway Node [Intra-network] Link(s)
A) Total Bandwidth Available at the link for the period days UPE 25500 18000 6000 7630 5425 693

April to June 2016 – UP East Circle 22
B) Total Bandwidth utilized during the period during TCBH (In Mpbs)
UPE 21145.4 7803 1253.61 4981.71 5124 545
C) % age Bandwidth utilized during the period
<80% UPE 82.92% 43.35% 20.89% 65.29% 94.45% 78.64%
6.2
A) ISP Gateway Node to IGSP / NIXI Node upstream Link(s) for International connectivity
A) Total number of upstream links for International connectivity
UPE 6 DNA 12 7 6 DNA
B) Number of Links having Bandwidth utilization > 90% during TCBH
UPE 0 DNA 0 0 0 DNA
C) Total international bandwidth available from ISP Node to IGSP/NIXI/NAP
UPE 25500 DNA 348000 6770 5425 DNA
D) Total international bandwidth utilization during peak hours (TCBH) in Mpbs
UPE 21145.4 DNA 142774 5136.1 5154 DNA
E) %age International Bandwidth utilization during peak hours (TCBH)
<80% UPE 82.92% DNA 41.03% 75.87% 95.00% DNA
6.3
Broadband Connection Speed (download) - from ISP Node to User
A) Total committed download speed to the sample subscribers (In mpbs)
UPE 6 6 3 12288 15 9
B) Total average download speed observed for the sample subscribers during TCBH (In Mpbs)
UPE 6.33 5.57 2.55 10461 15 8.21
C) % age subscribed speed available to the subscriber during TCBH
>80% UPE 105.50% 92.83% 85.00% 85.13% 100.00% 91.22%
7
Service Availability/Uptime
A) Total operational Hours UPE 95380464 2184 2184 2184 2184 2184
B) Total downtime (In hours) UPE 67157.28 1 15.64 7.384 0.15 2
C) Total time when the service was available (In Hrs) UPE 95313306.72 2183 2168.36 2176.616 2183.85 2182.00
D) % age of Service availability uptime
>98% UPE 99.93% 99.95% 99.28% 99.66% 99.99% 99.91%
8
Packet Loss
A) Total number of ping packets transmitted UPE 3000 3000 91000 3000 3000 3000
B) Total number of ping packets lost UPE 0 7 351 0 0 2
C) % age packet loss <1% UPE 0.00% 0.23% 0.39% 0.00% 0.00% 0.07%

April to June 2016 – UP East Circle 23
9 Network latency (for wired broadband access)
9.1
Network Latency from User reference point at POP/ISP Node to IGSP/NIXI gateway
A) Total number of ping packets transmitted UPE 3000 3000 3000 4000 3000 3000
B) Total round trip time for all the ping packets transmitted during the period
UPE 133.4 71.46 9 120 213 258
C) Average round trip tip time for all the ping transmitted
<120 ms UPE 44.46 23.82 3 40 71 86
9.2
Network Latency from User reference point at ISP Node to nearest NAP Port abroad (Terrestrial)
A) Total number of ping packets transmitted UPE 3000 3000 3000 4000 3000 3000
B) Total round trip time for all the ping packets transmitted during the period
UPE 331 269.82 72 147 333 213
C) Average round trip tip time for all the ping transmitted
<350 ms UPE 112.05 89.94 24 49 111 71
9.3
Network Latency from User reference point at ISP Node to nearest NAP Port abroad (Satellite)
A) Total number of ping packets transmitted UPE DNA DNA DNA DNA DNA DNA
B) Total round trip time for all the ping packets transmitted during the period
UPE DNA DNA DNA DNA DNA DNA
C) Average round trip tip time for all the ping transmitted
<800 ms UPE DNA DNA DNA DNA DNA DNA
4.3. SERVICE PROVIDER PERFORMANCE REPORT BASED ON 3 DAYS MEASUREMENT
DATA VERIFICATION FOR BROADBAND SERVICE PROVIDERS
3 DAYS LIVE DATA FOR BROADBAND SERVICES
3 days live Broadband Audit Data Bench- mark
Circle Name
BHARTI-AIRTEL
BSNL (ALBD)
RCL TIKONA DEN
NETWORKS PACENET
S/ N Name of Parameter
BROADBAND SERVICE PROVIDERS
1
Response time to the customer for assistance % age of calls answered by operator (Voice to Voice)
A) Total number of calls received by the operator
UPE 5011 3869 3674 4305 9521 5

April to June 2016 – UP East Circle 24
B) Total number of calls answered by the operator within 60 seconds
UPE 4320 3850 3593 2861 8967 5
C) % age calls answered by the operator in 60 seconds
>60% UPE 86.21% 99.51% 97.80% 66.46% 95.00% 100.00%
D) Total number of calls answered by the operator within 90 seconds
UPE 4508 3867 3629 3687 9118 5
E) % age calls answered by the operator within 90 seconds
>80% UPE 89.96% 99.95% 98.78% 85.64% 98.00% 100.00%
2 Bandwidth Utilization/ Throughput: (If on any link(s) / route bandwidth utilization exceeds 90%, then network is considered to
have congestion. For this additional provisioning of Bandwidth on immediate basis, but not later than one month, is mandated.) < 80% link(s) / route bandwidth utilization during peak hours (TCBH).
2.1
POP to ISP Gateway Node [Intra-network] Link(s)
A) Total Bandwidth Available at the link for the period days
UPE 25500 18000 6000 7695 5580 693
B) Total Bandwidth utilized during the period during TCBH (In Mpbs)
UPE 21145.4 7721 1518.5 5135.81 5068 551
C) % age Bandwidth utilized during the period
<80% UPE 82.92% 42.89% 25.31% 66.74% 90.82% 79.51%
2.2
A) ISP Gateway Node to IGSP / NIXI Node upstream Link(s) for International connectivity
A) Total number of upstream links for International connectivity
UPE 6 DNA 12 3 6 DNA
B) Number of Links having Bandwidth utilization > 90% during TCBH
UPE 0 DNA 0 0 0 DNA
C) Total international bandwidth available from ISP Node to IGSP/NIXI/NAP
UPE 25500 DNA 348000 7125 5580 DNA
D) Total international bandwidth utilization during peak hours (TCBH) in Mpbs
UPE 21145.4 DNA 176971.2 5511.78 5068 DNA
E) %age International Bandwidth utilization during peak hours (TCBH)
<80% UPE 82.92% DNA 50.85% 77.36% 90.82% DNA

April to June 2016 – UP East Circle 25
2.3
Broadband Connection Speed (download) - from ISP Node to User
A) Total committed download speed to the sample subscribers (In mpbs)
UPE 6 6 4.50 12288 15 10
B) Total average download speed observed for the sample subscribers during TCBH (In Mpbs)
UPE 6.33 5.3 4.29 11084 15 9.13
C) % age subscribed speed available to the subscriber during TCBH
>80% UPE 105.50% 88.33% 95.33% 90.20% 100.00% 91.30%
3
Packet Loss
A) Total number of ping packets transmitted
UPE 3000 3000 3000 3000 3000 3000
B) Total number of ping packets lost
UPE 0 7 0 0 0 11
C) % age packet loss
<1% UPE 0.00% 0.23% 0.00% 0.00% 0.00% 0.37%
4 Network latency (for wired broadband access)
4.1
Network Latency from User reference point at POP/ISP Node to IGSP/NIXI gateway
A) Total number of ping packets transmitted
UPE 3000 3000 3000 4000 3000 3000
B) Total round trip time for all the ping packets transmitted during the period
UPE 133.4 166.18 5.46 120 213 117
C) Average round trip tip time for all the ping transmitted
<120 ms UPE 44.46 55.39 1.82 40 71 39
4.2
Network Latency from User reference point at ISP Node to nearest NAP Port abroad (Terrestrial)
A) Total number of ping packets transmitted
UPE 3000 3000 3000 4000 3000 3000
B) Total round trip time for all the ping packets transmitted during the period
UPE 331 374.58 5.43 147 333 267
C) Average round trip tip time for all the ping transmitted
<350 ms UPE 112.05 124.86 1.81 49 111 89
4.3 Network Latency from User reference point at ISP Node to nearest NAP Port abroad (Satellite)

April to June 2016 – UP East Circle 26
A) Total number of ping packets transmitted
UPE DNA DNA DNA DNA DNA DNA
B) Total round trip time for all the ping packets transmitted during the period
UPE DNA DNA DNA DNA DNA DNA
C) Average round trip tip time for all the ping transmitted
<800 ms UPE DNA DNA DNA DNA DNA DNA
5
Service Availability/Uptime
A) Total operational Hours
UPE 72 72 72 72 72 72
B) Total downtime (In hours)
UPE 0 0 0 0.20 0.05 0
C) Total time when the service was available (In Hrs)
UPE 72 72 72 71.79 71.95 72
D) % age of Service availability uptime
>98% UPE 100.00% 100.00% 100.00% 99.71% 99.93% 100.00%
NA: Not applicable
NP: Data not provided

April to June 2016 – UP East Circle 27
4.4. KEY FINDINGS: BROADBAND SERVICES
Service Provisioning / Activation Time: The audit of the service providers revealed that all operators met the
benchmark of the parameter Connection within 15 days.
Fault Repair/Restoration Time: With regards to the fault related parameters, the performance of the service providers
Den-Network not meeting with the benchmark as 89.37%.
Billing Performance: For this parameter the performance of the service providers was found well within the compliance
benchmarks. As far as the concern of refund BSNL not meeting the benchmark as 91.49% Response Time to Customer for assistance by operator (Voice to Voice): For percentage of calls getting
connected to call center and answered, all service providers were found meeting the benchmark for this parameter.
Bandwidth Utilization/ Throughput: All the service providers were found using Multiple Router Traffic Grapher
(MRTG) and also it was observed that all service providers were reporting combined bandwidth utilization for corporate customers and household customers. The performance of service providers with respect of these parameters Airtel not meeting with the benchmark as 82.92% and Den-Network also not meeting with the benchmark as 85.00%.
Service Availability/Uptime: All service providers were found meeting the benchmark for this parameter.
Packet Loss and Network Latency: It was observed that almost all operators were measuring packet loss and
latency by conducting ping test on random basis for their internal assessment. All operators found meeting the benchmark.
4.5. CUSTOMER CARE / HELPLINE ASSESSMENT
LIVE CALLING TO CALL CENTRE FOR BROADBAND SERVICES
CIRCLE NAME BHARTI-AIRTEL BSNL RCL TIKONA PACENET
Total No. of calls Attempted UPE 100 NP 100 100 100
Total number of calls answered by the operator within 60 seconds UPE 83 NP 100 100 96
% age calls answered by the operator in 60 seconds UPE 83.00% NP 100.00% 100.00% 96.00%
Total number of calls answered by the operator within 90 seconds UPE 92 NP 100 100 100
% age calls answered by the operator within 90 seconds UPE 92.00% NP 100.00% 100.00% 100.00%
In case of calls answered by operators (voice to voice) within 60 seconds and 90 seconds, when test calls were made to the call centres, all broadband service providers were found meeting the TRAI prescribed benchmark.

April to June 2016 – UP East Circle 28
4.6. LIVE CALLING FOR BILLING COMPLIANTS
TELEPHONIC INTERVIEW FOR BILLING COMPLAINTS
Circle Name BHARTI-AIRTEL BSNL RCL TIKONA PACENET
Total No. of calls Attempted UPE 14 DNA 42 100 2 Total No. of calls Answered UPE 14 DNA 35 100 2
Cases resolved within 4 weeks UPE 14 DNA 35 100 2 %age of cases resolved UPE 100.00% DNA 100.00% 100.00% 100.00%
To test the Service Providers performance on billing related complaints and their resolutions, auditors
conducted a customer feedback calling for about random 100 nos. of customers. However, in some cases, the
number of customers contacted for verification was very less due to less number of billing complaints. During
live calling, some of the customers did not attend the calls while few others reported that there complaints
have been resolved but did not remember about the duration of their resolution. However, most of the
customers reported their satisfaction on resolution of the billing complaints.
4.7. GRAPHICAL REPRESENTATION
BHARTI-AIRTEL
BSNL RCL TIKONADEN
NETWORKSPACENET
Service Provisioning/Activation Time 100.00% 100.00% 100.00% 100.00% 100.00% 98.10%
Benchmark <15Days 100% 100% 100% 100% 100% 100%
100.00% 100.00% 100.00% 100.00% 100.00%
98.10%
97.00%
97.50%
98.00%
98.50%
99.00%
99.50%
100.00%
Service Provisioning/Activation Time

April to June 2016 – UP East Circle 29
BHARTI-AIRTEL
BSNL RCL TIKONADEN
NETWORKSPACENET
Billing complaints per 100 billsissued
0.01% 0.00% 0.11% 0.93% 0.00% 0.00%
Benchmark <2% 2% 2% 2% 2% 2% 2%
0.01% 0.00%0.11%
0.93%
0.00% 0.00%0.00%
0.50%
1.00%
1.50%
2.00%
Billing Performance
BHARTI-AIRTEL
BSNL RCL TIKONADEN
NETWORKSPACENET
% age of faults repaired within threeworking days
99.04% 100.00% 100.00% 99.50% 99.68% 100.00%
Benchmark 99% 99% 99% 99% 99% 99% 99%
99.04%
100.00% 100.00%
99.50%
99.68%
100.00%
98.40%
98.60%
98.80%
99.00%
99.20%
99.40%
99.60%
99.80%
100.00%
Service Provisioning/Activation Time

April to June 2016 – UP East Circle 30
BHARTI-AIRTEL
BSNL RCL TIKONADEN
NETWORKSPACENET
%age billing complaints resolved in 4weeks
100.00% 100.00% 100.00% 10000.00% 0.00% 100.00%
Benchmark ≤10 Hrs 100.00% 100.00% 100.00% 100.00% 100.00% 100.00%
100.00% 100.00% 100.00%
0.00%
100.00%
0.00%
10.00%
20.00%
30.00%
40.00%
50.00%
60.00%
70.00%
80.00%
90.00%
100.00%
Billing Performance
BHARTI-AIRTEL
BSNL RCL TIKONADEN
NETWORKSPACENET
Time taken for refunds of depositafter closures(Within 60Days)
100.00% 91.49% 100.00% 100.00% 0.00% 100.00%
Benchmark 100% 100.00% 100.00% 100.00% 100.00% 100.00% 100.00%
100.00%
91.49%
100.00% 100.00%
0.00%
100.00%
0.00%
10.00%
20.00%
30.00%
40.00%
50.00%
60.00%
70.00%
80.00%
90.00%
100.00%
Time taken for refunds of deposit after closures(Within 60Days)

April to June 2016 – UP East Circle 31
BHARTI-AIRTEL
BSNL RCL TIKONADEN
NETWORKSPACENET
% age of Service availability uptime 99.93% 99.95% 99.28% 99.66% 99.99% 99.91%
Benchmark >98% 98.00% 98.00% 98.00% 98.00% 98.00% 98.00%
99.93% 99.95%
99.28%
99.66%
99.99% 99.91%
97.00%
97.50%
98.00%
98.50%
99.00%
99.50%
100.00%
Service Availability/Uptime
BHARTI-AIRTEL
BSNL RCL TIKONADEN
NETWORKS
PACENET
Quarterly 82.92% 43.35% 20.89% 65.29% 94.45% 78.64%
Benchmark <80% 80.00% 80.00% 80.00% 80.00% 80.00% 80.00%
82.92%
43.35%
20.89%
65.29%
94.45%
78.64%
0.00%
10.00%
20.00%
30.00%
40.00%
50.00%
60.00%
70.00%
80.00%
90.00%
100.00%
Bandwidth Utilization/ ThroughputPOP to ISP Gateway Node [Intra-network] Link(s)

April to June 2016 – UP East Circle 32
BHARTI-AIRTEL
BSNL RCL TIKONADEN
NETWORKSPACENET
Quarterly 82.92% 0.00% 41.03% 75.87% 95.00% 0.00%
3Day Live 0.00% 9.01% 84.95% 0.00% 39.29% 71.51%
Benchmark <80% 80.00% 80.00% 80.00% 80.00% 80.00% 80.00%
82
.92
%
0.0
0%
41
.03
%
75
.87
%
95
.00
%
0.0
0%
0.0
0% 9.0
1%
84
.95
%
0.0
0%
39
.29
%
71
.51
%
0.00%
10.00%
20.00%
30.00%
40.00%
50.00%
60.00%
70.00%
80.00%
90.00%
100.00%
Bandwidth Utilization/ Throughput ISP Gateway Node to IGSP / NIXI Node upstream Link(s) for International connectivity
BHARTI-AIRTEL
BSNL RCL TIKONADEN
NETWORKSPACENET
Quarterly 100.00% 92.83% 85.00% 85.13% 100.00% 91.22%
3Day Live 0.00% 100.00% 99.40% 100.00% 90.75% 99.25%
Benchmark >80% 80.00% 80.00% 80.00% 80.00% 80.00% 80.00%
10
0.0
0%
92
.83
%
85
.00
%
85
.13
% 10
0.0
0%
91
.22
%
0.0
0%
10
0.0
0%
99
.40
%
10
0.0
0%
90
.75
%
99
.25
%
0.00%
10.00%
20.00%
30.00%
40.00%
50.00%
60.00%
70.00%
80.00%
90.00%
100.00%
Broadband Connection Speed (download) from ISP Node to User

April to June 2016 – UP East Circle 33
BHARTI-AIRTEL
BSNL RCL TIKONADEN
NETWORKS
PACENET
Quarterly 0.00% 0.23% 0.39% 0.00% 0.00% 0.07%
3Day Live 0.00% 0.23% 0.00% 0.00% 0.00% 0.37%
Benchmark <1% 1.00% 1.00% 1.00% 1.00% 1.00% 1.00%
0.0
0%
0.2
3% 0
.39
%
0.0
0%
0.0
0%
0.0
7%
0.0
0%
0.2
3%
0.0
0%
0.0
0%
0.0
0%
0.3
7%
0.00%
0.20%
0.40%
0.60%
0.80%
1.00%
Percentage Packet loss
BHARTI-AIRTEL BSNL RCL TIKONADEN
NETWORKSPACENET
Quarterly 44.46 23.82 3 40 71 86
3Day Live 44.46 55.39 1.82 40 71 39
Benchmark <120 ms 120 120 120 120 120 120
44
.46
23
.82
3
40
71
86
44
.46
55
.39
1.8
2
40
71
39
0
20
40
60
80
100
120
140
Network latency User reference point at POP/ISP Gateway node to IGSP/NIXI

April to June 2016 – UP East Circle 34
BHARTI-AIRTEL BSNL RCL TIKONADEN
NETWORKSPACENET
Quarterly 112.05 89.94 24 49 111 71
3Day Live 112.05 124.86 1.81 49 111 89
Benchmark <350 ms 350 350 350 350 350 350
11
2.0
5
89
.94
24
49
11
1
71
11
2.0
5
12
4.8
6
1.8
1
49
11
1
89
0
50
100
150
200
250
300
350
400
Network latency User reference point at ISP Gateway Node to International nearest NAP port abroad (terrestrial)
BHARTI-AIRTEL
BSNL RCL TIKONADEN
NETWORKSPACENET
Quarterly 82.04% 95.24% 94.75% 65.01% 72.79% 100.00%
3Day Live 86.21% 99.51% 97.80% 66.46% 95.00% 100.00%
Benchmark >60% 60.00% 60.00% 60.00% 60.00% 60.00% 60.00%
82
.04
%
95
.24
%
94
.75
%
65
.01
%
72
.79
%
10
0.0
0%
86
.21
%
99
.51
%
97
.80
%
66
.46
%
95
.00
%
10
0.0
0%
0.00%10.00%20.00%30.00%40.00%50.00%60.00%70.00%80.00%90.00%
100.00%
Response time to the customer for assistance % age of calls answered by operator (Voice to Voice)

April to June 2016 – UP East Circle 35
BHARTI-AIRTEL
BSNL RCL TIKONADEN
NETWORKSPACENET
Quarterly 86.53% 98.25% 95.51% 83.52% 80.42% 100.00%
3Day Live 89.96% 99.95% 98.78% 85.64% 98.00% 100.00%
Benchmark >80% 80.00% 80.00% 80.00% 80.00% 80.00% 80.00%
86
.53
%
98
.25
%
95
.51
%
83
.52
%
80
.42
%
10
0.0
0%
89
.96
% 99
.95
%
98
.78
%
85
.64
%
98
.00
%
10
0.0
0%
0.00%
10.00%
20.00%
30.00%
40.00%
50.00%
60.00%
70.00%
80.00%
90.00%
100.00%
Response time to the customer for assistance % age of calls answered by operator (Voice to Voice)

April to June 2016 – UP East Circle 36
5. ABBREVIATIONS Following terms/abbreviations have been used in this report. This section provides meaning of the
abbreviations used in the report.
TRAI – Telecom Regulatory Authority of India
QoS – Quality of Service
AMJ’16 – Refers to the quarter of April, May and June 2016
SSA – Secondary Switching Area
NOC – Network Operation Center
OMC – Operations and Maintenance Center
MSC – Mobile Switching Center
PMR – Performance Monitoring Reports
TCBH – Time Consistent Busy Hour
CBBH - Cell Bouncing Busy Hour
BTS – Base Transceiver Station
CSSR – Call Setup Success Rate
TCH – Traffic Channel
SDCCH – Standalone Dedicated Control Channel
CDR – Call Drop Rate
FER – Frame Error Rate
SIM – Subscriber Identity Module
GSM – Global System for Mobile
CDMA – Code Division Multiple Access
NA – Not Applicable
NC – Non Compliance
POI – Point of Interconnection
IVR – Interactive Voice Response
STD – Standard Trunk Dialling
ISD – International Subscriber Dialling