audit of selected polygons of the sensitive ecosystems ... of selected polygons of the sensitive...
TRANSCRIPT

Audit of Selected Polygons of the Sensitive EcosystemsInventory of East Vancouver Island and Gulf Islands,
1999 – 2001
Prepared byMarlene Caskey and Margaret Henigman
Ecosystems Section, Environmental Stewardship DivisionMinistry of Water, Land and Air Protection
2002

2
Plate 1: Polygon N1400 - Wetland in rural land use category Disturbed by cutting ofvegetation, fill encroachment and excavation.
Cover photo: Polygon V0923 - Urban development into a Woodland.
3
Table of Contents
Executive Summary.............................................................................................................5
Acknowledgements .............................................................................................................6
Introduction..........................................................................................................................7
Methodology and Limitations..............................................................................................9Site Selection.........................................................................................................................9Ortho Photography ..............................................................................................................10Disturbance Categories........................................................................................................10Land Use Categories ...........................................................................................................11Database.............................................................................................................................12Limitations ...........................................................................................................................12
Results and Discussion.....................................................................................................13Rate of Modification by Ecosystem Type..............................................................................16Rate of Modification by Land Use and Ecosystem Type .......................................................18Federal Land Use ................................................................................................................18Forestry Land Use ...............................................................................................................18Greenspace Land Use .........................................................................................................19Rural Land Use....................................................................................................................19Urban Land Use ..................................................................................................................19Vancouver Island Highway Project (VIHP)............................................................................19
Implications of Sensitive Ecosystem Disturbance ...........................................................20Species Loss .......................................................................................................................20Impacts of Ecosystem Modification ......................................................................................21Buffers.................................................................................................................................22Landscape Fragmentation and Connectivity .........................................................................23
Conclusions .......................................................................................................................24
References .........................................................................................................................25
APPENDIX A: Mapsheets Audited.......................................................................................26APPENDIX B: Numbers of Polygons of each SEI Ecosystem Type Audited, compared to
Original SEI Data ..............................................................................................................27
Plates
Plate 1: Wetland in Rural Land Use category .......................................................................2
Plate 2: 1999 ortho-photo used in the audit ........................................................................11
Plate 3: Urban Development into Coastal Bluff Ecosystem .................................................17

4
Table of Contents Continued
Plate 4: Sparsely Vegetated Ecosystem.............................................................................19
Plate 5: Wetland in a park ..................................................................................................20
Plate 6: Terrestrial Herbaceous Ecosystem - VIHP.............................................................21
Plate 7: Woodland in Rural setting .....................................................................................22
Plate 8: Terrestrial Herbaceous Ecosystem - Urban ...........................................................23
Figures
Figure 1: SEI Study Area .....................................................................................................8
Figure 2: Land Use Distribution of Audited Polygons by number of polygons ......................12
Figure 3: Percentage of Modified Polygons within each SEI ecosystem type.......................16
Figure 4: Percentage of Modified Polygons by Land Use Category for 1991 – 1999............18
Tables
Table 1: Distribution of Audited Sites Compared to Original SEI ...........................................9
Table 2: Level of Disturbance, by SEI Ecosystem and Land Use……………………… ......... 14
5
Audit of Selected Polygons of the SensitiveEcosystems Inventory of East Vancouver Island and Gulf
Islands, 1999 – 2001
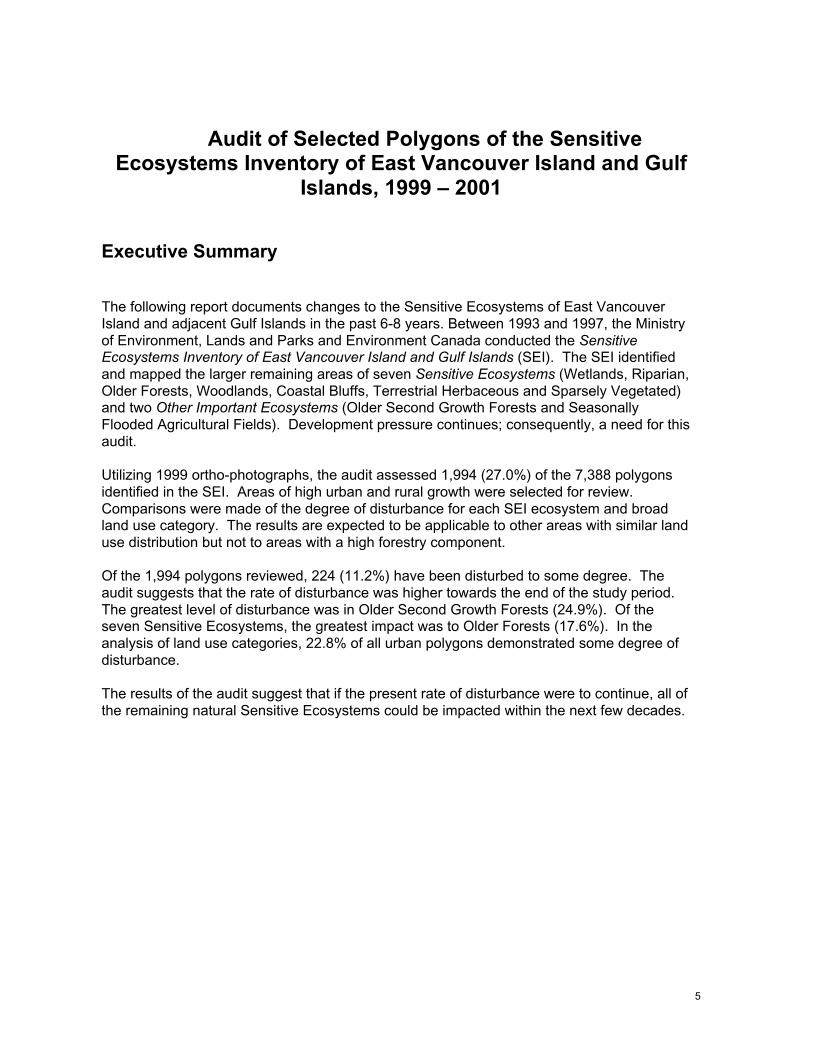
Executive Summary
The following report documents changes to the Sensitive Ecosystems of East VancouverIsland and adjacent Gulf Islands in the past 6-8 years. Between 1993 and 1997, the Ministryof Environment, Lands and Parks and Environment Canada conducted the SensitiveEcosystems Inventory of East Vancouver Island and Gulf Islands (SEI). The SEI identifiedand mapped the larger remaining areas of seven Sensitive Ecosystems (Wetlands, Riparian,Older Forests, Woodlands, Coastal Bluffs, Terrestrial Herbaceous and Sparsely Vegetated)and two Other Important Ecosystems (Older Second Growth Forests and SeasonallyFlooded Agricultural Fields). Development pressure continues; consequently, a need for thisaudit.
Utilizing 1999 ortho-photographs, the audit assessed 1,994 (27.0%) of the 7,388 polygonsidentified in the SEI. Areas of high urban and rural growth were selected for review.Comparisons were made of the degree of disturbance for each SEI ecosystem and broadland use category. The results are expected to be applicable to other areas with similar landuse distribution but not to areas with a high forestry component.
Of the 1,994 polygons reviewed, 224 (11.2%) have been disturbed to some degree. Theaudit suggests that the rate of disturbance was higher towards the end of the study period.The greatest level of disturbance was in Older Second Growth Forests (24.9%). Of theseven Sensitive Ecosystems, the greatest impact was to Older Forests (17.6%). In theanalysis of land use categories, 22.8% of all urban polygons demonstrated some degree ofdisturbance.
The results of the audit suggest that if the present rate of disturbance were to continue, all ofthe remaining natural Sensitive Ecosystems could be impacted within the next few decades.

6
Acknowledgements
The authors would like to acknowledge the regional Geographic Information System (GIS)section for producing the 1:10,000 ortho-photos needed for the study. Bill Hubbard,Sharon Erickson and Diane Elliot, from the former Planning and Assessment Program,Ministry of Water, Land and Air Protection (MWLAP), Vancouver Island Region, assistedwith the field reviews and determination of site disturbance in 1999-2000.
We are very appreciative of the prompt, efficient and supportive help we received from thestaff of local governments and the Islands Trust, in supplying us with maps and informationon land use/zoning.
The following people gave detailed input to our draft reports: Bill Hubbard,Rick Guthrie and Grant Bracher, Environmental Stewardship, MWLAP; Jan Kirkby,Conservation Data Centre, Ministry of Sustainable Resource Management (MSRM); andPeggy Ward, Canadian Wildlife Service, Environment Canada. Others who took the time toprovide comments include Mike Lambert and Carmen Cadrin (MSRM), Judy Davis(MWLAP), Judith Cullington & Associates and Chris Junck (consultants) and Tracey Hooper(biologist).

7
Audit of Selected Polygons of the Sensitive EcosystemsInventory of East Vancouver Island and Gulf Islands,
1999 - 2001
Introduction
The Audit of Selected Polygons of the Sensitive Ecosystems Inventory of East VancouverIsland and the Gulf Islands, 1999-2001 (‘the audit’) was designed to document disturbancesdue to land development to sites identified in the original SEI. Areas showing a high degreeof urban and rural growth were selected for review, as the focus of the study was onchanges to the urban/rural landscape rather than areas whose primary land use is forestry.This report correlated these disturbances to the SEI Ecosystems within broad land usecategories.
Between 1993 and 1997, the Ministry of Environment, Lands and Parks1 and EnvironmentCanada conducted the Sensitive Ecosystems Inventory of East Vancouver Island and GulfIslands (SEI). The SEI identified and mapped the larger remaining areas of rare and/orsensitive ecosystems2 using aerial photographs primarily from1991-1993. Seven SensitiveEcosystems and two Other Important Ecosystems were identified and mapped aspolygons3. The SEI showed that only 7.9% of the study area contained SensitiveEcosystems. The Other Important Ecosystems accounted for another 11.6% of the landbase. See Figure 1 for the study area.
For this report, the nine ecosystem types are collectively referred to as SEI Ecosystems.They are described as follows:
There are seven Sensitive Ecosystems:
Wetland ecosystems (marshes, swamps, fens, bogs, and shallow open water, etc.) existwhere water remains at or near the land surface.
Riparian ecosystems are found beside lakes, streams and rivers, as well as in ravines andgullies, where soil moisture and light conditions support plant communities differentfrom those in the surrounding land and water.
Older Forest ecosystems are coniferous or mixed coniferous/deciduous forests with anaverage tree age of 100 years or more.
Woodland ecosystems are open forested areas composed of pure stands of Garry oak,mixed stands of Douglas-fir/Garry oak, arbutus/Garry oak or arbutus/Douglas-fir,and, rarely, pure stands of trembling aspen.
Coastal Bluff ecosystems include vegetated rocky islets, rocky shorelines, and coastal cliffswith pockets of grasses and wildflowers.
Terrestrial Herbaceous ecosystems are rare natural grasslands and/or moss-covered rockoutcroppings, frequently with scattered shrub.
Sparsely Vegetated ecosystems include sand dunes, sand and gravel spits, and inlandcliffs; all with sparse and/or patchy vegetation due to limiting growing conditions.
1 In 2001 the Ministry of Environment, Lands and Parks was divided into Ministry of Water, Land and Air Protection andMinistry of Sustainable Resources Management2 An ecosystem is a community of plants, animals (including humans) and micro-organisms, interacting with each other andtheir physical environment. An ecosystem can be as small as the spaces between grains of sand on a beach or as large as theentire earth. A sensitive ecosystem is one which is rare and/or fragile.3 A polygon is a series of digitized points joined to form the perimeter of an area (e.g. an ecosystem) on a map.

8
The SEI also mapped two Other Important Ecosystems that make important contributionsto biodiversity:
Older Second Growth Forest ecosystems are large tracts of 60-100 year old coniferousforests which often act as buffers to Sensitive Ecosystems; have the potential tobecome future Older Forests; and provide important wildlife habitat.
Seasonally Flooded Agricultural Fields are former wetlands that provide important habitatfor mammals and wintering birds.
#
#
#
#
#Campbell River
Comox
Nanaimo
Duncan
Victoria
Com
ox
Nanaimo RD
Cowichan Valley RD
Capital RD
Strathcona RD
Powell
River RD
10 0 10 20 Kilometers
N
Locations of Audit map sheetsRegional District boundaries
EI SubunitsCapitalComoxCowichanIslandsNanaimo
French Creek Watershed
Figure 1: SEI Study Area.

9
Method and Limitations
The audit was conducted by superimposing SEI polygons onto 1999 ortho-photographs4.Visual assessments were made to determine whether there was evidence of humandisturbance within the polygons. Comparisons were made as to the degree of disturbancefor each SEI Ecosystem and major land use category.
Site Selection
The areas selected for this audit were chosen from each of the five geographic sub-unitsused in the original SEI project. These sub-units are the lowland Vancouver Island portionsof the Regional District of Comox-Strathcona (Comox Sub-unit), Regional District ofNanaimo (Nanaimo Sub-unit), Cowichan Valley Regional District (Cowichan Sub-unit),Capital Regional District (Capital Sub-unit) and the Gulf Islands (Islands Sub-unit).
Two mapsheets were chosen within each sub-unit from the original 66 covering the entireSEI area (see Appendix A for the list of the mapsheets audited). The focus of the study ison changes to the urban/rural landscape rather than areas where the primary land use isforestry. The criteria used in the selection of map sheets included personal knowledge oflocal development patterns and areas under development pressure, the presence ofsubstantial numbers of SEI polygons, and the absence of large numbers of polygons withinthe Forest Land Reserve.
The project team also conducted a similar assessment of the French Creek watershed in theRegional District of Nanaimo; consequently the polygons from that study were added to thedatabase of the Nanaimo Sub-unit (see Figure 2 and Appendix A).
Table 1 describes the distribution of audited polygons across the study area and comparesthe number audited in each sub-unit to those from the original SEI. Coverage was notevenly distributed between the geographic sub-units and direct comparisons between themare not appropriate.
Table 1: Distribution of Audited Sites Compared to Original Sensitive Ecosystem Inventory.
SEI 1993-1997 2001 AuditSub-unitsNo of sites No of sites % of total
Capital 1404 650 46.3%Cowichan 1284 547 42.6%Nanaimo 1374 419 30.5%Comox 1744 220 12.6%Islands 1582 158 10.0%Total 7388 1994 27.0%
The audit assessed the SEI Ecosystem types in similar proportions to those identified in theoriginal SEI (see Appendix B). Riparian and Woodland Ecosystems had a slightly greaterrepresentation in this audit, while proportionately fewer Coastal Bluff polygons were audited.
Similarly, a proportionate number of SEI polygons which had been originally field checkedwere included. Thirty-one point three percent of the polygons in the original SEI inventory
4 Ortho-photographs are images based on air photos that have been joined together into a continuous large ‘map’ with noapparent seams and which have been adjusted to remove distortions, allowing accurate measurements of distances.

10
were field checked during the 1994 and 1995 field seasons, compared to 31.6% (631) ofthose audited.
Ortho Photography
The first step in the audit was an examination of the appropriate 1:10,000 ortho-photographsupon which the digital version of the SEI had been superimposed. The original 1:20,000 SEImapsheets were used for comparison and orientation.
As the available ortho-photos did not cover the whole of the Islands Sub-unit but only thoseislands closest to the eastern coast of Vancouver Island, limited coverage of this sub-unitwas achieved using portions of Denman, Hornby, Salt Spring and Gabriola islands.
The ortho-photography on which the audit was based was flown in July and August of 1999.Most of the aerial photographs used for the original SEI inventory were taken between 1991and 1993, with some earlier coverage. Thus the results of the audit reflect changes overtime spans ranging primarily from 6 to 8 years.
Disturbance Categories
For this audit, the assessed polygons were designated as follows:
Undisturbed polygons exhibited no obvious human disturbance on the ortho-photographs.Disturbed polygons showed clear signs of disturbance through changes to the vegetation
pattern, but remained substantially intact.Severely Disturbed/Degraded polygons showed the original ecosystem either totally
eliminated or having an undisturbed remnant less than or equal to 50% of the originalarea.
There is a continuum of degree of disturbance between the Disturbed and SeverelyDisturbed/Degraded categories, varying from a minor encroachment along one edge to thetotal removal of the natural vegetation. The authors felt that any disturbance within oradjacent to an SEI Ecosystem could affect the ecological integrity of the remainder.Hence much of the data were analyzed without distinguishing between the two ‘Disturbed’categories. The term Modified was used when the data were analyzed combining allDisturbed and Severely Disturbed/Degraded polygons. Although there may be impacts tothe ecosystems mapped in the SEI due to disturbance adjacent to the SEI polygons (see‘Buffers’), this Audit only assessed impacts that were visible within a polygon.
Where disturbance to a polygon was suspected but was not clear on the ortho-photograph,the site was assessed in the field or discussed with MWLAP personnel familiar with the area.Fifty-five of the 1,994 SEI polygons audited were verified through field inspections in 2000-2001. Field inspections allowed for a more accurate determination of change in thepolygons than review of the ortho-photographs alone. Some of the polygons were notaccessible due to their location or could not be visited due to time limitations. SEI polygonsof uncertain status that could not be assessed were not included in the study.

11
Plate 2: Older Forest Polygons N1415A and N1415B on the 1999 ortho-photo used in theaudit. The red line shows the polygon boundaries. The white lines are access roads.N1415B is an example of a Severely Disturbed/Degraded polygon while N1415A isUndisturbed.
Land Use Categories
Land use categories for each polygon were determined using information from localgovernments including zoning maps and Official Community Plans, as well as from theactivities identified on the ortho-photographs. Where the local governments’ map scalesdiffered from those used in this project, identification of land use was accomplished throughvisual comparison of the land use maps with the SEI mapsheets and/or ortho-photographs.
Where two or more land uses occurred within a SEI polygon, the one that was visuallyassessed as covering the greatest area was used for the analysis. If the polygon wasapproximately equally split between two categories, the more intensive use was recorded -for instance, rural over greenspace.
The land use categories selected for the audit were:
Federal - all Crown-owned (federal) lands except parks. This included Indian Reservationsand lands leased for institutional purposes.
Forestry - all properties identified as being within the Forest Land Reserve (FLR) and/orhaving forestry-related land use or zoning.
Greenspace - all parks (federal, provincial and local), large patches of land in privateownership with ‘non development’ or future park designations, ‘green’ recreationalareas such as golf courses, and coastal marine non-development zones.
Rural - all Agricultural Land Reserve (ALR) lands used for agriculture and non-forestry landswhere the minimum parcel size allowed through zoning was 2 hectares.

12
Urban - this category included all commercial and industrial sites as well as all propertieswith a land use designation that allowed parcel sizes under 2 hectares.
Vancouver Island Highway Project (VIHP) - all lands affected by the VIHP includingsecondary developments such as the connector road to the Duke Point/Tsawwassenferry terminal.
Figure 2: Land Use Distribution of Audited Polygons by Number of Polygons.
There was difficulty in distinguishing between the land use status of certain rural and forestrypolygons, due to overlap in land use/zoning designations and the use of some AgriculturalLand Reserve lands for forestry purposes. In these cases, the interpretation of land use wasbased on Forest Land Reserve maps, adjacent land uses and the land activities observedon the ortho-photos.
Database
Information relating to each SEI polygon audited was entered into a database.Data recorded included the following information from the original SEI database: polygonID #, mapsheet number, dominant and secondary SEI Ecosystem classifications andwhether the polygon had been field checked or field verified as part of the original SEI study.For this project, disturbance and land use categories were also entered.
Although secondary ecosystem5 types were recorded in the database, this information wasonly used to assist in determining if a polygon had been Modified. The audit only analyzedthe dominant ecosystem classification.
Analysis for this report was done using the SEI Ecosystems6 and the land use categories.
Limitations
The focus of the selection process for mapsheets used in this audit was on areas ofincreasing population growth and non-forestry related land development rather than onareas where the primary land use is forestry. No attempt was made to ensure randomsampling or uniformity of sample sizes. Hence comparisons between geographic sub-unitsor of the SEI Ecosystems within those sub-units are not statistically valid. For this reason,the data were not analyzed by sub-unit for this report. 5 Secondary ecosystems are SEI Ecosystems that are present in patches covering up to 50% of a polygon but which couldnot be mapped separately. A dominant ecosystem is the ecosystem occupying the greater area within a polygon thatcontains more than one ecosystem type.6 The 7 Sensitive Ecosystems and 2 Other Important Ecosystems are referred to as SEI Ecosystems when discussedcollectively in this project.

13
The results are expected to be representative of the impacts of development in urban andrural landscapes but should not be applied to areas with primarily forestry use.
Some local governments combined forestry and agriculture into a single resource usecategory. This created difficulty in classifying some rural and forestry polygons, however,the level of error is not expected to be significant
As field inspections, both for the original SEI and for this project, were carried out only oneasily accessible polygons, there was some bias due to access limitations. However, fewerthan a dozen polygons were deleted from the audit’s database due to uncertainty regardingtheir classification and access limitations.
Much of the analysis in the original Sensitive Ecosystems Inventory was based on the sizeof the polygons and of the entire study area. The authors were unable to measure the areaimpacted within each Disturbed and Severely Disturbed/Degraded polygon due to timeconstraints, resources and the map scale available to carry out this project. Hence this auditdoes not emphasize the same criteria as the original Sensitive Ecosystems Inventory,focusing instead on the numbers of polygons.
Results and Discussion
Of a total of 1,994 polygons reviewed, 224 were disturbed to some degree. The greatestlevel of disturbance in the SEI Ecosystems was to Older Second Growth Forests (24.9%).Of the seven Sensitive Ecosystems, the greatest impact was to Older Forests (17.6%). Inthe analysis of land use categories, 22.8% of all urban polygons demonstrated some degreeof disturbance (see Table 2).
Overall, 1.3% of the 1,994 polygons audited were classified as Severely Disturbed/Degradedand another 9.9% Disturbed. Thus, 11.2% of the sites had been Modified since the originalSEI was carried out, an average of 1.6% per annum. When only the seven SensitiveEcosystems were considered, these figures became 1.1% Severely Disturbed/Degraded,8.7% Disturbed, and 9.8% Modified, for an average of 1.4% per annum.
Of the 631 polygons that were field checked during the original SEI and subsequentlyreviewed in this audit, 77 (12.2%) were Modified. As the boundaries of these polygons wereconfirmed in 1994 (when the majority of the SEI polygons were field checked), this figureequated to an average annual loss of 2.4% in the five years ending in 1999 (when the ortho-photos used in this audit were taken). This suggests that the rate of Modification was higherin the late 1990’s than earlier in the decade.
The results of the audit suggest that if the present rate of disturbance were to continue, all ofthe remaining Sensitive Ecosystems could be impacted within the next few decades.

14
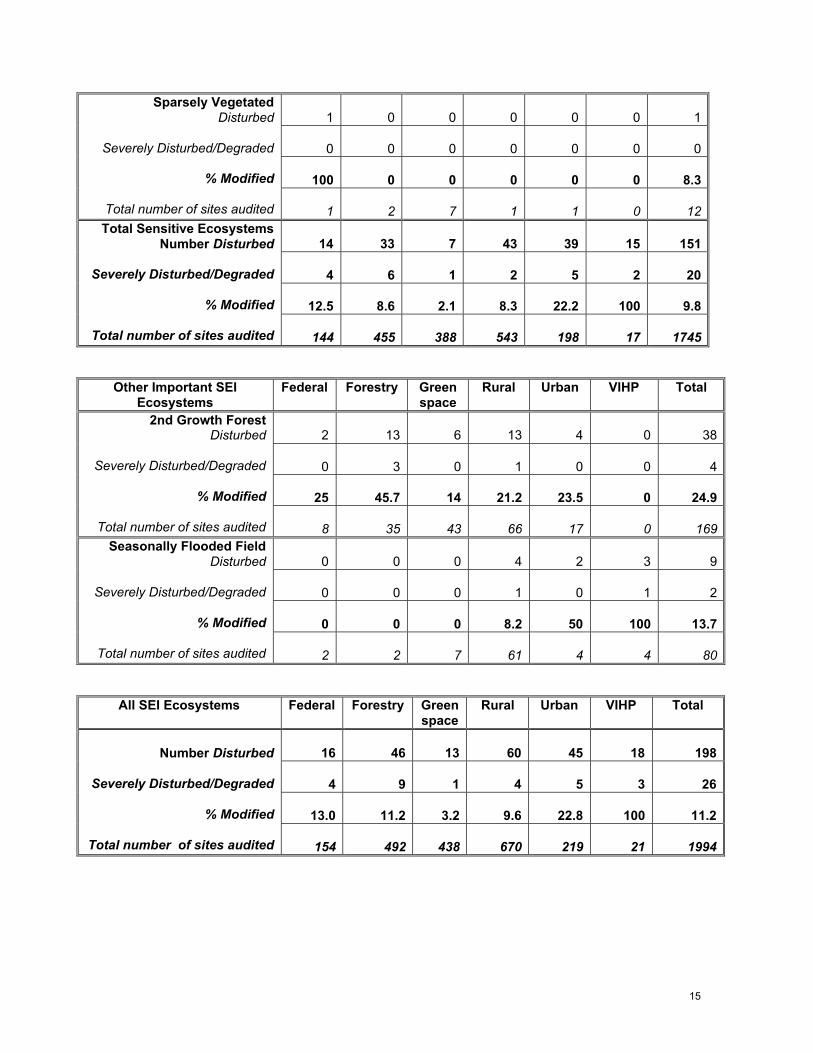
Table 2: Level of Disturbance, by SEI Ecosystem and Land Use.
Sensitive Ecosystem Federal Forestry Greenspace
Rural Urban VIHP Total
1 9 1 11 16 6 44
1 2 0 1 3 1 8
8.7 5.1 0.8 5.7 22.5 100 7.8
WetlandDisturbed
Severely Disturbed/Degraded
% Modified
Total number of sites audited 23 215 121 212 85 7 663
4 7 0 12 6 4 33
1 0 0 0 0 1 2
8.8 14.6 0 7.7 18.2 100 10.2
RiparianDisturbed
Severely Disturbed/Degraded
% Modified
Total number of sites audited 57 48 44 155 33 5 342
4 6 1 3 4 1 19
2 0 0 1 0 0 3
37.5 5.2 1 7.4 15.4 100 7.1
Terrestrial HerbaceousDisturbed
Severely Disturbed/Degraded
% Modified
Total number of sites audited 16 116 97 54 26 1 310
0 11 3 4 2 2 22
0 4 0 0 0 0 4
0 26.8 6.5 13.8 50 100 17.6
Older ForestDisturbed
Severely Disturbed/Degraded
% Modified
Total number of sites audited 11 56 46 29 4 2 148
2 0 2 13 8 2 27
0 0 1 0 1 0 2
6.9 0 5.2 16.9 25 100 13.6
WoodlandDisturbed
Severely Disturbed/Degraded
% Modified
Total number of sites audited 29 11 58 77 36 2 213
2 0 0 0 3 0 5
0 0 0 0 1 0 1
28.6 0 0 0 30.8 0 10.5
Coastal BluffDisturbed
Severely Disturbed/Degraded
% Modified
Total number of sites audited 7 7 15 15 13 0 57
15
1 0 0 0 0 0 1
0 0 0 0 0 0 0
100 0 0 0 0 0 8.3
Sparsely VegetatedDisturbed
Severely Disturbed/Degraded
% Modified
Total number of sites audited 1 2 7 1 1 0 12
14 33 7 43 39 15 151
4 6 1 2 5 2 20
12.5 8.6 2.1 8.3 22.2 100 9.8
Total Sensitive Ecosystems Number Disturbed
Severely Disturbed/Degraded
% Modified
Total number of sites audited 144 455 388 543 198 17 1745
Other Important SEIEcosystems
Federal Forestry Greenspace
Rural Urban VIHP Total
2 13 6 13 4 0 38
0 3 0 1 0 0 4
25 45.7 14 21.2 23.5 0 24.9
2nd Growth ForestDisturbed
Severely Disturbed/Degraded
% Modified
Total number of sites audited 8 35 43 66 17 0 169
0 0 0 4 2 3 9
0 0 0 1 0 1 2
0 0 0 8.2 50 100 13.7
Seasonally Flooded FieldDisturbed
Severely Disturbed/Degraded
% Modified
Total number of sites audited 2 2 7 61 4 4 80
All SEI Ecosystems Federal Forestry Greenspace
Rural Urban VIHP Total
16 46 13 60 45 18 198
4 9 1 4 5 3 26
13.0 11.2 3.2 9.6 22.8 100 11.2
Number Disturbed
Severely Disturbed/Degraded
% Modified
Total number of sites audited 154 492 438 670 219 21 1994

16
Rate of Modification by Ecosystem Type
Figure 3 shows the percentage of Modification for each SEI Ecosystem type. Of theSensitive Ecosystems, the greatest impact occurred in the Older Forest polygons, followedby Woodlands. Of the Other Important Ecosystems, almost one quarter of the Older SecondGrowth Forest polygons showed some level of disturbance.
Figure 3: Percentage of Modified Polygons within each SEI Ecosystem Type.
Although only 7.8% of the wetlands audited showed disturbance, their Modification is ofconcern due to the relative rarity of wetlands in the study area (1.7% of the land base).
The tendency of people to build their homes close to water is affecting both Riparian andCoastal Bluff ecosystems. ‘Viewscapes’ are created by clearing the trees, and the naturalcontours are modified to provide all-weather water accesses and/or to stop natural erosion.Again, native vegetation is replaced by cultivated varieties.
The high level (17.6%) of disturbance of Older Forest ecosystems leads to concerns thatmost of the remaining sites except those in parks could be lost in the next few decades. TheNanaimo Lowlands supports species of birds such as Pileated Woodpecker, MarbledMurrelet and Northern Goshawk that require large patches of Older Forest for their survival –these birds will become rarer as their habitat diminishes.
Although there has been a lot of increased focus by the public regarding the uniqueness ofGarry oak trees, public awareness has not yet expanded to recognize that the other naturalvegetation of Woodland and Terrestrial Herbaceous ecosystems is also of conservationconcern. There have been many recent cases of houses being constructed in Woodlands oron Terrestrial Herbaceous rocky outcroppings – preserving most of the trees but exchangingthe natural undergrowth for lawns and other cultivated plants.

17
Sparsely Vegetated ecosystems are of particular concern due to their rarity (1.2% of theoriginal SEI polygons; less than 0.1% of the land base) and their vulnerability to disturbance.In this audit, an additional 8.3% has been Modified. Much of the vegetation is so fragile thateven walking over it may destroy it, yet sand dunes and spits are attractive for picnickingand off-road vehicle recreation.
As mentioned previously, although Older Second Growth Forest and Seasonally FloodedAgricultural Field ecosystems were included in this audit, they were mapped in the originalSEI for their general biodiversity values rather than as rare and/or sensitive ecosystems.The protection and management of Older Second Growth Forest ecosystems needs to beconsidered from the broader landscape management scale with less emphasis on theprotection or loss of specific units. However, if the current rate of Modification continues, allOlder Second Growth polygons could be affected within the next three decades. Many ofthe Modified Older Second Growth polygons are logging patches on parcels of federal landwhich are exempt from local government regulations.
Seasonally Flooded Agricultural Fields have high wildlife values, especially for over winteringwaterfowl. The Modification of these polygons by changing agricultural practices and byencroaching urban development will result in the loss of waterfowl feeding areas and extrastress for the many species which breed in remote and unpopulated areas. This has globalimplications because Canada has a role in maintaining the Pacific Flyway, an importantmigratory bird route.
Plates 1 - 8 show Modified SEI Ecosystem polygons which were reviewed in this study.
Plate 3: Polygon N0342C - This Coastal Bluff ecosystem has been SeverelyDisturbed/Degraded by urban development.

18
Rate of Modification by Land Use and Ecosystem Type
Table 2 shows the actual numbers and percentage of Modification of the various ecosystemtypes, by land use. Other than the VIHP, a special case, urban polygons had the highestpercentage of impact in all Sensitive Ecosystems except Terrestrial Herbaceous andSparsely Vegetated. Wetland and Terrestrial Herbaceous Ecosystems were impacted in allland use categories.
Figure 4 shows the percentage of Modified polygons within each land use category. Theurban land use was the highest overall (except for the VIHP) and Greenspace showed thelowest level of disturbance.
Figure 4: Percentage of Modified Polygons by Land Use Category.
Federal Land Use
Polygons designated as federal land use showed a high rate of Modification of SparselyVegetated, Coastal Bluff, Terrestrial Herbaceous and Older Second Growth Ecosystems,although the Sparsely Vegetated figure is based on a single site. Many federal governmentestablishments are located along the foreshore and on adjacent uplands. Hence anyexpansion would be likely to impact Coastal Bluffs and Terrestrial Herbaceous sites.
Forestry Land Use
Understandably, lands designated for forestry land use showed a high level of disturbanceon Older Second Growth, Older Forest, and Riparian Ecosystems. There were alsodisturbances on Wetlands and Terrestrial Herbaceous ecosystems, often from thedevelopment of accesses into adjacent forested areas.

19
Plate 4: Polygon S1185B - This Sparsely Vegetated ecosystem has been SeverelyDisturbed/Degraded by access road development and expansion of a federal facility.
Greenspace Land Use
Greenspace land use showed the least impact overall, although many Older SecondGrowth, Older Forest and Woodland polygons showed encroachment –often for thedevelopment of new trails and tourist facilities.
Rural Land Use
The highest level of impact in those areas designated as rural land use occurred in OlderSecond Growth ecosystems (and third highest in Older Forest ecosystems), partly due toclearing for activities such as farming, and/or logging for property income. Many of theModified Woodlands showed residences within the polygons.
Urban Land Use
Excluding the Vancouver Island Highway Project (VIHP), the urban land use categorydemonstrated the greatest level of disturbance in 6 of the 9 SEI Ecosystem types(see Table 2). This is an indication of the impact of urban land development andemphasizes the need for effective protection through local government bylaws, conservationcovenants and other mechanisms.7
Vancouver Island Highway Project
The VIHP must be considered from a different perspective than the other land uses.Because it was a major construction project, any SEI polygon within the road developmentcorridor would likely have been affected. However, because of their location, some SEI
7 For a detailed discussion on Sensitive Ecosystem protection mechanisms, refer to the “Sensitive Ecosystems Inventory: EastVancouver Island and Gulf Islands 1993-1997 Volume 2:Conservation Manual”
20
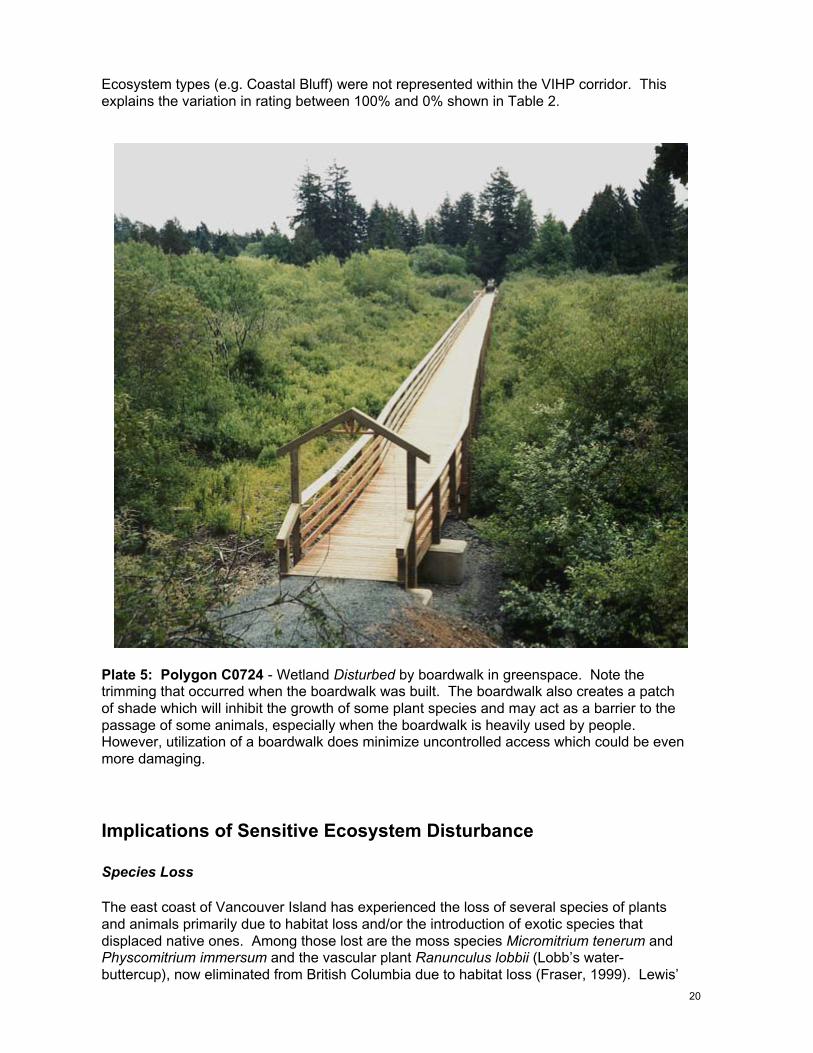
Ecosystem types (e.g. Coastal Bluff) were not represented within the VIHP corridor. Thisexplains the variation in rating between 100% and 0% shown in Table 2.
Plate 5: Polygon C0724 - Wetland Disturbed by boardwalk in greenspace. Note thetrimming that occurred when the boardwalk was built. The boardwalk also creates a patchof shade which will inhibit the growth of some plant species and may act as a barrier to thepassage of some animals, especially when the boardwalk is heavily used by people.However, utilization of a boardwalk does minimize uncontrolled access which could be evenmore damaging.
Implications of Sensitive Ecosystem Disturbance
Species Loss
The east coast of Vancouver Island has experienced the loss of several species of plantsand animals primarily due to habitat loss and/or the introduction of exotic species thatdisplaced native ones. Among those lost are the moss species Micromitrium tenerum andPhyscomitrium immersum and the vascular plant Ranunculus lobbii (Lobb’s water-buttercup), now eliminated from British Columbia due to habitat loss (Fraser, 1999). Lewis’

21
Woodpecker, Streaked Horned Lark, Western Meadowlark and Roosevelt Elk are no longerfound in Garry Oak Woodlands, although they are still present in other habitats around theprovince. The local subspecies of Gopher Snake is also gone. The Island Marble and thePerdiccas Checkerspot, butterfly species known in British Columbia only from southeastVancouver Island and/or the Gulf Islands, have also disappeared, due to the displacement oftheir native food plants by introduced species (Fraser, 1999).
Plate 6: Polygon C0667 - This Terrestrial Herbaceous Ecosystem has been SeverelyDisturbed/Degraded by the Vancouver Island Highway Project and a large commercialdevelopment (urban land use - background).
Impacts of Ecosystem Modification
The Sensitive Ecosystems Inventory showed that most of the original landscape was alreadymodified. This audit documents the continued Modification as development expands into theremaining habitats. As discussed above, these ecosystems provide living space for manyorganisms that are rare or threatened and which cannot survive in Modified environments.Encroachment, whether the development of housing in one corner or a trail through thecentre of a polygon, reduces the size of the undisturbed portion and may result in the loss ofother species which no longer have the space needed to survive.
Wetlands in particular are vulnerable to disturbance. They are important as naturalbiological filters, and may serve to moderate some of the changes to the hydrological cyclecaused by increased development. However, in the process of being used as filters,wetlands themselves are altered. There is also a tendency to view wetlands as being inneed of ‘improvement’ to create something more ‘useful’ – such as dredging to create pondsor draining for agricultural production.

22
Plate 7: Polygon C0391 - Woodlands in Rural settings are attractive as house sites.
Buffers
Although not documented in this audit, development has taken place to the edge of many ofthe Modified and Undisturbed polygons. Buffers are important to protect SEI Ecosystemsfrom surrounding land uses. The loss of the physical vegetated cover, for example, arounda wetland has a long-term impact on the plant species and water levels therein. Factorsinvolved may include the change in hydrology associated with removal of the trees,increased solar radiation over the wetland and correspondingly warmer water, changes innutrient input and increased sediment erosion into the wetland, and changes in stormwatersurface flows due to roads and landscaping.
Similar impacts may occur to other ecosystems when their buffers are removed. Buffersalso help limit the invasion of non-native species into an ecosystem.
Other changes which occur adjacent to Sensitive Ecosystems, such as the diversion ofstorm flows which naturally flowed through a site, can significantly affect the nativevegetation and wildlife which live there.

23
Plate 8: Polygon C0848 - Urban development is encroaching into this TerrestrialHerbaceous ecosystem. Impacts include the physical presence of the residences and theuse of the fragile moss/grass area as an expanded ‘backyard’.
Landscape Fragmentation and Connectivity
Landscape fragmentation reduces the amount of land available to support functioningecosystems and limits the ability of species to move between or colonize into availablehabitat. Fragmentation also increases edge effects and makes ecosystems moresusceptible to the introduction of non-native invasive species such as Scotch Broom, EnglishIvy, American Bullfrogs and Gray Squirrels. Such species are a threat to the integrity ofnative ecosystems. They may out-compete native plants and animals by growing faster andshading them out; by eating all of the available food supply; or even by eating the nativespecies. In the already fragmented landscape of eastern Vancouver Island, connectivitybetween SEI Ecosystems allows for the dispersal of both plant and animal species andreduces the impact of habitat fragmentation.
Potential impacts of the ongoing destruction or disturbance of Sensitive Ecosystems are notjust biological. There are economic implications including the loss of stormwater buffering,ecological benefits (clean air, clean water, productive soil, pollution dilution), aestheticbenefits including enjoyment of greenspace and biodiversity, and higher potential propertyvalues adjacent to natural ecosystems.
For more information on these ecosystems, their value and the implications of their losses,please refer to the SEI Conservation Manual (McPhee, 2000).

24
Conclusions
This audit was designed to assess and document the disturbances and/or losses that haveoccurred to SEI Ecosystems through urban/rural land development since the original SEI.There is a significant Modification of SEI Ecosystems associated with increased landdevelopment on eastern Vancouver Island. More than one in nine SEI polygons showedsome measure of disturbance in a period of six to eight years. If the present rate ofdisturbance continues, all of the remaining natural Sensitive Ecosystems could be impactedwithin the next few decades.
Of the total 1,994 polygons reviewed, 224 showed some level of disturbance. The greatestlevel of disturbance in the SEI Ecosystems was to Older Second Growth Forests (24.9%). Ofthe seven Sensitive Ecosystems, the greatest impact was to Older Forests (17.6%). In theanalysis of land use categories, 22.8% of all urban polygons demonstrated some degree ofdisturbance.
Because so much of the landscape on the east coast of Vancouver Island has beenhistorically altered, conservation of these remnant natural ecosystems is critically importantto maintain native plants, animals, and plant communities. The mechanisms foraccomplishing this goal are vested in local government tools and stewardship initiativeoptions.
There is an ongoing need for further audits of the Sensitive Ecosystems on East VancouverIsland and the Gulf Islands, ideally covering the entire study area and looking at the actualland area Modified and its implications. Future work could also focus on how effective thecurrent habitat protection mechanisms are.
Sound conservation-based land use planning that reflects an understanding of ecosystemprocesses will ensure that natural ecosystems remain intact, and that the needs of futuregenerations of both human and non-human organisms are not compromised.
25
References
Fraser, D.F. 1999. Going, Gone and Missing in Action: The Extinct, Extirpated, and HistoricWildlife of British Columbia. In At Risk: Proceedings of a Conference on the Biology andManagement of Species and Habitats at Risk. Edited by L. Darling, Victoria, B.C. Queen’sPrinter for British Columbia.
McPhee, M., Ward, P., Kirkby, J., Wolfe, L., Page, N., Dunster, K., Dawe, N.K. and Nykwist,I. 2000. Sensitive Ecosystems Inventory: East Vancouver Island and Gulf Islands, 1993-1997. Volume 2: Conservation Manual. Technical Report Series No. 345, Canadian WildlifeService, Pacific and Yukon Region, British Columbia
Ward, P., Radcliffe, G., Kirkby, J., Illingworth, J. and Cadrin, C. 1998. Sensitive EcosystemsInventory: East Vancouver Island and Gulf Islands, 1993-1997. Volume 1: Methodology,Ecological Descriptions and Results. Technical Report Series No. 320, Canadian WildlifeService, Pacific and Yukon Region, British Columbia
Information on the SEI and Volumes 1 and 2 above is available at:http://srmwww.gov.bc.ca/cdc/sei
Wilson, E.O. 1992. The Diversity of Life. Cambridge: Belknap Press.
Ministry of Environment, Lands and Parks, Planning and Assessment – Vancouver IslandRegion. March 2001. Environmental Objectives, Best Management Practices andRequirements for Land Development
This document is available through the regional MWLAP website at:http://wlapwww.gov.bc.ca/vir

26
APPENDIX A: Mapsheets Audited
92B 043 1,2,3,& 492B 053 1,2,3,& 492B 071 3 & 492B 072 1,2,3 & 492B 073 1 & 392B 083 192F 028 4*
92F 030 1,2,& 392F 038 2*92F 039 1*92F 057 192F 066 1,2,& 392F 075 1,2,3,& 492G 011 1,2,3,& 4
* Only those polygons within the French Creek watershed were assessed.

27
APPENDIX B: Numbers of Polygons of each SEI Ecosystem Type Audited,compared to Original SEI Data
SEI ECOSYSTEM ORIGINAL SEI DATA 2001 AUDIT# of Polygons Percentage # of Polygons Percentage
Wetland 2645 35.8 663 33.2Riparian 960 13.0 342 17.2Terrestrial Herbaceous 1135 15.4 310 15.5Older Forest 470 6.3 148 7.4Woodland 613 8.3 213 10.7Coastal Bluff 591 8.0 57 2.9Sparsely Vegetated 86 1.2 12 0.6Older 2nd Growth Forest 614 8.3 169 8.5Seasonally Flooded Field 274 3.7 80 4.0TOTAL 7388 100 1994 100