audit quality and the trade-off between accretive stock repurchases and accrual-based earnings...
DESCRIPTION
Audit Quality and the Trade-Off Between Accretive Stock Repurchases and Accrual-Based Earnings ManagementTRANSCRIPT

THE ACCOUNTING REVIEW American Accounting AssociationVol. 87, No. 6 DOI: 10.2308/accr-502302012pp. 1861–1884
Audit Quality and the Trade-Off betweenAccretive Stock Repurchases and
Accrual-Based Earnings ManagementBrian M. BurnettIndiana University
Bradrick M. CripeNorthern Illinois University
Gregory W. MartinIndiana University
Brian P. McAllisterUniversity of Colorado Colorado Springs
ABSTRACT: We examine whether audit quality affects the trade-off between accrual-based and real earnings management. We hypothesize that firms motivated to manageearnings per share (EPS) to meet or beat consensus analysts’ forecasts are more likelyto engage in accretive stock repurchases (a form of real earnings management) whentheir ability to manage earnings through accruals is constrained by high audit quality. Wefind that firms with high audit quality are more likely to use accretive stock repurchasesand less likely to use accrual-based earnings management to meet or beat consensusanalysts’ forecasts. Our results are robust to various controls for endogeneity concerns.
Keywords: real earnings management; stock repurchases; audit quality; audit industryspecialization.
I. INTRODUCTION
We examine whether audit quality affects managers’ choices between accrual-based
earnings management and accretive stock repurchases,1 one form of real earnings
management. We focus on accretive stock repurchases where managers’ motivations
We thank Bjorn Jorgensen, Steve Rock, Katherine Gunny, Arthur Allen, Dechun Wang, Brad Lail, Tammy Waymire,participants in presentations at Indiana University Indianapolis and Baylor University, and the editor and two anonymousreviewers from The Accounting Review for their helpful comments.
Editor’s note: Accepted by John Harry Evans III, with thanks to Steven Kachelmeier for serving as editor on a previous version.
Submitted: May 2010Accepted: June 2012
Published Online: June 2012
1 Stock repurchases affect both the numerator and denominator of reported EPS. Opportunity costs (in terms offorgone potential profit) associated with the cash used to fund stock repurchases affect the numerator and thetiming and amount of stock repurchases affect the number of shares in the denominator. Stock repurchases aredefined as accretive when the numerator and denominator effects of a repurchase jointly increase reported EPS byat least $0.01.
1861

are to meet or beat earnings per share (EPS) targets rather than to execute normal financing
activities. While prior research provides evidence that high audit quality is negatively associated
with managers’ ability to opportunistically report accruals (Krishnan 2003; Balsam et al. 2003), our
paper examines whether managers constrained in their use of accrual-based earnings management
are more likely to use open-market stock repurchases as a substitute. Similar to accrual-based
earnings management, open-market stock repurchases affect EPS, involve managerial discretion,
and lack adequate disclosure prior to their execution. However, unlike accrual-based earnings
management, stock repurchases are not subject to auditor scrutiny since they involve decisions
about a real financing activity. Given the difference in auditor scrutiny, we argue that in the presence
of high audit quality, managers trade off the use of accrual-based earnings management and are
more likely to use accretive stock repurchases to meet or beat consensus analysts’ EPS forecasts.
Our study brings together and extends two research streams. First, Hribar et al. (2006) examines
open-market stock repurchases and provides evidence that firms use accretive stock repurchases to
meet or beat analysts’ forecasts. We extend their paper by examining whether accretive stock
repurchases are more frequently used when accrual-based earnings management is likely constrained
by the presence of high audit quality. Second, prior research (Cohen and Zarowin 2010; Chi et al.
2011; Zang 2012) examines the trade-off between operational real earnings management activities
(i.e., cash flow from operations, production costs, and discretionary expenses) and accrual-based
earnings management for firms employing high-quality auditors. Evidence from these studies is
mixed. These studies document a trade-off for seasoned equity offering (SEO) firms (Cohen and
Zarowin 2010) and for firms sharing strong incentives to manage earnings upward (Chi et al. 2011),
while Zang (2012) fails to document a trade-off around earnings benchmarks. We extend these
studies by presenting evidence of a trade-off using a financing activity, open-market stock
repurchases, as the form of real earnings management focused on meeting or beating analysts’
forecasts. Examining accretive stock repurchases is advantageous because they are not subject to
potential misspecifications present in measures of operational real earnings management that rely on
fitted models (Cohen et al. 2011). In addition, our use of both industry auditor specialization and
propensity score matching addresses concerns raised by Lawrence et al. (2011) that other firm
characteristics, such as client size, subsume Big N as an appropriate measure of audit quality.
We examine firms that meet or beat consensus analysts’ forecasts ex post to determine whether
firms employing industry-specialist auditors (Hogan and Jeter 1999; Krishnan 2003; Gul et al.
2009) are more likely to use repurchases to meet or beat analysts’ forecasts as compared to other
firms who are able to do so absent an accretive stock repurchase. We similarly test whether firms
with industry-specialist auditors are less likely to use discretionary current accruals to meet or beat
analysts’ forecasts as compared to firms that are able to do so absent the use of discretionary current
accruals. We also directly compare firms that likely share a common ex ante expectation of missing
consensus analysts’ forecasts, but ex post meet or beat consensus analysts’ forecasts either through
accretive stock repurchases or discretionary current accruals. Our findings provide consistent
evidence that firms that both engage industry-specialist auditors and meet or beat analysts’ forecasts
are more likely to use accretive stock repurchases and less likely to use discretionary current
accruals to meet or beat analysts’ forecasts ex post.Our contribution of documenting a trade-off between real earnings management and
accrual-based earnings management to meet or beat consensus analysts’ forecasts not only extends
prior accounting research, but also has implications in corporate governance. As boards of directors
and investors rely on high audit quality to curtail accrual-based earnings management, they should be
aware that managers may substitute accretive stock repurchases to meet or beat EPS forecasts. If a
higher frequency of stock repurchases motivated by earnings management incentives potentially
obfuscates earnings quality or harms long-term firm value, then alternative governance mechanisms
may be necessary to curtail this behavior. We discuss these implications in the conclusion of the paper.
1862 Burnett, Cripe, Martin, and McAllister
The Accounting ReviewNovember 2012

In addition to our main tests, we perform several additional tests to address potential concerns
with our results. We provide evidence that our results are robust when we explicitly control for
expected repurchases in our models, alleviating concerns that analysts and investors fully anticipate
share repurchases. Additionally, we examine whether our results are driven by observable
differences in firm characteristics and/or misspecification in regression analysis. Our results remain
robust when we use propensity score matching on auditor industry specialization to more directly
control for firm characteristics that could spuriously drive our main results. We also provide
evidence that earnings management incentives around analysts’ forecasts are an important
component of our findings. Finally, our results are robust for the first three quarters of the fiscal
year, which indicates that results in the fourth quarter, when auditor oversight is more stringent, do
not drive our main results.
The remainder of the paper is as follows. Section II discusses the prior literature and develops
our hypotheses. Sections III and IV present the research methodology and the results of the paper,
respectively. Section V reports the sensitivity analyses. Section VI discusses the implications of our
findings and concludes the paper.
II. PRIOR LITERATURE AND HYPOTHESES
Earnings Benchmarks and Stock Repurchases
Analyst forecasted EPS is commonly used as a performance benchmark in capital markets. Firms
that consistently meet or beat analysts’ EPS forecasts enjoy higher credibility (Graham et al. 2005)
and valuation premiums (Kasznik and McNichols 2002; Brown and Caylor 2005) that persist even if
EPS is knowingly managed (Bartov et al. 2002). When EPS benchmarks are missed, firms suffer
severe stock price losses (Skinner and Sloan 2002), managerial compensation declines (Matsunaga
and Park 2001), and managers perceive that their reputations are at risk (Graham et al. 2005).
Managers engaging in earnings management select from two broad categories of mechanisms.
Accrual-based earnings management occurs when managers choose purposefully to influence
earnings through accounting choices and estimates (Healy and Wahlen 1999). Real earnings
management involves managerial decisions affecting both cash flows and reported earnings, such as
R&D expenditures, capital investment decisions, and stock repurchases. Real earnings management
is a departure from normal business activities that focuses more on short-term reporting goals than
on promoting firm value (Roychowdhury 2006). Both methods of earnings management are
questionable because they are actions managers take to mislead stakeholders about firm
performance or influence accounting-based contractual arrangements (Healy and Wahlen 1999).2
Bartov (1993) and DeFond and Jiambalvo (1994) find that managers use accruals when faced
with the prospect of just missing analysts’ forecasted EPS. Payne and Robb (2000) show that
managers use accruals to manipulate EPS to meet or beat analysts’ forecasts when forecast
dispersion is low and Burgstahler and Eames (2006) document that managers meet or beat EPS
forecasts through both accrual-based earnings management and expectations management. In
addition, Ayers et al. (2006) find that efforts to meet EPS targets through accruals extend to pseudo
targets that may, in part, relate to analysts’ forecasts. Barton and Simko (2002) suggest that
aggressive accrual-based earnings management is constrained by the cumulative nature of accruals,
suggesting that managers may turn to other earnings management tools when those limits are
reached. In contrast, Beaver et al. (2007) argues that the asymmetric nature of income taxes and
2 Managerial choices between accrual-based and real earnings management is not assumed to be an ‘‘either/or’’decision. Instead, we expect that in the face of higher audit quality, managers may still misreport accruals, but at areduced rate. In lieu of this, managers may increase their use of real earnings management techniques.
Audit Quality, Accretive Stock Repurchases, and Accrual-Based Earnings Management 1863
The Accounting ReviewNovember 2012

special items may drive the distribution of earnings near earnings benchmarks rather than earnings
management incentives. Consistent with this finding, Dechow et al. (2003) find that small-profit-
and-loss firms have similar proportions of both total and positive discretionary accruals and fail to
document an association between accrual-based earnings management and meeting or beating
analysts’ forecasts. Overall, prior research provides general, but not unqualified support for
managers’ use of accrual-based earnings management to meet or beat earnings benchmarks.
A few studies examine real earnings management to meet or beat EPS targets. Roychowdhury
(2006) finds a positive association between real earnings management and meeting or beating
analysts’ forecasted EPS. With respect to accretive stock repurchases as a real earnings
management tool, Hribar et al. (2006) find that accretive stock repurchases occur more frequently
when firms are faced with an EPS shortfall and show that negative stock price responses are
tempered in the presence of accretive stock repurchases. In addition, Bens et al. (2003) find that
firms pressured to demonstrate EPS growth are more likely to use stock repurchases when faced
with the dilutive effects of employee stock options. Our paper extends the literature related to real
earnings management focused on meeting or beating an EPS benchmark and investigates whether
audit quality affects the use of accretive stock repurchases as a real earnings management tool.
Earnings Management and Audit Quality
Audit quality is the joint probability that an auditor will discover and report material
misstatements found in financial statements (DeAngelo 1981). Auditor industry specialization as a
proxy for audit quality has been widely studied in the literature. Bedard and Biggs (1991) find that
as auditors’ industry-specific expertise increases, their ability to locate data errors also increases.
Industry-specific auditors more likely identify extraordinary transactions, have more exposure to
industry best practices, and have improved ability to identify inherent and control risks (Krishnan
2003). The use of industry-specialist auditors is found to be negatively correlated with violations of
accounting standards (O’Keefe et al. 1994) and restatements (Romanus et al. 2008), and positively
associated with disclosure quality (Dunn and Mayhew 2004). Together, these studies document a
link between high audit quality and the presence of industry-specialist auditors.
Prior research (Krishnan 2003; Balsam et al. 2003) also provides evidence that firms engaging
high-quality auditors are associated with constrained accrual-based earnings management. These
studies document that clients of industry specialists have lower discretionary accruals than clients of
non-industry specialists, consistent with industry specialists constraining opportunistic accrual
choices.3 These studies suggest the presence of high audit quality potentially constrains the
attempted use of accruals-based earnings management because of the higher risk that the behavior
will be discovered.
In contrast, auditors do not scrutinize real earnings management since their responsibility is
to provide reasonable assurance that financial statements are presented in accordance with
generally accepted accounting principles. Auditors ensure that the financial statements faithfully
represent the real activities of firms, but are not required to evaluate managers’ motivations for
decisions related to real activities. Although Roychowdhury (2006) asserts that real earnings
management potentially imposes greater long-term costs on firms because it has a negative effect
on future cash flows, he also argues that accrual-based earnings management imposes
significantly greater short-term costs on managers. This makes real earnings management an
3 Balsam et al. (2003) and Krishnan (2003) use the absolute value of discretionary total accruals. We model ‘‘as-if’’earnings by subtracting discretionary current accruals from reported net income. We posit that discretionarycurrent accruals better reflect managerial efforts to manage short-term earnings benchmarks such as quarterlyanalysts’ forecasts.
1864 Burnett, Cripe, Martin, and McAllister
The Accounting ReviewNovember 2012
attractive choice for managers who are motivated to achieve short-term earnings goals, but are
inhibited by high audit quality and therefore limited in their ability to use accrual-based earnings
management techniques.
Evidence relating audit quality to a trade-off between the use of accrual-based and real
earnings management is mixed. Cohen and Zarowin (2010) provide evidence that firms with Big
N auditors are more likely to engage in real earnings management than accrual-based earnings
management when involved in a seasoned equity offering. Chi et al. (2011) find that auditor
specialization, and to a lesser extent, Big N auditors, are positively associated with real earnings
management and negatively associated with accrual-based earnings management in a combined
sample of firms that have strong incentives to manage earnings in order to meet or just beat
earnings benchmarks or to support seasoned equity offerings. Conversely, using earnings
benchmarks, Zang (2012) fails to document a positive association between Big N auditors and
real earnings management.
Cohen et al. (2011) examine the estimation models used to construct proxies for real earnings
management and raise concerns that the models are likely to be misspecified. They suggest
matching on performance as a partial solution, but note that this approach is also subject to
specification concerns. Our use of stock repurchases circumvents these issues because they do not
involve estimation models and therefore are less subject to misspecification. Additionally,
Lawrence et al. (2011) suggest that the effect of Big N auditors may reflect fundamental differences
in client characteristics rather than differential audit quality. We address this concern by using
industry-specialist auditors as our proxy for high audit quality and also use propensity score
matching as an additional test to ensure that our results are not driven by differences between firms
with and without industry-specialist auditors.
Accretive Stock Repurchases as a Real Earnings Management Tool
Stock repurchases with the potential to increase reported EPS typically take the form of open-
market repurchases, which occur when firms buy shares of their own stock on the open market
(Vermaelen 2005). The transaction for open-market repurchases involves an actual stock buyback
and corresponding cash expenditure. Open-market repurchases accounted for 94.3 percent of all
repurchases and 95.2 percent of the total dollar value of shares repurchased during the 1990s
(Grullon and Ikenberry 2000). Open-market repurchase programs must be formally approved by a
firm’s board of directors, typically target 5 percent of its total share base, last two to three years, and
on average result in the repurchase of 77 percent of the targeted number of shares initially approved
(Stephens and Weisbach 1998). Our tests focus on open-market repurchases.
The net effect of stock repurchases on EPS depends jointly on three factors: (1) the timing of
the repurchase, (2) the number of shares repurchased, and (3) the forgone future returns from the
cash used to repurchase stock.4 The first two factors increase EPS by decreasing the EPS
denominator. Stock repurchases that are larger and occur earlier in a quarter have a greater influence
on the denominator of reported EPS because of their stronger effect on the time-weighted average
of shares outstanding. The third factor decreases EPS by decreasing the EPS numerator because of
forgone returns that the cash used in the repurchase could have generated. Repurchases are
4 The following discussion assumes that EPS is positive and that the numerator and denominator effects of arepurchase increase reported EPS by at least $0.01. In our sample selection, we eliminate firm-quarters reportingnon-positive EPS and round EPS amounts to the nearest $0.01.
Audit Quality, Accretive Stock Repurchases, and Accrual-Based Earnings Management 1865
The Accounting ReviewNovember 2012

accretive only when the timing and amount are sufficient to outweigh the decretive impact of the
forgone returns.
Similar to other real earnings management activities, stock repurchases are likely to be costly to
firms because the cash used in the repurchase is not available for other income-generating activities.
Firms that have more profitable uses of cash are less likely to engage in repurchases as an EPS
management tool. As a result, managers must consider the trade-offs between using accretive stock
repurchases and other earnings management activities.
Although boards of directors approve open-market repurchase programs, managers are left
with considerable discretion with respect to the timing of a stock repurchase (Vermaelen 2005;
Cook et al. 2003). In addition, the Securities and Exchange Commission (SEC) requires limited
disclosure about repurchases by public firms. Adopted in 1982, SEC Rule 10b-18 originally
required firms to disclose amounts spent on stock repurchases. The rule was amended in December
2003 to provide additional disclosures about the average price per share, the number of shares
repurchased as part of a repurchase program, and the maximum number of shares that may be
repurchased in the future under a repurchase program.
The SEC disclosure requirements are limited to reporting required in quarterly financial reports
filed after the quarter end. Therefore, analysts and investors are unlikely to be able to precisely
anticipate current-quarter repurchase effects on EPS. The combination of managerial flexibility and
limited mandatory disclosures enables firms to use open-market stock repurchases as an effective
real earnings management device.
Hypotheses
We focus our study on two hypotheses incorporating accretive stock repurchases, accrual-
based earnings management, and audit quality. We argue that high audit quality is likely to
constrain the use of discretionary accruals to meet or beat analysts’ forecasts and, therefore, firms
with high audit quality are more likely to use accretive stock repurchases as a substitute. While H1
focuses on the general association between audit quality and accretive stock repurchases, H2
examines the association between audit quality and the potential trade-off between accretive stock
repurchases and accruals-based earnings management. Both are formally stated as null hypotheses
as follows:
H1: High audit quality is unrelated to the use of accretive stock repurchases to meet or beat
consensus analysts’ forecasts.
H2: High audit quality is unrelated to a trade-off between the use of accretive stock
repurchases and accrual-based earnings management to meet or beat consensus analysts’
forecasts.
III. METHODOLOGY
Identification of Firms Suspected of Using Accretive Stock Repurchases for Real EarningsManagement
Firms repurchase common stock for multiple reasons,5 so it is important that our research
design identifies firms that likely use accretive stock repurchases to manage EPS. Therefore, we
identify firms that would have missed their quarterly consensus analysts’ forecasts, but actually
5 Skinner (2008) provides examples of competing motivations, including the signaling of future prospects, theissuing of stock options, and using stock swaps as part of merger and acquisition activities. These competingmotivations may result in accretive repurchases, but we distinguish them from efforts to manage EPS.
1866 Burnett, Cripe, Martin, and McAllister
The Accounting ReviewNovember 2012

meet or beat forecasts because they made an accretive stock repurchase. We term these suspect
repurchases.
Since firms do not formally disclose the exact timing of stock repurchases in their financial
reports, we must estimate the effects of stock repurchases on reported EPS. We follow Hribar et al.
(2006) in estimating the weighted average common shares outstanding absent a stock repurchase.
We estimate the EPS denominator as the beginning common shares outstanding plus 50 percent
times the number of shares issued during the quarter.6 This procedure assumes that shares are issued
evenly over the quarter and allows the repurchase timing parameter to vary across firm-quarters. If a
firm does not employ a stock repurchase for a particular period, we set common shares outstanding
equal to the number of common shares reported outstanding at the end of that period.
Alternative uses for the cash used to repurchase stock (i.e., growth opportunities and debt
refinancing) affect the numerator of EPS and can greatly influence managers’ decisions to use
repurchases as an EPS management tool (Hribar et al. 2006). Therefore, we follow Hribar et al.
(2006) in estimating opportunity costs associated with stock repurchases by calculating the forgone
dollar return on cash used for repurchases (Ct). We estimate excess cash as cash balances in excess
of 6 percent of assets for retail firms and 2 percent of assets for all other firms (Copeland et al.
2000). If excess cash is greater than or equal to the repurchase dollar amount, then we calculate the
forgone return by multiplying the repurchase dollar amount by the three-month Treasury bill rate
for the quarter. If excess cash is less than the repurchase dollar amount, we assume the firm borrows
cash in order to execute the repurchase. In such cases, we apply a firm’s average interest rate to the
incremental funds borrowed.7 We convert the estimated forgone dollar return into an after-tax
amount using Graham and Mills’ (2008) simulated marginal tax rates, which are highly correlated
with marginal rates based on actual tax returns.8
We calculate both the actual and pre-repurchase forecast error to identify suspect repurchases
where firm-quarters meet or beat consensus analysts’ forecasts, but would have missed the forecasts
absent accretive stock repurchases. Actual forecast error (ACTUAL_FE) is reported EPS minus the
final consensus analysts’ forecasts for each firm-quarter. Consistent with Hribar et al. (2006) and
Roychowdhury (2006), we assume that managerial expectations at the beginning of a quarter are
represented by the final actual consensus forecasts for the quarter.
To construct the pre-repurchase forecast error, we first compute EPS ‘‘as if’’ firms did not
repurchase stock during a quarter. We calculate ASIF_EPS1 by estimating the denominator and
numerator effects of accretive stock repurchases on EPS as follows:
ASIF EPS1i;t ¼NIi;t þ Ci;t
SHARESOUTi;t�1 þ 0:5�SHARESISSUEDi;t:
6 Prior to December 17, 2003, SEC Rule 10b-18 did not require firms to disclose the number of shares issued or thenumber of shares repurchased as part of a repurchase program. Therefore, it is necessary to estimate the number ofshares issued and repurchased for a significant number of observations that occur prior to Rule 10b-18. Asnecessary, we follow Stephens and Weisbach (1998) to estimate the number of shares repurchased by dividing thedollar amount of common stock repurchased by the average monthly closing stock price for the quarter. We thencalculate the number of shares issued as ending shares outstanding minus beginning shares outstanding plus sharesrepurchased. To address concerns over estimation error, we apply the estimation procedure to firm-quarters whereactual repurchases are available and find that the two are highly correlated (. 0.95, p-value , 0.0001). We useactual repurchases when available, but this additional test reduces concerns over estimation error when actualrepurchases are unavailable. Our results remain robust when using the estimation method used by Hribar et al.(2006).
7 We estimate each firm’s borrowing rate following Francis et al. (2005). We calculate a firm’s borrowing rate bytaking interest expense divided by average debt for the quarter. If the information is not available to estimate afirm’s borrowing rate, then we use the average industry (two-digit SIC) borrowing rate for that quarter.
8 We thank John Graham for providing data on marginal tax rates.
Audit Quality, Accretive Stock Repurchases, and Accrual-Based Earnings Management 1867
The Accounting ReviewNovember 2012

In this calculation, ASIF_EPS1i.t represents the estimated EPS absent accretive stock repurchases.
NIi.t is reported earnings before extraordinary items available to common shareholders for the firm-
quarter. Ci.t is the estimated forgone dollar return on cash used for accretive stock repurchases.
SHARESOUTi,t�1 is the reported number of diluted common shares outstanding if analysts’ forecast
diluted EPS, otherwise primary common shares outstanding, at the beginning of the firm-quarter.
Finally, SHARESISSUEDi,t is the actual or estimated number of common stock shares issued during
a firm-quarter depending on data availability. All variable descriptions are provided in Appendix A.
Next, we remove the EPS effect of stock repurchases from the actual forecast error. We label
the EPS effect of stock repurchases as EPSImpact1 and calculate it as follows:
EPSImpact1i;t ¼ ReportedEPSi;t � ASIF EPS1i;t:
EPSImpact1 is positive for accretive stock repurchases and negative for decretive stock
repurchases.
The pre-repurchase forecast error is calculated as the actual forecast error less the EPS effect of
share repurchases. Specifically:
ASIF FE1i;t ¼ ACTUAL FEi;t � EPSImpact1i;t:
ASIF_FE1 is negative for firm-quarters that would have missed consensus analysts’ forecasts absent
the effects of accretive stock repurchases. For firms that do not repurchase common stock,
ASIF_FE1 equals ACTUAL_FE.
Finally, we define suspect repurchases as those that would have missed analysts’ forecasts by
five cents or less, but are able to meet or beat forecasts by no more than five cents with a stock
repurchase. Specifically, we construct an indicator variable (SUSPECT_REPURCHASE1i,t¼ 1) as
our measure for suspect repurchases, where ASIF_FE1 is ��$0.05, but , $0.00 and ACTUAL_FEis � $0.00, but � $0.05 for a firm-quarter.9 SUSPECT_REPURCHASE1 is equal to 0 for all other
firm-quarters. Consistent with prior research (Dhaliwal et al. 2004; Cook et al. 2008; Gleason and
Mills 2008), we limit the construction of SUSPECT_REPURCHASE1 to within five cents of
analysts’ forecasts to reduce the influence of motivations for stock repurchases unrelated to efforts
to manage EPS within our setting.
Our final identification of suspect repurchases is based on (1) ex ante managerial expectations
of falling short of consensus analysts’ forecasts and (2) ex post use of accretive stock repurchases
by managers used specifically to meet or beat consensus analysts’ forecasts of EPS. As ex anteexpectations of falling short or ex post reported EPS deviates further from analysts’ forecasts,
repurchases that increase EPS are likely less motivated by or are a noisier measure of earnings
management behavior. Since real earnings management in the form of accretive stock repurchases
expends significant amounts of firm resources, it can be a very costly form of earnings management.
Therefore, accretive repurchases are most likely to occur as an EPS-management tool as negative
values of ASIF_FE1 approach 0, making it more likely they are helpful in meeting or beating
analysts’ forecasts. Similarly, as ACTUAL_FE becomes increasingly positive, repurchase behavior
is less likely to be an effort to manage EPS to meet analysts’ forecasts.
9 This definition of suspect repurchases captures 85 percent of repurchase firm-quarters with ex ante managerialexpectations of falling short of analysts’ forecasts and ex post use of accretive repurchases to meet or beatanalysts’ forecasts. Our main results are robust when we expand the definition to 95 percent of possible suspectrepurchases. As expected, our results become less robust as we further increase the forecast error limits.
1868 Burnett, Cripe, Martin, and McAllister
The Accounting ReviewNovember 2012
Identification of Firms Suspected of Using Accrual-Based Earnings Management
We similarly identify firm-quarters during which firms appear to be using accrual-based
earnings management to meet or beat analysts’ forecasts and term these suspect accruals. We
identify suspect accrual firms as those that would have missed analysts’ forecasts absent the use of
discretionary current accruals by five cents or less, but were able to meet or beat the forecasts by no
more than five cents with their use. Our tests employ discretionary current accruals (see Guenther
1994; Teoh et al. 1998) because earnings management efforts focused on small changes in EPS and
one-time quarterly benchmarks are more likely to be focused on current operating accruals.
Following Louis (2004), we measure quarterly discretionary current accruals using a two-step
approach. First, we model normal current accruals within each two-digit SIC industry year as a
function of both the change in revenue and the change in receivables for each firm-quarter using the
following equation:
Current Accrualsi;t
ATQi;t�1
¼ b1
1
ATQi;t�1
� �þ b2
DREVQi;t � DRECQi;t
ATQi;t�1
� �þ ei;t:
Current accruals are measured as the difference between quarterly income before extraordinary
items and quarterly operating cash flows less depreciation and amortization expense. The change in
revenue and change in receivables is the difference between the current and prior quarter of each
measure, respectively. The residual from the model, ei,t, represents discretionary current accruals
and is equal to actual current accruals less estimated current accruals. The model scales
discretionary current accruals by lagged total assets (ATQi,t�1) so we multiply the regression
residual by its corresponding lagged total assets to calculate an unscaled measure of discretionary
current accruals (DACCi,t).
Similar to our approach for constructing suspect repurchases, we calculate ‘‘as-if’’ EPS absent
discretionary current accruals (net of income taxes) as follows:
ASIF EPS ACCRUALSi;t ¼NIi;t � DACCi;tð1� Ti;tÞ
Weighted Average SHARESOUTi;t:
NIi,t is income before extraordinary items available to common shareholders, DACCi,t is as defined
above, and Ti,t is the firm’s estimated marginal tax rate. The numerator provides an estimate for net
income absent the effects of discretionary current accruals. Weighted Average SHARESOUTi,t is the
shares used by the firm to calculate EPS, and is diluted shares when analysts’ forecast diluted EPS,
and primary shares otherwise. Next, we isolate the impact of discretionary current accruals on EPS
(EPSImpact1_ACCRUALS) as follows:
EPSImpact1 ACCRUALSi;t ¼ ReportedEPSi;t � ASIF EPS ACCRUALSi;t:
EPSImpact1_ACCRUALS is positive for income-increasing discretionary current accruals and
negative for income-decreasing discretionary current accruals.
We use the actual forecast error (ACTUAL_FE) and ‘‘as-if’’ forecast error absent discretionary
current accruals (ASIF_FE_ACCRUALS) to identify suspect current accruals. Actual forecast error
(ACTUAL_FE) is calculated as before and the ‘‘as-if’’ forecast error absent discretionary accruals is
calculated as the actual forecast error less the EPS impact from discretionary current accruals.
Specifically:
ASIF FE ACCRUALSi;t ¼ ACTUAL FEi;t � EPSImpact1 ACCRUALSi;t:
ASIF_FE_ACCRUALS is negative for firm-quarters that would have missed consensus analysts’
forecasts absent the effects of discretionary current accruals.
Audit Quality, Accretive Stock Repurchases, and Accrual-Based Earnings Management 1869
The Accounting ReviewNovember 2012
Finally, we define suspect accruals as those that would have missed analysts’ forecasts by five
cents or less, but are able to meet or beat forecasts by no more than five cents with discretionary
current accruals. We construct an indicator variable (SUSPECT_ACCRUALSi,t¼ 1) as our measure
for suspect accruals, where ASIF_FE_ACCRUALS ��$0.05, but , $0.00 and ACTUAL_FE is �$0.00, but � $0.05 for a firm-quarter. SUSPECT_ACCRUALS is equal to 0 for all other firm-
quarters.
Audit Quality
We use an industry-specialist auditor designation as our measure of high audit quality.
Consistent with prior research (e.g., Hogan and Jeter 1999; Krishnan 2003; Gul et al. 2009), we
define industry specialization as the Big N audit firm with the largest market share (in terms of
clients’ total assets10) within each two-digit SIC industry group on an annual basis.11 High audit
quality is equal to 1 (HAQi,t¼ 1) when the audit firm is classified as an industry-specialist auditor,
and 0 otherwise.
Empirical Models
Our empirical model for suspect repurchases uses the following logistic regression:
SUSPECT REPURCHASE1i;t ¼ aþ b1HAQi;t þ b2Repurchasei;t�1 þ b3Repurchasei;t�2
þ b4Forecast Dispersioni;t þ b5Cashi;t�1 þ b6CAPEXi;t�4;t�1
þ b7Dividend Yieldi;t�1 þ b8Debti;t�1 þ b9Sizei;t�1
þ b10Size2i;t�1 þ b11Size3
i;t�1 þ b12ROAi;t þ b13MTBi;t
þ ei;t: ð1Þ
Suspect repurchases (SUSPECT_REPURCHASE1i,t ¼ 1) are modeled as a function of high audit
quality as well as a firm’s prior stock repurchases, cash levels, capital expenditures, dividends, debt
levels, size, performance, and growth. We use nonlinear firm size terms consistent with Gul et al.
(2009). We also include Forecast Dispersion, calculated as the standard deviation of the individual
analyst’ forecasts for each firm-quarter, as a control for the predictability of a firm’s EPS and the
definitiveness of the firm’s EPS target in a quarter (Payne and Robb 2000).
b1(HAQi,t¼1) captures the relation between high audit quality and the likelihood that accretive
stock repurchases are used to manage EPS. A positive and significant estimate for b1 is consistent
with a positive association between high audit quality and EPS management through accretive stock
repurchases.
10 Some past studies use audit fees within industry to define ‘‘expert,’’ but fee data are only available after the year2000. We use the total assets measure since both measures are used in the literature and our sample predates2000. As a sensitivity test, we do not require the industry expert be a Big N auditor. The results of our tests arequalitatively similar using this alternative measure.
11 Alternatively, Reichelt and Wang (2010) provide evidence that audit quality is systematically associated withjoint national and city-specific auditor industry expertise. They use two definitions of industry specialist. The firstdefinition requires an audit firm to have the largest market share of audit fees in an industry (two-digit SIC) by atleast 10 percent. The second definition requires an audit firm to have a significant market share in an industry (30percent of the market for national expertise and 50 percent of the market for city-specific expertise). Our resultsare qualitatively similar based on the second definition, but are not robust based on the first definition.
1870 Burnett, Cripe, Martin, and McAllister
The Accounting ReviewNovember 2012
Our empirical model for suspect accruals uses the following logistic regression:
SUSPECT ACCRUALSi;t ¼ aþ b1HAQi;t þ b2Forecast Dispersioni;t þ b3Cashi;t�1
þ b4CAPEXi;t�4;t�1 þ b5Dividend Yieldi;t�1 þ b6Debti;t�1
þ b7Sizei;t�1 þ b8Size2i;t�1 þ b9Size3
i;t�1 þ b10ROAi;t þ b11MTBi;t
þ ei;t: ð2Þ
Suspect accruals (SUSPECT_ACCRUALSi,t ¼ 1) are modeled similar to suspect repurchases,
except that we exclude prior stock repurchases as control variables. Once again, b1(HAQi,t ¼ 1)
captures the relation between high audit quality and the likelihood that discretionary accruals are
used to manage EPS. A negative and significant estimate for b1 is consistent with a negative
association between high audit quality and EPS management through discretionary accruals.
Sample Selection
We derive our sample from quarterly financial statement data obtained from the Compustat
Xpressfeed North America database for the 22-year period from 1988 to 2009. Our analysis is limited
to the post-SFAS 95 period since we require information from cash flow statements to identify stock
repurchases and to estimate discretionary accruals. We use lagged data to estimate our models, which
limits our sample period to 1989–2009. We eliminate financial institutions, transportation companies,
and utilities because regulatory restrictions are likely to constrain their ability to repurchase stock
(Bens et al. 2003). In addition, quarterly EPS forecast data must be available in the unadjusted
consensus International Brokers’ Estimate System (I/B/E/S) file. We require at least two analysts’
forecasts for each firm-quarter to construct our forecast dispersion measure. We also eliminate firm-
quarters reporting non-positive EPS since accretive stock repurchases do not increase EPS for firms
reporting zero income or losses. Finally, we remove firm-quarters with repurchases that are more than
20 percent of common shares outstanding. These are unlikely to be open-market repurchases (Hribar
et al. 2006) or repurchases associated with EPS management.
We further refine the sample to more directly address H1 and H2. For our first two main tests,
we individually compare suspect repurchases and suspect accrual firm-quarters to firm-quarters that
are able to meet or beat consensus analysts’ forecasts absent an accretive stock repurchase or
discretionary accruals. Therefore, we limit observations to firm-quarters where SUSPECT_RE-
PURCHASE1i,t ¼ 1, SUSPECT_ACCRUALSi,t ¼ 1, or ACTUAL_FE is � $0.00, � $0.05 absent
stock repurchases or discretionary accruals. This reduces the sample to 23,290 observations, of
which 1,894 are suspect repurchase firm-quarters and 3,232 are suspect accrual firm-quarters.
Our third test directly compares suspect repurchase to suspect accrual firm-quarters. This
analysis includes only firm-quarters where SUSPECT_REPURCHASE1i,t ¼ 1 or SUSPECT_AC-
CRUALSi,t¼ 1. The final sample size for this test equals 4,987 total firm-quarters, of which 1,894
are suspect repurchase firm-quarters. The final sample includes 139 firm-quarters designated as both
SUSPECT_REPURCHASE1i,t ¼ 1 and SUSPECT_ACCRUALSi,t ¼ 1. Our results are qualitatively
similar if we eliminate these firm-quarters from the sample.
IV. RESULTS
Descriptive Statistics
Table 1 presents descriptive statistics for the three samples relevant to our tests. Column 1
presents descriptive statistics for suspect repurchase firm-quarters (SUSPECT_REPURCHASE1i,t¼1), column 2 presents suspect accrual firm-quarters (SUSPECT_ACCRUALSi,t¼ 1), and column 3
Audit Quality, Accretive Stock Repurchases, and Accrual-Based Earnings Management 1871
The Accounting ReviewNovember 2012

presents non-suspect control firm-quarters that, ex post, meet or beat consensus analysts’ forecasts
without accretive stock repurchases or discretionary accruals.
We find that 28 percent of suspect repurchase firm-quarters employ industry-specialist auditors
(HAQ) versus 22 percent of suspect accrual firm-quarters and 24 percent of non-suspect control
firm-quarters. These differences are statistically significant at the 0.01 level based on a t-test of
differences in means.
We also find that 58 percent of suspect repurchase firm-quarters consummate a repurchase in
the previous quarter (REPURCHASEi,t�1 ¼ 1) as compared to 25 and 26 percent in the two
comparison firm-quarters. Similar differences are present for repurchase behavior two quarters prior
(REPURCHASEi,t�2¼ 1). Combined, these findings indicate that suspect repurchase firm-quarters
TABLE 1
Descriptive Statistics by Firm-Quarter Type
SUSPECT_REPURCHASE1i,t ¼ 1
n ¼ 1,894
SUSPECT_ACCRUALSi,t ¼ 1
n ¼ 3,232
ACTUAL_FEi,t ¼ [$0.00,$0.05](Non-Suspect Control Group)
n ¼ 18,303
Mean Median Mean Median Mean Median
HAQi,t 0.28 0.00 0.22*** 0.00 0.24*** 0.00
REPURCHASEi,t�1 0.58 1.00 0.25*** 0.00 0.26*** 0.00
REPURCHASEi,t�2 0.56 1.00 0.25*** 0.00 0.27*** 0.00
Forecast Dispersioni,t 0.02 0.01 0.01*** 0.01 0.02 0.01
Cashi,t�1 0.12 0.06 0.22*** 0.16 0.17*** 0.08
CAPEXi,t�1,t�4 0.01 0.01 0.02*** 0.01 0.02*** 0.01
Dividend Yieldi,t�1 1.63 0.12 0.57*** 0.00 0.66*** 0.00
Debti,t�1 0.21 0.20 0.14*** 0.08 0.19*** 0.15
Sizei,t�1 6,709 1,716 2,006*** 279 2,609*** 468
ROAi,t 0.03 0.02 0.03*** 0.02 0.02*** 0.02
MTBi,t 4.34 3.17 4.10*** 3.04 3.63*** 2.66
*** Denotes the difference between suspect repurchase firm-quarters and either suspect discretionary accruals or the non-suspect control group are significant at less than 1 percent.
Variable Definitions:SUSPECT_REPURCHASE1i,t¼ 1 where ASIF_FE1i,t is ��$0.05, but , $0.00 and ACTUAL_FEi,t is � $0.00 but �
$0.05 for a firm-quarter, otherwise 0;SUSPECT_ACCRUALSi,t¼ 1 where ASIF_FE_ACCRUALSi,t ��$0.05, but , $0.00 and ACTUAL_FEi,t is � $0.00 but
� $0.05 for a firm-quarter, otherwise 0;HAQi,t¼ 1 where the auditor is identified as the industry specialist, otherwise 0;REPURCHASEi,t�1(t�2)¼ 1 where a firm was a net repurchaser in the previous quarter (t�1) or two quarters prior (t�2),
otherwise 0;Forecast Dispersioni,t¼ standard deviation of analysts’ forecasts that comprise the consensus analysts’ forecasts. Firm-
quarters with only one analyst forecast are removed from the test samples;Cashi,t�1 ¼ cash and cash equivalents (CHEQ) at the beginning of the quarter scaled by total assets (ATQ);CAPEXi,t�1,t�4 ¼ capital expenditures during the previous year ending at the beginning of the quarter scaled by total
assets (ATQ);Dividend Yieldi,t�1¼dividend payment (DIVY) during the previous year ending at the beginning of the quarter scaled by
quarter end price (PRCCQ);Debti,t�1 ¼ total debt (DLTTQ þ DLCQ) at the beginning of the quarter scaled by total assets (ATQ);Sizei,t�1 ¼ total assets (ATQ) at the beginning of the quarter;ROAi,t ¼ earnings before extraordinary items (IBQ) scaled by total assets (ATQ); andMTBi,t ¼ end-of-quarter market value of equity (CSHOQ � PRCCQ) scaled book value of equity (ATQ � LTQ �
PSTKQ).
1872 Burnett, Cripe, Martin, and McAllister
The Accounting ReviewNovember 2012
are approximately twice as likely to repurchase stock in previous quarters when compared to other
firm-quarters in our sample.
For all other control variables, differences between suspect repurchase and suspect accrual
firm-quarters are statistically significant at the 0.01 level. Similarly, all differences for the control
variables between suspect repurchase firm-quarters and non-suspect control firm-quarters are
statistically significant at the 0.01 level except for forecast dispersion. Most differences for the
control variables between suspect discretionary accrual and the non-suspect control firm-quarters
are also statistically significant, with the exception of previous quarter repurchases and capital
expenditures. Combined, the significance of these differences suggests the need for multivariate
testing.
Multivariate Analysis
Table 2 presents the results for the multivariate tests addressing H1. In Model 1, the coefficient
on HAQ (b1) is positive and significant, which supports our hypothesis that managers of firms with
higher audit quality are more likely to use accretive stock repurchases to meet or beat analysts’
forecasts. The marginal effect for HAQ indicates that high audit quality firm-quarters are 17
percent12 more likely to make an accretive repurchase in comparison to firm-quarters that are able to
meet or beat analysts’ forecasts without an accretive repurchase ex post. These results are consistent
with rejecting H1.
Table 2 also presents results for H2. In Model 2, the coefficient for HAQ (b1) is negative and
significant, providing evidence that firm-quarters with high audit quality are less likely to use
discretionary current accruals to meet or beat analysts’ forecasts. The marginal effect for HAQsuggests that firm-quarters with high audit quality are 11 percent less likely to use discretionary
current accruals in comparison to firm-quarters that meet or beat analysts’ forecasts without
discretionary current accruals ex post.In Model 3, we directly compare suspect repurchase firm-quarters with suspect accrual firm-
quarters by including only observations for which SUSPECT_REPURCHASE1i,t ¼ 1 or
SUSPECT_ACCRUALSi,t ¼ 1. The coefficient for HAQ (b1) is positive and significant, which,
along with results from Models 1 and 2, supports our hypothesis that firms with higher audit quality
are more likely to use accretive stock repurchases and less likely to use discretionary current
accruals to meet or beat analysts’ forecasts. The marginal effect for HAQ indicates that firm-quarters
with high audit quality are 23 percent more likely to use accretive stock repurchases than
discretionary current accruals to meet or beat analysts’ forecasts. The evidence presented in Table 2
is consistent with rejecting H2.
In addition to the results for high audit quality, most control variables are statistically
significant in all three models. Prior repurchases are very strongly associated with suspect
repurchases. As noted in prior research (Hribar et al. 2006), stock repurchases are serially
correlated, which may confound our identification of suspect repurchase firm-quarters. We further
address this concern through supplementary tests that explicitly control for expected repurchases.
Both suspect repurchase firm-quarters (Model 1) and suspect accrual firm-quarters (Model 2)
are negatively associated with forecast dispersion, indicating that as the variance of analysts’
forecasts increases, accretive repurchases and discretionary accruals are less likely to be used to
12 We apply an odds ratio to evaluate the marginal effect of HAQi,t¼1 for all models. Since the variable of interest isdichotomous, the marginal effect is calculated as exp(coefficient estimate). Using a coefficient estimate¼ 0.16 asan example, exp(0.16) ¼ 1.174 results in an odds ratio of 1.174/1.00. Interpreting this, firm-quarters engagingindustry-specialist auditors (i.e., HAQi,t ¼ 1) are 17 percent more likely to be identified as suspect repurchasefirm-quarters.
Audit Quality, Accretive Stock Repurchases, and Accrual-Based Earnings Management 1873
The Accounting ReviewNovember 2012

TABLE 2
Multivariate Results for the Association between High Audit Quality and SuspectRepurchases and Suspect Accruals
Model 1 Model 2 Model 3
Estimate p-value Estimate p-value Estimate p-value
Intercept �3.52*** , 0.001 �1.72*** , 0.001 �1.70*** , 0.001
HAQi,t 0.16*** 0.004 �0.10** 0.026 0.21*** 0.010
REPURCHASEi,t�1 0.84*** , 0.001 0.92*** , 0.001
REPURCHASEi,t�2 0.65*** , 0.001 0.73*** , 0.001
Forecast Dispersioni,t �3.53** 0.015 �8.59*** , 0.001 1.49 0.481
Cashi,t�1 �1.92*** , 0.001 0.60*** , 0.001 �2.20*** , 0.001
CAPEXi,t�1,t�4 �12.12*** , 0.001 2.61** 0.019 �13.71*** , 0.001
Dividend Yieldi,t�1 �0.04*** , 0.001 0.04*** 0.003 �0.09*** , 0.001
Debti,t�1 0.37** 0.024 �0.69*** , 0.001 1.05*** , 0.001
Sizei,t�1 0.00*** , 0.001 0.00*** , 0.001 0.00*** , 0.001
Size2i,t�1 0.00*** , 0.001 0.00*** , 0.001 0.00*** , 0.001
Size3i,t�1 0.00*** , 0.001 0.00*** , 0.001 0.00*** , 0.001
ROAi,t 22.79*** , 0.001 1.90 0.141 22.22*** , 0.001
MTBi,t 0.02** 0.014 0.01* 0.054 �0.01 0.214
Likelihood Ratio 1,645.9*** , 0.001 373.22*** , 0.001 1,390.6*** , 0.001
Total Observations 23,290 23,290 4,987
Observations where:
SUSPECT_ REPURCHASE1i,t ¼ 1 1,894 — 1,894
SUSPECT_ ACCRUALSi,t ¼ 1 — 3,232 —
*,**,*** Indicate significance at the 0.10, 0.05, and 0.01 levels, respectively, using two-tailed tests.The likelihood ratio test statistic indicates the overall significance of the model and has a Chi-square distribution. Allmodels are significant at less than 0.01. All variables are defined in Table 1. Results reflect the following logisticregressions:Models 1 and 3:
SUSPECT REPURCHASE1i;t ¼ aþ b1HAQi;t þ b2Repurchasei;t�1 þ b3Repurchasei;t�2
þ b4Forecast Dispersioni;t þ b5Cashi;t�1 þ b6CAPEXi;t�4;t�1
þ b7Dividend Yieldi;t�1 þ b8Debti;t�1 þ b9Sizei;t�1 þ b10Size2i;t�1 þ b11Size3
i;t�1
þ b12ROAi;t þ b13MTBi;t þ ei;t:
Model 2:
SUSPECT ACCRUALSi;t ¼ aþ b1HAQi;t þ b2Forecast Dispersioni;t þ b3Cashi;t�1 þ b4CAPEXi;t�1
þ b5Dividend Yieldi;t�1 þ b6Debti;t�1 þ b7Sizei;t�1 þ b8Size2i;t�1 þ b9Size3
i;t�1
þ b10ROAi;t þ b11MTBi;t þ ei;t:
Each model sample reflects the following restrictions:Model 1: Firm-quarters that meet or beat the consensus analysts’ forecasts ($0.00 � ACTUALFEi,t � $0.05). The samplecompares firm-quarters suspected of using accretive stock repurchases to meet or beat consensus analysts’ forecasts tothose that that meet or beat without accretive stock repurchases.Model 2: Firm-quarters that meet or beat the consensus analysts’ forecasts ($0.00 � ACTUALFEi,t � $0.05). The samplecompares firm-quarters suspected of using discretionary accruals to meet or beat consensus analysts’ forecasts to thosethat meet or beat without discretionary accruals.Model 3: Firm-quarters identified as SUSPECT_REPURCHASE1i,t ¼ 1, or SUSPECT_ACCRUALSi,t ¼ 1. The samplecompares firm-quarters suspected of using accretive stock repurchases to meet or beat consensus analysts’ forecasts tofirm-quarters suspected of using accruals to meet or beat consensus analysts’ forecasts.
1874 Burnett, Cripe, Martin, and McAllister
The Accounting ReviewNovember 2012

meet the consensus analysts’ forecasts. In addition, both suspect repurchase and suspect accrual
firm-quarters are positively associated with ROA, although ROA is much higher for suspect
repurchase firm-quarters. The signs of cash, capital expenditures, dividend yield, and debt switch
between Models 1 and 2, indicating that suspect repurchase firm-quarters exhibit lower levels of
each, while suspect accrual firm-quarters exhibit higher levels of each when compared to non-
suspect firm-quarters. Together, these findings suggest that firm characteristics are likely to affect
firm choices between earnings management types, but also indicate possible underlying firm
differences. We address this concern through supplementary tests that apply propensity score
matching based on auditor industry specialization to better control for firm differences.
Supplementary Tests
Controlling for Expected Repurchases
Our main tests estimate pre-repurchase forecast error (i.e., ASIF_FE1) assuming that firms’
open-market repurchases are not anticipated by analysts and investors. If firms previously announce
open-market repurchase programs or if analysts anticipate the serial correlation in stock repurchase
behavior, then our approach likely understates analysts’ and investors’ repurchase expectations. Our
main tests control for this by including prior stock repurchases in the suspect repurchase models.
However, to further address this concern, we next directly estimate expected repurchases for use in
the suspect repurchase models (see Hribar et al. 2006, 18–19).
We follow Hribar et al. (2006) and estimate expected repurchases by a firm in a given quarter
using a two-stage approach that models expected repurchases as the product of the estimated
probability that firms will repurchase stock (stage 1) and the expected level of repurchases given
that one occurs (stage 2). The first-stage estimation uses both repurchase and non-repurchase firms
to estimate a repurchase expectation for every firm-quarter in the sample. The first stage models the
repurchase decision as a binary variable, and estimates the following probit model:
REPURCHASEi;t ¼ aþ b1Repurchasei;t�1 þ b2Repurchasei;t�2 þ b3Cashi;t�1
þ b4CAPEXi;t�4;t�1 þ b5Dividend Yieldi;t�1 þ b6Debti;t�1 þ b7Sizei;t�1
þ ckIndustryi;k þ djYeari;j þ uqQtri;q þ ei;t; ð3Þ
where REPURCHASEi,t equals 1 if firm i repurchased shares during quarter t, and 0 otherwise.
Independent variables are measured at the beginning of the quarter when expectations are more
likely formed about potential stock repurchases. Most control variables are the same as those used
in the suspect repurchases model. Industryi,k, Yeari,j, and Qtri,q are included as fixed effects.
Untabulated results for the first-stage regression reveal that the probability of a repurchase is
positive and significantly associated with prior repurchases, dividend yield, and size, and negative
and significantly associated with cash, capital expenditures, and debt. The pseudo-R2 from the first-
stage analysis is 27.7 percent.
The second-stage model provides an estimate for dollars spent on stock repurchases based on
firm characteristics conditioned on the probability that a repurchase occurs. The second-stage
regression is similar to the first-stage, except that the actual dollar value of stock repurchases
replaces the binary repurchase variables from the first stage and information about the probability of
a repurchase is incorporated into the model. Information about the probability of a repurchase for all
firms, not just repurchasing firms, is incorporated in the second-stage regression through two
variables calculated from the first stage, the standard normal probability density function (u) and
the cumulative density function (U). The variable u is included in the second-stage regression,
while U is multiplied by each of the independent variables from the first stage. Untabulated results
for the second-stage regression show that all variables except capital expenditures are significantly
Audit Quality, Accretive Stock Repurchases, and Accrual-Based Earnings Management 1875
The Accounting ReviewNovember 2012
related in the expected direction to the dollar value of stock repurchases. The adjusted R2 in the
second stage is 57.1 percent.
The second-stage estimates generate an unconditional expectation of the dollar amount of
repurchases for firm-quarters based on information known at the beginning of each quarter. The
expected number of shares repurchased is calculated by dividing the estimated dollar amount of
shares repurchased by the beginning of the quarter stock price. From this estimate of the expected
number of shares repurchased, we create a second ‘‘as-if’’ EPS estimate that incorporates expected
stock repurchase activity:
ASIF EPS2i;t ¼ðNIi;t þ Ci;tÞ
SHARESOUTi;t�1 þ ð0:5�SHARESISSUEDi;tÞ ��
0:5�EðREPURCHASEi;tÞ�h i ;
where E(REPURCHASEi,t) is the expectation of shares to be repurchased at the beginning of the
quarter. ASIF_EPS2 is similar to ASIF_EPS1, except that it removes the EPS effects of expected
repurchases. The difference between reported EPS and ASIF_EPS1 includes the EPS effects of both
expected and unexpected repurchases, whereas the difference between reported EPS and
ASIF_EPS2 only reflects the EPS effects of unexpected repurchases.
To obtain the pre-repurchase forecast error based on unexpected repurchases, we isolate the
impact of unexpected stock repurchases on EPS (EPSImpact2) by comparing ASIF_EPS2 and
reported EPS, where:
EPSImpact2i;t ¼ ReportedEPSi;t � ASIF EPS2i;t:
EPSImpact2 is positive for accretive stock repurchases and negative for non-accretive stock
repurchases.
The pre-repurchase forecast error based on unexpected repurchases is calculated as the actual
forecast error less the EPS effect of unexpected repurchases. Specifically:
ASIF FE2i;t ¼ ACTUAL FEi;t � EPSImpact2i;t:
ASIF_FE2 is negative for firm-quarters that would have missed consensus analysts’ forecasts absent
the effects of accretive stock repurchases. For firms that do not repurchase stock, ASIF_FE2 equals
ACTUAL_FE.
Finally, we define suspect repurchases as those that would have missed analysts’ forecasts by
five cents or less, but are able to meet or beat forecasts by no more than five cents with unexpected
stock repurchases. We construct an indicator variable (SUSPECT_REPURCHASE2i,t ¼ 1) as an
alternative measure for suspect repurchases based on unexpected repurchases, where ASIF_FE2 is
� �$0.05 and , $0.00 and ACTUAL_FE is � $0.00 and � $0.05 for a firm-quarter.
SUSPECT_REPURCHASE2 is equal to 0 for all other firm-quarters.
Table 3 replicates our main tests for H1 and H2, but substitutes SUSPECT_REPURCHASE2for SUSPECT_REPURCHASE1 to control for expected repurchases. The results from these
supplementary tests are consistent with our main tests. In Model 4, the coefficient on HAQ (b1) is
positive and significant, which provides support that managers of firms with higher audit quality
are more likely to use accretive stock repurchases to meet or beat analysts’ forecasts. In Model 5,
the coefficient for HAQ (b1) is negative and significant, providing evidence that firm-quarters with
high audit quality are less likely to use discretionary current accruals to meet or beat analysts’
forecasts. Finally, in Model 6, the coefficient for HAQ (b1) is positive and significant, which
supports our hypothesis that firms with higher audit quality are more likely to use accretive stock
repurchases and less likely to use discretionary current accruals to meet or beat analysts’
forecasts.
1876 Burnett, Cripe, Martin, and McAllister
The Accounting ReviewNovember 2012

Propensity Score Matching
Our main tests use control variables to reduce the effects of firm characteristics on the
association between suspect repurchases, suspect accruals, and high audit quality. However, the
results from our main tests may still be influenced by fundamental differences in firm
characteristics. Prior research (Lawrence et al. 2011; Armstrong et al. 2010) finds that the
regression framework is subject to misspecification of the functional relationship between control
variables and the dependent variable for different treatment levels and recommends using
propensity score matching to address this concern. In our study, size is of particular concern since
industry-specialist auditors are identified based on market share. Therefore, we employ propensity
score matching to match firms with industry-specialist auditors to firms without industry-specialist
auditors based on relevant observable firm characteristics.
First, following Gul et al. (2009), we estimate propensity scores using a logistic regression in
which the dependent variable is either an industry-specialist auditor (1) or not an industry-specialist
auditor (0). We model the choice of an industry-specialist auditor based on size, debt, return on
assets, market-to-book, asset turnover, litigation risk, lagged absolute value of discretionary
TABLE 3
Multivariate Results for the Association between High Audit Quality and SuspectRepurchases and Suspect Accruals after Controlling for Expected Repurchases
Model 4 Model 5 Model 6
Estimate p-value Estimate p-value Estimate p-value
Intercept �4.53*** , 0.001 �1.61*** , 0.001 �2.70*** , 0.001
HAQi,t 0.27*** 0.000 �0.12** 0.012 0.30*** 0.003
REPURCHASEi,t�1 0.65*** , 0.001 0.69*** , 0.001
REPURCHASEi,t�2 0.65*** , 0.001 0.70*** , 0.001
Forecast Dispersioni,t �2.12 0.275 �8.38*** , 0.001 0.73 0.778
Cashi,t�1 �1.33*** , 0.001 0.52*** , 0.001 �1.47*** , 0.001
CAPEXi,t�1,t�4 �11.76*** , 0.001 1.77 0.116 �12.35*** 0.000
Dividend Yieldi,t�1 �0.03*** 0.005 0.04*** 0.004 �0.08*** , 0.001
Debti,t�1 �0.47* 0.057 �0.68*** , 0.001 �0.22 0.490
Sizei,t�1 0.00*** , 0.001 0.00*** , 0.001 0.00*** , 0.001
Size2i,t�1 0.00*** , 0.001 0.00*** , 0.001 0.00*** , 0.001
Size3i,t�1 0.00*** , 0.001 0.00*** , 0.001 0.00*** , 0.001
ROAi,t 24.98*** , 0.001 2.39* 0.068 23.45*** , 0.001
MTBi,t 0.05*** , 0.001 0.01 0.233 0.02* 0.099
Likelihood Ratio 1,197.4*** , 0.001 337.83*** , 0.001 1,052.3*** , 0.001
Total Observations 21,310 21,310 4,035
Observations where:
SUSPECT_ REPURCHASE2i,t ¼ 1 936 — 936
SUSPECT_ ACCRUALSi,t ¼ 1 — 3,172 —
*,**,*** Indicate significance at the 0.10, 0.05, and 0.01 levels, respectively, using two-tailed tests.The likelihood ratio test statistic indicates the overall significance of the model and has a Chi-square distribution. Allmodels are significant at less than 0.01. All variables are as defined in Table 1, except SUSPECT_REPURCHASE2,which is equal to 1 where ASIF_FE2i,t is ��$0.05, but , $0.00 and ACTUAL_FEi,t is � $0.00, but � $0.05 for a firm-quarter, otherwise 0.Models 4–6 mirror Table 2, Models 1–3. Each model sample reflects the same restrictions identified in Table 2 except therestrictions to SUSPECT_REPURCHASE2.
Audit Quality, Accretive Stock Repurchases, and Accrual-Based Earnings Management 1877
The Accounting ReviewNovember 2012
accruals, age, industry, and year. Next we match, without replacement, an industry-specialist firm to
the non-industry-specialist firm with the closest propensity score within a maximum distance of
0.03. This results in 5,153 matched pairs.
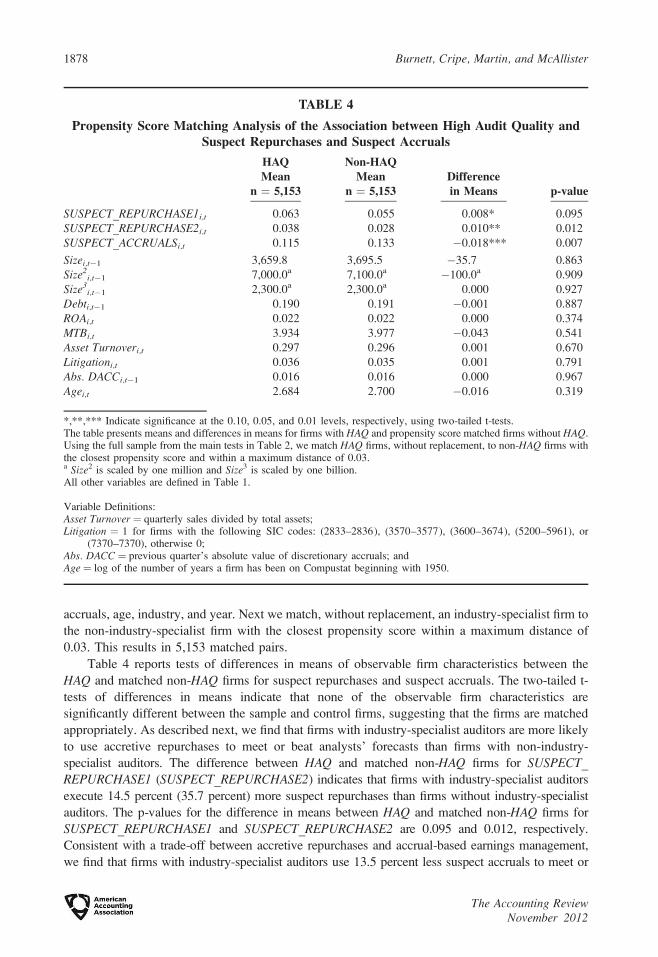
Table 4 reports tests of differences in means of observable firm characteristics between the
HAQ and matched non-HAQ firms for suspect repurchases and suspect accruals. The two-tailed t-
tests of differences in means indicate that none of the observable firm characteristics are
significantly different between the sample and control firms, suggesting that the firms are matched
appropriately. As described next, we find that firms with industry-specialist auditors are more likely
to use accretive repurchases to meet or beat analysts’ forecasts than firms with non-industry-
specialist auditors. The difference between HAQ and matched non-HAQ firms for SUSPECT_REPURCHASE1 (SUSPECT_REPURCHASE2) indicates that firms with industry-specialist auditors
execute 14.5 percent (35.7 percent) more suspect repurchases than firms without industry-specialist
auditors. The p-values for the difference in means between HAQ and matched non-HAQ firms for
SUSPECT_REPURCHASE1 and SUSPECT_REPURCHASE2 are 0.095 and 0.012, respectively.
Consistent with a trade-off between accretive repurchases and accrual-based earnings management,
we find that firms with industry-specialist auditors use 13.5 percent less suspect accruals to meet or
TABLE 4
Propensity Score Matching Analysis of the Association between High Audit Quality andSuspect Repurchases and Suspect Accruals
HAQMean
n ¼ 5,153
Non-HAQMean
n ¼ 5,153Differencein Means p-value
SUSPECT_REPURCHASE1i,t 0.063 0.055 0.008* 0.095
SUSPECT_REPURCHASE2i,t 0.038 0.028 0.010** 0.012
SUSPECT_ACCRUALSi,t 0.115 0.133 �0.018*** 0.007
Sizei,t�1 3,659.8 3,695.5 �35.7 0.863
Size2i,t�1 7,000.0a 7,100.0a �100.0a 0.909
Size3i,t�1 2,300.0a 2,300.0a 0.000 0.927
Debti,t�1 0.190 0.191 �0.001 0.887
ROAi,t 0.022 0.022 0.000 0.374
MTBi,t 3.934 3.977 �0.043 0.541
Asset Turnoveri,t 0.297 0.296 0.001 0.670
Litigationi,t 0.036 0.035 0.001 0.791
Abs. DACCi,t�1 0.016 0.016 0.000 0.967
Agei,t 2.684 2.700 �0.016 0.319
*,**,*** Indicate significance at the 0.10, 0.05, and 0.01 levels, respectively, using two-tailed t-tests.The table presents means and differences in means for firms with HAQ and propensity score matched firms without HAQ.Using the full sample from the main tests in Table 2, we match HAQ firms, without replacement, to non-HAQ firms withthe closest propensity score and within a maximum distance of 0.03.a Size2 is scaled by one million and Size3 is scaled by one billion.All other variables are defined in Table 1.
Variable Definitions:Asset Turnover ¼ quarterly sales divided by total assets;Litigation ¼ 1 for firms with the following SIC codes: (2833–2836), (3570–3577), (3600–3674), (5200–5961), or
(7370–7370), otherwise 0;Abs. DACC ¼ previous quarter’s absolute value of discretionary accruals; andAge ¼ log of the number of years a firm has been on Compustat beginning with 1950.
1878 Burnett, Cripe, Martin, and McAllister
The Accounting ReviewNovember 2012

beat analysts’ forecasts than the same matched non-industry-specialist auditor firms. The p-value of
the difference in means for SUSPECT_ACCRUALS is 0.007. The evidence from propensity score
matching supports our main results and helps alleviate concerns that differences in observable firm
characteristics are driving our results.
V. SENSITIVITY TESTS
One concern is that our main tests could be capturing a spurious relation between high audit
quality and accretive stock repurchases and discretionary accruals. We address this issue in two
ways. First, we test whether there is a relation between accretive stock repurchases and
discretionary current accruals absent incentives to meet or beat analysts’ forecasts. We identify both
accretive stock repurchase firm-quarters and EPS increasing discretionary current accruals not
classified as suspect in our main tests. In other words, we test whether our hypothesized trade-off
persists for non-suspect repurchase and non-suspect accrual firm-quarters. Untabulated results show
that high audit quality is not significantly related to non-suspect repurchase or accrual firm-quarters,
providing evidence that our main tests are not capturing a general relation.
Second, we adopt an approach similar to Ayers et al. (2006) by examining whether a trade-off
between suspect repurchases and suspect accruals exists where the change in EPS is the difference
between meeting or beating pseudo earnings targets set at five cents above or below analysts’
forecasts. If the results from our main tests are unrelated to analysts’ forecasts, we would expect the
results around pseudo targets to be similar to the results occurring around analysts’ forecasts.
Unlike the results from our main tests, untabulated results for high audit quality are insignificant
using pseudo targets, providing further evidence that efforts to meet or beat analysts’ forecasts are
an important aspect of our study.
A second concern stems from the fact that auditor scrutiny is likely more rigorous during the
fourth quarter (Brown and Pinello 2007) and, therefore, fourth quarter observations could be
driving our main results. However, audit quality is likely to affect the first three quarters for at least
two reasons. First, technological advancements in auditing reduce the seasonality of auditing by
facilitating timely interim reviews and reducing year-end workloads (Shu 2000). Second, managers’
accrual choices during the first three quarters are likely affected by expectations of higher audit
scrutiny at year-end. We ensure that our main results are not driven by observations from the fourth
quarter by re-estimating our main tests using only the first three fiscal quarters during which auditor
oversight may be less stringent. Results are qualitatively similar for the first three quarters, which
provides evidence that high audit quality is associated with our suggested trade-off even in quarters
with less stringent auditor scrutiny.
VI. IMPLICATIONS AND CONCLUSION
We examine whether audit quality affects managers’ choices between accrual-based earnings
management and accretive stock repurchases. We provide consistent evidence that firms that
engage high-quality auditors are more likely to use accretive stock repurchases and less likely to
manage accruals to meet or beat consensus analysts’ forecasts. Combined, our findings suggest that
managers faced with high audit quality trade off the use of accretive stock repurchases with
accrual-based earnings management to meet or beat analysts’ forecasts.
Our findings have at least three implications for corporate governance. First, our findings
provide evidence that the decision to hire high audit quality to combat accrual-based earnings
management is associated with an unintended consequence: the increased use by managers of at
least one real earnings management mechanism—accretive stock repurchases. Firms choose high
audit quality to signal earnings quality and corporate governance effectiveness. This signal becomes
obfuscated when the use of real earnings management is elevated.
Audit Quality, Accretive Stock Repurchases, and Accrual-Based Earnings Management 1879
The Accounting ReviewNovember 2012

Second, if managers circumvent high audit quality through the use of this real earnings
management technique, then other governance mechanisms, especially those limiting manage-
ment’s ability to use real earnings management to influence firm performance measures, might be
considered concurrently with the decision to engage a high-quality auditor. Corporate boards and
audit committees may wish to consider compensation-related issues and other contractual features
for managers that constrain firm value-decreasing behaviors of management.
Finally, the use of accretive repurchases to meet or beat EPS benchmarks potentially deviates
from ‘‘business as usual,’’ which may have negative consequences to the short- and long-term
performance of the firm. Often, accretive stock repurchases involve a substantial number of shares
and firms face significant opportunity costs from the loss of resources used in accretive stock
repurchases. This is especially problematic when repurchases alter normal business practices.
Although not formally tested in this paper, accretive repurchases used as a real earnings
management tool could potentially have unfavorable implications for a firm’s current and future
operating performance and could impose unnecessary costs on the firm and its shareholders.13
REFERENCES
Armstrong, C. S., A. D. Jagolinzer, and D. F. Larcker. 2010. Chief executive officer equity incentives and
accounting irregularities. Journal of Accounting Research 48: 225–271.
Ayers, B. C., J. Jiang, and P. E. Yeung. 2006. Discretionary accruals and earnings management: An analysis
of pseudo earnings targets. The Accounting Review 81 (3): 617–652.
Balsam, S., J. Krishnan, and J. S. Yoon. 2003. Auditor industry specialization and earnings quality.
Auditing: A Journal of Practice & Theory 22 (2): 71–97.
Barton, J., and P. Simko. 2002. The balance sheet as an earnings management constraint. The AccountingReview 77 (Supplement): 1–27.
Bartov, E. 1993. The timing of asset sales and earnings manipulations. The Accounting Review 68 (4): 840–
855.
Bartov, E., D. Givoly, and C. Hayn. 2002. The rewards to meeting or beating earnings expectations. Journalof Accounting and Economics 33:173–204.
Beaver, W., M. McNichols, and K. Nelson. 2007. An alternative interpretation of the discontinuity in
earnings distributions. Review of Accounting Studies 12: 525–556.
Bedard, J., and S. Biggs. 1991. The effect of domain-specific experience on evaluation of management
representation in analytical procedures. Auditing: A Journal of Practice & Theory (Supplement) 77–
95.
Bens, D. A., V. Nagar, and M. H. F. Wong. 2003. Employee stock options, EPS dilution, and stock
repurchases. Journal of Accounting and Economics 36: 51–90.
Brown, L. D., and M. L. Caylor. 2005. A temporal analysis of quarterly earnings thresholds: Propensities
and valuation consequences. The Accounting Review 80 (2): 423–440.
Brown, L. D., and A. S. Pinello. 2007. To what extent does the financial reporting process curb earnings
surprise games? Journal of Accounting Research 45 (5): 947–981.
Burgstahler, D., and M. Eames. 2006. Management of earnings and analysts’ forecasts to achieve zero and
small positive earnings surprises. Journal of Business, Finance and Accounting 33 (5-6): 633–652.
Chi, W., L. L. Lisic, and M. Pevzner. 2011. Is enhanced audit quality associated with greater real earnings
management? Accounting Horizons 25 (2): 315–335.
Cohen, D. A., S. Pandit, C. Wasley, and T. Zach. 2011. Measuring real activity management. Available at:
http://ssrn.com/abstract¼1792639
13 Cohen and Zarowin (2010) find that firms that engage in real earnings management prior to a seasoned equityoffering suffer significant performance declines after the offering period. Conversely, Gunny (2010) providesevidence that real earnings management to meet earnings benchmarks signals positive future performance.
1880 Burnett, Cripe, Martin, and McAllister
The Accounting ReviewNovember 2012
Cohen, D. A., and P. Zarowin. 2010. Accrual-based and real earnings management activities around
seasoned equity offerings. Journal of Accounting and Economics 50 (1): 2–19.
Cook, D., L. Krigman, and C. Leach. 2003. An analysis of SEC guidelines for executing open market
repurchases. The Journal of Business 76: 289–316.
Cook, K. A., G. R. Huston, and T. C. Omer. 2008. Earnings management through effective tax rates: The
effects of tax-planning investment and the Sarbanes-Oxley Act of 2002. Contemporary AccountingResearch 25: 447–471.
Copeland, T., T. Koller, and J. Murrin. 2000. Valuation: Measuring and Managing the Value of Companies.
New York, NY: Wiley.
DeAngelo, L. 1981. Auditor size and auditor quality. Journal of Accounting and Economics 3: 183–199.
Dechow, P. M., S. A. Richardson, and I. Tuna. 2003. Why are earnings kinky? An examination of the
earnings management explanation. Review of Accounting Studies 8: 355–384.
DeFond, M., and J. Jiambalvo. 1994. Debt covenant violation and manipulation of accruals. Journal ofAccounting and Economics 17: 145–76.
Dhaliwal, D. S., C. A. Gleason, and L. F. Mills. 2004. last-chance earnings management: Using the tax
expense to meet analysts’ forecasts. Contemporary Accounting Research 21: 431–459.
Dunn, K., and B. Mayhew. 2004. Audit firm industry specialization and client disclosure quality. Review ofAccounting Studies 9: 35–58.
Francis, J. R., K. Reichelt, and D. Wang. 2005. The pricing of national and city-specific reputations for
industry expertise in the U.S. audit market. The Accounting Review 80 (1): 113–136.
Gleason, C. A., and L. F. Mills. 2008. Evidence of differing market responses to beating analysts’ targets
through tax expense decreases. Review of Accounting Studies 13: 295–318.
Graham, J. C., C. Harvey, and S. Rajgopal. 2005. The economic implications of corporate financial
reporting. Journal of Accounting and Economics 40: 3–73.
Graham, J. R., and L. Mills. 2008. Simulating marginal tax rates using tax return data. Journal ofAccounting and Economics 46: 366–388.
Grullon, G., and D. Ikenberry. 2000. What do we know about stock repurchases? Journal of AppliedCorporate Finance 13: 31–51.
Guenther, D. A. 1994. Earnings management in response to corporate tax rate changes: Evidence from the
1986 Tax Reform Act. The Accounting Review 69: 230–243.
Gul, F., S. Fung, and B. Jaggi. 2009. Earnings quality: Some evidence on the role of auditor tenure and
auditors’ industry expertise. Journal of Accounting and Economics 47: 265–287.
Gunny, K. 2010. The relation between earnings management using real activities manipulation and future
performance: Evidence from meeting earnings benchmarks. Contemporary Accounting Research 27
(3): 855–888.
Healy, P., and J. Wahlen. 1999. A review of the earnings management literature and its implications for
standard setting. Accounting Horizons 13 (December): 365–383.
Hogan, C. E., and D. C. Jeter. 1999. Industry specialization by auditors. Auditing: A Journal of Practice &Theory 18 (Spring): 1–17.
Hribar P., N. T. Jenkins, and W. B. Johnson. 2006. Stock repurchases as an earnings management device.
Journal of Accounting and Economics 41: 3–27.
Kasznik, R., and M. F. McNichols. 2002. Does meeting earnings expectations matter? Evidence from
analyst forecast revisions and share prices. Journal of Accounting Research 40 (3): 727–759.
Krishnan, G. V. 2003. Does Big 6 auditor industry expertise constrain earnings management? AccountingHorizons 17(Supplement): 1–16.
Lawrence, A., M. Minutti-Meza, and P. Zhang. 2011. Can Big 4 versus Non-Big 4 differences in audit-
quality proxies be attributed to client characteristics? The Accounting Review 86 (1): 259–286.
Louis, H. 2004. Earnings management and the market performance of acquiring firms. Journal of FinancialEconomics 74: 121–148.
Matsunaga, S. R., and C. W. Park. 2001. The effect of missing a quarterly earnings benchmark on the
CEO’s annual bonus. The Accounting Review 76 (3): 313–332.
Audit Quality, Accretive Stock Repurchases, and Accrual-Based Earnings Management 1881
The Accounting ReviewNovember 2012

O’Keefe, T. B., R. King, and K. Gaver. 1994. Audit fees, industry specialization, and compliance with
GAAS reporting standards. Auditing: A Journal of Practice & Theory 13 (2): 41–55.
Payne, J., and S. W. G. Robb. 2000. Earnings management: The effect of ex ante earnings expectations.
Journal of Accounting, Auditing, and Finance (Fall): 371–392.
Reichelt, K., and D. Wang. 2010. National and office-specific measures of auditor industry expertise and
effects on audit quality. Journal of Accounting Research 48 (3): 647–686.
Romanus, R. N., J. Maher, and D. Fleming. 2008. Auditor industry specialization, auditor changes, and
accounting restatements. Accounting Horizons 22 (4): 389–413.
Roychowdhury, S. 2006. Earnings management through real activities manipulation. Journal of Accountingand Economics 42: 335–370.
Shu, S. Z. 2000. Auditor resignations: Clientele effects and legal liability. Journal of Accounting andEconomics 29 (April): 173–205.
Skinner, D. J. 2008. The evolving relation between earnings, dividends, and stock repurchases. Journal ofFinancial Economics 87: 582–609.
Skinner, D. J., and R. G. Sloan. 2002. Earnings surprises, growth expectations, and stock returns or don’t let
an earnings torpedo sink your portfolio. Review of Accounting Studies 7: 289–312.
Stephens, C. P., and M. J. Weisbach. 1998. Actual share reacquisitions in open-market repurchase
programs. The Journal of Finance 53:313–334.
Teoh, S. H., I. Welch, and T. J. Wong. 1998. Earnings management and the long-run market performance of
initial public offerings. Journal of Finance 53: 1935–1974.
Vermaelen, T. 2005. Share repurchases. Foundations and Trends in Finance 1 (3): 171–268.
Zang, A. 2012. Evidence on the trade-off between real activities manipulation and accrual-based earnings
management. The Accounting Review 87 (2): 675–703.
APPENDIX A
VARIABLE DESCRIPTIONS
Abs. DACCi,t�1 ¼ absolute value of a firm’s previous quarter discretionary accruals;
ACTUAL_FEi,t ¼ firm’s reported EPS minus its final consensus analysts’ forecast;
Agei,t ¼ log of the number of years a firm has been on Compustat, beginning in 1950;
ASIF_EPS1i,t ¼ firm’s estimated EPS absent accretive stock repurchases calculated as:
NIi;t þ Ci;t
SHARESOUTi;t�1 þ 0:5�SHARESISSUEDi;t;
ASIF_EPS2i,t ¼ firm’s estimated EPS absent accretive stock repurchases that incorporates
expected repurchases, calculated as:
ðNIi;t þ Ci;tÞSHARESOUTi;t�1 þ ð0:5�SHARESISSUEDi;tÞ �
�0:5�EðREPURCHASEi;tÞ
�h i ;
ASIF_EPS_ACCRUALSi,t¼ firm’s estimated EPS absent current discretionary accruals, net of
income taxes, calculated as:
NIi;t � DACCi;tð1� Ti;tÞWeighted Average SHARESOUTi;t
;
ASIF_FE1i,t ¼ firm’s estimated pre-repurchase forecast error, calculated as: ACTUAL_FEi,t �EPSImpact1i,t;
ASIF_FE2i,t ¼ firm’s estimated pre-repurchase forecast error that incorporates expected
repurchases, calculated as: ACTUAL_FEi,t � EPSImpact2i,t;
1882 Burnett, Cripe, Martin, and McAllister
The Accounting ReviewNovember 2012

ASIF_FE_ACCRUALSi,t ¼ firm’s estimated pre-discretionary current accrual forecast error,
calculated as: ACTUAL_FEi,t � EPSImpact1_ACCRUALSi,t;
Asset Turnoveri,t ¼ firm’s quarterly sales divided by total assets (ATQ);
Ci,t¼ estimated forgone dollar return on cash used for accretive stock repurchases. When a firm
has excess cash, the forgone return is estimated as excess cash multiplied by the three-
month Treasury bill rate. Excess cash is estimated as cash balances in excess of 6 percent
of assets for retail firms and 2 percent of assets for all other firms (Copeland et al. 2000). If
excess cash is less than the repurchase dollar amount, then the forgone return is estimated
as the firm’s average interest rate multiplied by the incremental funds borrowed;
CAPEXi,t�4,t�1¼ firm’s capital expenditures during the previous year ending at the beginning
of the quarter, scaled by total assets (ATQ);
Cashi,t�1¼ firm’s cash and cash equivalents (CHEQ) at the beginning of the quarter, scaled by
total assets (ATQ);
Current Accrualsi,t ¼ difference between quarterly income before extraordinary items (IBQ)
and quarterly operating cash flows (OANCFY, adjusted to quarterly) less depreciation and
amortization expense (DPQ);
DACCi,t ¼ difference between the actual reported current accruals and the estimated current
accruals from the current discretionary accrual model rescaled by lagged total assets
(ATQi,t�1);
Debti,t�1¼ firm’s total debt (DLTTQþDLCQ) at the beginning of the quarter, scaled by total
assets (ATQ);
Dividend Yieldi,t�1¼firm’s dividend payment during the previous year ending at the beginning
of the quarter, scaled by its quarter-end share price (PRCCQ);
EPSImpact1i,t ¼ effect of share repurchases on EPS, calculated as: ReportedEPSi,t �ASIF_EPS1i,t;
EPSImpact2i,t¼ effect of unexpected share repurchases on EPS, calculated as: ReportedEPSi,t
� ASIF_EPS2i,t;
EPSImpact1_ACCRUALSi,t ¼ effect of discretionary accruals on EPS, calculated as:
ReportedEPSi,t � ASIF_EPS_ACCRUALSi,t;
E(REPURCHASEi,t) ¼ expected number of shares to be repurchased at the beginning of the
quarter based on the two-stage estimation procedure detailed in the ‘‘Controlling for
Expected Repurchases’’ section;
Forecast Dispersioni,t¼ standard deviation of analysts’ forecasts that comprise the consensus
forecast;
HAQi,t ¼ 1 where the auditor is identified as the industry specialist, otherwise 0;
Litigationi,t ¼ 1 for firms with the following SIC codes (2833–2836), (3570–3577), (3600–
3674), (5200–5961), or (7370), otherwise 0;
MTBi,t¼ firm’s end-of-quarter market value of equity (CSHOQ � PRCCQ), scaled by its book
value of equity (ATQ � LTQ � PSTKQ);
NIi,t ¼ firm’s reported earnings before extraordinary items available to common shareholders
for the firm-quarter (IBCOMQ);
ReportedEPSi,t ¼ firm’s earnings per share as reported for the quarter;
REPURCHASEi,t,(t�1),ft�2g ¼ 1 where a firm was a net repurchase in the previous quarter (t�1)
or two quarters prior (t�2), otherwise 0;
ROAi,t ¼ earnings before extraordinary items (IBQ), scaled by total assets (ATQ);
SHARESISSUEDi,t¼ actual or estimated number of common stock shares issued during a firm-
quarter, depending on data availability;
Audit Quality, Accretive Stock Repurchases, and Accrual-Based Earnings Management 1883
The Accounting ReviewNovember 2012

SHARESOUTi,t�1 ¼ reported number of diluted common shares outstanding if analysts’
forecast diluted EPS, otherwise primary common shares outstanding, at the beginning of
the firm-quarter;
Sizei,t�1 ¼ firm’s total assets (ATQ) at the beginning of the quarter;
SUSPECT_REPURCHASE1i,t ¼ indicator variable indicating whether the firm meets or beats
analysts’ consensus forecasts using share repurchases, equal to 1 if ASIF_FE1 is ��$0.05, but , $0.00 and ACTUAL_FE is � $0.00, but � $0.05, otherwise 0;
SUSPECT_REPURCHASE2i,t ¼ indicator variable indicating whether the firm meets or beats
analysts’ consensus forecasts using unexpected share repurchases, equal to 1 if ASIF_FE2is � �$0.05 and , $0.00 and ACTUAL_FE is � $0.00 and � $0.05, otherwise 0;
SUSPECT_ACCRUALSi,t ¼ indicator variable indicating whether the firm meets or beats
analysts’ consensus forecasts using discretionary accruals, equal to 1 if ASIF_FE_AC-CRUALS ��$0.05, but , $0.00 and ACTUAL_FE is � $0.00, but � $0.05, otherwise 0;
and
Weighted Average SHARESOUTi,t ¼ weighted average diluted common shares outstanding if
analysts’ forecast diluted EPS (CSHFDQ), otherwise primary common shares outstanding
(CSHPRQ).
1884 Burnett, Cripe, Martin, and McAllister
The Accounting ReviewNovember 2012

Reproduced with permission of the copyright owner. Further reproduction prohibited without permission.