augmenting physician examiner (pe) scoring in ... - mcc.ca · sp and pe scoring were assessed using...
TRANSCRIPT

Augmenting Physician Examiner (PE) Scoring in OSCEs: A Pilot for Including the
Standardized Patient (SP) Perspective
Marguerite Roy
Josée Wojcik
Ilona Bartman
Sydney Smee
Medical Council of Canada

SP Scoring 2
Abstract
In the Canadian context OSCEs have traditionally relied solely on physician examiners (PEs) for
scoring. This pilot study explores benefits of adding standardized patient (SP) to PE scoring in a
high-stakes national OSCE.
SPs were consulted to develop rating scales for Listening, Communication, Empathy/Rapport,
plus a station global. Forty-three SPs from one site of a national OSCE rated 60 candidates along
with PEs. SP scoring was examined using descriptive statistics and correlations. Combinations of
SP and PE scoring were assessed using pass-rates, reliability, and decision consistency and
accuracy indices.
SP ratings differed somewhat from examiner ratings and we argue assess performance from a
different perspective, thereby increasing the available data and overall reliability of scores and
pass decisions.
SP Scoring 3
Background
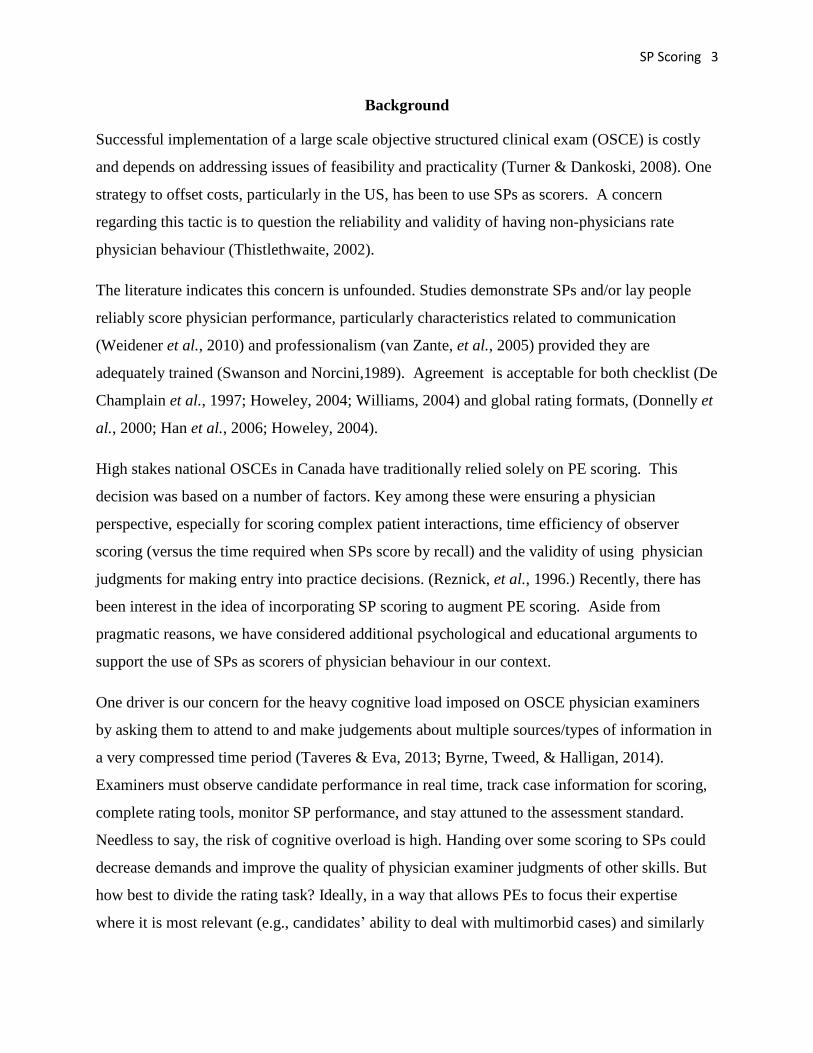
Successful implementation of a large scale objective structured clinical exam (OSCE) is costly
and depends on addressing issues of feasibility and practicality (Turner & Dankoski, 2008). One
strategy to offset costs, particularly in the US, has been to use SPs as scorers. A concern
regarding this tactic is to question the reliability and validity of having non-physicians rate
physician behaviour (Thistlethwaite, 2002).
The literature indicates this concern is unfounded. Studies demonstrate SPs and/or lay people
reliably score physician performance, particularly characteristics related to communication
(Weidener et al., 2010) and professionalism (van Zante, et al., 2005) provided they are
adequately trained (Swanson and Norcini,1989). Agreement is acceptable for both checklist (De
Champlain et al., 1997; Howeley, 2004; Williams, 2004) and global rating formats, (Donnelly et
al., 2000; Han et al., 2006; Howeley, 2004).
High stakes national OSCEs in Canada have traditionally relied solely on PE scoring. This
decision was based on a number of factors. Key among these were ensuring a physician
perspective, especially for scoring complex patient interactions, time efficiency of observer
scoring (versus the time required when SPs score by recall) and the validity of using physician
judgments for making entry into practice decisions. (Reznick, et al., 1996.) Recently, there has
been interest in the idea of incorporating SP scoring to augment PE scoring. Aside from
pragmatic reasons, we have considered additional psychological and educational arguments to
support the use of SPs as scorers of physician behaviour in our context.
One driver is our concern for the heavy cognitive load imposed on OSCE physician examiners
by asking them to attend to and make judgements about multiple sources/types of information in
a very compressed time period (Taveres & Eva, 2013; Byrne, Tweed, & Halligan, 2014).
Examiners must observe candidate performance in real time, track case information for scoring,
complete rating tools, monitor SP performance, and stay attuned to the assessment standard.
Needless to say, the risk of cognitive overload is high. Handing over some scoring to SPs could
decrease demands and improve the quality of physician examiner judgments of other skills. But
how best to divide the rating task? Ideally, in a way that allows PEs to focus their expertise
where it is most relevant (e.g., candidates’ ability to deal with multimorbid cases) and similarly

SP Scoring 4
solicits SP judgement in areas where their perspective is important (e.g., communication,
patient’s comfort, etc.).
Within our national OSCE, a second reason to incorporate SP scoring stems from upcoming
changes to our blueprint that reflect increased assessment of communication and professionalism
competencies; again, areas where the SP perspective may be critical to incorporate.
Finally, a third reason is the potential to provide feedback to examinees from two perspectives:
that of a physician or medical expert observer and that of a patient or end user. Gingerich (2013)
has convincingly argued that score differences between assessors or between assessor groups
may reflect different but valid differences in assessor perspective. Thus, providing candidates
with both SP and PE feedback, even if the two perspectives potentially differ, could be valuable.
The purpose of this study was to develop and pilot training materials and scoring tools for
introducing SP scoring into a national OSCE designed to assess the knowledge, skills, and
attitudes essential for medical licensure in Canada prior to entry into independent clinical
practice. Acceptability of including SP scoring in our OSCE was assessed through a survey. This
was followed by a series of SP focus groups to identify specific scoring dimensions and to
develop scoring tools and training materials. Finally, to explore the feasibility and impact of SP
scoring we ran a pilot at a single examination site during a national OSCE administration.
Method
SP Tool Development
SPs from the survey were invited to participate in follow-up focus groups. Four groups were
conducted across the country to explore SPs’ ideas about scoring candidate performance.
Participants identified physician characteristics they felt comfortable assessing and developed
assessment tools for each. These were used to score a videotaped performance. The tools were
improved where needed and SPs elaborated on training needs. All four groups identified
listening skills and empathy/rapport as dimensions they could assess. Three groups identified
communication and a global impression as important to them. Rating scales were developed with
descriptors adopted from SP discussions. The SP rating tools that we piloted are depicted in
Figure 1.

SP Scoring 5
SP Training Development
SP training occurred at several intervals. First, they received an introduction to SP scoring at
their first case training session. This was followed by a mandatory online training module
lasting approximately 30 minutes with information regarding the purpose of the pilot, an
overview of the scoring tools, direction on how to complete the scoring sheet, and a video
scoring exercise that compared their ratings to target ratings. This online training was followed
with more scoring practice, discussion and standardization at case dry run. Finally, on exam day
there were important reminders provided orally and in writing.
Participants
For the pilot, 60 candidates were rated by 43 SPs. Most examinees were female (53%) first-time
examinees (62%). A large proportion of examinees were international medical graduates (74%).
Participating SPs were balanced by gender across stations. The age of their patient portray
ranged from 14 to 76 years-of-age. On average, SPs scored between 18 and 26 examinees.
Procedure
SPs used all four rating scales to score examinees for 12 OSCE stations. All examinees were
blinded to the inclusion of SP scoring. SPs completed their ratings once an examinee had left the
station and before the next examinee entered. Both PEs and SPs were instructed to complete
their ratings independently and not to discuss the performance of any examinees.
Results
SP Use of Rating Scales
Figure 2 displays the average percent of ratings SPs assigned to each of the five score points
(e.g., unacceptable, poor, adequate, good, excellent) across the 12 stations. SP ratings were
negatively skewed but covered the entire score scale range for each of the rating scales. The
pattern of ratings varied across the dimensions. Figure 3 shows that the average pattern of SP
ratings varied according to the type of station (e.g., management, counselling, history or
physical) being rated. Overall SPs appear to be using the rating scales as intended.
SP and PE Station, Total, and Dimension Scores

SP Scoring 6
SP station scores were calculated by averaging the four ratings within each station and creating a
percent score. Generally, SPs scores were higher than PEs (see Figure 4); however, the
magnitude of difference varied across stations and was especially large for counselling stations
(Figure 5).
SP total examination scores were created by averaging 12 station scores. SPs scored more
broadly than PEs (Figure 6). An important point to keep in mind is that some of the dimensions
PEs scored overlapped with SP scoring (e.g., PEs also rated rapport and listening for some
stations).
Table 1 displays the inter-correlations among SP and PE total examination and dimension scores.
SP scores are highly related with relationships ranging from r(58) = 0.87, p < .05 to r(58) 0.99, p
< .05). SP total scores were highly related but not identical to PE total scores (r(58) 0.74, p < .05).
Interestingly the relationship between SP total and PE score dimensions were high (PE patient
interaction ratings (r(58) = 0.88, p < .05 and PE clinical legal ethical and organizational ratings
(r(58) = 0.81, p < .05) and low (PE problem solving ratings (r(58) = 0.24, , p > .05) and PE data
acquisition ratings (r(58) = 0.35, p < .05) where one would expect.
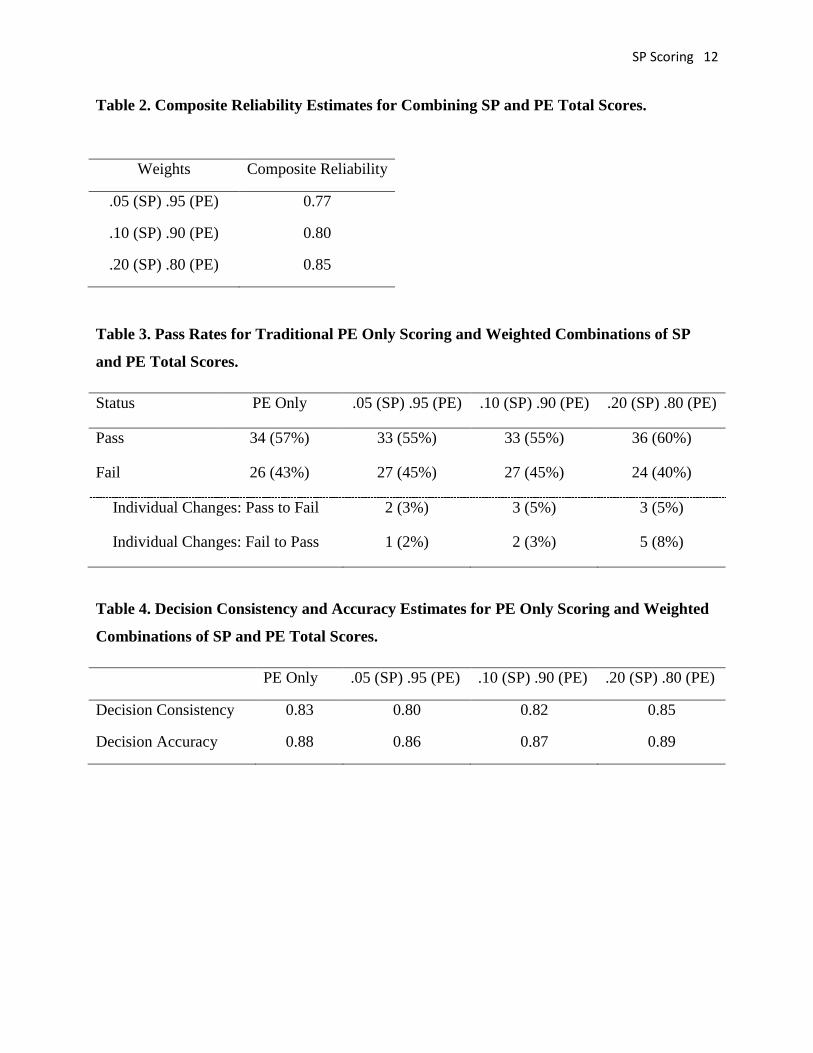
Combining SP and PE Total Scores
Cronbach’s alpha for the 12 station scores indicated adequate internal consistency for both SP (
= 0.87) and PE scores ( = 0.73). Composite reliability (Haertel, 2006) of various combined
weightings of SP and PE total scores (Table 2) increases from 0.77 with SP scoring contributing
5% to 0.85 with SP scoring contributing 20% to the total score.
Pass-rates, Decision Consistency and Accuracy
The pass-rate based on the traditional PE-only scoring was 57%. Table 3 shows how this rate
changed and the number of individual candidate status changes for various weighted
combinations of SP and PE scoring when the established cut score was applied to these new total
scores. When SP scoring contributed 5% to candidate total scores there was a slight decrease in
the original pass rate with 3 individual candidates changing status. Weighting SP scoring by 20%
resulted in a slightly higher pass rate and altered the status of 8 individual candidates.

SP Scoring 7
Decision consistency and accuracy indices for weighted combinations of SP and PE scores were
calculated (Livingston & Lewis, 1995). The outcomes of this analysis (Table 4) indicate very
modest fluctuations in both metrics across various weightings.
Combining SP and Non-overlapping PE Scores
In addition to examining the value of combining SP with traditional PE scoring, we investigated
the impact of dividing up the scoring into SP-specific ratings and non-overlapping PE scoring,
what we call complimentary scoring. We kept SP scoring as is. We reviewed PE scoring
elements and removed all instances where PE ratings overlapped with ratings provided by SPs.
This amounted to removing all instances (N = 16) of PE ratings for listening and rapport.
Distributions for SP total and new Non-overlapping PE total scores (Figure 7) indicate less
overlap between the two perspectives when compared to that with redundant coding. The
correlation between the SP total and the non-overlapping PE total scores was reduced
(r(58)=0.64, p< .05).
New station and total scores were created by combining SP scores with non-overlapping PE
items (complimentary scoring). Cronbach’s alpha (see Table 5) indicate high internal consistency
( = 0.82) when all four SP ratings are combined with non-overlapping PE scoring elements.
The impact of including SP scoring in this complimentary manner was to increase the fail
percentage from 8 to 10% (Table 6). Bear in mind that this result is based on applying an
existing cut score developed from our traditional PE scoring model to this new combined total.
Minor variations appear in decision consistency and accuracy (Table 7) when all four SP scoring
elements are combined with non-overlapping PE scoring elements. Other variations show larger
losses, particularly for decision consistency. Combining all four SP scoring elements with the
non-overlapping PE scoring to create a complementary total score yields high internal
consistency, a higher fail rate, and comparable decision consistency and accuracy.
Post-Exam Survey and Focus Group
We conducted post-examination surveys of SPs and PEs who participated in this pilot and held a
focus group of a representative sample of SPs who participated in this pilot. Both SPs and PEs
affirmed that they had followed “the rules” of scoring (no discussion of candidates; independent

SP Scoring 8
scoring). SPs indicated that they had adequate time to complete their ratings in our OSCE
context. PEs reported that they did not find the process disruptive to their scoring
responsibilities. No major hiccups were reported at the pilot site. Some minor modifications were
suggested for the SP listening and global rating tool.
Conclusions
These results are to be interpreted with caution. They are based on a pilot at a single site using a
cut-score that was established based on the traditional PE-only scoring model. Early analysis
revealed that SPs were comfortable scoring candidates and made appropriate use of rating tools.
They used the full range of each scale and showed different patterns of ratings for different
stations and station types. The relationships between SP and PE scoring made sense, with
stronger relationships for conceptually related and redundant elements.
Combining SP and PE scoring at a total score led to increased reliability and comparable
pass/fail decisions with little impact on decision consistency or accuracy. When complimentary
combinations of SP and PE scoring were examined internal consistency improved, fail rates
increased, and decision consistency and accuracy were virtually identical. The impact for PEs of
unloading some of their task to SPs remains unknown but could theoretically increase their
mental resources and ability to focus on a simplified task. Among many other questions, this
issue requires further investigation.

SP Scoring 9
References
Byrne, A., Tweed, N., & Halligan, C. (2014). A pilot study of the mental workload of objective
structured clinical examination examiners. Medical Education, 48,262-267.
De Champlain, A.F.,Margolis, M.J., King, A., & Klass, D.J. (1997). Standardized patients’
accuracy in recording examinees’ behaviours using checklists, Academic Medicine, 72(10), 9-23.
Donnelly, M.B., Sloan, D., Plymale M., & Schwartz, R. (2000). Assessment of residents’
interpersonal skills by faculty proctors and standardized patients: A psychometric analysis.
Academic Medicine, 75(10), Supplement.
Han J.J, Kreiter C.D., Park H.,& Ferguson K.J.(2006). An experimental comparison of rater
performance on an SP-based clinical skills exam. Teaching and Learning in Medicine, 18(4),
304-9.
Haertel, E.H. (2006). Reliability. In R.L. Brennan (Ed.), Educational measurement (4th
ed., pp.
65-110). Westport, CT: Praeger Publishers.
Howley, L.D. (2004). Performance assessment in medical education; Where we’ve been and
Gingrich, A. (2013). Assessor cognition as meaningfully idiosyncratic. Paper presented at the
52nd Annual Conference on Research in Medical Education (RIME), November,
Philadelphia.
Livingston, S.A., & Lewis, C. (1995). Estimating the consistency and accuracy of classifications
based on test scores. Journal of Educational Measurement, 32,(2), 179-197.
Reznick, R.K., Blackmore, D.E., Dauphinee, W.D., et al. (1996) Large-scale High Stakes
Testing with a n OSCE: Report from the Medical Council of Canada. Academic Medicine 71
(Supplement) S19-21.
Swanson, D. B. & Norcini, J. J. (1989). Factors influencing the reproducibility of tests using
standardized patients. Teaching and Learning in Medicine 1, 158–166.
Tavares, W., & Eva, K.W. (2013). Exploring the impact of mental workload on rater-based
assessments. Advances in Health Sciences Education, 18(2), 291-303.

SP Scoring 10
Thistlethwaite, J. E. (2002). Developing an OSCE station to assess the ability of medical students
to share information and decisions with patients: Issues relating to interrater reliability and the
use of simu-lated patients. Education for Health, 15, 170-179.
Turner, J.L., & Dankoski, M. (2008). Objective structured clinical exams: A critical review.
Family Medicine, 40, 574-578.
van Zanten, M., Boulet, J.R., Norcini, J.J., & McKinley, D. (2005). Using a standardised patient
assessment to measure professional attribuites. Medical Education, 39, 20-29.
Weidner, A.C., Gimple, J.R., Boulet, J.R., & Solomon, M. (2010). Using standardized patients
to assess the communication skills of graduating physicians for the comprehensive osteopathic
medical licencing examination (COMLEX) level 2- performance evaluation (Level 2-PE).
Teaching and Learning in Medicine, 22(1), 8-15.
Williams R.G. (2004). Have standardised patient examinations stood the test of time and
experience? Teaching and Learning in Medicine, 16(2), 215–22.

SP Scoring 11
Table 1. Pearson Correlations Between SP and PE Total Scores and Score Dimensions
Comm (SP) Rapport (SP) Overall (SP) Total (SP) Total (PE) Pat Inter (PE) CLEO (PE) Prob Sol (PE) Data Acq (PE)
Listening (SP) 0.94* 0.87* 0.93* 0.96* 0.65* 0.81* 0.72* 0.16 0.29
Communication
(SP) 0.90* 0.96* 0.98* 0.78* 0.87* 0.81* 0.30 0.44*
Rapport (SP)
0.94* 0.96* 0.67* 0.80* 0.77* 0.21 0.27
Overall (SP) 0.99* 0.74* 0.86* 0.81* 0.26 0.36*
Total (SP) 0.74* 0.86* 0.81* 0.24 0.35*
Total (PE) 0.86* 0.85* 0.69* 0.75*
Patient Interact (PE) 0.89* 0.30* 0.47*
CLEO (PE) 0.34* 0.46*
Problem Solving
(PE) 0.50*
Note. * indicates observed alpha < 0.05
SP Scoring 12
Table 2. Composite Reliability Estimates for Combining SP and PE Total Scores.
Weights Composite Reliability
.05 (SP) .95 (PE) 0.77
.10 (SP) .90 (PE) 0.80
.20 (SP) .80 (PE) 0.85
Table 3. Pass Rates for Traditional PE Only Scoring and Weighted Combinations of SP
and PE Total Scores.
Status PE Only .05 (SP) .95 (PE) .10 (SP) .90 (PE) .20 (SP) .80 (PE)
Pass 34 (57%) 33 (55%) 33 (55%) 36 (60%)
Fail 26 (43%) 27 (45%) 27 (45%) 24 (40%)
Individual Changes: Pass to Fail 2 (3%) 3 (5%) 3 (5%)
Individual Changes: Fail to Pass 1 (2%) 2 (3%) 5 (8%)
Table 4. Decision Consistency and Accuracy Estimates for PE Only Scoring and Weighted
Combinations of SP and PE Total Scores.
PE Only .05 (SP) .95 (PE) .10 (SP) .90 (PE) .20 (SP) .80 (PE)
Decision Consistency 0.83 0.80 0.82 0.85
Decision Accuracy 0.88 0.86 0.87 0.89

SP Scoring 13
Table 5. Cronbach’s alpha for various combinations of SP and PE scoring at the station
level.
Non-Overlapping PE
(remove listening & rapport)
SP All 4 Items 0.82
SP Communication & Rapport 0.78
SP Listening & Rapport 0.77
SP Overall Global 0.74
Table 6. Pass Rates for Traditional PE Only Scoring and Combinations of SP Elements and
Non-overlapping PE Total Scores.
Status PE Only PE Non-Overlap
& SP all 4 Items
PE Non-Overlap &SP
Com & Rapport
PE Non-Overlap
& SP Global
Pass 34 (57%) 29 (48%) 28(47%) 29 (48%)
Fail 26 (43%) 31 (52%) 32 (53%) 31 (52%)
Individual Changes: Pass to Fail 6 (10%) 6 (10%) 5 (8%)
Individual Changes: Fail to Pass 1 (2%) 0 0
Table 7. Decision Consistency and Accuracy Estimates for PE Only Scoring and
Combinations of SP Elements and Non-overlapping PE Total Scores.
PE Only PE Other &
SP all 4 Items
PE Other &SP
Commun &
Rapport
PE Other &
SP Global
Decision Consistency 0.83 0.82 0.79 0.76
Decision Accuracy 0.88 0.87 0.85 0.83

SP Scoring 14
Figure 1. SP Rating Tools.
Figure 2. Average Percent of SP Ratings by Dimension Across 12 Stations.
0
5
10
15
20
25
30
35
40
45
0 1 2 3 4
%
Listening
Communication
Empathy
Overall

SP Scoring 15
Figure 3. Average Percent of SP Ratings by Dimension by Station Type.
Figure 4. Mean Percent Station Score for SPs and PEs.
051015202530354045505560
0 1 2 3 4
Mgmt_list
Mgmt_comm
Mgmt_emp
Mgmt_oa
051015202530354045505560
0 1 2 3 4
Couns_list
Couns_comm
Couns_emp
Couns_oa
051015202530354045505560
0 1 2 3 4
History_list
History_comm
History_emp
History_oa
051015202530354045505560
0 1 2 3 4
Physical_list
Physical_comm
Physical_emp
Physical_oa

SP Scoring 16
Figure 5. Mean Percent Score for SPs and PE by Station Type.
Figure 6. Total Score Distribution for SPs and PEs.
0102030405060708090
100
SP PE
Sta
tion
Sco
re %
Rater
Management
History
Counselling
Physicial

SP Scoring 17
Figure 7. Score Distribution for SP and Non-overlapping PE Total Scores.
Figure 8. Updated SP Rating Tools.
0
1
2
3
4
5
6
7
8
1 4 7
10
13
16
19
22
25
28
31
34
37
40
43
46
49
52
55
58
61
64
67
70
73
76
79
82
85
88
91
94
97
100
SP PEOther