august 20, 2018 amy miller, pe national director orange
TRANSCRIPT

400 Shoppers Drive ■ P.O. Box 747 ■ Winchester, KY 40392-0747
Phone: (859) 744-1218 ■ Fax: (859) 744-1266 ■ Email: [email protected] ■ Web Site: www.palmernet.com
August 20, 2018 Amy Miller, PE National Director Asphalt Pavement Alliance 2233 Park Avenue, Suite 200U Orange Park, Florida 32073 Re: Verification of PaveXpress with 1993 and 1998 AASHTO Pavement Design Guide Dear Ms. Miller: Palmer Engineering was contracted by the Asphalt Pavement Alliance to complete a study comparing pavement designs within the AASHTO Guide for Design of Pavement Structures (AASHTO 1993) and Supplement to the AASHTO Guide for Design of Pavement Structures, Part II – Rigid Pavement and Rigid Pavement Joint Design (AASHTO 1998) to design procedures within the web-based program, PaveXpress, developed by the Asphalt Pavement Alliance. The attached memorandum report describes in detail the results of these analyses. The testing matrix for comparison of asphalt pavement designs involved the following:
• Four CBRs (2, 5, 7, and 11) were evaluated. The conversion from CBR to resilient modulus was determined on the basis of the relationship – 𝑀𝑀𝑅𝑅 = 2555 ∗ 𝐶𝐶𝐶𝐶𝐶𝐶.64 .
• Five levels of Equivalent Single Axleloads were evaluated (1,000,000, 5,000,000, 10,000,000, 20,000,000, and 50,000,000 ESALs).
• Two levels of reliability were evaluated – 90% Reliability and 95% Reliability • Initial Serviceability = 4.5 • Terminal Serviceability = 3.0 • Overall Standard Deviation = 0.45
The testing matrix for concrete pavements was predicated upon replicating selected concrete pavement designs presented in Tables 16 - 24 from the 1998 Supplement to the AASHTO Guide for Design of Pavement Structures, Part II – Rigid Pavement Design and Rigid Pavement Joint Design. The following design parameters were considered for development of comparative concrete pavement designs using PaveXpress with the pavement designs presented in the 1998 Supplemental Guide.
• Modulus of Subgrade Reaction k = 250 pci. The relationship 𝑘𝑘 = 𝑀𝑀𝑅𝑅19.4
and 𝑀𝑀𝑅𝑅 = 2555 ∗𝐶𝐶𝐶𝐶𝐶𝐶.64 were used to estimate a corresponding CBR for the comparative analysis − CBR = 2.73
• ESALs ranging from 1,000,000 to 100,000,000 were evaluated • Elastic Modulus of the Base Modulus was varied: • Joint Spacing was varied:

400 Shoppers Drive ■ P.O. Box 747 ■ Winchester, KY 40392-0747
Phone: (859) 744-1218 ■ Fax: (859) 744-1266 ■ Email: [email protected] ■ Web Site: www.palmernet.com
o 144 inches o 192 inches o 240 inches
• Flexural Strength of Concrete = 600 psi • Elastic Modulus for Concrete = 4,200,000 psi • Temperature Differential = 9 degrees • Overall Standard Deviation = 0.39 • Initial Serviceability = 4.0 • Terminal Serviceability = 2.5 • 12 foot lanes • Shoulders
o Tables 16 - 24 were based on 12-foot lanes with AC Shoulders o PaveXpress provides for an Input Parameter for Edge Support. Two values for
pavement edge support were evaluated: E = 1.0 (more indicative of Asphalt Shoulders) E=0.94 (more indicative of tied Concrete Shoulders)
The results of these analyses were summarized in both tabular format and graphical format. The analyses of the comparative analyses were highly consistent and typically within 5% for calculated Structural Numbers for AASHTO 1993 versus PaveXpress. The variations noted between the two methodologies are believed to be attributed to rounding and computational precision. When the results for PaveXpress were compared with the catalog of designs summarized in Tables 16 - 20 of the 1998 Supplement to the AASHTO Guide for Design of Pavement Structures, resulting slab thicknesses were consistently within ½ inch and in many cases were within ¼ inch. Both results are well within the range of thickness for construction of Portland Cement Concrete Pavements. In conclusion, our analysis confirmed that the calculations and results provided by PaveXpress are within acceptable tolerances of those results provided by both the AASHTO Guide for Design of Pavement Structures (AASHTO 1993) and Supplement to the AASHTO Guide for Design of Pavement Structures, Part II – Rigid Pavement and Rigid Pavement Joint Design (AASHTO 1998) and, in our professional opinion, PaveXpress calculates pavement designs consistent with the methodologies presented in AASHTO ’93 and ’98. We appreciate the opportunity to provide these services for the Asphalt Pavement Alliance. Sincerely,
Gary W. Sharpe, P.E., PLS Senior Project Manager Enclosure

1 | P a g e
Verification of PaveXpress with 1993 and 1998 AASHTO Pavement Design Guide
TO: Amy Miller, PE
National Director
Asphalt Pavement Alliance
2233 Park Avenue, Suite 200U
Orange Park, Florida 32073
FROM:
Gary W. Sharpe, P.E., PLS
Senior Project Manager
Palmer Engineering
DATE: August 3, 2018
SUBJECT: Verification of PaveXpress with 1993 and 1998 AASHTO
Pavement Design Guide
Scope of Project
As tasked by the Asphalt Pavement Alliance, Palmer Engineering has completed a study to
compare pavement designs per the AASHTO Guide for Design of Pavement Structures
(AASHTO 1993) and Supplement to the AASHTO Guide for Design of Pavement Structures,
Part II – Rigid Pavement and Rigid Pavement Joint Design (AASHTO 1998) design procedures
with the web based program, PaveXpress. The comparison includes both concrete and asphalt
designs, and compares both pavement types at varied subgrade soil strengths (𝑀𝑅 = 2555 ∗𝐶𝐵𝑅.64), as well as the corresponding moduli of subgrade reaction (𝑘 = 𝑀𝑅/19.4) for concrete
pavements, and varied equivalent single axle loads (ESALs). Palmer Engineering developed 80
designs, as follows: 20 concrete designs using both AASHTO 1993 and AASHTO 1998; 20
asphalt designs using AASHTO 1993; 20 asphalt designs and 20 concrete designs using
PaveXpress.
For Portland Cement Concrete pavements, Tables 16 - 17 - Slab thickness computed for granular
base and 95 percent Reliability, and Tables 19 - 20 - Slab thickness computed for granular base
and 90 percent Reliability, in the AASHTO 1998 supplement, were used to establish the slab
thickness based on AASHTO procedures. Palmer then compared the results of PaveXpress
designs determined using the same parameters of the AASHTO 1998 design.
2 | P a g e
Testing Matrix Asphalt Matrix
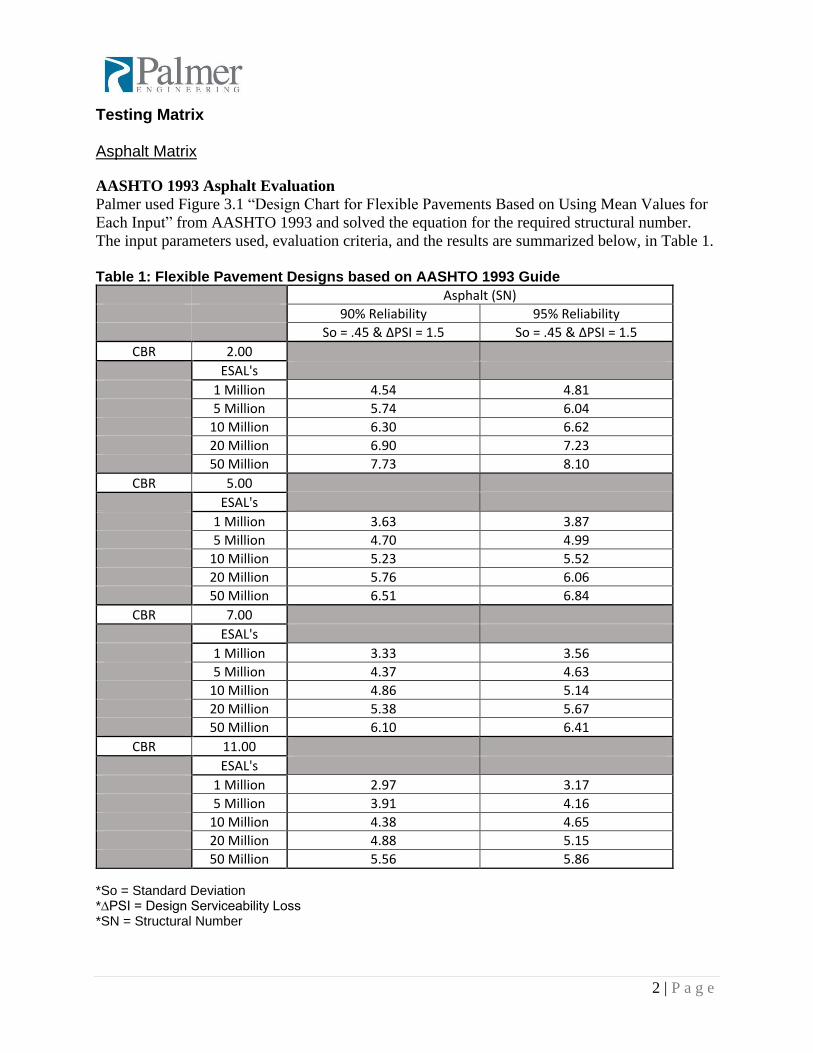
AASHTO 1993 Asphalt Evaluation
Palmer used Figure 3.1 “Design Chart for Flexible Pavements Based on Using Mean Values for
Each Input” from AASHTO 1993 and solved the equation for the required structural number.
The input parameters used, evaluation criteria, and the results are summarized below, in Table 1.
Table 1: Flexible Pavement Designs based on AASHTO 1993 Guide
Asphalt (SN)
90% Reliability 95% Reliability
So = .45 & ∆PSI = 1.5 So = .45 & ∆PSI = 1.5
CBR 2.00
ESAL's
1 Million 4.54 4.81
5 Million 5.74 6.04
10 Million 6.30 6.62
20 Million 6.90 7.23
50 Million 7.73 8.10
CBR 5.00
ESAL's
1 Million 3.63 3.87
5 Million 4.70 4.99
10 Million 5.23 5.52
20 Million 5.76 6.06
50 Million 6.51 6.84
CBR 7.00
ESAL's
1 Million 3.33 3.56
5 Million 4.37 4.63
10 Million 4.86 5.14
20 Million 5.38 5.67
50 Million 6.10 6.41
CBR 11.00
ESAL's
1 Million 2.97 3.17
5 Million 3.91 4.16
10 Million 4.38 4.65
20 Million 4.88 5.15
50 Million 5.56 5.86
*So = Standard Deviation *∆PSI = Design Serviceability Loss *SN = Structural Number

3 | P a g e
PaveXpress Asphalt Evaluation
The PaveXpress’s design evaluation matrix was set up similarly to the AASHTO 1993 matrix
shown in Table 1, the only difference being the additional inputs that were required in
PaveXpress. In addition to the parameters entered into the AASHTO 1993 equation, PaveXpress
required a design period to be entered, as well as the initial and terminal serviceability index. The
testing criteria, input parameters, and the results generated by PaveXpress are summarized below
in Table 2.
Table 2: Flexible Pavement Designs based on PaveXpress
Design Period = 20 Years Asphalt (SN)
𝑃𝑖 = 4.5 90% Reliability 95% Reliability
𝑃𝑡 = 3 𝑆𝑜 = .45 & ∆PSI = 1.5 𝑆𝑜 = .45 & ∆PSI = 1.5
CBR 2.00
ESAL's
1 Million 4.50 4.75
5 Million 5.80 6.10
10 Million 6.30 6.55
20 Million 6.80 7.15
50 Million 7.65 8.05
CBR 5.00
ESAL's
1 Million 3.75 4.00
5 Million 4.70 4.95
10 Million 5.20 5.45
20 Million 5.70 6.05
50 Million 6.45 6.80
CBR 7.00
ESAL's
1 Million 3.45 3.65
5 Million 4.30 4.60
10 Million 4.85 5.10
20 Million 5.35 5.60
50 Million 6.05 6.40
CBR 11.00
ESAL's
1 Million 3.05 3.25
5 Million 4.00 4.10
10 Million 4.30 4.60
20 Million 4.85 5.10
50 Million 5.55 5.80
*𝑆𝑜 = Standard Deviation *∆PSI = Design Serviceability Loss *SN = Structural Number
*𝑃𝑖 = Initial Serviceability Index
*𝑃𝑡 = Terminal Serviceability Index

4 | P a g e
Concrete Matrix AASHTO 1993/1998 Concrete Evaluation
Palmer used the catalog of slab thicknesses shown in Tables 16 - 24 in the Supplemental
AASHTO Guide for Design of Pavement Structures, Part II – Rigid Pavement and Rigid
Pavement Joint Design (AASHTO 1998) for comparison with designs evolving from
PaveXpress. While determining the values to use from Tables 16 - 24, Palmer considered the
following input scenarios that were common in Kentucky: Temperature differential, base
modulus, CBR (and the corresponding k-value), overall standard deviation, joint spacing, and
poisson’s ratio. The results of these analyses are summarized in Table 3.

5 | P a g e
Table 3: Rigid Pavement Designs based on the Supplement to the AASHTO Guide for Design of Pavement Structures, Part II – Rigid Pavement and Rigid Pavement Joint Design (AASHTO 1998)
*𝑆𝑜 = Standard Deviation *∆PSI = Design Serviceability Loss
*𝑃𝑖 = Initial Serviceability Index
*J = Load Transfer Coefficient *TD = Temperature Differential *k = Effective Modulus of Subgrade Reaction
*Pt = Terminal Serviceability Index
*𝐸𝑏 = Base Modulus
*µ = Poisson’s ratio
*𝐸𝑐 = Elastic Modulus *S’c= Modulus of Rupture
AASHTO 1998 k = 250 pci TD = 9° S’c = 600 psi 𝐸𝑐 = 4,200,000 psi
𝑃𝑖=4.5 Slab Thickness 𝐸𝑏 = 25 ksi Slab Thickness 𝐸𝑏 = 500 ksi
𝑃𝑡=2.5 ∆PSI=2
Table 19 (90% Reliability)
Table 16 (95% Reliability)
Table 20 (90% Reliability)
Table 17 (95% Reliability)
µ =.2 CBR = 2.73 (k=250 pci) CBR = 2.73 (k=250 pci) CBR = 2.73 (k=250 pci) CBR = 2.73 (k=250 pci)
J = 3 𝑆𝑜 = 0.39 𝑆𝑜 = 0.39 𝑆𝑜 = 0.39 𝑆𝑜 = 0.39
Joint Spacing (inches)
144 192 240 144 192 240 144 192 240 144 192 240
ESAL's
1 Million
1.5 Million
7.40 7.70 8.20 6.50 7.10 7.80
2 Million
7.90 8.30 8.80 7.10 7.70 8.30
2.5 Million
8.40 8.80 9.20 7.50 8.10 8.70
3 Million
8.70 9.10 9.60 7.80 8.40 9.10
4 Million
9.30 9.70 10.20 8.40 9.00 9.60
5 Million
9.70 10.10 10.60 10.30 10.80 11.30 8.80 9.40 10.00 9.40 10.00 10.70
7.5 Million
10.50 10.90 11.40 9.60 10.20 10.80
10 Million
11.10 11.50 12.00 11.70 12.20 12.70 10.10 10.70 11.40 10.70 11.30 12.00
20 Million
13.00 13.50 14.10 12.10 12.60 13.30
30 Million
13.80 14.30 14.90 12.80 13.40 14.00
40 Million
14.40 14.90 13.40 14.00 14.60
50 Million
14.48 13.80 14.40 15.00
75 Million
14.60 15.10
100 Million

6 | P a g e
Concrete Matrix PaveXpress Concrete Evaluation
To obtain a feature-by-feature comparison, Palmer used input parameters for PaveXpress that
were the same as the inputs used for the AASHTO catalog of designs that Tables 16, 17, 19, and
20 references. While developing the pavement designs with PaveXpress, Palmer noted the
AASHTO 1998 (Tables 16 - 24) catalog applied to a paved AC shoulder whereas PaveXpress
requires a value to be entered for edge support. A 1.00 coefficient for edge support is used for a
free edge, asphalt shoulder, and a value of 0.94 is used for a tied concrete shoulder. Both
coefficients for edge support were evaluated using PaveXpress. However, Tables 16 - 24 in the
1998 AASHTO supplement were based only on asphalt shoulders.
As shown in Table 3, a Temperature Differential of 9 degrees was used for evaluation when
selecting the appropriate AASHTO values from Tables 16 - 24. PaveXpress does not allow users
to input specific Temperature Differentials but instead calculates the value based on the climate
of the city that is selected by the user. PaveXpress predicted a Temperature Differential value for
Lexington, KY, between 8.2 and 8.5 degrees, whereas Palmer used the catalog designs in Tables
16 - 20 on the basis of TD = 9 degrees. Palmer also used a concrete modulus of rupture of 600
psi for all analysis of PCC pavement.
The results and input parameters used for comparing rigid pavement designs, based on
PaveXpress, are summarized below in Table 4.

7 | P a g e
Table 4: Rigid Pavement Designs based on PaveXpress
*𝑆𝑜 = Standard Deviation
*∆PSI = Design Serviceability Loss
*𝑃𝑖 = Initial Serviceability Index
*J = Load Transfer Coefficient *E = Edge Support
*µ = Poisson’s ratio *k = Effective Modulus of Subgrade Reaction *Pt = Terminal Serviceability Index
*𝐸𝑏 = Base Modulus
*𝐸𝑐 = Elastic Modulus
*S’c= Modulus of Rupture
Note: The analysis used Tables 16, 17, 19, and 20 from the 1998 AASHTO Supplemental Guide
PaveXpress
𝑃𝑖=4.5 Slab Thickness 𝐸𝑏 = 25 ksi Slab Thickness 𝐸𝑏= 500 ksi
𝑃𝑡=2.5 ∆PSI=2
CBR = 2.73 (k=250 pci) CBR = 2.73 (k=250 pci)
µ =.2 𝑆𝑜 = .39 & E = 1.00 𝑆𝑜 = .39 & E = 0.94 𝑆𝑜 = .39 & E = 1.00 𝑆𝑜 = .39 & E = 0.94
J = 3 90% Reliability 95% Reliability 90% Reliability 95% Reliability 90% Reliability 95% Reliability 90% Reliability 95% Reliability
Joint Spacing (inches)
144 192 240 144 192 240 144 192 240 144 192 240 144 192 240 144 192 240 144 192 240 144 192 240
ESAL's
1 Million 7.4 7.7 8.1 7.9 8.2 8.6 6.9 7.2 7.5 7.4 7.7 8.1 6.7 7.2 7.8 7.3 7.8 8.4 6 6.4 7.1 6.7 7.2 7.8
1.5 Million
2 Million
2.5 Million 8.8 9.2 9.7 9.4 9.8 10.3 8.4 8.7 9.1 8.9 9.3 9.7 8.4 8.9 9.5 9 9.5 10.1 7.9 8.4 9 8.5 9 9.5 3 Million
4 Million
5 Million 10 10.5 11 10.6 11.1 11.6 9.5 9.9 10.4 10.1 10.5 11.1 9.6 10.1 10.7 10.2 10.7 11.3 9.1 9.6 10.2 9.7 10.2 10.8
7.5 Million
10 Million 11.3 11.8 12.4 12 12.5 13.1 10.7 11.2 11.8 11.4 11.9 12.5 10.8 11.4 12 11.4 12 12.6 10.3 10.8 11.5 10.9 11.4 12.1
20 Million 12.7 13.3 13.9 13.4 14 14.7 12.1 12.6 13.3 12.8 13.4 14 12.1 12.7 13.3 12.7 13.3 13.9 11.5 12.1 12.7 12.1 12.7 13.4
30 Million 13.6 14.2 14.9 14.4 15 15.1 13 13.5 14.2 13.7 14.3 15 12.9 13.4 14.1 13.5 14.1 14.7 12.3 12.9 13.5 12.9 13.5 14.1
40 Million 14.3 14.9 15.1 15.1 15.1 15.1 13.6 14.2 14.9 14.4 15 15.1 13.4 14 14.7 14.1 14.7 15.1 12.8 13.4 14.1 13.5 14.1 14.7 50 Million 14.8 15.1 15.1 15.1 15.1 15.1 14.1 14.7 15.1 14.9 15.1 15.1 13.8 14.4 15.1 14.5 15.1 15.1 13.3 13.9 14.5 13.9 14.5 15.1
75 Million 15.1 15.1 15.1 15.1 15.1 15.1 15.1 15.1 15.1 15.1 15.1 15.1 14.7 15.1 15.1 15.1 15.1 15.1 14.1 14.7 15.1 14.7 15.1 15.1
100 Million 15.1 15.1 15.1 15.1 15.1 15.1 15.1 15.1 15.1 15.1 15.1 15.1 15.1 15.1 15.1 15.1 15.1 15.1 14.6 15.1 15.1 15.1 15.1 15.1

8 | P a g e
Results Asphalt Results
As shown in Figures 1 and 2, the PaveXpress accurately represents AASHTO’s 1993 method for
determining the required structural number. The graphs show a comparable trend for both 90 and
95 percent reliability, as the CBR and number of ESALs vary. The variations in estimated
structure numbers shown are likely attributed to rounding and precision of computations.
Figure 1: Asphalt Designs at 90% Reliability

9 | P a g e
Figure 2: Asphalt Designs at 95% Reliability

10 | P a g e
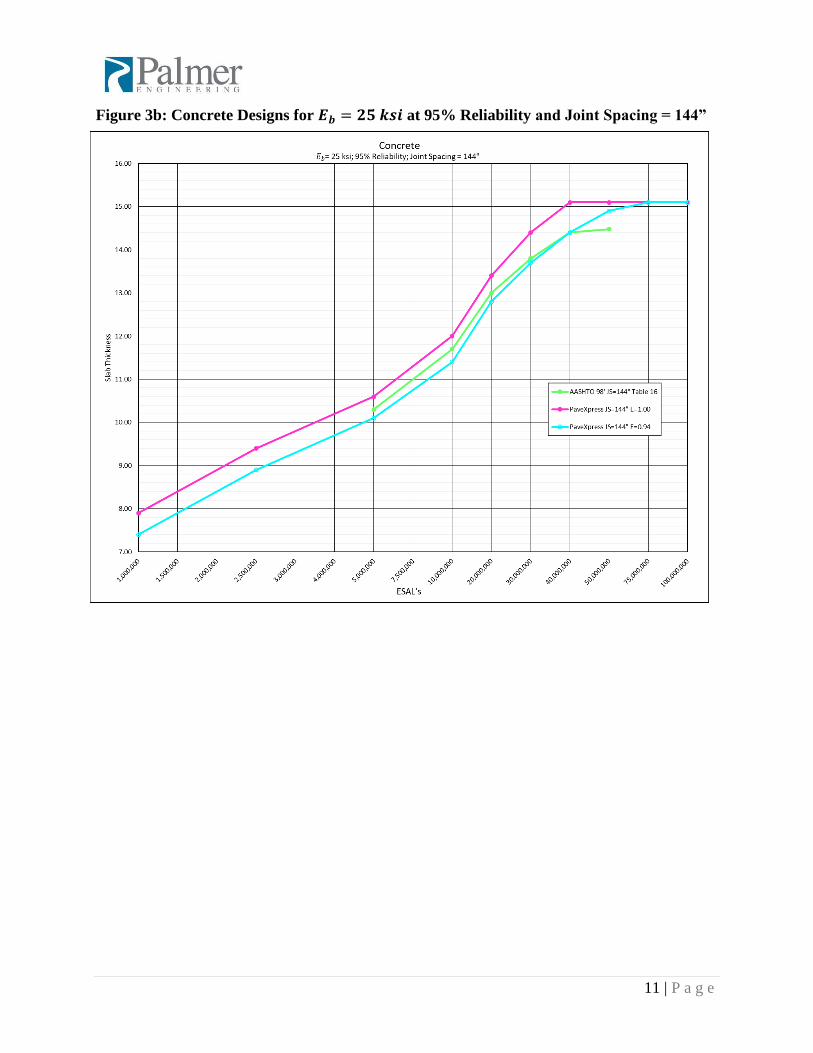
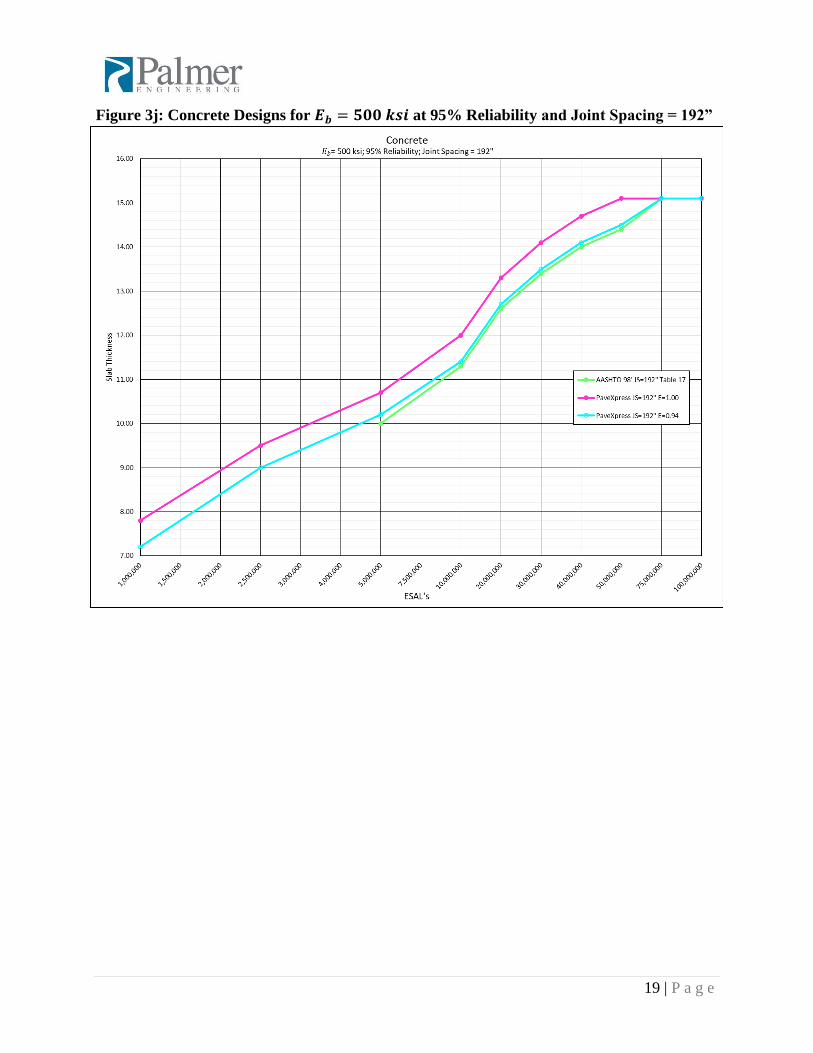
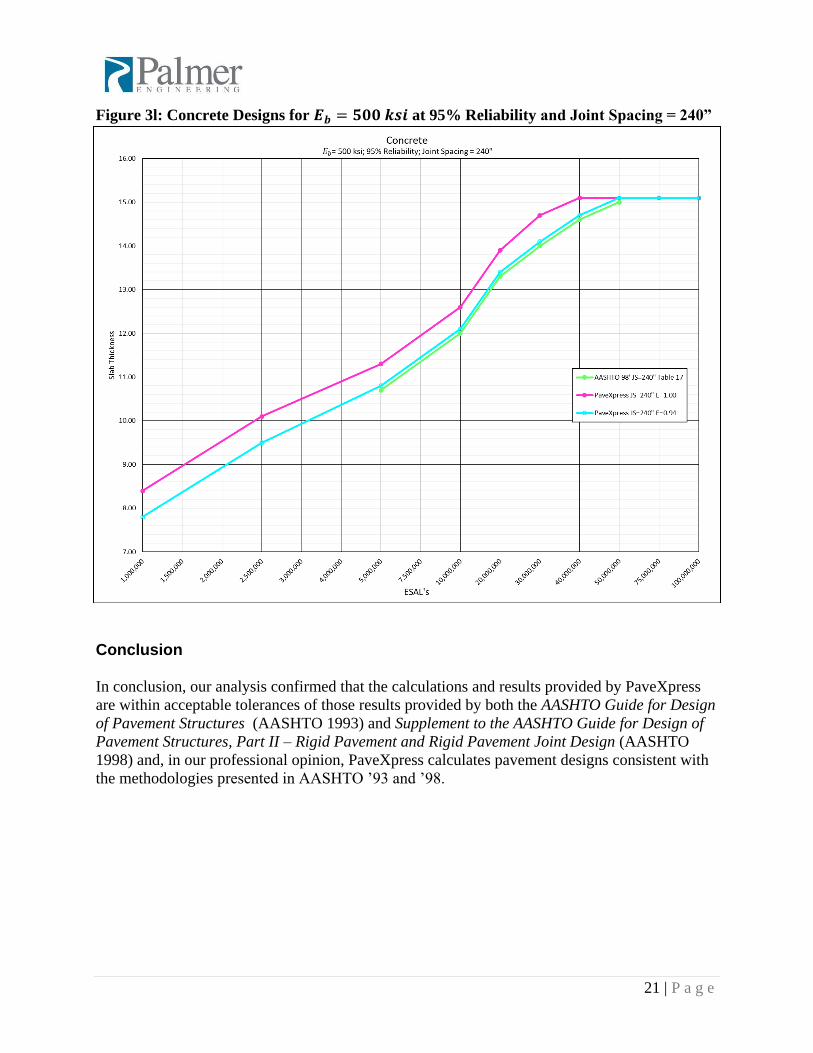
Concrete Results As shown in Figures 3a - 3l, PaveXpress adequately represents slab thickness determined from
the AASHTO 1998 catalog of pavement designs. The graphs have been categorized by base
modulus, percent reliability, and joint spacing. The PaveXpress pavement designs follow
AASHTO 1998 closely, with typically only a quarter of an inch to a half inch separating the two
results. Therefore, the pavement designs developed using PaveXpress are still within the range of
constructability for concrete pavements.
Figure 3a: Concrete Designs for 𝑬𝒃 = 𝟐𝟓 𝒌𝒔𝒊 at 90% Reliability and Joint Spacing = 144”
11 | P a g e
Figure 3b: Concrete Designs for 𝑬𝒃 = 𝟐𝟓 𝒌𝒔𝒊 at 95% Reliability and Joint Spacing = 144”

12 | P a g e
Figure 3c: Concrete Designs for 𝑬𝒃 = 𝟐𝟓 𝒌𝒔𝒊 at 90% Reliability and Joint Spacing = 192”

13 | P a g e
Figure 3d: Concrete Designs for 𝑬𝒃 = 𝟐𝟓 𝒌𝒔𝒊 at 95% Reliability and Joint Spacing = 192”

14 | P a g e
Figure 3e: Concrete Designs for 𝑬𝒃 = 𝟐𝟓 𝒌𝒔𝒊 at 90% Reliability and Joint Spacing = 240”

15 | P a g e
Figure 3f: Concrete Designs for 𝑬𝒃 = 𝟐𝟓 𝒌𝒔𝒊 at 95% Reliability and Joint Spacing = 240”

16 | P a g e
Figure 3g: Concrete Designs for 𝑬𝒃 = 𝟓𝟎𝟎 𝒌𝒔𝒊 at 90% Reliability and Joint Spacing = 144”

17 | P a g e
Figure 3h: Concrete Designs for 𝑬𝒃 = 𝟓𝟎𝟎 𝒌𝒔𝒊 at 95% Reliability and Joint Spacing = 144”

18 | P a g e
Figure 3i: Concrete Designs for 𝑬𝒃 = 𝟓𝟎𝟎 𝒌𝒔𝒊 at 90% Reliability and Joint Spacing = 192”
19 | P a g e
Figure 3j: Concrete Designs for 𝑬𝒃 = 𝟓𝟎𝟎 𝒌𝒔𝒊 at 95% Reliability and Joint Spacing = 192”

20 | P a g e
Figure 3k: Concrete Designs for 𝑬𝒃 = 𝟓𝟎𝟎 𝒌𝒔𝒊 at 90% Reliability and Joint Spacing = 240”
21 | P a g e
Figure 3l: Concrete Designs for 𝑬𝒃 = 𝟓𝟎𝟎 𝒌𝒔𝒊 at 95% Reliability and Joint Spacing = 240”
Conclusion
In conclusion, our analysis confirmed that the calculations and results provided by PaveXpress
are within acceptable tolerances of those results provided by both the AASHTO Guide for Design
of Pavement Structures (AASHTO 1993) and Supplement to the AASHTO Guide for Design of
Pavement Structures, Part II – Rigid Pavement and Rigid Pavement Joint Design (AASHTO
1998) and, in our professional opinion, PaveXpress calculates pavement designs consistent with
the methodologies presented in AASHTO ’93 and ’98.