august 2016 global dairy update - nzx - new … · 1 global dairy update august 2016 key dates •...
TRANSCRIPT
1
GLOBAL DAIRY UPDATE
AUGUST 2016
KEY DATES
• Living Water helps Fonterra farmer create an on‑farm sanctuary
• Indonesian farmers learn the Kiwi way
• European milk production growth is at its lowest level since early 2015, increasing only 1% compared to May 2015.
• Global dairy exports remain strong, excluding the United States, which continues to see increased domestic demand and less competitive export prices.
• China continues its strong recovery from last year, Latin America continues to see solid import growth, while Asia, Middle East and Africa imports have softened.
• In July, Fonterra New Zealand milk collection reached 16 million kgMS and Fonterra Australia milk collection reached 6 million kgMS.
• Fonterra confirms further financial year 2016 dividend payment.
• Financial year 2017 earnings per share guidance
• Anchor™ Food Professionals develops quick smoothie option
• Fonterra Brands New Zealand launches Fresh ‘n Fruity™ pouches
22 September 2016 Annual Results Announced
Early December 2016 Fonterra Shareholders’ Fund Annual Meeting
Early December 2016 Fonterra Co‑operative Group Annual Meeting
1 December 2016 Shareholding Compliance Date for the 2016/17 Season

2
OUR MARKETS
GLOBAL PRODUCTION
EUROPEAN MILK PRODUCTION GROWTH IS AT ITS LOWEST LEVEL SINCE EARLY 2015, INCREASING ONLY 1% COMPARED TO MAY 2015
Australia production in June decreased 6% compared to the same month last year.
Late season milk production has been heavily impacted by the reduction in Australian milk prices to align with global dairy prices.
Production for the 12 months to June is down 2% compared to the same period the previous year.
Total New Zealand milk production for June was in line with June last year.
In New Zealand, volumes are low due to the seasonality of supply at this time of year.
For the 12 months to June, milk production is down 2% compared to the same period the previous year.
Production change for the 12 months to June 2016
Production change for the 12 months to June 2016
AUSTRALIANEW ZEALAND
2 2% %
US production in June increased 2% compared to the same month last year.
Milk production for the 12 months to June has increased 1% compared to the same period the previous year.
The United States Department of Agriculture has reviewed its forecast milk production for 2016 to be 1.9% up on 2015.²
USA
EU production in May increased 1% compared to the same month last year. This is the third consecutive month where the rate of production growth has decreased.
Production for the 12 months to May is up 4% compared to the same period the previous year.
This increase continues to be driven by Ireland up 15%, the Netherlands up 13%, Poland up 5% and Germany up 4%.
The EU Commission has updated its milk deliveries forecast to an increase of 1.5% in 2016¹.
Production change for the 12 months to May 2016
Production change for the 12 months to June 2016
EUROPEAN UNION
1%
To view a chart that illustrates year‑on‑year changes in production –
4%
2 World Agricultural Supply and Demand Estimates Report – June 2016.
1 EU Commission Short-Term Outlook – Summer 2016.

3
%
OUR MARKETS
GLOBAL EXPORTS
GLOBAL DAIRY EXPORTS REMAIN STRONG, EXCLUDING THE UNITED STATES, WHICH CONTINUES TO SEE INCREASED DOMESTIC DEMAND AND LESS COMPETITIVE EXPORT PRICES
Total New Zealand dairy exports in June increased 33%, or 65,000 MT, compared to the same month last year. Increases were seen across all of the major dairy categories, in particular SMP up 69% and WMP up 16%.
Exports for the 12 months to June are up 7%, or 207,000 MT, compared to the previous year. This increase is largely driven by fluid and fresh dairy up 37% and infant formula up 69%. In addition, AMF was up 18%, cheese up 13%, and SMP up 3%.
EU dairy exports increased 12% in April, or 48,000 MT, compared to the same month the previous year. Increases were seen across all of the major dairy categories excluding SMP which decreased 27%.
Exports are up 12%, or 530,000 MT, for the 12 months to April compared to the same period last year. The largest movers were fluid and fresh dairy up 27%, or 306,000 MT, whey powder up 13%, or 53,000 MT, and cheese up 9%, or 63,000 MT.
Export change for the 12 months to May 2016
NEW ZEALAND EUROPEAN UNION
8
US dairy exports in May decreased 10%, or 19,000 MT, compared to the same month the previous year. Significant decreases were seen for SMP down 28%, whey powder down 22% and cheese down 19%. Partially offsetting this was lactose up 20%.
Exports for the 12 months to May are down 8%, or 176,000 MT, compared to the same period last year. This is driven by whey powder down 22%, cheese down 19% and SMP down 3%.
Export change for the 12 months to May 2016
USA
8
Australia dairy exports in May increased 35%, or 19,000 MT, compared to the same month last year. This significant increase was largely a result of whey powder up 200%, SMP up 46%, fluid and fresh dairy up 37% and WMP up 12%.
Exports for the 12 months to May are up 8%, or 58,000 MT, compared to the same period the previous year. This increase was largely due to fluid and fresh dairy up 17%, cheese up 9% and SMP up 8%. The largest mover on a percentage basis for the 12 months to May is infant formula which has increased over 300%, although off a low base.
AUSTRALIA
%
Export change for the 12 months to June 2016
7Export change for the 12 months to April 2016
12
To view a chart that illustrates year‑on‑year changes in exports –
%%

4
OUR MARKETS
GLOBAL IMPORTS
CHINA CONTINUES ITS STRONG RECOVERY FROM LAST YEAR, LATIN AMERICA CONTINUES TO SEE SOLID IMPORT GROWTH, WHILE ASIA, MIDDLE EAST AND AFRICA IMPORTS HAVE SOFTENED
Asia (excluding China)² dairy import volumes decreased 3%, or 9,000 MT, in April compared to the same month the previous year. This was due to whey powder down 16% and both WMP and SMP down 12%. This was partially offset by fluid and fresh dairy up 19%.
Imports for the 12 months to April are up 3%, or 111,000 MT, compared to the same period the previous year. This is a result of cheese and fluid and fresh dairy both up 7% and SMP up 2%.
Latin America¹ dairy import volumes increased 12%, or 17,000 MT, in April compared to the same month the previous year, with the most significant increase from WMP up 40%, or 9,000 MT, and SMP up 38%, or 10,000 MT.
Imports for the 12 months to April remain strong, up 10%, or 161,000 MT compared to the same period last year. Increases were seen across all major dairy categories, in particular milk powders, with WMP up 27% and SMP up 19%. In addition, cheese increased 13% and infant formula 8%.
ASIALATIN AMERICA
310
China dairy imports increased 25%, or 38,000 MT, in June compared to the same month last year. Significant increases were seen across most of the major dairy categories, in particular WMP up 120%, fluid and fresh dairy up 45% and infant formula up 18%.
Imports for the 12 months to June are up 26%, or 460,000 MT, compared to the same period last year with fluid and fresh dairy up 69%, infant formula up 42%, whey powder up 17% and WMP up 6%. This growth is partially offset by SMP down 2%.
Import change for 12 months to June 2016
CHINA
26
Middle East and Africa³ dairy imports decreased 11%, or 32,000 MT, in April compared to the same month the previous year. Decreases were seen across most of the major dairy categories including SMP down 20%, cheese down 16% and WMP down 14%.
For the 12 months to April, imports are down 5%, or 178,000 MT, compared to the same period last year. Over this period SMP was down 17%, butter down 13% and WMP down 8%.
MIDDLE EAST & AFRICA
3 Includes estimates for Algeria (December-April) and Egypt in April.
1 Excludes Venezuela and includes estimates for Nicaragua (January-April).
2 Includes estimate for Philippines in April.
%% %
Import change for 12 months to April 2016
Import change for 12 months to April 2016
Import change for 12 months to April 2016
5%
To view a chart that illustrates year‑on‑year changes in imports –

5
OUR MARKETS
FONTERRA MILK COLLECTION 2016/17 SEASON
NORTH ISLAND
Decrease for the season to date from 1 July compared to last season
22Decrease for the season to date from 1 June compared to last season
AUSTRALIA
8SOUTH ISLAND
%
To view a table that shows our detailed milk collection in New Zealand and Australia compared to the previous season –
Decrease for the season to date from 1 June compared to last season
Decrease for the season to date from 1 June compared to last season
11 %% %
NEW ZEALAND MILK COLLECTION
VO
LUM
E (M
LIT
RES/
DAY
)
JUN JUL AUG SEP OCT NOV DEC JAN FEB MAR APR MAY
2016/17 2015/16 2014/15
0
20
40
60
80
100
Fonterra’s milk collection across Australia in July, the first month of the 2016/17 season, reached 6 million kgMS, 2 million kgMS behind July last season.Following the milk price reduction in May, milk collection dropped due to many farmers choosing to dry off early as well as some competitor losses.
New season milk collection is expected to recover as those farmers that dried off early start calving, together with new farmer suppliers moving to Fonterra and favourable spring pasture growth conditions
North Island milk collection in July reached 15 million kgMS, 1% behind July last season.
Milk collection is higher in the North Island at this time of year largely due to earlier calving patterns.
South Island milk collection in July reached 1 million kgMS, 8% above July last season.
The South Island continues to be at a season low with most farmers still dried off as they prepare for calving in the coming months.
NEW ZEALAND
Fonterra’s milk collection across New Zealand reached 16 million kgMS in July, 1% lower than July last season.For the two months to 31 July milk collection reached 26 million kgMS, 1% behind the same period last season.
Milk collection will continue to build over the coming months and peak collection is forecast around mid‑October.
6
OUR MARKETS
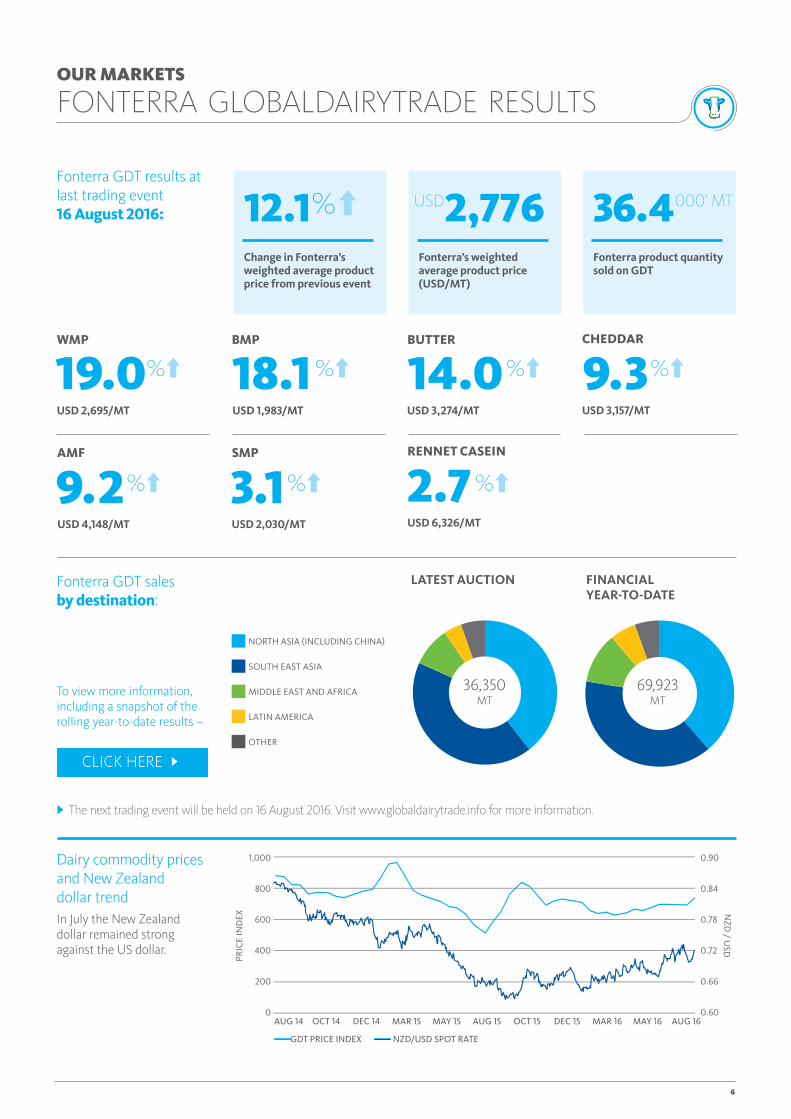
FONTERRA GLOBALDAIRYTRADE RESULTS
SMP
3.1
14.0BUTTER
19.0%
%
WMP BMP
18.1 % % %
%%
Fonterra GDT sales by destination:
Dairy commodity prices and New Zealand dollar trendIn July the New Zealand dollar remained strong against the US dollar.
Fonterra GDT results at last trading event 16 August 2016:
The next trading event will be held on 16 August 2016. Visit www.globaldairytrade.info for more information.
To view more information, including a snapshot of the rolling year‑to‑date results –
LATEST AUCTION FINANCIAL YEAR-TO-DATE
USD 2,030/MT
USD 1,983/MTUSD 2,695/MT USD 3,274/MT
12.1Change in Fonterra’s weighted average product price from previous event
%
Fonterra’s weighted average product price (USD/MT)
Fonterra product quantity sold on GDT
2,776USD 36.4
CHEDDAR
9.3
2.79.2AMF RENNET CASEIN
USD 3,157/MT
USD 6,326/MTUSD 4,148/MT
NORTH ASIA (INCLUDING CHINA)
SOUTH EAST ASIA
MIDDLE EAST AND AFRICA
LATIN AMERICA
OTHER
36,350 MT
69,923 MT
GDT PRICE INDEX NZD/USD SPOT RATE
AUG 14 MAY 15 OCT 15 DEC 15 MAR 16 MAY 16 AUG 16OCT 14 DEC 14 MAR 15 AUG 150
200
400
600
800
1,000
0.60
0.66
0.72
0.78
0.84
0.90
PRIC
E IN
DEX
NZD
/ USD
000’ MT

7
OUR PERFORMANCE
Fonterra confirms further financial year 2016 dividend paymentOn 18 August 2016 Fonterra confirmed it will pay the final 10 cents per share of its previously announced 2015/16 forecast dividend of 40 cents per share, as part of its goal to deliver as much cash as quickly as possible to shareholders.
The record date is 1 September and the payment date is 9 September 2016.
Financial year 2017 earnings per share guidanceWe recently announced our forecast earnings per share range for the 2017 financial year at 50 to 60 cents.
The forecast earnings per share range reflects performance improvements across the business.
The returns from the ingredients, consumer and foodservice businesses
continue to grow in line with our strategy to convert more milk into higher returning products, particularly in important markets such as China, Malaysia, Indonesia, Sri Lanka, Oceania and Latin America.
We are seeing the benefits of our investments in manufacturing over recent years. We now have more flexibility to make the right products at the least cost, delivering better returns.
Constantly improving the performance of our business is a priority and puts us in a strong position to create more value. We are generating significant improvements and cash benefits through our business transformation that contribute to both our Farmgate Milk Price and our earnings.
Fonterra Brands New Zealand launches Fresh ‘n Fruity™ pouches
Fresh ‘n Fruity™ has listened to consumer demand and trends, launching new Fresh ‘n Fruity™ pouches.
This acknowledges the growing demand for convenient food on the go as people’s lifestyles become increasingly active. Children want snacks for school lunches and after school activities that they can eat quickly with limited mess.
Yoghurt pottles aren’t always ideal as a quick snack while
you’re out and about and the new Fresh ‘n Fruity™ pouch will make it even easier for our consumers to enjoy yoghurt while they’re on the go.
Anchor™ Uno launched its pouch last year, which has been hugely successful and contributed to over 60% of growth within the pouch segment. The Fresh ‘n Fruity™ pouch is expected to follow this growth trend, as it taps into a different market.
Fresh ‘n Fruity™ accounts for over 50 per cent of mainstream yoghurt volume sold in New Zealand and the pouch comes in three flavours; vanilla bean, dreamy lemon and boysenberry & cream.
Anchor™ Food Professionals develops quick smoothie optionSmoothies are commonly renowned as being difficult to make for foodservice customers. Fonterra Brands New Zealand’s Anchor™ Food Professionals have listened to customers across a range of smoothie bars, cafés, restaurants and bakeries and understand that making smoothies from scratch can be problematic. Despite these challenges, smoothies are an increasingly popular choice amongst consumers.
Anchor™ Food Professionals have developed a quick, great tasting, cost effective smoothie bar that removes the hassle for any foodservice provider.
A traditional smoothie can take three or four minutes to create. Anchor™ Food Professionals’ smoothie option takes less than a minute to make, freeing up staff and enabling customers to be served more quickly.
Launched in July, the smoothie bar has had a great response from a mix of customers including cafés and restaurants.
INNOVATION HELPS MEET CUSTOMER DEMAND

8
OUR CO-OP
Living Water helps Fonterra farmer create an on‑farm sanctuary
Fonterra’s Living Water partnership with the Department of Conservation is helping create a sanctuary for an endangered native bird.
The Australasian Bittern, along with several other wildlife species have returned to Northland farmer Ian Lupton’s property after he reduced the amount of nitrogen fertiliser and chemical sprays he used.
Mr Lupton said after seeing the return of the bittern he decided to create the sanctuary to demonstrate that a successful dairy farm and native wildlife can go hand in hand.
Living Water is helping fund the project with the first step being the purchase of monitoring equipment to establish how many of the endangered native birds are around.
The partnership is also buying native plants and grasses for the banks of the canal and drainage ditches on the farm. This riparian planting will create more bittern habitat, which will encourage more breeding by the birds.
Indonesian farmers learn the Kiwi way
A group of Indonesian dairy farmers has been in New Zealand for the past month as part of Fonterra’s Dairy Development programme.
Dairy development teaches farmers in developing countries animal care best practice, and other key skills to improve on‑farm efficiencies that produce higher volumes of better quality milk.
Joining the farmers in the programme are three Indonesian Government dairy extension officers and two Fonterra Sri Lankan supplier relationship officers.
Our Dairy Development programme is crucial to ensure the Co‑operative continues building support in off‑shore markets.
The Co‑operative’s dairy development work supports the growth of sustainable dairy farming in key markets where Fonterra operates such as Indonesia and Sri Lanka – sharing its expertise and working together with local farmers, governments and industry bodies.
As a global business, for Fonterra to continue growing in our most important markets, we need to have strong local partnerships. Supporting the sustainability of local dairy industries within these markets is a natural way to achieve this.
This programme is now in its fourth year and we’re
already seeing fantastic results. Last year, close to 90 per cent of the farmers we worked with reported improved milk quality or were producing more milk as a result of new milk hygiene, animal care and farm management practices.
For more information on the Living Water partnership –

9
SUPPLEMENTARY INFORMATION
Global Dairy Market The charts on the right illustrate the year‑on‑year changes in production, exports and imports for a range of countries that are important players in global dairy trade.
The absolute size of the bars represents the change in production, exports or imports, relative to the same period the previous year.
PRODUCTION
AUSTRALIAUNITED STATESNEW ZEALAND EU27
MAY 16APR 16MAR 16DEC 15NOV 15OCT 15SEP 15AUG 15JUL 15 JUN 16JAN 16 FEB 16
LIQ
UID
MIL
K (M
LIT
RES)
-400
0
400
800
1,200
1,600
NOTE: Data for EU to May; New Zealand, US and Australia to June.
NOTE: Data for EU to April; US and Australia to May and New Zealand to June.
NOTE: Data for Asia, Middle East and Africa and Latin America to April, China to June.
SOURCE: Government milk production statistics/GTIS trade data/Fonterra analysis.
EXPORTS
AUSTRALIAUNITED STATESNEW ZEALAND EU27
MAY 16APR 16MAR 16JAN 16DEC 15NOV 15OCT 15SEP 15AUG 15JUL 15 JUN 16FEB 16
MT
(00
0’s)
-150
-100
-50
0
50
100
150
IMPORTS
MIDDLE EAST & AFRICA LATIN AMERICAASIA CHINA
APR 16MAR 16DEC 15NOV 15OCT 15SEP 15AUG 15JUL 15 JUN 16JAN 16 FEB 16 MAY 16
MT
(00
0’s)
-100
-50
0
50
150
100

10
Fonterra milk productionThe table on the right shows Fonterra milk solids collected in New Zealand and Australia compared to the previous season.
SUPPLEMENTARY INFORMATION
MILK COLLECTION (MILLION KGMS)
JULY 2016
JULY 2015
MONTHLY CHANGE
SEASON-TO-DATE
2016/17
SEASON-TO-DATE
2015/16
SEASON-TO-DATE CHANGE
Total Fonterra New Zealand
16.3 16.6 (1.4%) 26.3 26.6 (1.4%)
North Island 15.0 15.1 (0.8%) 22.6 22.7 (0.3%)
South Island 1.4 1.5 (7.7%) 3.7 3.9 (7.3%)
Fonterra Australia 6.1 7.8 (22%) 6.1 7.8 (22%)
Fonterra GDT resultsThis table provides more information on the latest results, including a snapshot of the year‑to‑date results.
Fonterra GDT ResultsThis chart shows Fonterra GDT prices and volumes over the past 12 months.
LAST TRADING EVENT (16 AUGUST 2016)
YEAR-TO-DATE (FROM 1 AUGUST 2016)
Quantity Sold on GDT (Winning MT)
36,350 69,923
Change in Quantity Sold on GDT over same period last year
0.9% (15.0%)
Weighted Average Product Price (USD/MT)
2,776 2,632
Change in Weighted Average Product Price over same period last year
39.9% 45.6%
Change in Weighted Average Product Price from previous event
12.1% –
WEIGHTED AVERAGE PRICE QUANTITY SOLD
JUL 16JUN 16DEC 15 FEB 16 MAR 16 APR 16 MAY 16SEP 15 AUG 16OCT 15 NOV 15 JAN 160
10,000
20,000
30,000
40,000
1,500
2,000
2,500
3,000
3,500
WEI
GH
TED
AV
ERA
GE
PRIC
E (U
SD/M
T)
QU
AN
TITY SOLD
( MT)

11
AMFAnhydrous Milk Fat.
BMPButter Milk Powder.
DIRADairy Industry Restructuring Act 2001 (New Zealand).
Farmgate Milk PriceThe price for milk supplied in New Zealand to Fonterra by farmer shareholders.
Fluid and Fresh DairyThe Fonterra grouping of fluid milk products (skim milk, whole milk and cream – pasteurised or UHT processed), concentrated milk products (evaporated milk and sweetened condensed milk) and yoghurt.
Reference ProductsThe dairy products used in the calculation of the Farmgate Milk Price, which are currently WMP, SMP, BMP, butter and AMF.
SeasonNew Zealand: A period of 12 months to 31 May in each year.
Australia: A period of 12 months to 30 June in each year.
SMPSkim Milk Powder.
WMPWhole Milk Powder.
GLOSSARY